Article

Hydrogen and Ammonia Co-Adsorption on M(1 1 1) and Pd3M(1 1 1) (M = Pd, Ru, Ag, Au, Cu) Surfaces

by
Didrik R. Småbråten
1,*,
Marie D. Strømsheim
2 and
Thijs A. Peters
1
1
Department of Sustainable Energy Technology, SINTEF Industry, 0314 Oslo, Norway
2
Hydrogen Mem-Tech AS, 7038 Trondheim, Norway
*
Author to whom correspondence should be addressed.
Membranes 2025, 15(5), 135; https://doi.org/10.3390/membranes15050135
Submission received: 20 March 2025 / Revised: 8 April 2025 / Accepted: 23 April 2025 / Published: 1 May 2025

Abstract

:
Ammonia (NH3) represents a promising zero-emission fuel in hydrogen fuel cells. Membrane reactors for NH3 decomposition based on Pd-alloys have demonstrated high NH3 conversion, high hydrogen diffusivity, and high hydrogen selectivity, which allows for the production of high-purity H2 without the need for gas separation or purification. However, it is observed that Pd-alloy membranes are to a various degree prone to H2 flux inhibition in the presence of NH3. Hence, finding proper means to tailor the surface adsorption properties through, e.g., alloying is imperative to further improve the technology. In the current work, hydrogen and ammonia co-adsorption phenomena on M(1 1 1) and Pd3M(1 1 1) (M = Pd, Ru, Ag, Au, Cu) surfaces are studied using density functional theory calculations. It is shown that the surface adsorption properties are strongly dependent on the surface composition, which can be linked to the corresponding electronic structure at the membrane surface.

1. Introduction

Due to its high volumetric energy density, low cost and ease of liquefaction, storage, and transportation [1], ammonia (NH3) represents a highly promising zero-emission fuel in the maritime and heavy transport sector. NH3 can be converted directly to electricity in, e.g., combustion engines [2,3,4,5,6,7,8,9] and gas turbines [10], or used as fuel in fuel cells like solid oxide fuel cells (SOFCs), alkaline fuel cells (AFCs), or indirectly, i.e., after decomposition and purification, in polymer electrolyte membrane fuel cells (PEMFCs) [11,12]. Fuel cell technologies show several advantages over combustion engines and gas turbines, such as higher efficiency that is independent of plant scale, and that they are modular [6]. SOFCs show the overall highest efficiency, can operate in external or internal cracking modes, and do not require comprehensive fuel purification [6,13].
Pd-based membrane-enhanced reactors have been considered a promising system to efficiently recover the H2 stored in NH3 that would inherently produce high-purity H2 through the membranes, avoiding the need for an additional hydrogen separation unit [14,15,16,17,18,19,20]. Furthermore, full ammonia conversion could be obtained, minimising the need for the downstream cleaning of unconverted ammonia [15,17,18,21,22,23]. However, reports show that NH3 present in the gas feed limits membrane performance, even for concentrations of NH3 in the gas feed as low as 10 to 500 ppm [19,20]. To elucidate this, Peters et al. [20] carried out density functional theory (DFT) calculations to study the competitive adsorption of H and NH3 on the surface of the employed Pd-Ag membranes. Their computational results concluded that H2 flux inhibition in the presence of NH3 could not be explained by a lowering of the hydrogen surface coverage due to the competitive adsorption of NH3-related species. Building on the study by Peters et al. [20], and previous knowledge on the competitive adsorption of H and NH3 [20], the competitive adsorption of H and S [24], and the co-adsorption of H and CO [25,26] on Pd(1 1 1) and Pd3Ag(1 1 1), we further elaborated on the co-adsorption of H and NH3 on Pd(1 1 1) and Pd3Ag(1 1 1) surfaces in our recent work [27]. Here, we found that both hydrogen surface coverage and dissociation energetics were inhibited in the presence of NH3 on the surface, and the possible segregation of Ag towards the surface in the presence of NH3 was suggested, which could explain the observed hydrogen flux inhibition in the presence of NH3.
Our previous work [27] established a methodology to study adsorption thermodynamics, adsorbate–adsorbate interactions during co-adsorption, adsorption-induced surface segregation effects, and hydrogen dissociation energetics for hydrogen and ammonia-related species using DFT. In the following work, the methodology is applied to other experimentally relevant M(1 1 1) and Pd3M(1 1 1) (M = Pd, Ru, Ag, Au, Cu) surfaces.

2. Methods

2.1. DFT Calculations

DFT calculations were made using the projector augmented wave (PAW) method as implemented in VASP [28,29,30]. Pd (4p6, 4d9, 5s1), Ru (4p6, 4d7, 5s1), Ag (4p6, 4d10, 5s1), Au (5d10, 6s1), Cu (3p6, 3d10, 4s1), H (1s1), and N (2s2, 2p3) were treated as valence electrons, using the GGA-PBE functional [31]. The plane-wave cutoff energy was set to 500 eV, with an electronic convergence of 10−6 eV. Geometry optimization was performed until the residual forces on all atoms were within 0.02 eV Å−1, with the two bottom layers fixed to bulk positions. When calculating the vibrational frequencies the adsorbates were further relaxed with a force criterion of 10−3 eV Å−1. Vibrational properties were determined by the finite displacement method using four displacements (±0.015 Å and ±0.30 Å) along each of the Cartesian directions. The minimum energy paths (MEP) for hydrogen dissociation were determined by the climbing image nudged elastic band (cNEB) method [32,33]. 11 intermediate images were used, with a force criterion of 0.05 eV Å−1.
The (1 1 1) surfaces were modelled by slabs with a thickness of 7 atomic layers and a 25 Å vacuum layer. Dipole corrections were included. The surface coverages, θ , were defined as the number of adsorbed species per surface metal atom, i.e., one adsorbed species per surface metal atom corresponds to full surface coverage of θ = 1. Adsorption was considered in p(2 × 2) supercells containing 4 metal atoms per layer. A Γ-centred 6 × 6 × 1 k-point grid was used for the p(2 × 2) slabs. Adsorption induced surface segregation effects were determined from the relative energies for adsorption on model structures with varying number of Pd and M atoms within the four topmost layers. In the following, the seven structures described in Refs. [26,27] were investigated. The alloys were modelled assuming a nominal stoichiometry of Pd3M.

2.2. Thermodynamic Modelling

The adsorption thermodynamics at finite temperatures T were determined by the Gibbs adsorption energies of the equilibria in Equations (6)–(10) according to
Δ G a d s = Δ H a d s T Δ S a d s
Here, Δ H a d s is the adsorption enthalpy and Δ S a d s the adsorption entropy. The adsorption enthalpies were calculated by
Δ H a d s = Δ E a d s D F T E g a s D F T + H g a s r e f + Δ Z P E
where Δ E a d s D F T is the DFT-calculated total energy differences for the slabs with and without adsorbed species, E g a s D F T is the DFT-calculated total energy of gaseous H2 or NH3, and H g a s r e f denotes the reference states for gaseous species at finite temperatures taken from thermochemical data [34]. Zero-point energy (ZPE) contributions were calculated by the vibrational frequencies of the adsorbed species, ν i , according to
Z P E = i h ν i 2
The adsorption entropy of NH3 was obtained from the empirical relations by Campbell and Sellers [35]. For the other species, the adsorption entropies were calculated as
Δ S a d s T = S a d s v i b T S g a s r e f ( T )
where S a d s v i b is the vibrational entropy of the adsorbed species calculated from their vibrational frequencies ν i according to
S a d s v i b = k i β i exp β i 1 ln 1 exp β i , β i = h ν i / k B T ,
and S g a s r e f is the entropy of the gas molecules taken from thermochemical data [34].
The adsorption thermodynamics for the hydrogen and NH3-related species were evaluated by the following equilibria [20,27]
1 2 H 2 g + H
N H 3 g + N + 3 2 H 2 g
N H 3 g + N H + H 2 ( g )
N H 3 g + N H 2 + 1 2 H 2 ( g )
N H 3 g +     N H 3
where ∗ denotes a surface site or an adsorbed species on the surface. The equilibrium surface coverages θ i were calculated by simultaneously solving the corresponding equilibrium constants
K 1 = exp Δ G 1 a d s k T = θ H θ v 1 p H 2 1 / 2
K 2 = exp Δ G 2 a d s k T = θ N θ v 1 p H 2 3 / 2 p N H 3 1
K 3 = exp Δ G 3 a d s k T = θ N H θ v 1 p H 2 p N H 3 1
K 4 = exp Δ G 4 a d s k T = θ N H 2 θ v 1 p H 2 1 / 2 p N H 3 1
K 5 = exp Δ G 5 a d s k T = θ N θ v 1 p N H 3 1
assuming that the total surface coverage is conserved according to i θ i = 1. Here, θ v refers to an empty surface site. Representative calculated adsorption atomic configurations for the different species are illustrated for Pd-terminated Pd3Au in Figure 1.

3. Results and Discussion

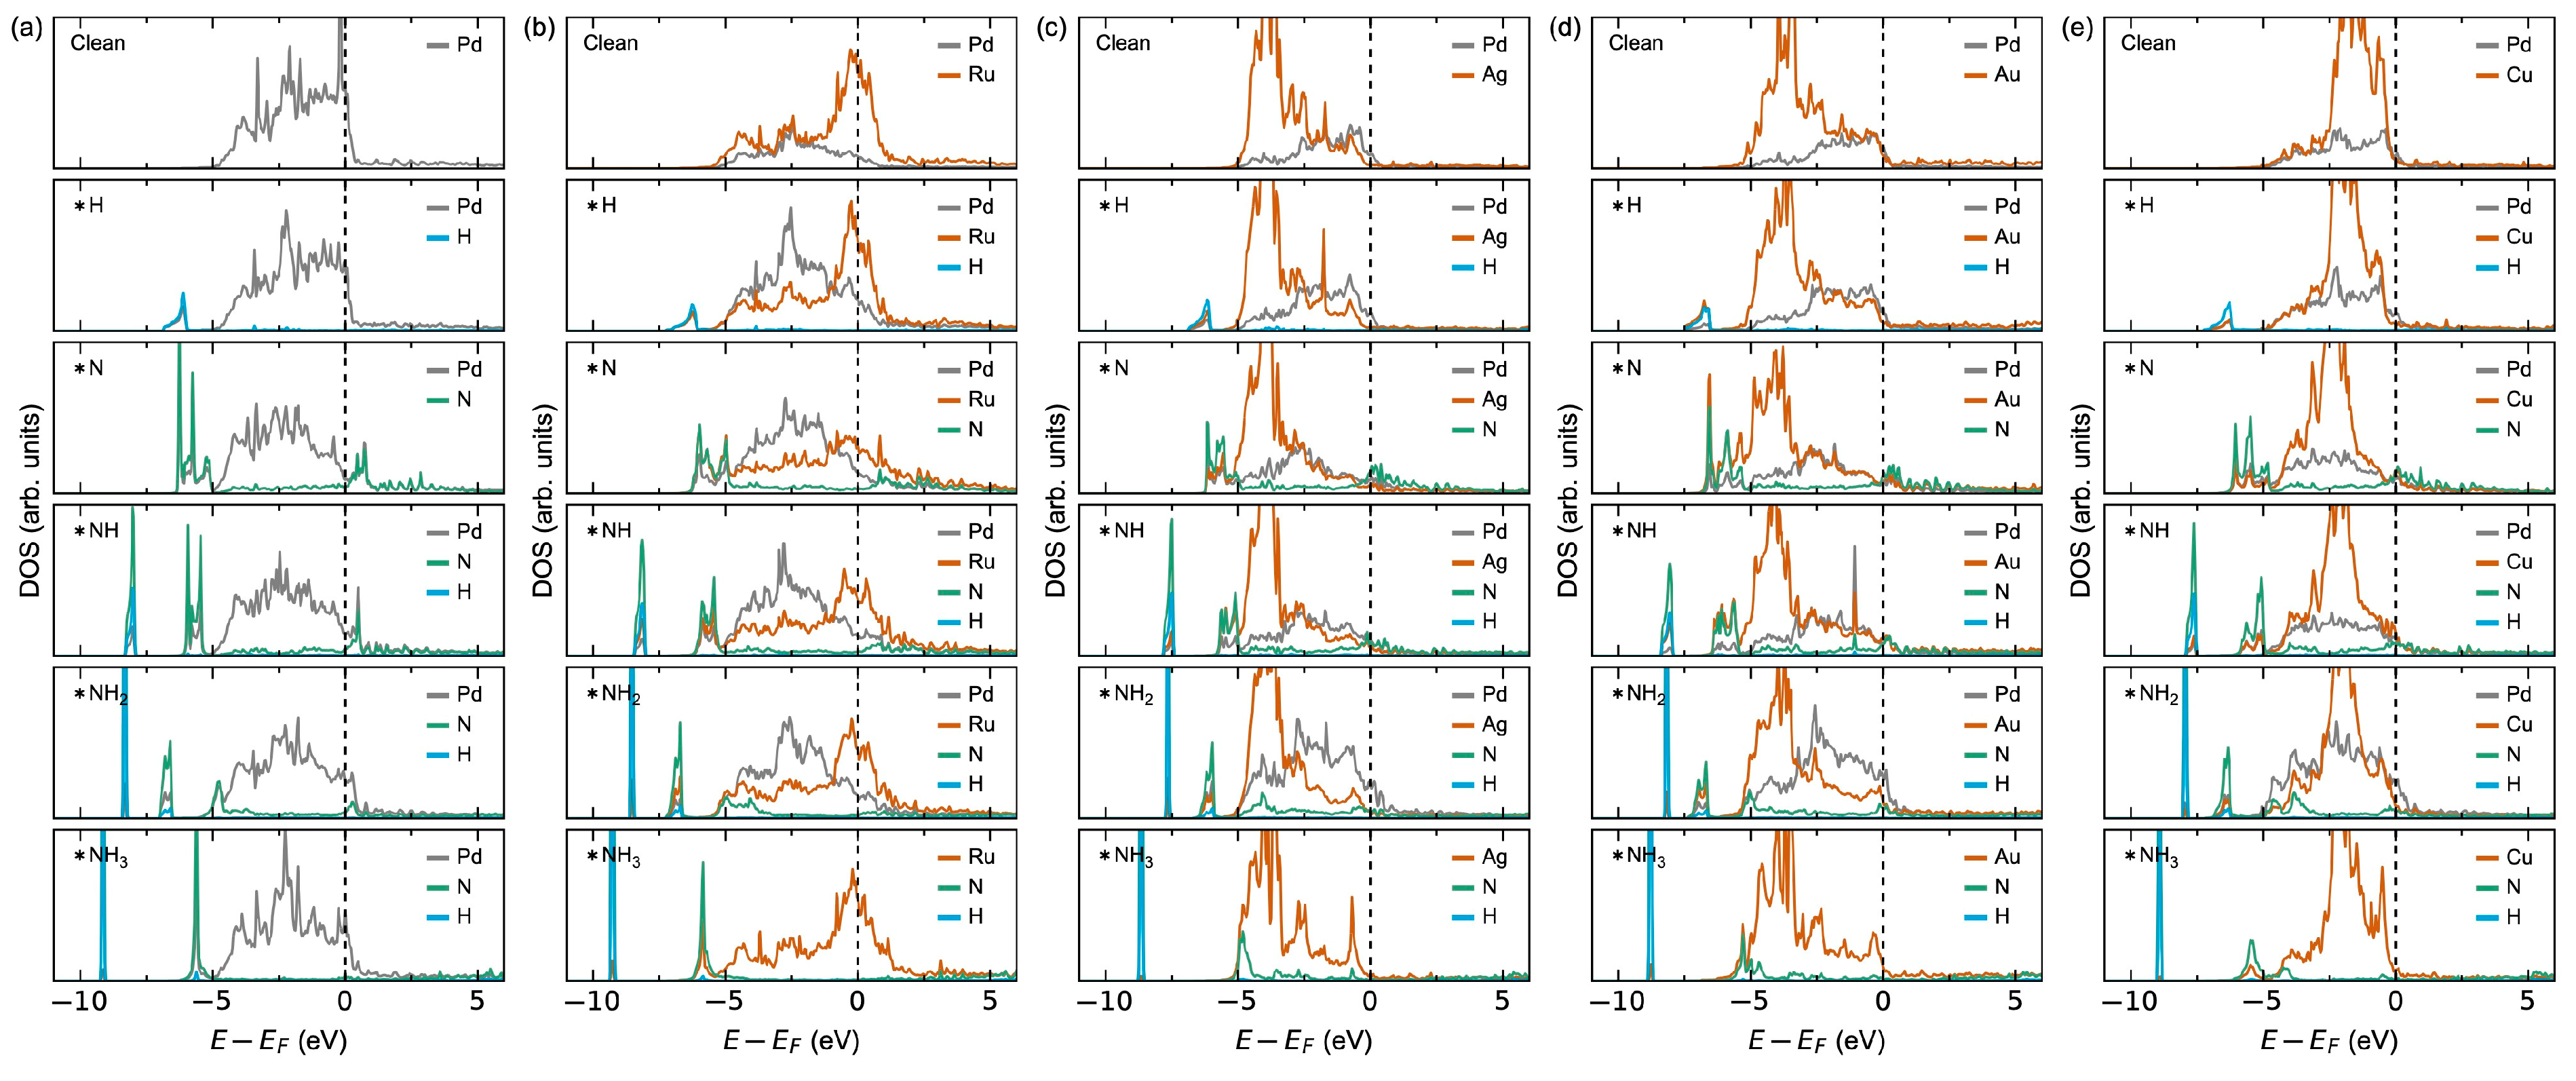
3.1. M(1 1 1) Surfaces

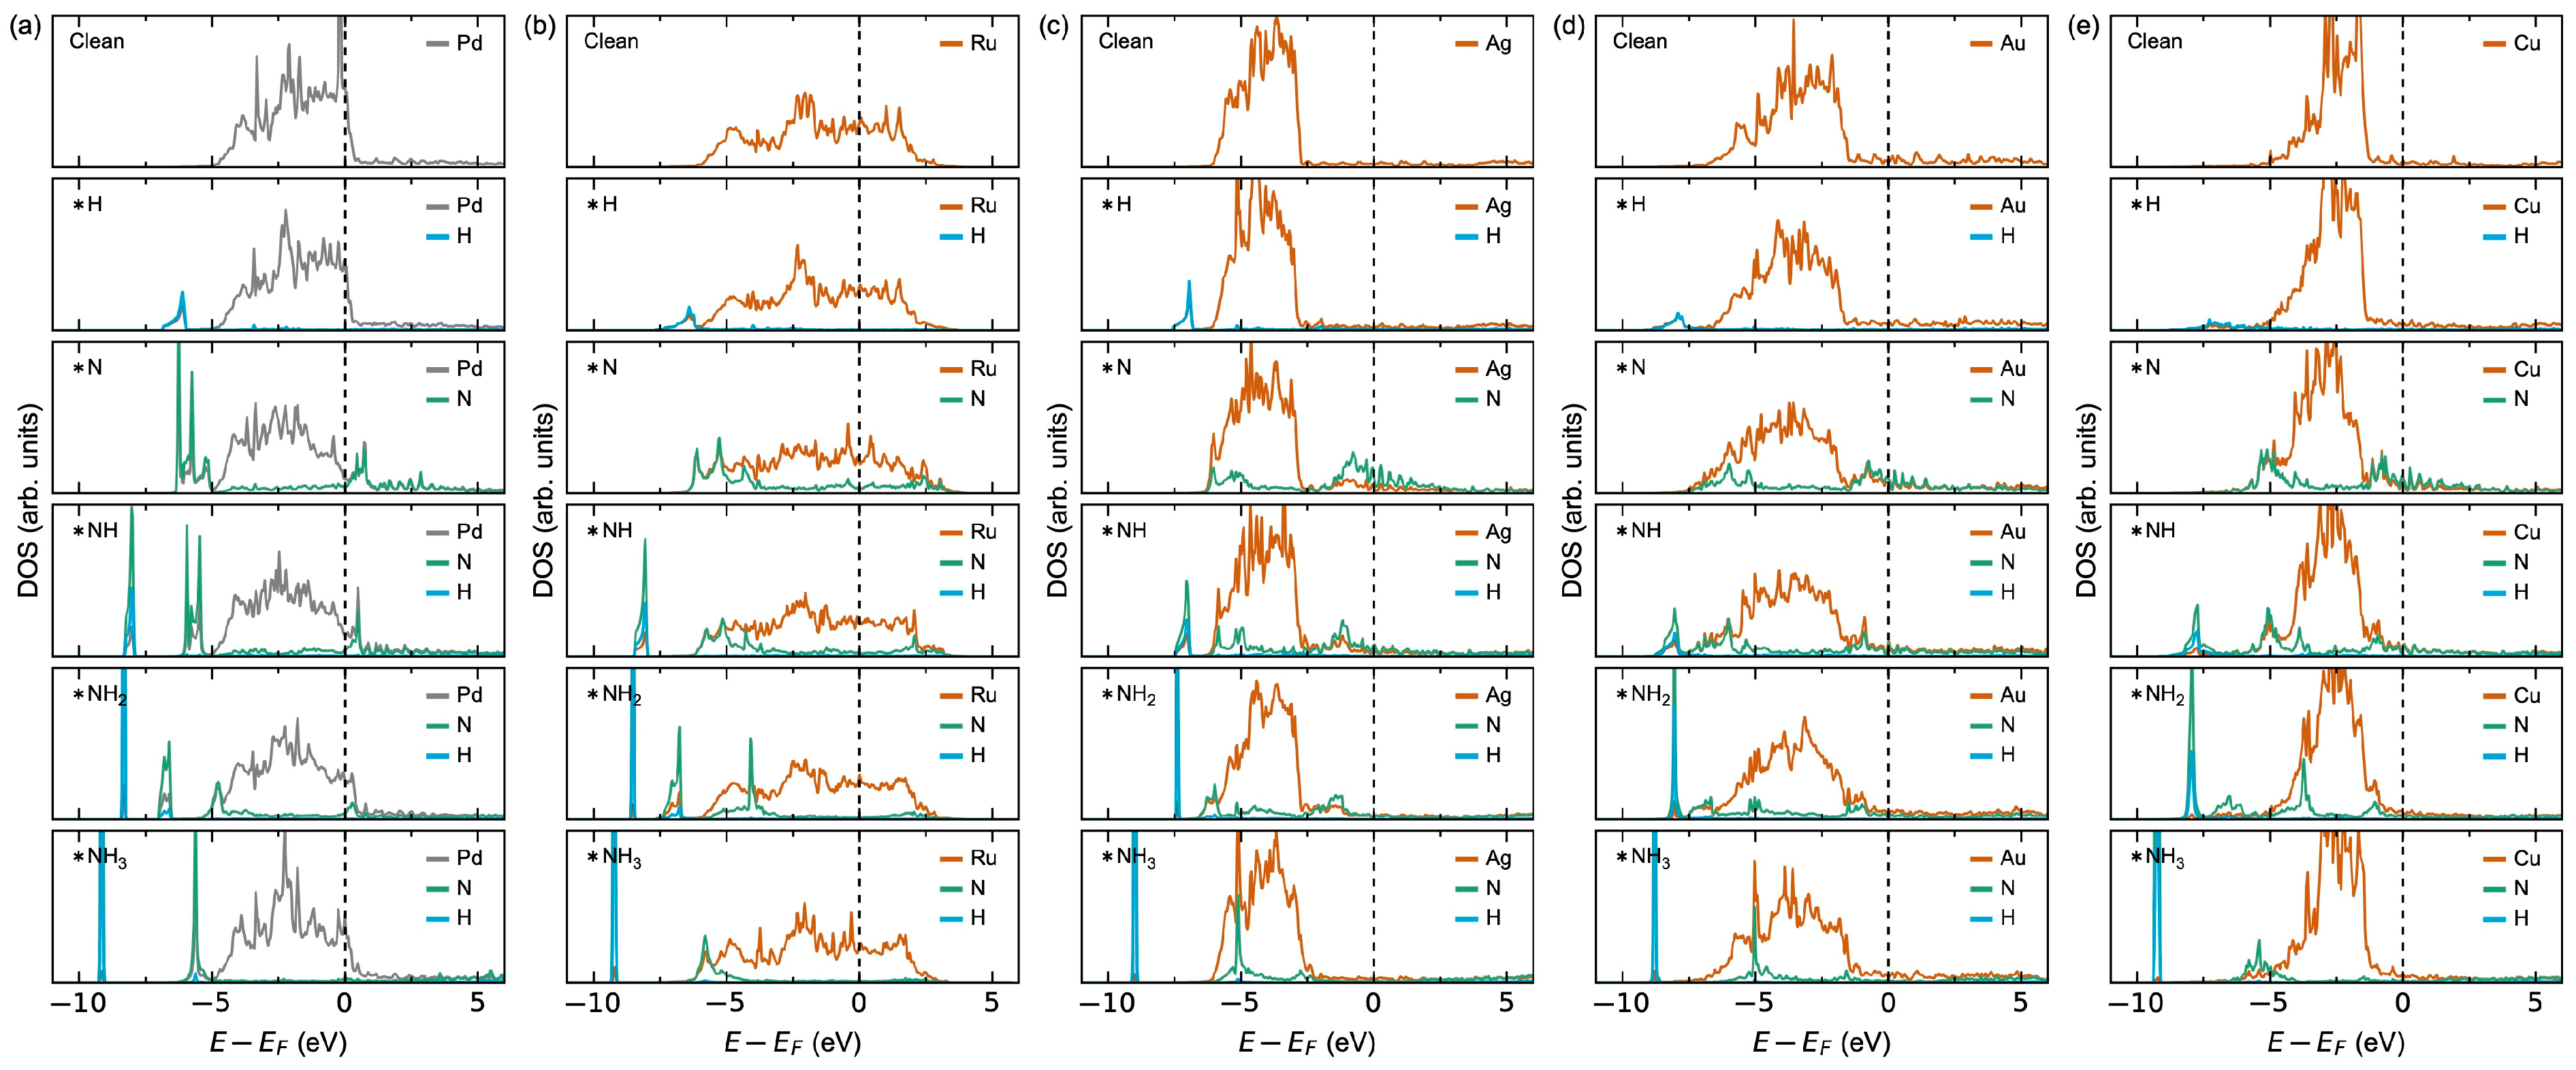
3.1.1. Adsorption Thermodynamics

To investigate how different alloying could affect the adsorption properties, their respective pure metals were initially investigated as a reference point. The calculated adsorption energies Δ H a d s , entropies T Δ S a d s , energies Δ G a d s , and vibrational frequencies ν i for the different adsorbed species at 623 K at standard conditions ( p H 2 = p N H 3 = p 0 = 1 bar) on the (1 1 1) surfaces for Pd, Ru, Ag, Au, and Cu are summarised in Table 1. H and NH3 show negative adsorption energies on Pd of −0.25 eV and −0.20 eV, respectively, while N, NH, and NH2 all show positive adsorption energies of 1.28 eV, 0.84 eV, and 0.70 eV, in line with previous work [27]. This indicates that H and NH3 will adsorb on the surface, while N, NH, and NH2 are repelled. Note that in Ref. [27], we evaluated the adsorption thermodynamics for a lower surface coverage of θ i = 1/16. The slightly weaker NH3 adsorption reported here is due to the associated larger adsorbate–adsorbate interaction. Ru shows comparable adsorption energies for H and NH3 as Pd. However, N, NH, and NH2 all show less positive adsorption energies on Ru compared to on Pd. Furthermore, NH and NH2 show exothermic adsorption. This is in line with previous work, showing that NH3 is expected to dissociate on the Ru(0001) surface [36,37].
Ag and Au, on the other hand, show comparable adsorption thermodynamics, with positive adsorption energies for all species. Cu lies in between the extrema of Pd/Ru and Ag/Au, though it still has positive adsorption energies for all species. The adsorption energies for the pure metals are in line with previous work [27,38,39,40]. Note that in Refs. [38,39,40], free atoms and molecules of the adsorbates H, N, NH, NH2, and NH3 have been used as reference energies, compared to the equilibrium between H2 (g) and NH3 (g) described in Equations (6)–(10) used in the present work. These results suggest that Pd- and Ru-rich surfaces are expected to show comparable adsorption properties, Cu-rich surfaces intermediate adsorption properties, while Ag and Au on the surface could be detrimental for adsorption performance.
A comparison of the calculated adsorption thermodynamics for H and NH3 on Pd(1 1 1) using different DFT functionals including PBEsol [41], RPBE [42], revPBE [43], r2SCAN [44], DFT-D3(BJ) [45], and rev-vdW-DF2 [46,47,48] is shown in Table S3 in the Supplementary Information.
Figure 2 shows the calculated surface coverages for H, N, NH, NH2, NH3, and empty surface sites (v) as a function of total pressure P t o t at 623 K, evaluated from the thermodynamic properties in Table 1. Here, a gas mixture corresponding to 60% H2, 20% NH3, and 20% N2 (inert) is assumed, mimicking a representative NH3 decomposition equilibrium. Focusing first on Pd, H starts to adsorb for P t o t > 10−7, reaching a peak close to full saturation ( θ H ≈ 1) at P t o t ≈ 10−1. Above this point, the competitive adsorption of H and NH3 is observed, indicated by an increase in θ N H 3 accompanied by a decrease in θ H . Ru shows a more complex evolution of surface coverage with respect to P t o t . For very low P t o t < 10−8, the surface is governed by N. By increasing P t o t , θ N H increases at the expense of θ N reaching a maximum at P t o t ≈ 10−6. Next, the surface becomes governed by H until a maximum is reached at around P t o t ≈ 10−2–10−2. Finally, the surface becomes dominated by NH3 from P t o t > 1. Ag and Au show no surface coverage of any of the species, except for NH3, which stars to adsorb for P t o t > 1. Cu behaves similarly as Ag and Au, though with some additional surface coverage of H in line with the less positive hydrogen adsorption energy.
The thermodynamics can be reasoned from the calculated electronic density of states (DOS) upon adsorption plotted in Figure 3. For Pd, the large negative adsorption enthalpies of H and NH3 can be explained by the overlapping Pd and H or N states at the bottom of the valence band and the insignificant perturbation of the Pd states at the Fermi level [27]. Oppositely, the positive adsorption enthalpies for N and NH can be reasoned from a significant lowering of the Pd states at the Fermi level with an associated destabilisation effect [49]. The DOS for NH2 adsorption lies in between the two extrema, reflecting the corresponding intermediate adsorption energies. The tendency for strong adsorption on Ru can be explained already from the DOS for the clean surface, where the Fermi level lies within a high-density Ru d-band. Oppositely, the weak adsorption on Ag, Au, and Cu can be reasoned by the Fermi level being in a low-density M d-band in line with the d-band centre theory reported in the literature [50,51].

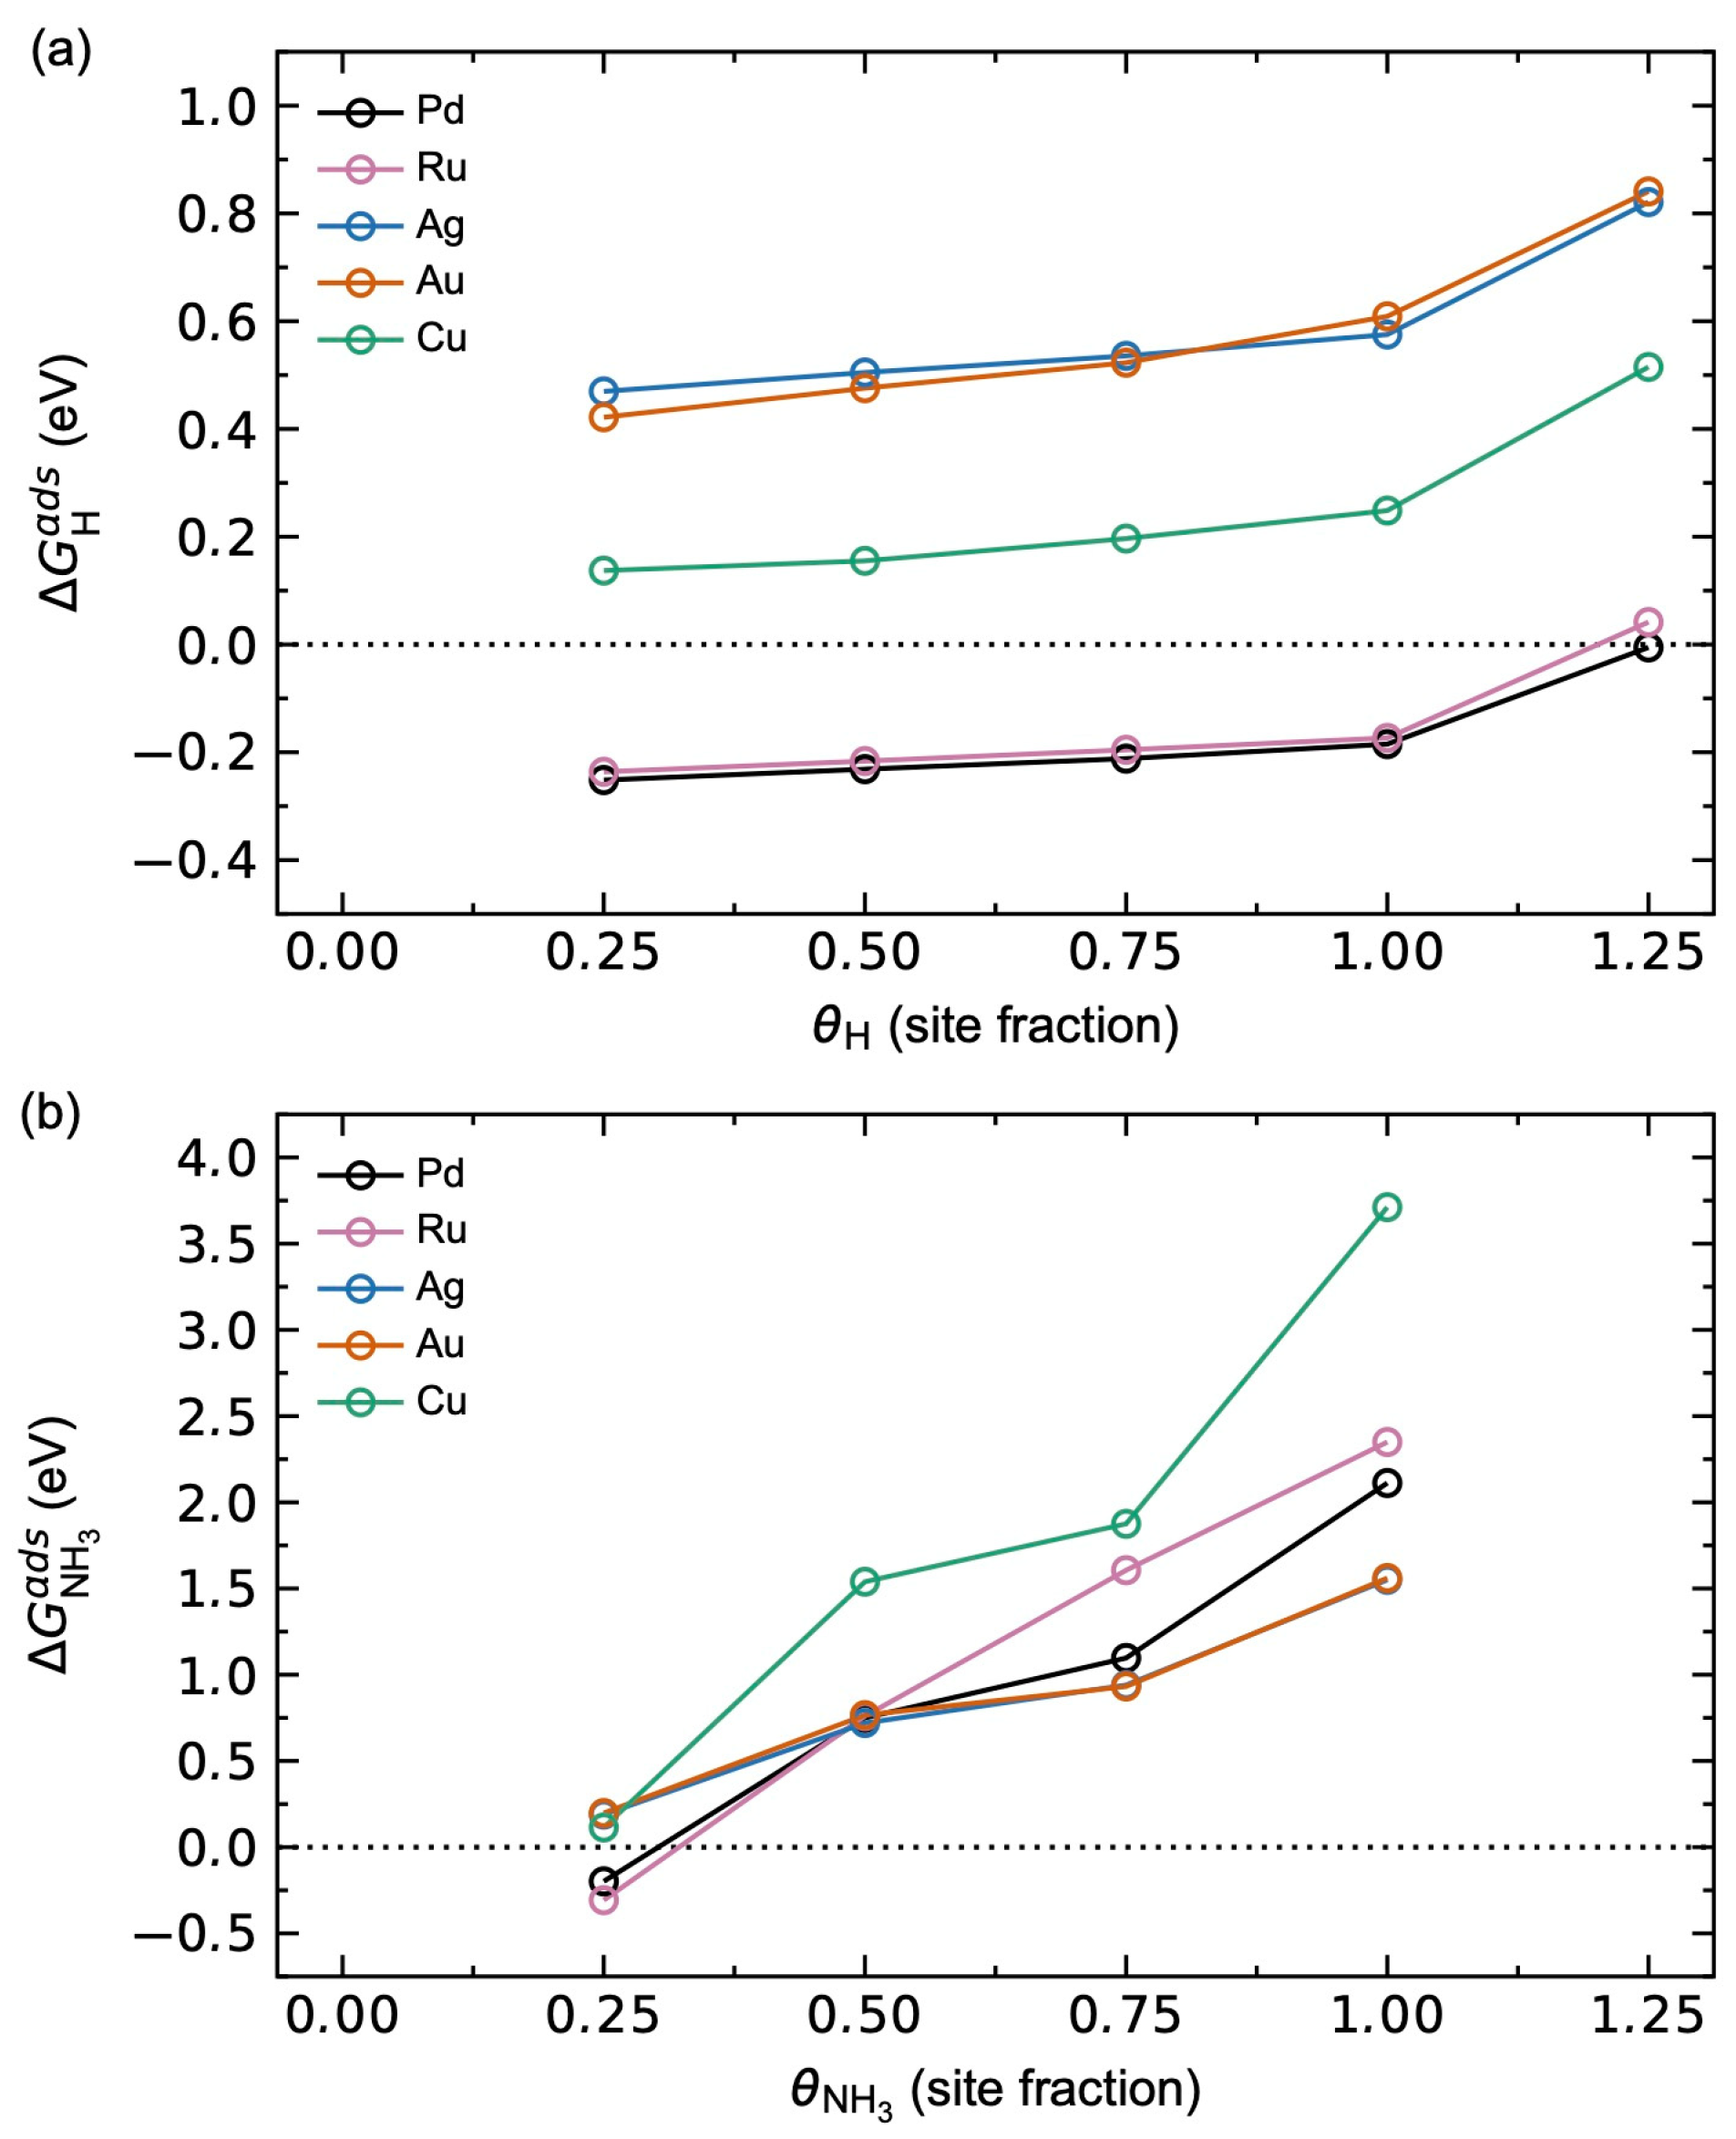
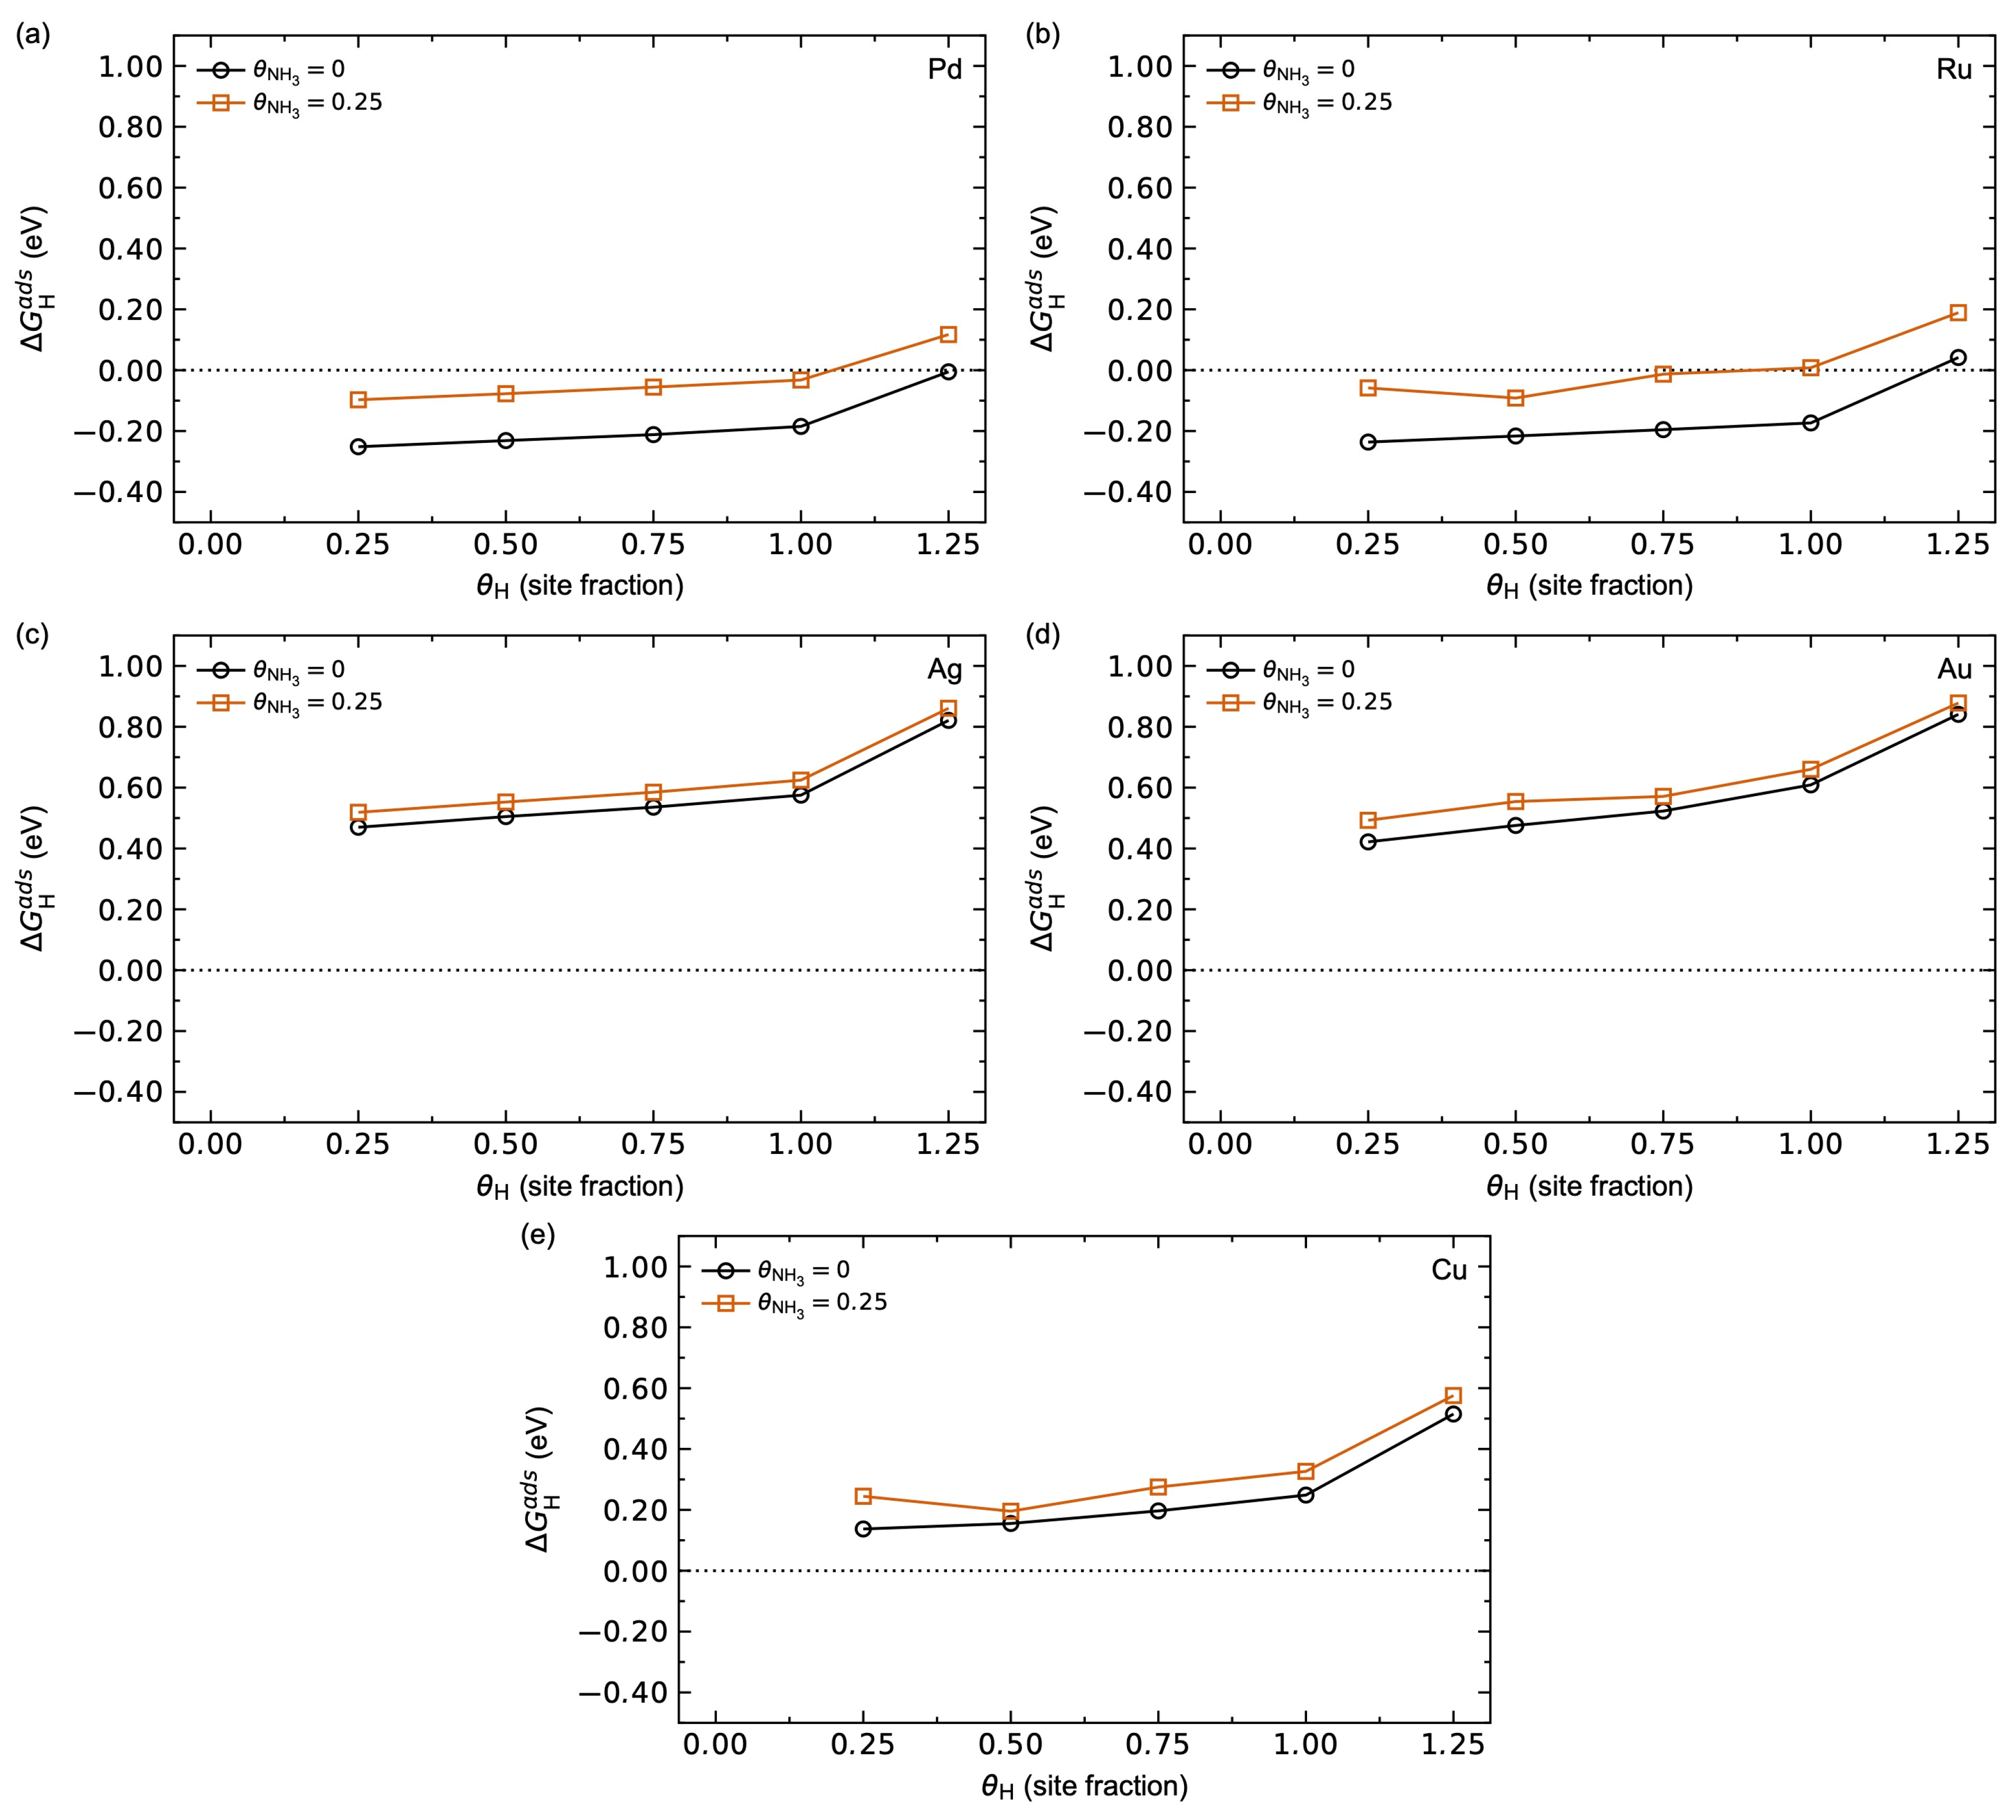
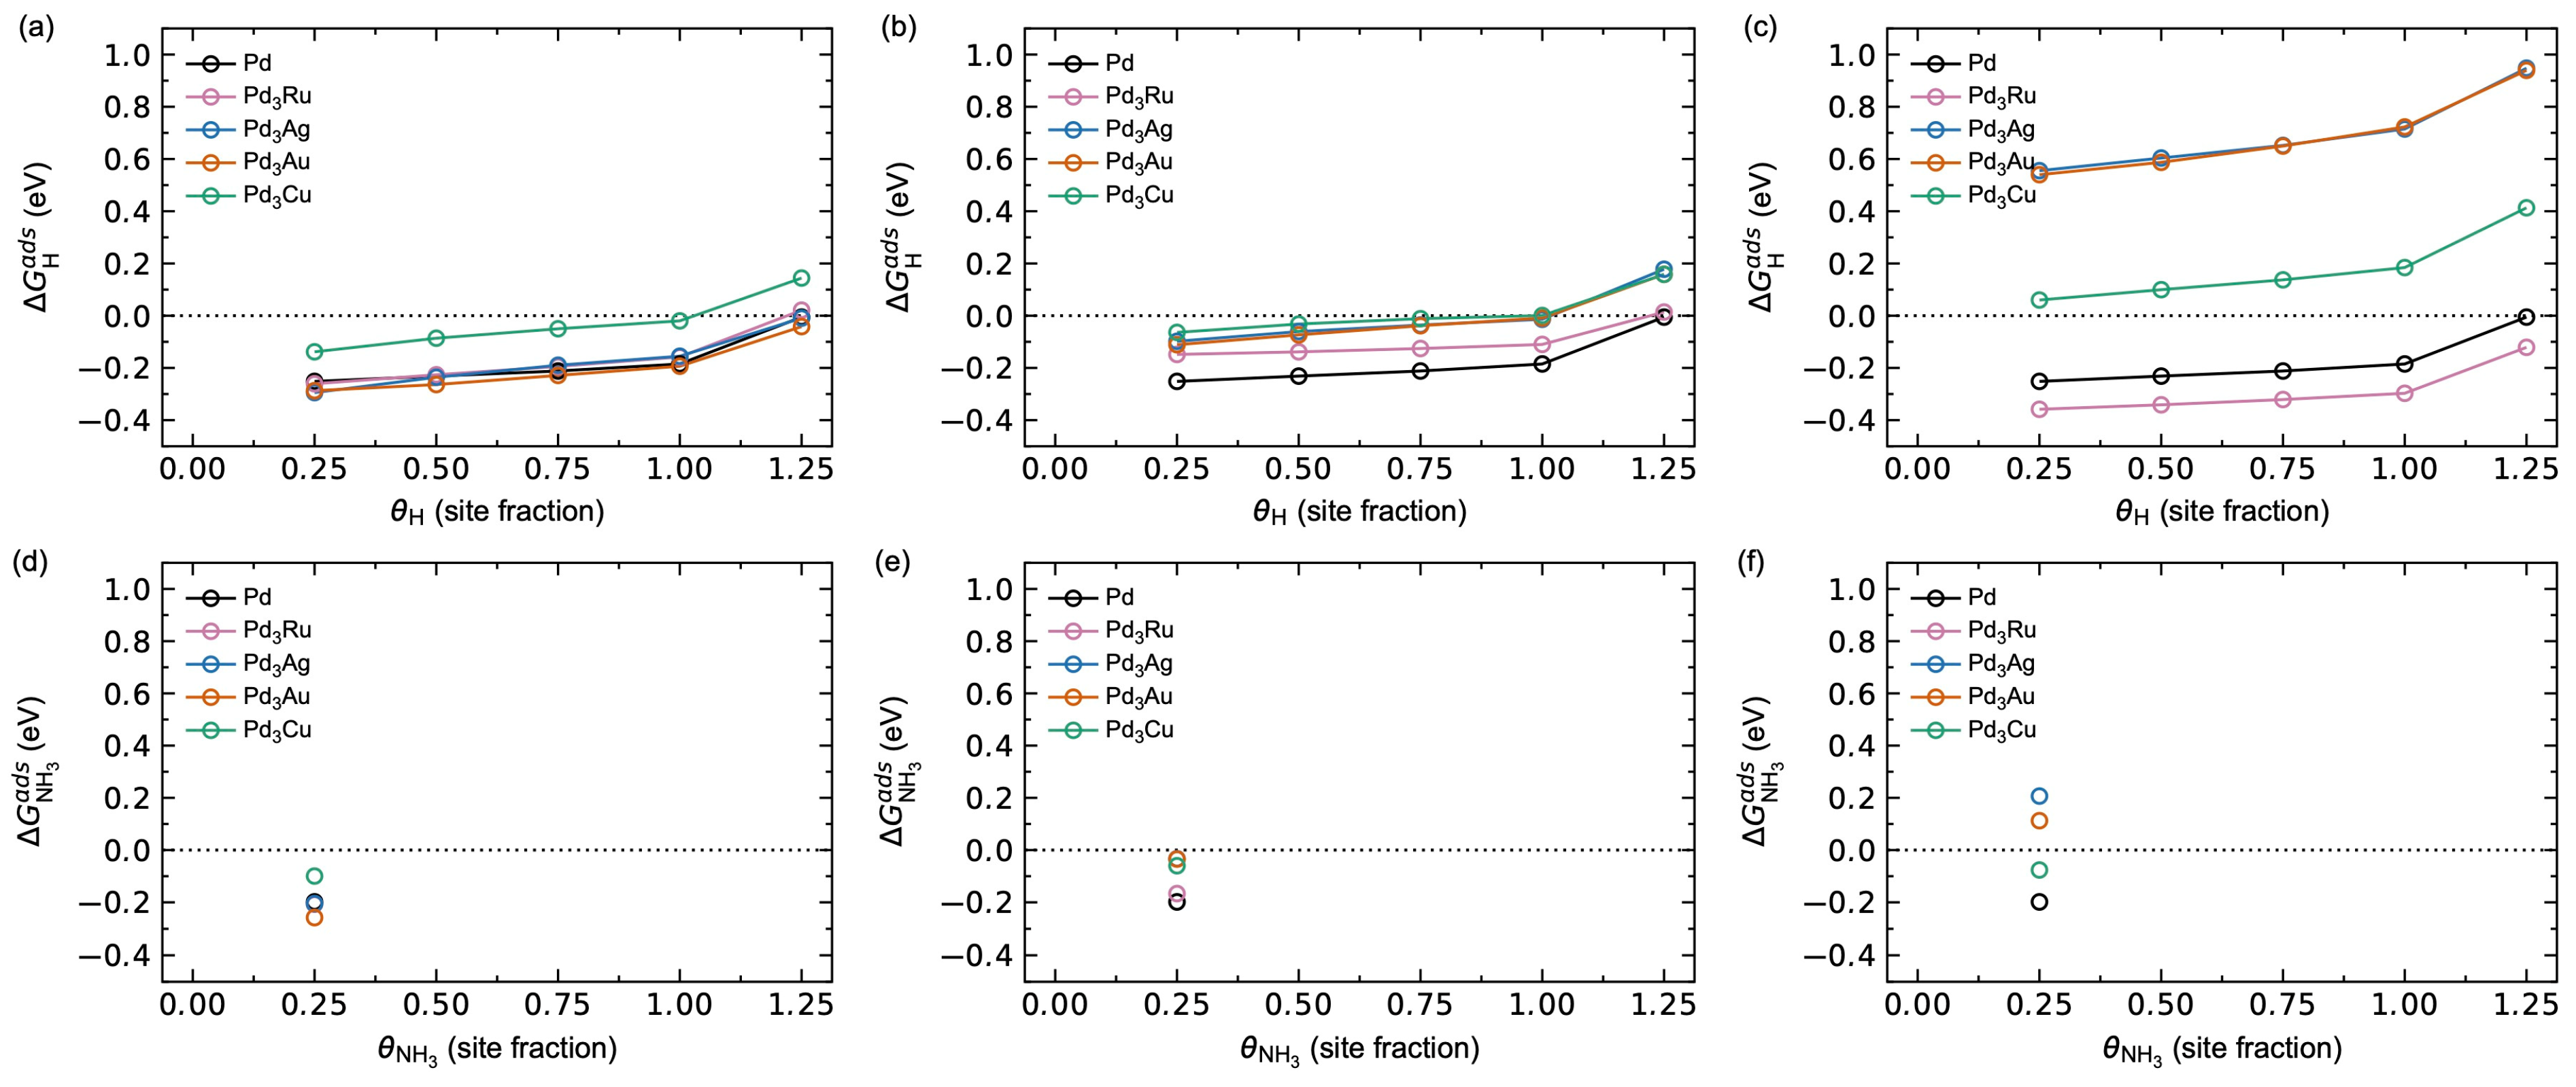
3.1.2. Adsorbate–Adsorbate Interactions and Co-Adsorption Energetics

The adsorption thermodynamics described above show a significant expected equilibrium concentration for H and NH3 under the relevant operating conditions. Note, however, that these calculations do not take adsorbate–adsorbate interactions into consideration. Since adsorbate–adsorbate interactions can become significant for larger surface coverages, and in particular for larger adsorbates like NH3, we present in the following how the adsorption energies for H and NH3 are affected by significant adsorbate–adsorbate interactions explicitly.
The calculated adsorption energies for H and NH3 as a function of surface coverage are shown in Figure 4. The hydrogen adsorption in Figure 4a illustrates that the metals investigated can be divided into three groups. Pd and Ru both show negative Δ G H a d s up to θ H = 1, suggesting full hydrogen saturation in line with previous work [27]. Ag and Au show comparable and positive Δ G H a d s for all θ H , while Cu lies in between the two extrema. The shapes of all the Δ G H a d s profiles are, however, similar, where a sudden increase in Δ G H a d s is observed for θ H = 1.25. At this point, the hcp surface sites become occupied, where the destabilisation is due to the shorter Hfcc-Hhcp distances (1.61 Å for Pd) compared to the longer Hfcc-Hfcc distances (2.79 Å for Pd) for θ H ≤ 1.
NH3 adsorption in Figure 4b shows a much steeper increase in adsorption energy with respect to surface coverage due to the significantly larger size of NH3 and corresponding larger adsorbate–adsorbate interactions, as previously reported [27]. Pd and Ru show an NH3 saturation coverage of 0.25, while Ag, Au, and Cu all show positive Δ G N H 3 a d s , as described above. Ag and Au show comparable Δ G N H 3 a d s , with near complete overlap between the values for the two alloying elements.
Finally, the adsorption energies for hydrogen on a clean surface to a surface with θ N H 3 = 0.25 pre-adsorbed on the surface are compared in Figure 5. The destabilisation of hydrogen adsorption of ~0.2 eV for Pd and Ru is observed in Figure 5a and b, respectively. The destabilisation effect is less pronounced for Ag, Au, and Cu, which can be attributed to their corresponding weaker NH3 adsorption.

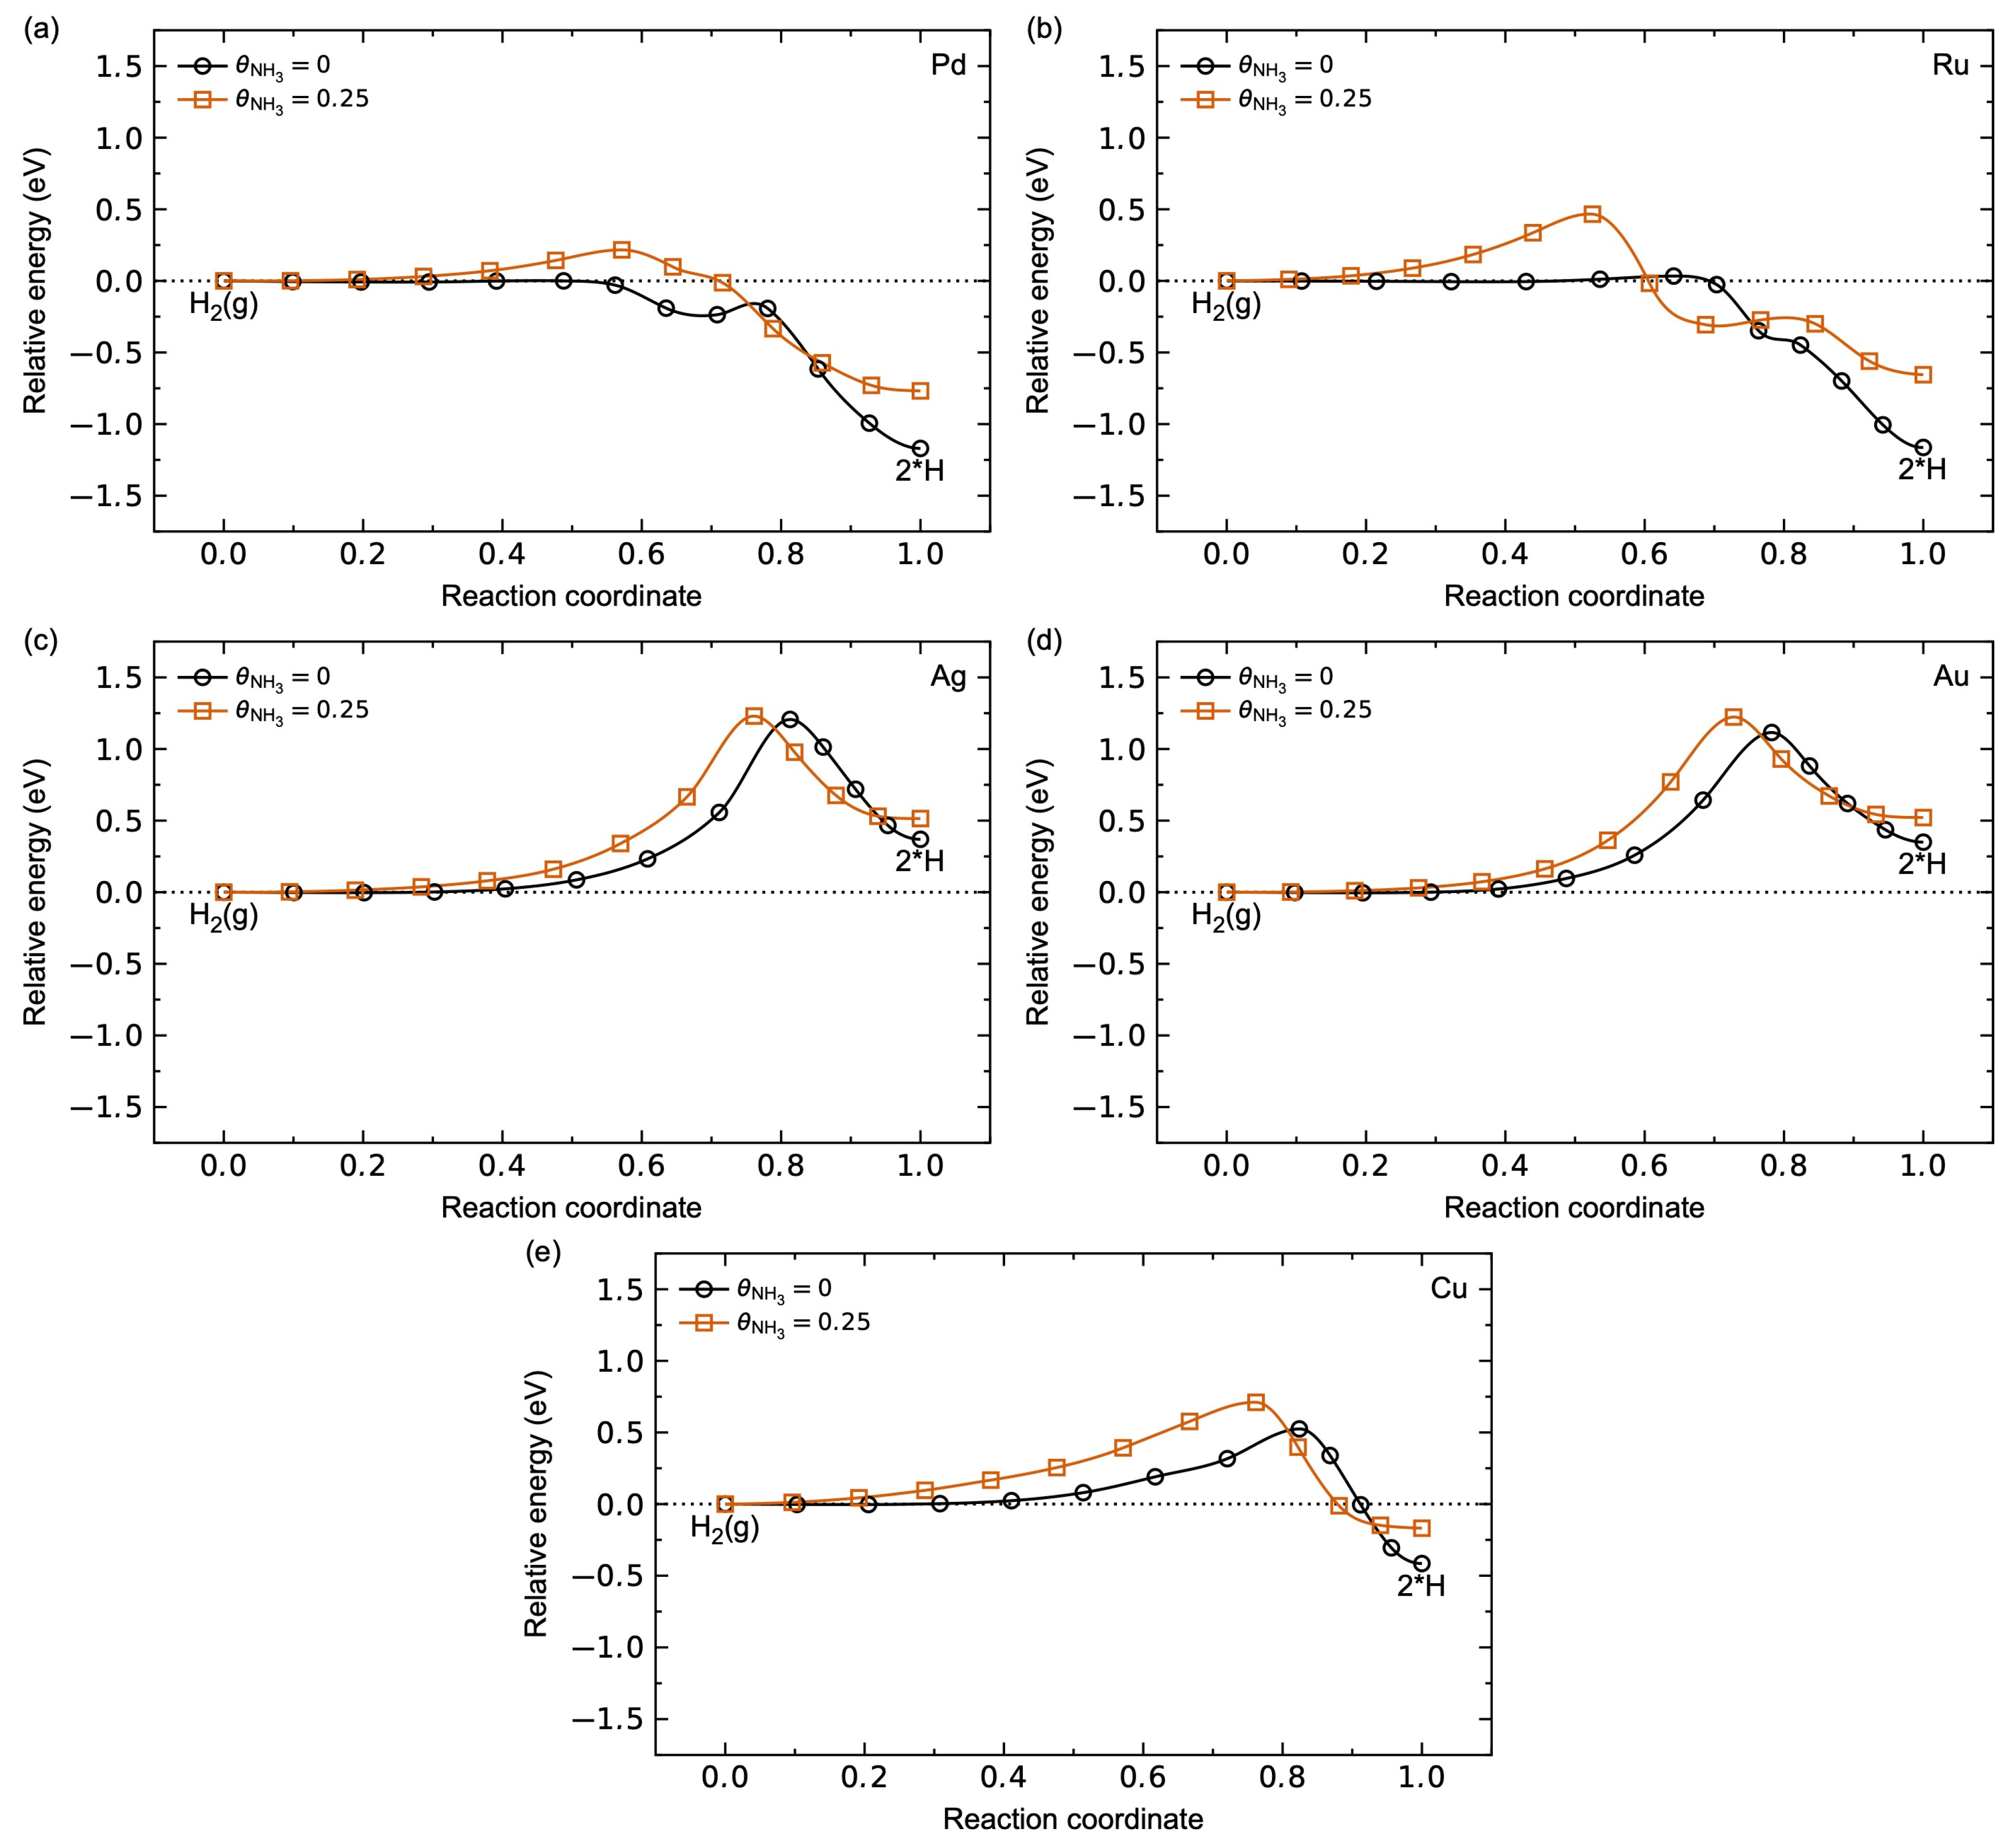
3.1.3. Hydrogen Diffusion Energetics

The calculated minimum energy path (MEP) for hydrogen dissociation without and with NH3 pre-adsorbed on the metal surfaces is plotted in Figure 6. The H2 dissociation is a non-activated process on the Pd and Ru surfaces, apparent from the lack of an energy barrier relative to H2. As previously reported [27,52,53], Pd shows a local energy minimum along the MEP, corresponding to a metastable physiosorbed H2 molecule on a top site, with a small energy barrier (~0.04 eV) for the splitting of the H-H bond. Ru, on the other hand, does not show this local energy barrier. This indicates that the Ru(1 1 1) surface is more active towards H2 dissociation compared to Pd(1 1 1). Ag and Au, on the other hand, show significant energy barriers for the hydrogen dissociation of 1.21 eV and 1.12 eV, respectively. The corresponding dissociation mechanism goes through H2 physiosorbed on a hollow site rather than physiosorbed H2 on a top site as for Pd and Ru. Interestingly, while the adsorption enthalpy for H is negative on Cu, the dissociation has an energy barrier of 0.53 eV due to a dissociation path comparable to Ag and Au. This suggests that the emerging energy barriers for Ag, Au, and Cu are due to the hydrogen adsorption energetics on the surface, as described above.
With NH3 pre-adsorbed on the surface, the hydrogen dissociation becomes an activated process on all surfaces, with a positive energy barrier relative to H2 along all the MEP. Pd and Ru show energy barriers of 0.22 eV and 0.47 eV, respectively, while the energy barrier on Ag is insensitive to the presence of NH3. The emerging energy barrier on Pd in the presence of NH3 is described in our previous work [27]; the dissociation goes through a physiosorbed H2 on a bridge-site due to the steric hindrance of the top sites. Ag, Au, and Cu, on the other hand, show a comparable dissociation mechanism with pre-adsorbed NH3 on the pristine surface, explaining the comparable MEP.

3.2. Pd3M Alloys

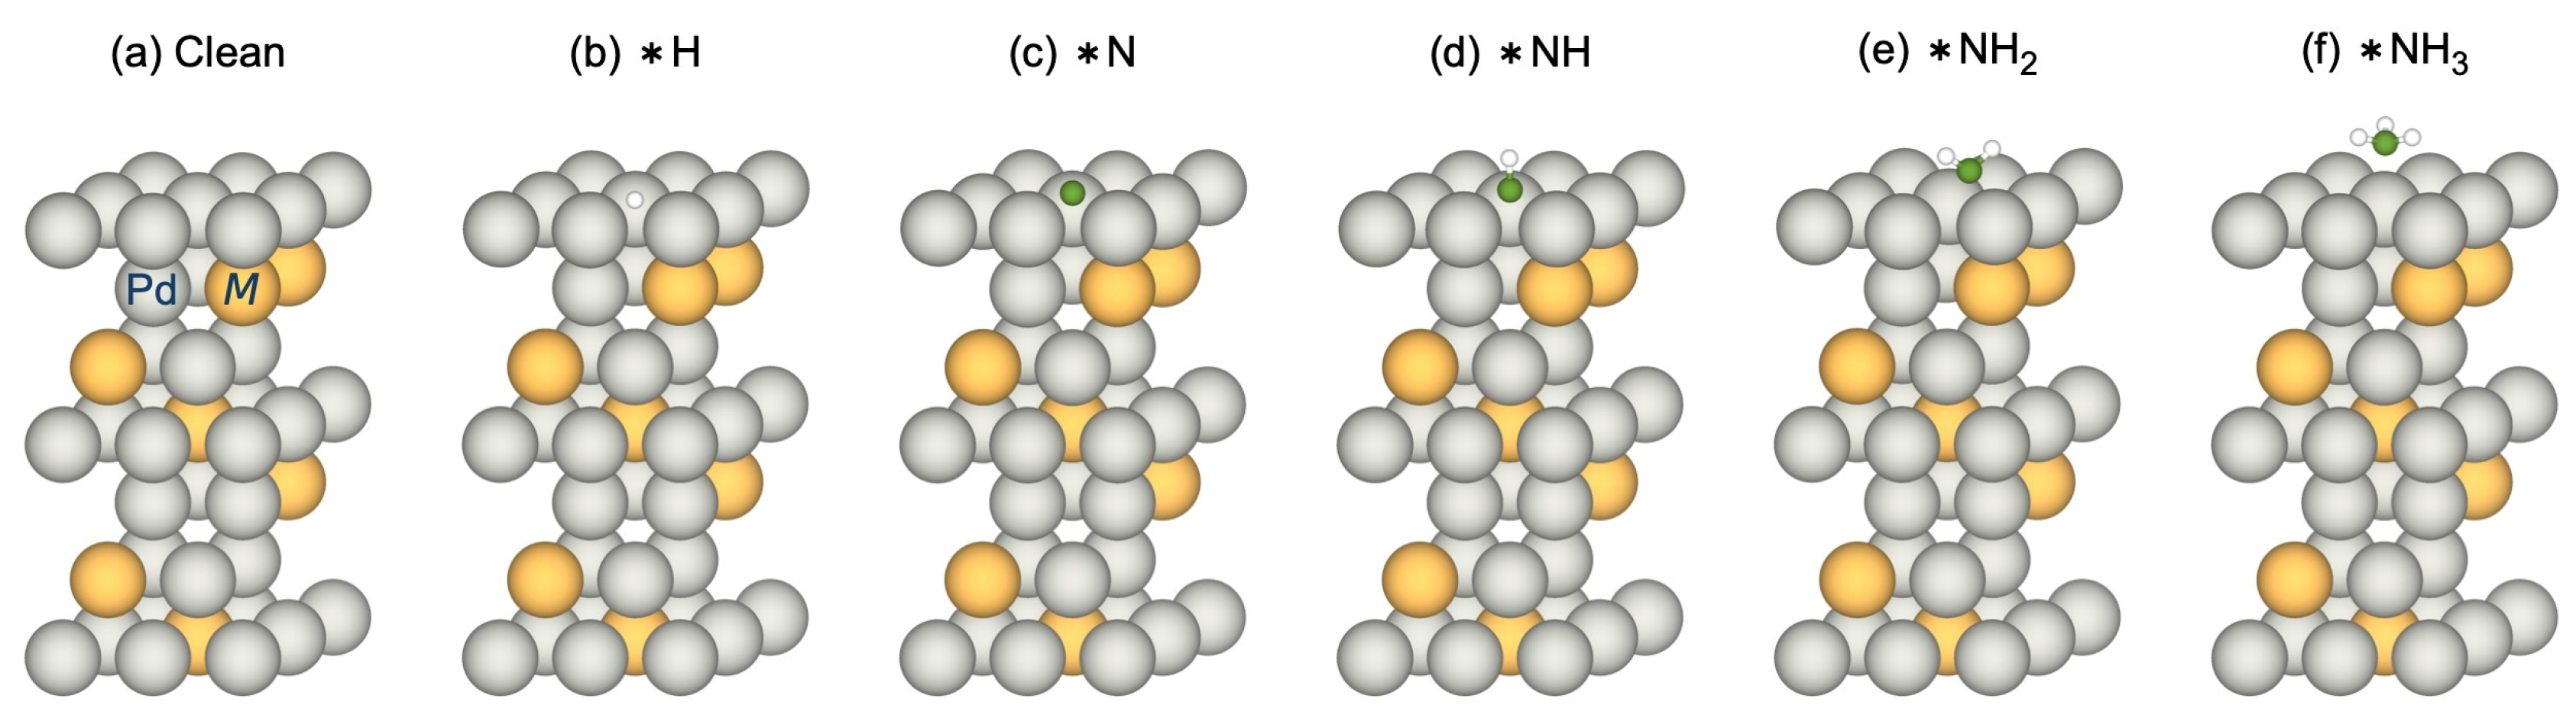
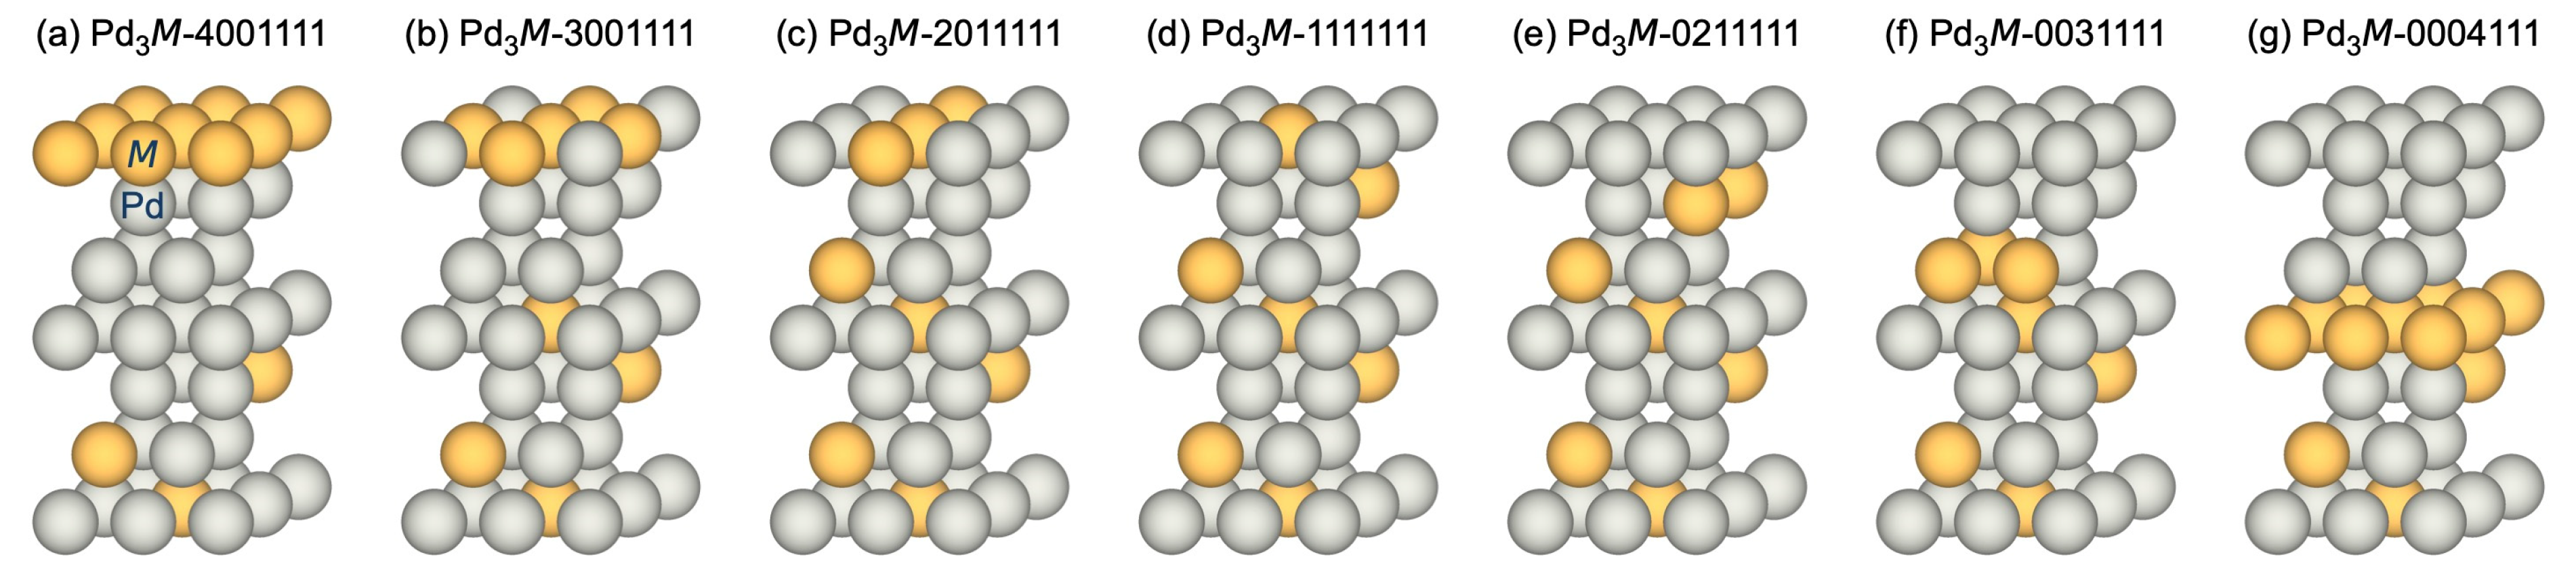
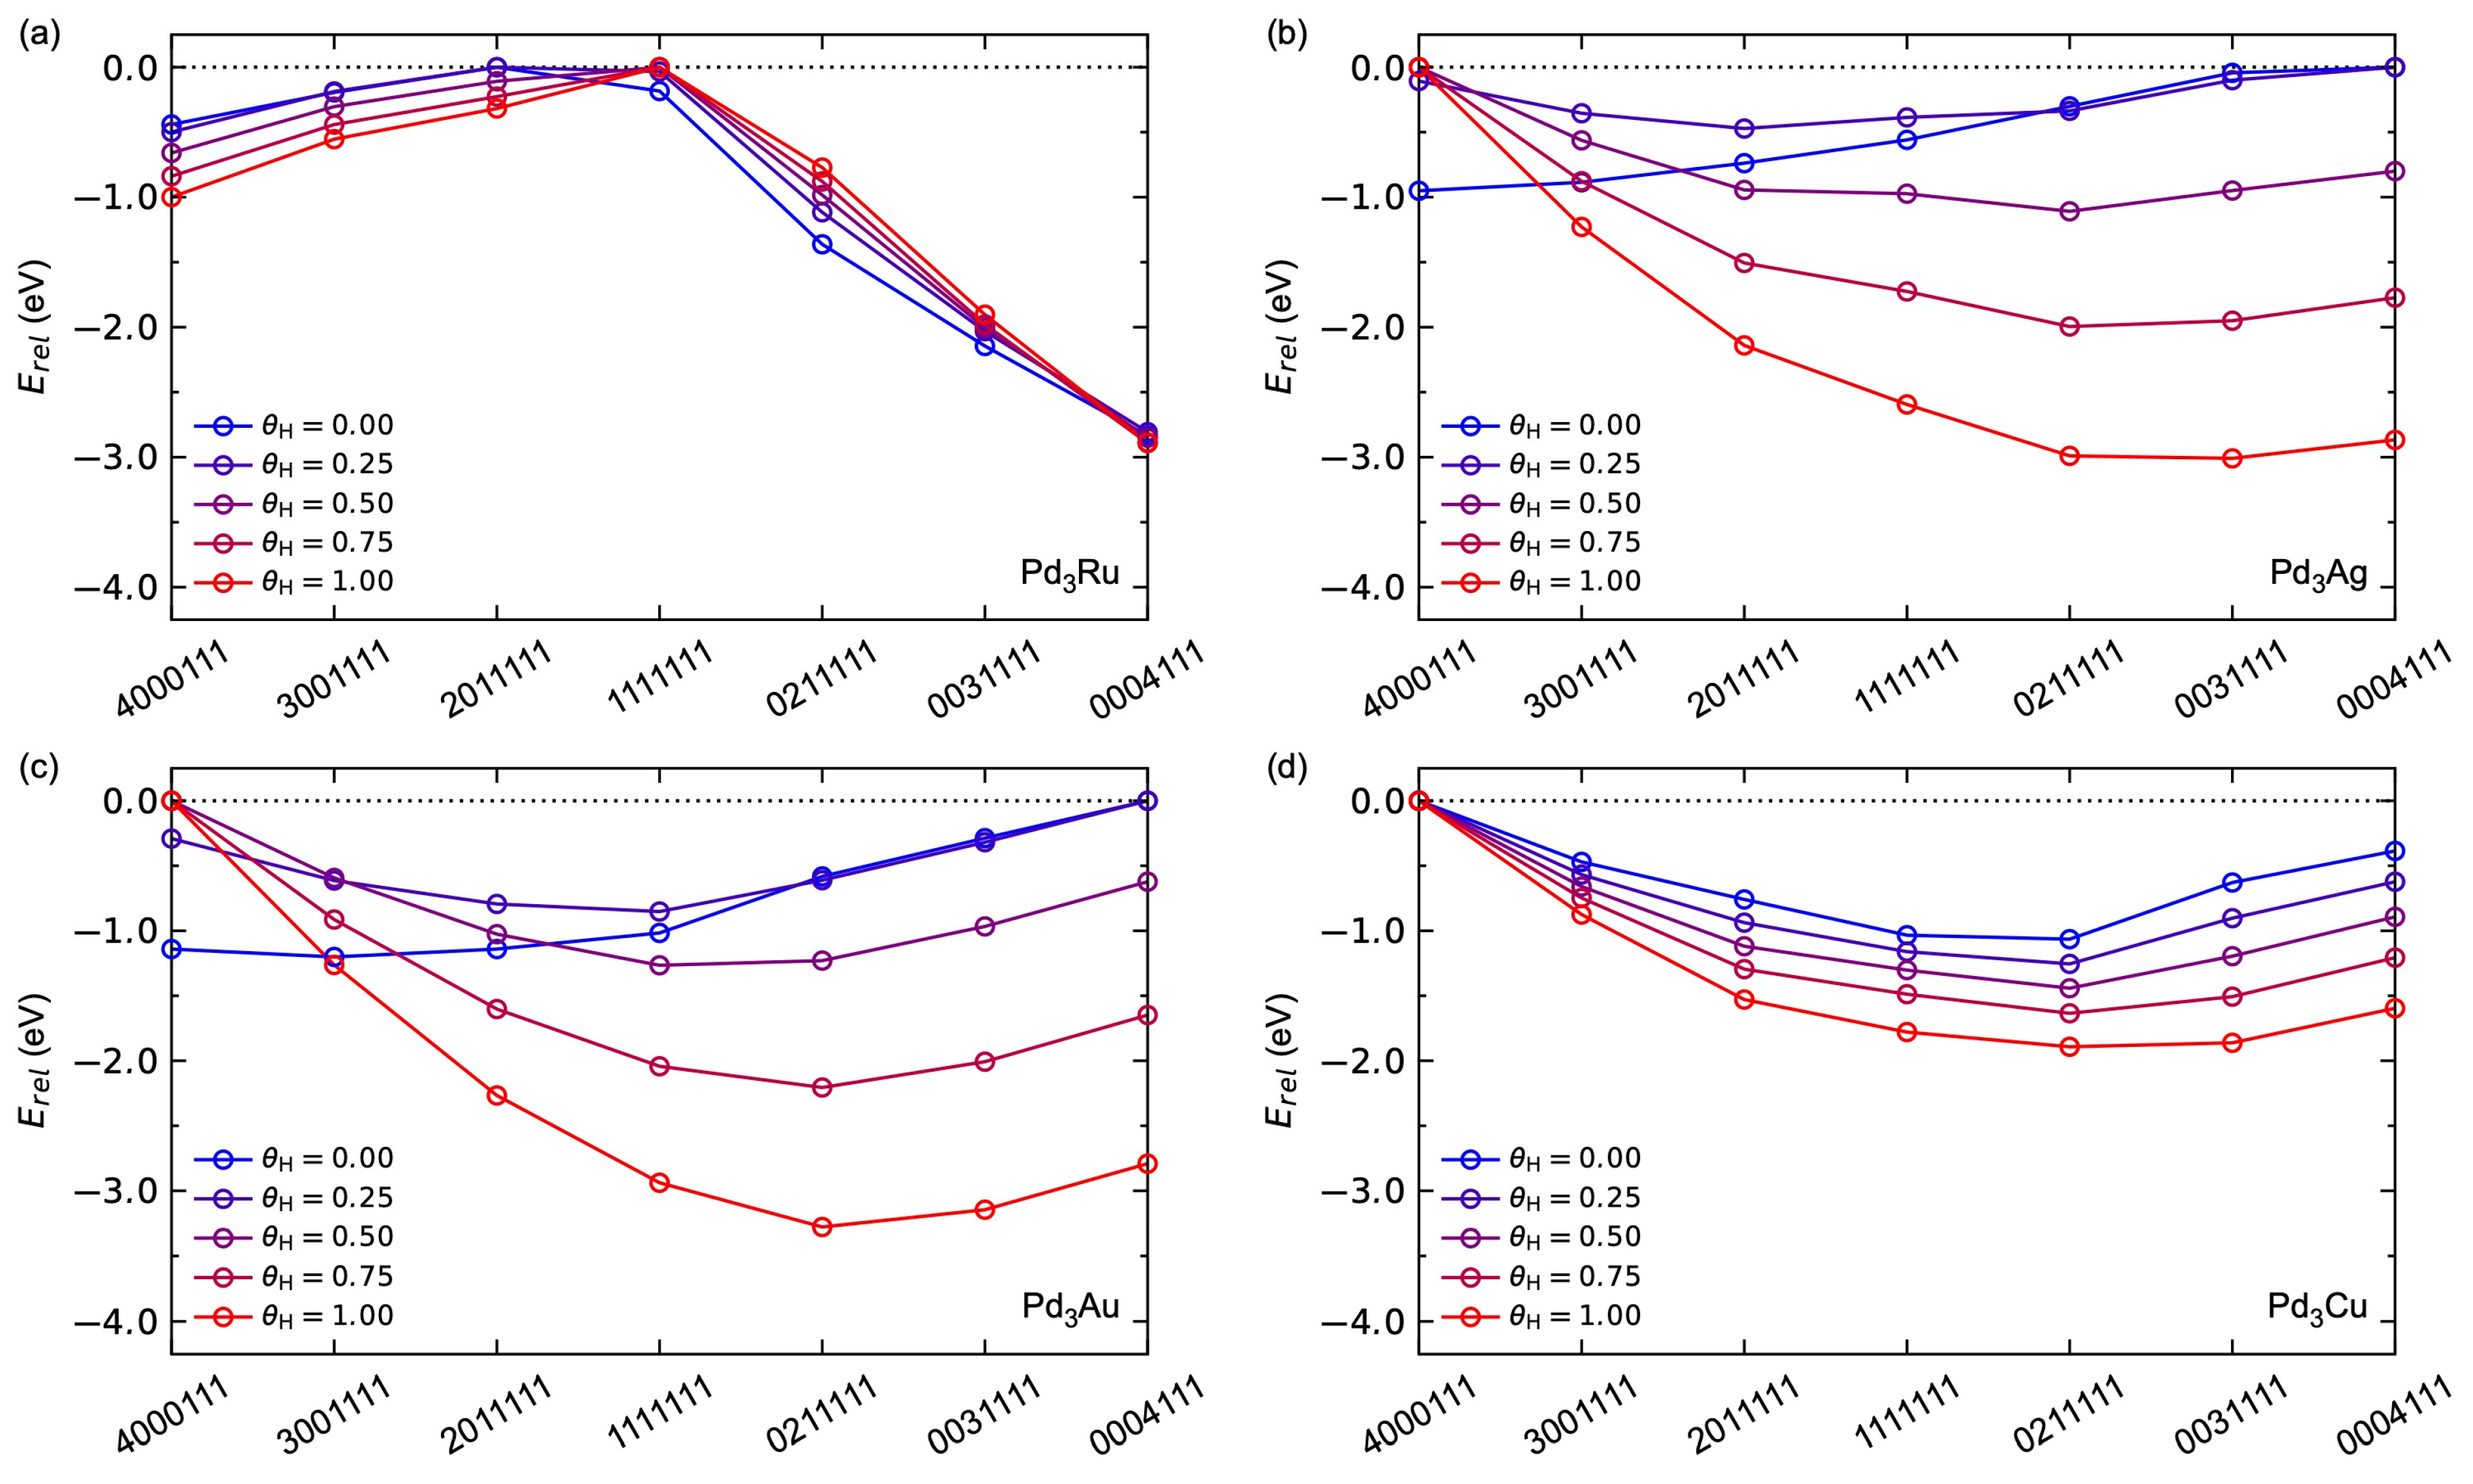
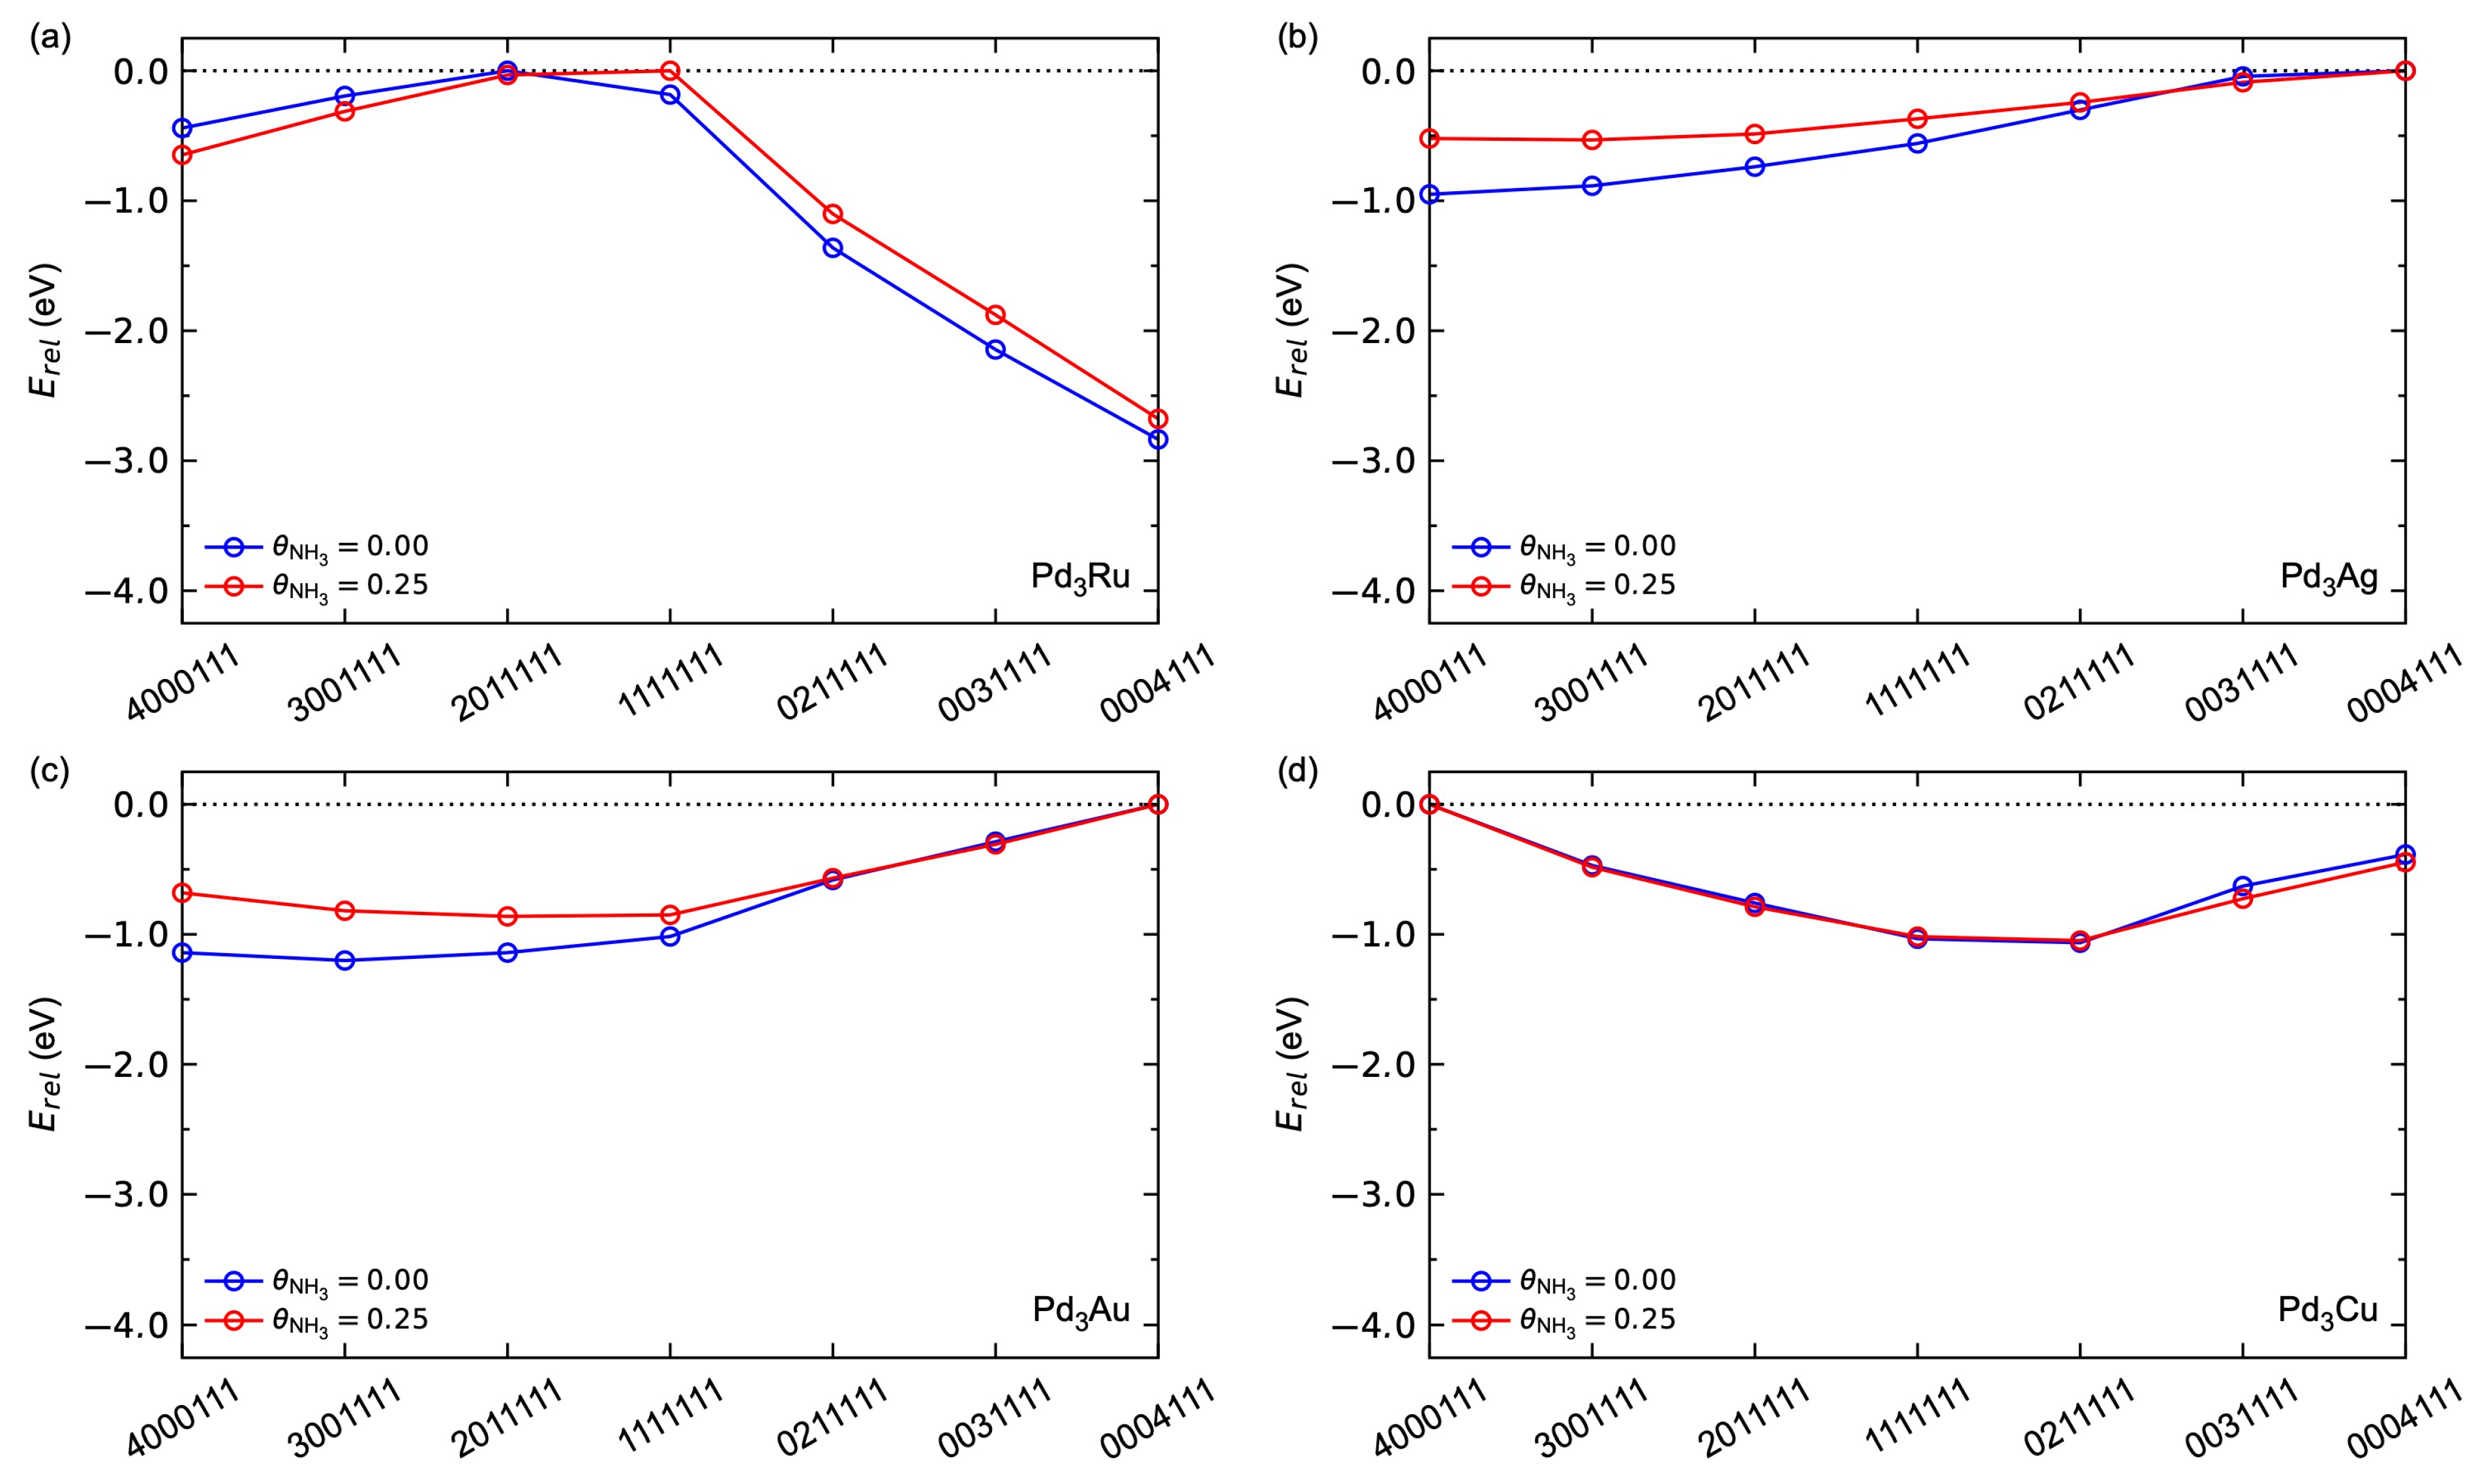
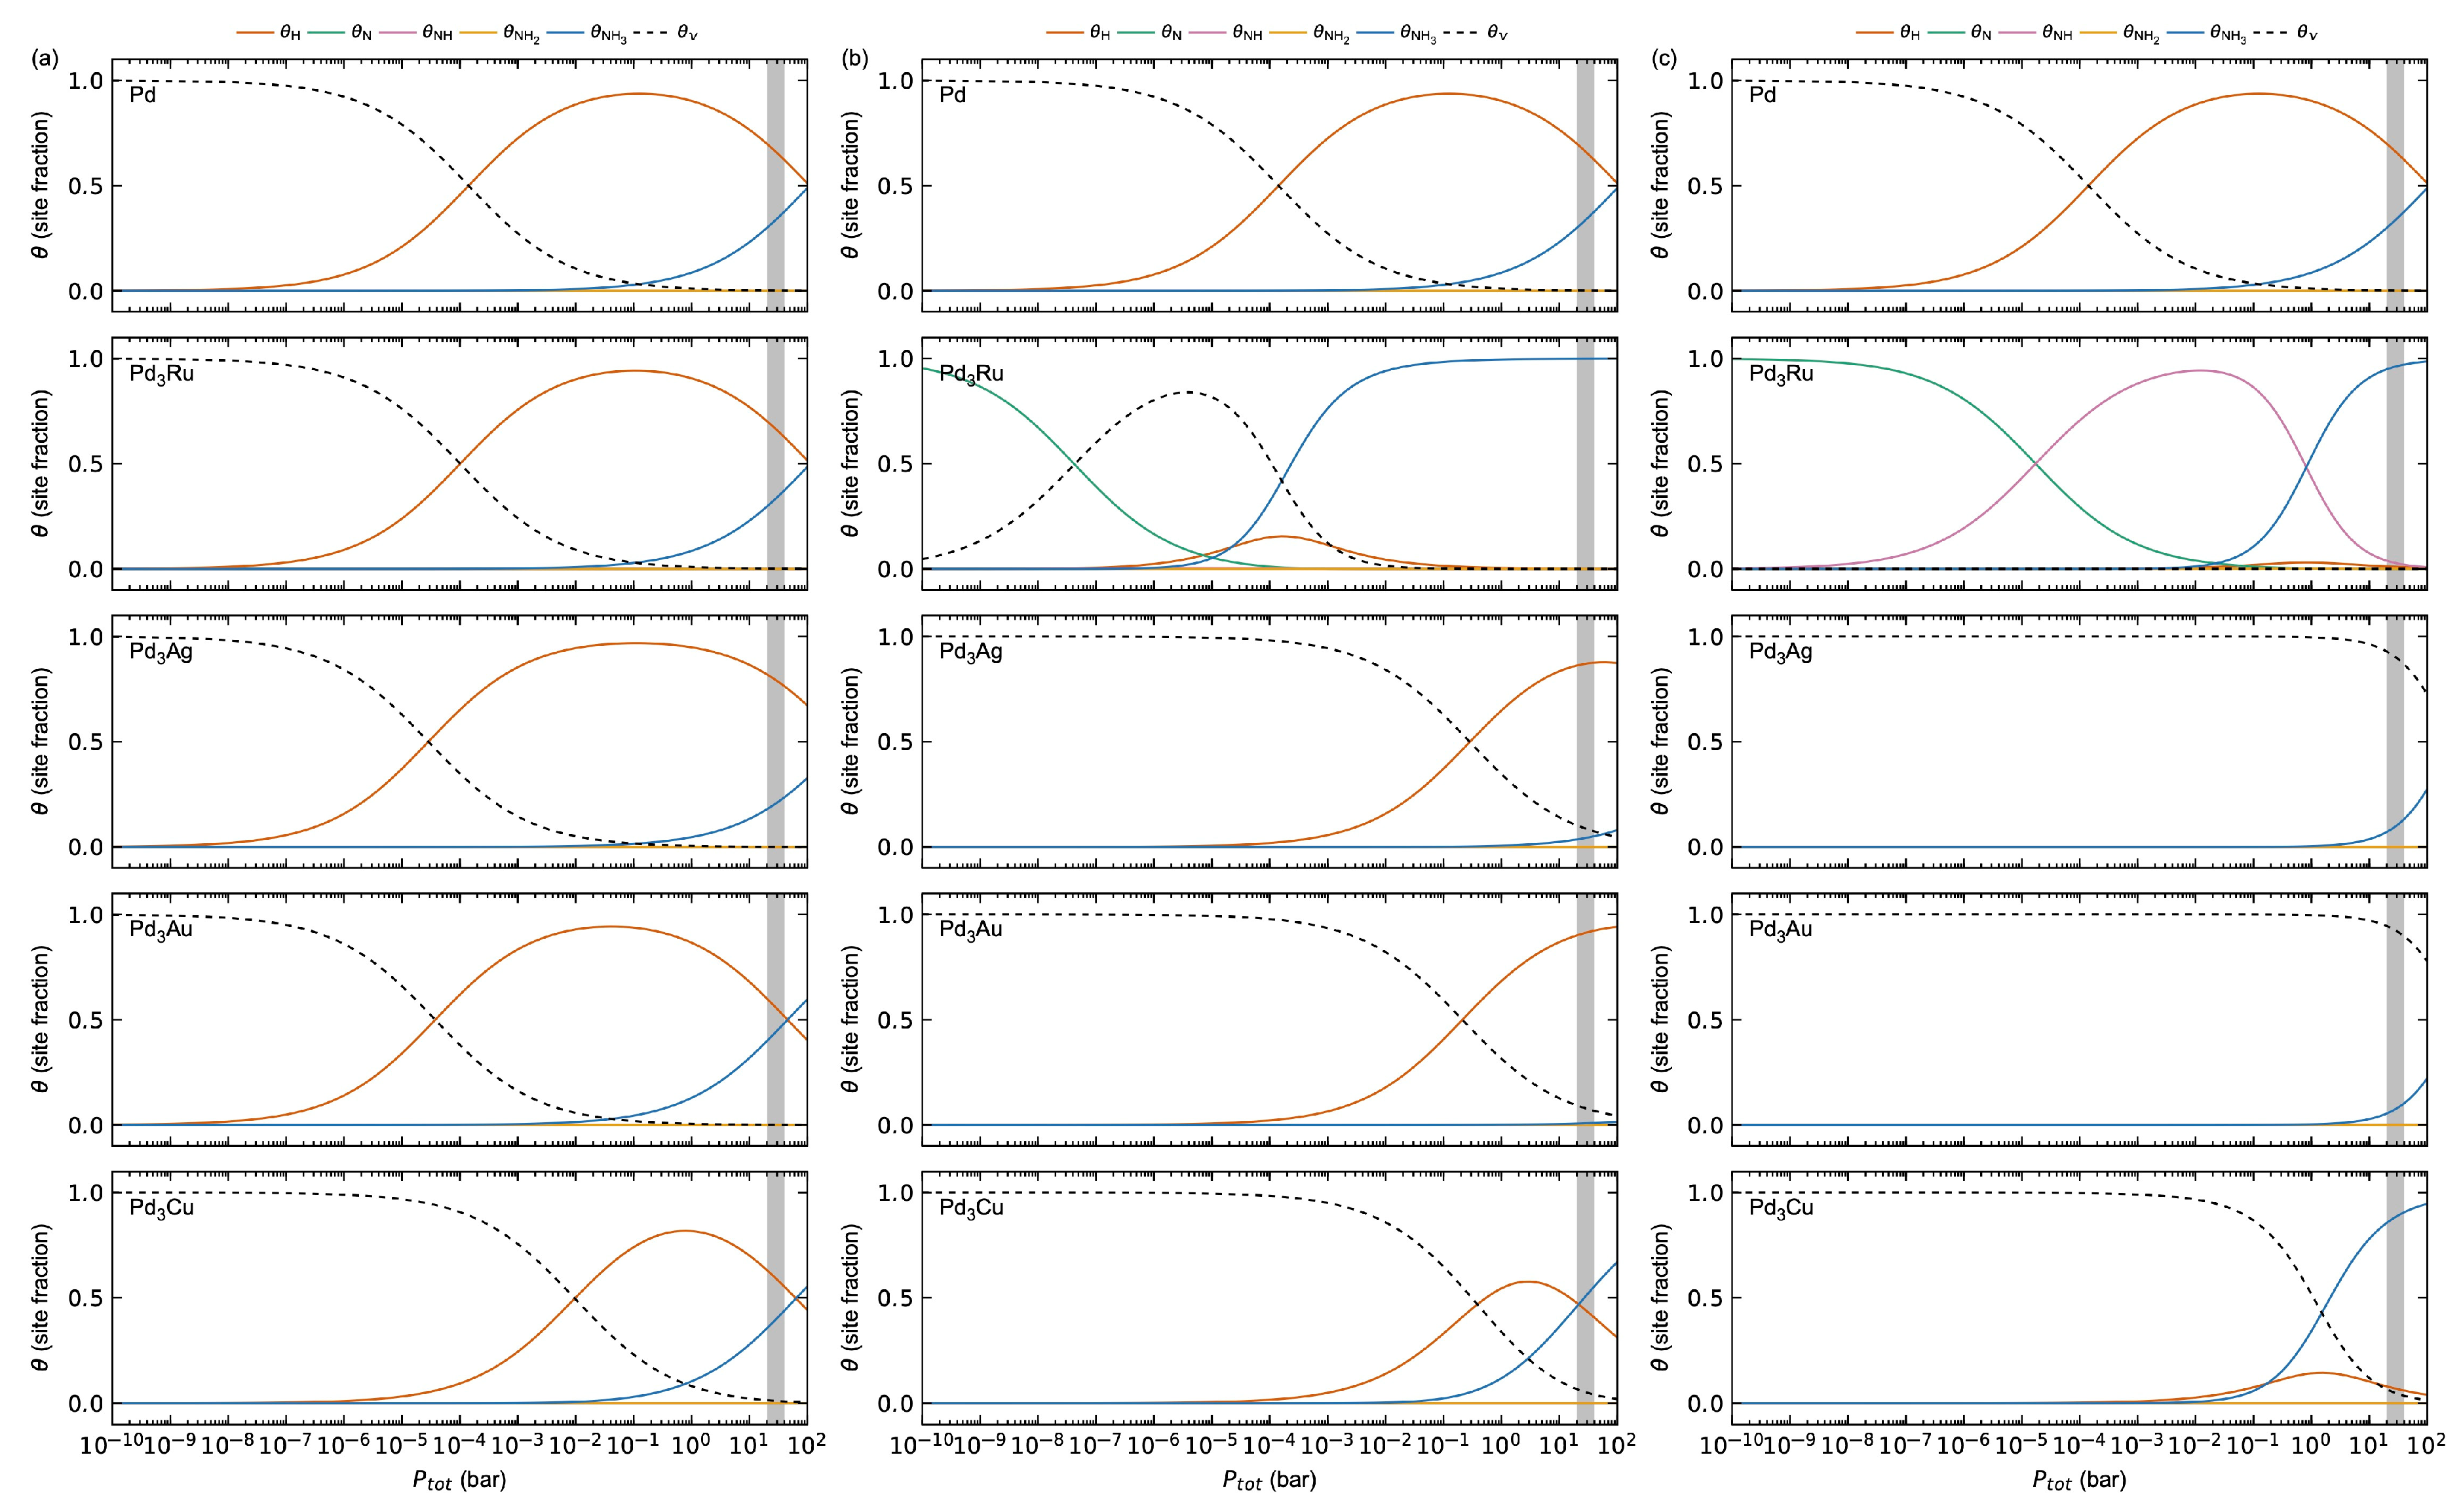
3.2.1. Adsorption-Induced Surface Segregation for Pd3M(1 1 1)

The results for the pure metal above suggest that Pd- or Ru-rich surfaces are expected to show significant surface coverage of H and NH3 at relevant operating conditions, while the presence of significant amounts of Ag, Au, or Cu on the surface could be detrimental for membrane performance. As previously discussed [20,26,27], surface termination of the Pd3M alloys can be influenced by adsorption-induced surface segregation over time during operation. Hence, we next determine surface segregation effects in the presence of H and NH3.
In the following, we investigate seven different Pd3M(1 1 1) surface configurations illustrated in Figure 7, as described in Refs. [26,27]. The numbering refers to the number of alloy atoms (Ag, Au, Cu, Ru) in each layer of the slab (in total four atoms per layer), starting from the layer at which adsorption occurs.
We first focus on the surface segregation due to hydrogen adsorption. The relative energy for the seven configurations with respect to θ H is shown in Figure 8. Pd3Ag and Pd3Au behave similarly. For low hydrogen surface coverages, Ag- and Au-rich surfaces are energetically most favoured. By increasing the hydrogen surface coverage, the Ag- and Au-terminated surfaces are destabilised relative to the Pd-terminated surfaces, where the (0211111) surface is the most stable at θ H = 1, in line with previous work [26,27]. Pd3Cu shows a tendency towards Pd-terminated surfaces for all hydrogen coverages, where the (0211111) configuration is the most stable for all coverages investigated. Pd3Ru, on the other hand, shows a more complex segregation behaviour. For all coverages, the most stable [27,52,53] configuration is (0004111) with Ru deep into the subsurface of our slab model, where the relative stability is insensitive to θ H . Interestingly, while the relative energies for (4000111), (3001111), and (2011111) become more negative with increasing θ H , the relative energies for (1111111), (0211111), and (0031111) become more positive with increasing θ H .
Next, we focus on the segregation with respect to NH3 surface coverage shown in Figure 9. We observe a preference for Ag-rich surfaces at θ N H 3 = 0.25, in agreement with previous work [27]. As for the hydrogen adsorption described above, Pd3Au behaves in the same way as Pd3Ag. Note that we do observe a small relative destabilisation of the Ag- and Au-terminated surfaces with increasing θ N H 3 , also apparent in our previous work on Pd3Ag [27]. Pd3Cu is found to be insensitive to θ N H 3 . Pd3Ru again shows a more complex segregation effect, where the Ru-terminated surfaces show a relative increased stability with increasing θ N H 3 , and the opposite is true for the Pd-terminated surface. Note, however, that the (0004111) configuration is the most stable for both θ N H 3 = 0 and θ N H 3 = 0.25 for Pd3Ru.
The results in Figure 8 and Figure 9 clearly indicate significant adsorption-induced surface segregation effects for the Pd3M alloys investigated. Since the surface Pd-to-M ratio is therefore expected to change gradually over time during operation, we will next assess the thermodynamics and kinetics as a function of surface M-content. In the following, we limit the study to the two extrema of fully Pd-covered or fully M-covered surfaces, as well as an intermediate model system with a nominal surface stoichiometry of Pd3M. For the Pd-terminated surfaces, we focus on the most stable surfaces under full hydrogen surface coverage, i.e., Pd3Ru (0004111), Pd3Ag (0211111), Pd3Au (0211111), and Pd3Cu (0211111). The M-terminated surfaces are modelled using the (4000111) configuration, while the Pd3M-terminated surfaces are modelled using the (1111111) configuration.

3.2.2. Adsorption Thermodynamics

The calculated adsorption enthalpies Δ H a d s , entropies T Δ S a d s , energies Δ G a d s , and vibrational frequencies for the different adsorbates on the Pd-terminated Pd3M surfaces are summarised in Table S1. All alloys show comparable adsorption thermodynamics, which is comparable to pure Pd. This is as expected, since the alloy surfaces are all Pd-terminated, and in line with previous work on Pd3Ag [27]. Note, however, that Pd3Cu show weaker H and NH3 adsorption. Ru and Cu show smaller DFT-calculated fcc lattice parameters of, respectively, 3.81 Å and 3.61 Å, compared to Pd (3.94 Å), while oppositely Ag and Au show larger fcc lattice parameters of, respectively, 4.14 Å and 4.16 Å, in line with the experimental observations [54]. Since alloying with larger fcc unit cell elements is found to lead to alloys with higher permeability [54], the changes in adsorption properties could also be due to the associated structural perturbations by substituting Pd with a different sized metal in the subsurface layer. Table 2 shows a summary of the calculated thermodynamics for the Pd3M-terminated Pd3M surfaces. We find a small decrease in the adsorption strength for H and NH3 for Pd3M-terminated Pd3Ag, Pd3Au, and Pd3Cu compared to the corresponding Pd-terminated surfaces in Table S1. For Pd3M-terminated Pd3Ru, we find a weaker adsorption of H and a stronger adsorption of NH3 compared to the corresponding Pd-terminated surface. Finally, the thermodynamics for the M-terminated Pd3M surfaces are summarised in Table S2. The thermodynamic properties are, as expected, comparable to the pure metals in Table 1.
The changes in thermodynamics with respect to the surface M-content indicate that an increase in surface M-content is expected to suppress the hydrogen surface coverage. The calculated surface coverages for H, N, NH, NH2, NH3, and empty surface sites (v) as a function of total pressure P t o t at 623 K on the different Pd3M surfaces are plotted in Figure 10. As described above, we assume a gas mixture of 20% H2, 60% NH3, and 20% N2. The results for Pd in Figure 2a are also plotted in the top panels in Figure 10 for comparison.
Focusing first on Pd-terminated surfaces in Figure 10a, Pd3Ru, Pd3Ag, and Pd3Cu all behave comparably to Pd, as expected from the thermodynamics in Table 1 and Table S1; θ H starts to increase for P t o t > 10−7, with a maximum of θ H ≈ 1 at P t o t ≈ 10−1. For larger total pressures, θ N H 3 starts to increase at the expense of θ H . Pd3Cu shows a sharper shape for the hydrogen maximum, i.e., a narrower adsorption window, and a lower maximum value ( θ H ≈ 0.8), in line with the weaker hydrogen adsorption described above. The shape of the θ N H 3 curve, on the other hand, is comparable with Pd and the other alloys. By increasing the M-content (Figure 10b,c), the position of the maximum hydrogen surface coverage is shifted towards higher Ptot for Pd3Ag, Pd3Au, and Pd3Cu. Interestingly, we find for Pd3Ru that the hydrogen coverage is significantly to fully suppressed for both the Pd3M- and M-terminated surfaces. This can be reasoned from the significant increase in the adsorption energy of NH3 in the presence of Ru on the surface. All Pd3Ag, Pd3Au, and Pd3Cu surfaces, as well as Pd-terminated Pd3Ru, show surface coverage only for H and NH3. Pd3M-terminated Pd3Ru show no surface coverage of NH, and none of the Pd3Ru surfaces show surface coverage of NH2.
The adsorption behaviour as a function of the surface M-content in Table 2, Tables S1 and S2 and Figure 10 can be further explained by the changes in electronic structure at the surface in Figure 11, Figures S1 and S2. As expected, all the Pd-terminated surfaces show comparable surface DOS to that of pure Pd (Figure S1), explaining their comparable adsorption behaviour. By increasing the surface M-content to Pd3M-termination (Figure 11) and M-termination (Figure S2), the surface DOS becomes increasingly more similar to their pure M counterparts, also as expected.

3.2.3. Adsorbate–Adsorbate Interactions and Co-Adsorption

Figure 12 shows a comparison of the calculated H (a–c) and NH3 (d–f) adsorption energies as a function of increasing surface coverage θ i for the different Pd3M surfaces investigated. The results for the Pd metal in Figure 5 are also plotted for comparison.
Pd-terminated Pd3Ru, Pd3Ag, and Pd3Au show comparable hydrogen adsorption energetics (Figure 12a,d), while Pd3Cu shows adsorption energies ~0.15 eV higher for all θ H , as expected from the adsorption thermodynamics in Table S1. In all cases, we find a hydrogen saturation coverage of θ H = 1, with a sudden increase in Δ G H a d s from θ H = 1 to 1.25, attributed to the associated increased adsorbate–adsorbate interactions when the hcp sites also start to be occupied, as described above. The corresponding adsorption energies for NH3 on the Pd-terminated surfaces are plotted in Figure 12d. Increasing the surface M-content results in significant changes in the adsorption behaviour. Pd3Ru shows a small increase in Δ G H a d s for Pd3M-termination (Figure 12b) and a decrease in Δ G H a d s for M-termination (Figure 12c) relative to Pd-termination. Pd3Ag, Pd3Au, and Pd3Cu all show a destabilisation of hydrogen adsorption with increased surface M-content, most pronounced for Pd3Ag and Pd3Au. Similarly, Pd3Ru shows a stabilisation of NH3 adsorption with increasing surface M-content (Figure 12e,f), while Pd3Ag and Pd3Au show a destabilisation effect of NH3 adsorption. The adsorption of NH3 on Pd3Cu is insensitive to the surface M-content. Note that since the values for θ N H 3 = 0.25 for Pd-termination are comparable to those for Pd, we expect an NH3 saturation coverage of θ N H 3 = 0.25. Hence, we have not explicitly investigated larger NH3 coverages.
The destabilisation effect for hydrogen adsorption with pre-adsorbed NH3 on the alloy surfaces is shown in Figure 13. For Pd-termination (Figure 13a), Pd3Ru, Pd3Ag, and Pd3Au behave comparable to Pd, while Pd3Cu shows a relative shift in the adsorption energies of ~0.15 eV. The corresponding expected hydrogen saturation coverage is θ H = 1 for all Pd-terminated surfaces. By increasing the surface M-content (Figure 13b,c), two trends can be observed. Firstly, we observe the same trend in the (de)stabilisation of hydrogen adsorption with increasing surface M-content, as described above (Figure 12). Secondly, the destabilisation effect with respect to pre-adsorbed NH3 is less pronounced for Ag, Au, and Cu, attributed to their weaker NH3 adsorption (Table 2, Tables S1 and S2) and in line with the results for the pure metals (Table 1 and Figure 5).

3.2.4. Hydrogen Dissociation Energetics

Finally, the calculated MEP for hydrogen dissociation without (black) and with NH3 pre-adsorbed on the surface (red) on Pd and the Pd3M alloy surfaces is plotted in Figure 14. For all alloy systems, we find that the H2 dissociation follows the same mechanism through a physiosorbed H2 on a top site, as for Pd. They also show comparable dissociation mechanisms through a physiosorbed H2 on a bridge-site due to the steric hindrance of the top sites, as described above.
Focusing first on the Pd-terminated surfaces (Figure 14a), we find a non-activated dissociation process on the clean alloy surfaces. Pd3Cu shows a less stable intermediate adsorbed H2 configuration, in line with the weaker adsorption energetics described above. NH3 present on the surface results in dissociation energy barriers of 0.24 eV, 019 eV, 0.18 eV, and 0.28 eV for Pd3Ru, Pd3Ag, Pd3Au, and Pd3Cu, respectively, comparable to that for Pd of 0.22 eV. For the fully M-covered surfaces (Figure 14c), the H2 dissociation without pre-adsorbed NH3 shifts towards an activated process for Pd3Ag, Pd3Au and Pd3Cu, while it remains a non-activated process for Pd3Ru, in line with the results for the pure metals in Figure 6. The H2 dissociation energy barriers become 1.27 eV, 1.13 eV, and 0.48 eV for M-terminated Pd3Ag, Pd3Au, and Pd3Cu, respectively. The corresponding H2 dissociation energy barriers with pre-adsorbed NH3 are 0.48 eV, 1.35 eV, 1.27 eV, and 0.46 eV for Pd3Ru, Pd3Ag, Pd3Au, and Pd3Cu, respectively. The dissociation energetics for Pd3M-termination (Figure 14b) are comparable to those for Pd-termination (Figure 14a), since the dissociation paths in all cases go through a surface Pd-site.

4. Conclusions

In this work, we have investigated hydrogen and ammonia co-adsorption phenomena on M(1 1 1) and Pd3M(1 1 1) (M = Pd, Ru, Ag, Au, Cu) surfaces using DFT calculations. We find a complex relation between adsorption properties with respect to surface metal stoichiometry and surface segregation, which is closely linked to the corresponding differences in electronic structure at the surface. For instance, while higher Ru-content on the surface is expected to give stronger hydrogen adsorption, hydrogen adsorption may still be hindered by competitive adsorption phenomena due to the stronger adsorption of NH3 and NH3-related species. The current results show that Pd metal or alloys with Pd-rich surfaces are expected to show the best surface hydrogen adsorption properties, including adsorption thermodynamics and hydrogen dissociation kinetics. Significant amounts of the alloying elements, Ru, Ag, Au, and Cu, investigated in this work tend to be detrimental for the surface hydrogen adsorption properties by either the destabilisation of hydrogen adsorption due to changes in electronic structure at the surface, the suppression of hydrogen adsorption due to the competitive adsorption of NH3, or the emergence of significant energy barriers for hydrogen dissociation at the surface due to either changes in electronic structure at the surface or steric hindrance in the presence of NH3.

Supplementary Materials

The following supporting information can be downloaded at: https://www.mdpi.com/article/10.3390/membranes15050135/s1, Table S1: Calculated adsorption thermodynamics on Pd-terminated Pd3M; Table S2: Calculated adsorption thermodynamics on M-terminated Pd3M; Table S3: Calculated adsorption thermodynamics on Pd using different functionals; Figure S1: Electronic density of states for adsorption on Pd-terminated Pd3M; Figure S2. Electronic density of states for adsorption on M-terminated Pd3M.

Author Contributions

Conceptualization, D.R.S., M.D.S. and T.A.P.; methodology, M.D.S. and T.A.P.; investigation, D.R.S.; resources, T.A.P.; data curation, D.R.S.; writing—original draft, D.R.S., M.D.S. and T.A.P.; writing—review and editing, D.R.S., M.D.S. and T.A.P.; visualization, D.R.S.; project administration, M.D.S. and T.A.P.; funding acquisition, M.D.S. and T.A.P. All authors have read and agreed to the published version of the manuscript.

Funding

This publication has been produced with support from the HYDROGENi Research Centre (hydrogeni.no), performed under the Norwegian research program FMETEKN. The authors acknowledge the industry partners in HYDROGENi for their contributions and the Research Council of Norway (Project No. 333118). The authors also acknowledge the Research Council of Norway for financial support through the project PALLAMONIA (Project No. 332357).

Data Availability Statement

The data presented in this study are available on request from the corresponding author.

Acknowledgments

Computational resources were provided by Sigma2 (Project No. NN19259K and NN9259K).

Conflicts of Interest

Author Marie D. Strømsheim was employed by the Hydrogen Mem-Tech AS. The remaining authors declare that the research was conducted in the absence of any commercial or financial relationships that could be construed as a potential conflict of interest.

References

  1. Kurien, C.; Mittal, M. Utilization of green ammonia as a hydrogen energy carrier for decarbonization in spark ignition engines. Int. J. Hydrogen Energy 2023, 48, 28803–28823. [Google Scholar] [CrossRef]
  2. Langella, G.; De Joannon, M.; Sabia, P.; Iodice, P.; Amoresano, A. Ammonia as a fuel for internal combustion engines: Latest advances and future challenges. J. Phys. Conf. Ser. 2022, 2385, 012036. [Google Scholar] [CrossRef]
  3. Qi, Y.; Liu, W.; Liu, S.; Wang, W.; Peng, Y.; Wang, Z. A review on ammonia-hydrogen fueled internal combustion engines. eTransportation 2023, 18, 100288. [Google Scholar] [CrossRef]
  4. Tornatore, C.; Marchitto, L.; Sabia, P.; De Joannon, M. Ammonia as Green Fuel in Internal Combustion Engines: State-of-the-Art and Future Perspectives. Front. Mech. Eng. 2022, 8, 944201. [Google Scholar] [CrossRef]
  5. Valera-Medina, A.; Amer-Hatem, F.; Azad, A.K.; Dedoussi, I.C.; De Joannon, M.; Fernandes, R.X.; Glarborg, P.; Hashemi, H.; He, X.; Mashruk, S.; et al. Review on Ammonia as a Potential Fuel: From Synthesis to Economics. Energy Fuels 2021, 35, 6964–7029. [Google Scholar] [CrossRef]
  6. Rathore, S.S.; Biswas, S.; Fini, D.; Kulkarni, A.P.; Giddey, S. Direct ammonia solid-oxide fuel cells: A review of progress and prospects. Int. J. Hydrogen Energy 2021, 46, 35365–35384. [Google Scholar] [CrossRef]
  7. Dhawale, D.S.; Biswas, S.; Kaur, G.; Giddey, S. Challenges and advancement in direct ammonia solid oxide fuel cells: A review. Inorg. Chem. Front. 2023, 10, 6176–6192. [Google Scholar] [CrossRef]
  8. Cheliotis, M.; Boulougouris, E.; Trivyza, N.L.; Theotokatos, G.; Livanos, G.; Mantalos, G.; Stubos, A.; Stamatakis, E.; Venetsanos, A. Review on the Safe Use of Ammonia Fuel Cells in the Maritime Industry. Energies 2021, 14, 3023. [Google Scholar] [CrossRef]
  9. Dimitriou, P.; Javaid, R. A review of ammonia as a compression ignition engine fuel. Int. J. Hydrogen Energy 2020, 45, 7098–7118. [Google Scholar] [CrossRef]
  10. Keller, M.; Koshi, M.; Otomo, J.; Iwasaki, H.; Mitsumori, T.; Yamada, K. Thermodynamic evaluation of an ammonia-fueled combined-cycle gas turbine process operated under fuel-rich conditions. Energy 2020, 194, 116894. [Google Scholar] [CrossRef]
  11. Jeerh, G.; Zhang, M.; Tao, S. Recent progress in ammonia fuel cells and their potential applications. J. Mater. Chem. A 2021, 9, 727–752. [Google Scholar] [CrossRef]
  12. Miyaoka, H.; Miyaoka, H.; Ichikawa, T.; Ichikawa, T.; Kojima, Y. Highly purified hydrogen production from ammonia for PEM fuel cell. Int. J. Hydrogen Energy 2018, 43, 14486–14492. [Google Scholar] [CrossRef]
  13. Okanishi, T.; Okura, K.; Srifa, A.; Muroyama, H.; Matsui, T.; Kishimoto, M.; Saito, M.; Iwai, H.; Yoshida, H.; Saito, M.; et al. Comparative Study of Ammonia-fueled Solid Oxide Fuel Cell Systems. Fuel Cells 2017, 17, 383–390. [Google Scholar] [CrossRef]
  14. García-García, F.R.; Ma, Y.H.; Rodríguez-Ramos, I.; Guerrero-Ruiz, A. High purity hydrogen production by low temperature catalytic ammonia decomposition in a multifunctional membrane reactor. Catal. Commun. 2008, 9, 482–486. [Google Scholar] [CrossRef]
  15. Collins, J.P.; Way, J.D. Catalytic decomposition of ammonia in a membrane reactor. J. Membr. Sci. 1994, 96, 259–274. [Google Scholar] [CrossRef]
  16. Itoh, N.; Oshima, A.; Suga, E.; Sato, T. Kinetic enhancement of ammonia decomposition as a chemical hydrogen carrier in palladium membrane reactor. Catal. Today 2014, 236, 70–76. [Google Scholar] [CrossRef]
  17. Cechetto, V.; Di Felice, L.; Medrano, J.A.; Makhloufi, C.; Zuniga, J.; Gallucci, F. H2 production via ammonia decomposition in a catalytic membrane reactor. Fuel Process. Technol. 2021, 216, 106772. [Google Scholar] [CrossRef]
  18. Cechetto, V.; Agnolin, S.; Di Felice, L.; Pacheco Tanaka, A.; Llosa Tanco, M.; Gallucci, F. Metallic Supported Pd-Ag Membranes for Simultaneous Ammonia Decomposition and H2 Separation in a Membrane Reactor: Experimental Proof of Concept. Catalysts 2023, 13, 920. [Google Scholar] [CrossRef]
  19. Zhang, J.; Xu, H.; Li, W. High-purity COx-free H2 generation from NH3 via the ultra permeable and highly selective Pd membranes. J. Membr. Sci. 2006, 277, 85–93. [Google Scholar] [CrossRef]
  20. Peters, T.A.; Polfus, J.M.; Stange, M.; Veenstra, P.; Nijmeijer, A.; Bredesen, R. H 2 flux inhibition and stability of Pd-Ag membranes under exposure to trace amounts of NH 3. Fuel Process. Technol. 2016, 152, 259–265. [Google Scholar] [CrossRef]
  21. Zhang, Z.; Liguori, S.; Fuerst, T.F.; Way, J.D.; Wolden, C.A. Efficient Ammonia Decomposition in a Catalytic Membrane Reactor To Enable Hydrogen Storage and Utilization. ACS Sustain. Chem. Eng. 2019, 7, 5975–5985. [Google Scholar] [CrossRef]
  22. Cechetto, V.; Di Felice, L.; Gallucci, F. Advances and Perspectives of H2 Production from NH3 Decomposition in Membrane Reactors. Energy Fuels 2023, 37, 10775–10798. [Google Scholar] [CrossRef] [PubMed]
  23. Clark, D.; Malerød-Fjeld, H.; Budd, M.; Yuste-Tirados, I.; Beeaff, D.; Aamodt, S.; Nguyen, K.; Ansaloni, L.; Peters, T.; Vestre, P.K.; et al. Single-step hydrogen production from NH3, CH4, and biogas in stacked proton ceramic reactors. Science 2022, 376, 390–393. [Google Scholar] [CrossRef]
  24. Peters, T.A.; Polfus, J.M.; van Berkel, F.P.F.; Bredesen, R. Interplay between propylene and H2S co-adsorption on the H2 flux characteristics of Pd-alloy membranes employed in propane dehydrogenation (PDH) processes. Chem. Eng. J. 2016, 304, 134–140. [Google Scholar] [CrossRef]
  25. Svenum, I.-H.; Herron, J.A.; Mavrikakis, M.; Venvik, H.J. Pd3Ag(111) as a Model System for Hydrogen Separation Membranes: Combined Effects of CO Adsorption and Surface Termination on the Activation of Molecular Hydrogen. Top. Catal. 2020, 63, 750–761. [Google Scholar] [CrossRef]
  26. Svenum, I.-H.; Herron, J.A.; Mavrikakis, M.; Venvik, H.J. Adsorbate-induced segregation in a PdAg membrane model system: Pd3Ag(111). Catal. Today 2012, 193, 111–119. [Google Scholar] [CrossRef]
  27. Småbråten, D.R.; Strømsheim, M.D.; Peters, T. Hydrogen and NH3 co-adsorption on Pd–Ag membranes. Int. J. Hydrogen Energy 2024, 72, 475–484. [Google Scholar] [CrossRef]
  28. Blöchl, P.E. Projector augmented-wave method. Phys. Rev. B 1994, 50, 17953–17979. [Google Scholar] [CrossRef]
  29. Kresse, G.; Furthmüller, J. Efficient iterative schemes for ab initio total-energy calculations using a plane-wave basis set. Phys. Rev. B 1996, 54, 11169–11186. [Google Scholar] [CrossRef]
  30. Kresse, G.; Joubert, D. From ultrasoft pseudopotentials to the projector augmented-wave method. Phys. Rev. B 1999, 59, 1758–1775. [Google Scholar] [CrossRef]
  31. Perdew, J.P.; Burke, K.; Ernzerhof, M. Generalized Gradient Approximation Made Simple. Phys. Rev. Lett. 1996, 77, 3865–3868. [Google Scholar] [CrossRef]
  32. Henkelman, G.; Uberuaga, B.P.; Jónsson, H. A climbing image nudged elastic band method for finding saddle points and minimum energy paths. J. Chem. Phys. 2000, 113, 9901–9904. [Google Scholar] [CrossRef]
  33. Henkelman, G.; Jónsson, H. Improved tangent estimate in the nudged elastic band method for finding minimum energy paths and saddle points. J. Chem. Phys. 2000, 113, 9978–9985. [Google Scholar] [CrossRef]
  34. Chase, M.W., Jr. NIST-JANAF Thermochemical Tables, Fourth Edition. J. Phys. Chem. Ref. Data Monogr. 1998, 9, 1–1951. [Google Scholar]
  35. Campbell, C.T.; Sellers, J.R.V. The Entropies of Adsorbed Molecules. J. Am. Chem. Soc. 2012, 134, 18109–18115. [Google Scholar] [CrossRef]
  36. Carabineiro, S.A.C.; Matveev, A.V.; Gorodetskii, V.V.; Nieuwenhuys, B.E. Selective oxidation of ammonia over Ru(0001). Surf. Sci. 2004, 555, 83–93. [Google Scholar] [CrossRef]
  37. Danielson, L.R.; Dresser, M.J.; Donaldson, E.E.; Dickinson, J.T. Adsorption and desorption of ammonia, hydrogen, and nitrogen on ruthenium (0001). Surf. Sci. 1978, 71, 599–614. [Google Scholar] [CrossRef]
  38. Liu, R.; Shen, W.; Zhang, J.; Li, M. Adsorption and dissociation of ammonia on Au(111) surface: A density functional theory study. Appl. Surf. Sci. 2008, 254, 5706–5710. [Google Scholar] [CrossRef]
  39. Jiang, Z.; Qin, P.; Fang, T. Mechanism of ammonia decomposition on clean and oxygen-covered Cu (1 1 1) surface: A DFT study. Chem. Phys. 2014, 445, 59–67. [Google Scholar] [CrossRef]
  40. Kulkarni, S.R.; Realpe, N.; Yerrayya, A.; Velisoju, V.K.; Sayas, S.; Morlanes, N.; Cerillo, J.; Katikaneni, S.P.; Paglieri, S.N.; Solami, B.; et al. Elucidating the rate-determining step of ammonia decomposition on Ru-based catalysts using ab initio-grounded microkinetic modeling. Catal. Sci. Technol. 2023, 13, 2026–2037. [Google Scholar] [CrossRef]
  41. Perdew, J.P.; Ruzsinszky, A.; Csonka, G.I.; Vydrov, O.A.; Scuseria, G.E.; Constantin, L.A.; Zhou, X.; Burke, K. Restoring the Density-Gradient Expansion for Exchange in Solids and Surfaces. Phys. Rev. Lett. 2008, 100, 136406. [Google Scholar] [CrossRef]
  42. Hammer, B.; Hansen, L.B.; Nørskov, J.K. Improved adsorption energetics within density-functional theory using revised Perdew-Burke-Ernzerhof functionals. Phys. Rev. B 1999, 59, 7413–7421. [Google Scholar] [CrossRef]
  43. Zhang, Y.; Yang, W. Comment on “Generalized Gradient Approximation Made Simple”. Phys. Rev. Lett. 1998, 80, 890. [Google Scholar] [CrossRef]
  44. Furness, J.W.; Kaplan, A.D.; Ning, J.; Perdew, J.P.; Sun, J. Accurate and Numerically Efficient r2 SCAN Meta-Generalized Gradient Approximation. J. Phys. Chem. Lett. 2020, 11, 8208–8215. [Google Scholar] [CrossRef]
  45. Grimme, S.; Ehrlich, S.; Goerigk, L. Effect of the damping function in dispersion corrected density functional theory. J. Comput. Chem. 2011, 32, 1456–1465. [Google Scholar] [CrossRef]
  46. Hamada, I. Van der Waals density functional made accurate. Phys. Rev. B Condens. Matter Mater. Phys. 2014, 89, 121103. [Google Scholar] [CrossRef]
  47. Klimeš, J.; Bowler, D.R.; Michaelides, A. Chemical accuracy for the van der Waals density functional. J. Phys. Condens. Matter 2010, 22, 022201. [Google Scholar] [CrossRef] [PubMed]
  48. Klimeš, J.; Bowler, D.R.; Michaelides, A. Van der Waals density functionals applied to solids. Phys. Rev. B 2011, 83, 195131. [Google Scholar] [CrossRef]
  49. Polfus, J.M.; Peters, T.; Bredesen, R.; Løvvik, O.M. Vacancy diffusion in palladium hydrides. Phys. Chem. Chem. Phys. 2021, 23, 13680–13686. [Google Scholar] [CrossRef]
  50. Hammer, B.; Nørskov, J.K. Theoretical surface science and catalysis—Calculations and concepts. In Advances in Catalysis; Impact of Surface Science on Catalysis; Academic Press: Cambridge, MA, USA, 2000; Volume 45, pp. 71–129. [Google Scholar]
  51. Karimadom, B.R.; Sermiagin, A.; Meyerstein, D.; Zidki, T.; Mizrahi, A.; Bar-Ziv, R.; Kornweitz, H. Hydrogen adsorption on various transition metal (111) surfaces in water: A DFT forecast. Phys. Chem. Chem. Phys. 2024, 26, 7647–7657. [Google Scholar] [CrossRef]
  52. Dong, W.; Hafner, J. H2 dissociative adsorption on Pd(111). Phys. Rev. B 1997, 56, 15396–15403. [Google Scholar] [CrossRef]
  53. Dipojono, H.K.; Padama, A.A.B.; Ozawa, N.; Nakanishi, H.; Kasai, H. A First Principles Study on Dissociation and Adsorption Processes of H2 on Pd3Ag(111) Surface. Jpn. J. Appl. Phys. 2010, 49, 115702. [Google Scholar] [CrossRef]
  54. Peters, T.A.; Kaleta, T.; Stange, M.; Bredesen, R. Development of thin binary and ternary Pd-based alloy membranes for use in hydrogen production. J. Membr. Sci. 2011, 383, 124–134. [Google Scholar] [CrossRef]
Figure 1. Representative calculated (1 1 1) surface atomic structures of Pd3Au for (a) a clean surface and the adsorption of (b) H, (c) N, (d) NH, (e) NH2, and (f) NH3. Gray and yellow atoms correspond to Pd and M, respectively.
Membranes 15 00135 g001
Figure 2. Calculated surface coverages θi on the (1 1 1) surfaces of (a) Pd, (b) Ru, (c) Ag, (d) Au, and (e) Cu, assuming a gas composition of x NH 3 = x N 2 = 0.2 and x H 2 = 0.6 at T = 623 K. Typical operating conditions for the Pd-alloy membranes of 20–40 bar are marked in grey.
Membranes 15 00135 g002
Figure 3. Atomically resolved electronic density of states (DOS) at the surface for a clean surface and with the adsorbates on (a) Pd, (b) Ru, (c) Ag, (d) Au, and (e) Cu. Only the DOS for the adsorbates and the nearest metal surface atoms are shown. The DOS are scaled per atom.
Membranes 15 00135 g003
Figure 4. Calculated adsorption Gibbs energy for (a) H and (b) NH3 as a function of surface coverage θi at T = 623 K and p H 2 = p NH 3 = p0 = 1 bar on the pure metal surfaces.
Membranes 15 00135 g004
Figure 5. Calculated hydrogen adsorption energy for a clean surface (black) and with θ NH 3 = 0.25 pre-adsorbed on the surface (red) for (a) Pd, (b) Ru, (c) Ag, (d) Au, and (e) Cu as a function of hydrogen surface coverage θH at T = 623 K and p H 2 = p NH 3 = p0 = 1 bar.
Membranes 15 00135 g005
Figure 6. Calculated minimum energy path (MEP) for hydrogen dissociation for a clean surface (black) and with θ N H 3 = 0.25 pre-adsorbed on the surface (red) for (a) Pd, (b) Ru, (c) Ag, (d) Au, and (e) Cu.
Membranes 15 00135 g006
Figure 7. The different Pd3M(1 1 1) surface configuration investigated, (a) (4001111), (b) (3001111, (c) 2011111, (d) 1111111, (e) 0211111, (f) 0031111, and (g) 0004111. The numbers refer to the number of M-atoms per atomic layer (in total four atoms per layer), staring from the top surface layer where adsorption occurs. Grey atoms correspond to Pd; yellow atoms correspond to the alloying element.
Membranes 15 00135 g007
Figure 8. Calculated segregation energies as a function of hydrogen surface coverage θH for (a) Pd3Ru, (b) Pd3Ag, (c) Pd3Au, and (d) Pd3Cu.
Membranes 15 00135 g008
Figure 9. Calculated segregation energies as a function of NH3 surface coverage θ N H 3 for (a) Pd3Ru, (b) Pd3Ag, (c) Pd3Au, and (d) Pd3Cu.
Membranes 15 00135 g009
Figure 10. Calculated surface coverage on the (1 1 1) surfaces of Pd and (a) Pd-terminated, (b) Pd3M-terminated, and (c) M-terminated Pd3M, assuming a gas composition of x N H 3 = x N 2 = 0.2 and x H 2 = 0.6 at T = 623 K. From top to bottom: Pd, Pd3Ru, Pd3Ag, Pd3Au, and Pd3Cu. Typical operating conditions for the Pd-alloy membranes of 20–40 bar are marked in grey.
Membranes 15 00135 g010
Figure 11. Atomically resolved electronic density of states (DOS) at the surface for a clean surface and with the adsorbates on (a) Pd and Pd3M-terminated (b) Pd3Ru, (c) Pd3Ag, (d) Pd3Au, and (e) Pd3Cu. Only the DOS for the adsorbates and the nearest metal surface atoms are shown. The DOS are scaled per atom.
Membranes 15 00135 g011
Figure 12. Calculated adsorption Gibbs energy for (ac) H and (df) NH3 as a function of surface coverage θi at T = 623 K and p H 2 = p NH 3 = p0 = 1 bar on the surface of Pd and (a,d) Pd-terminated, (b,e) Pd3M-terminated, and (c,f) M-terminated Pd3M.
Membranes 15 00135 g012
Figure 13. Calculated hydrogen adsorption energy for a clean surface (black) and with θ NH 3 = 0.25 pre-adsorbed on the surface (red) of Pd and (a) Pd-terminated, (b) Pd3M-terminated, and (c) M-terminated Pd3M, as a function of hydrogen surface coverage θH at T = 623 K and p H 2 = p NH 3 = p0 = 1 bar. From top to bottom: Pd, Pd3Ru, Pd3Ag, Pd3Au, and Pd3Cu.
Membranes 15 00135 g013
Figure 14. Calculated minimum energy path (MEP) for hydrogen dissociation for a clean surface (black) and with θ N H 3 = 0.25 pre-adsorbed on the surface (red) for Pd and (a) Pd-terminated, (b) Pd3M-terminated, and (c) M-terminated Pd3M. From top to bottom: Pd, Pd3Ru, Pd3Ag, Pd3Au, and Pd3Cu.
Membranes 15 00135 g014
Table 1. Calculated adsorption thermodynamics for H- and NH3-related species on the (1 1 1) metal surfaces at T = 623 K and p H 2 = p N H 3 = p 0 = 1 bar. The adsorption entropy of NH3 was obtained from the empirical relations in Ref. [35] (marked with *).
SpeciesSite Δ H a d s
(eV)
T Δ S a d s
(eV)
Δ G a d s
(eV)
ν i (cm−1)
Pd
Hfcc−0.67−0.42−0.25964, 841, 841
Nfcc1.470.181.28503, 494, 493
NHfcc0.60−0.230.843377, 714, 714, 503, 437, 437
NH2bridge0.11−0.590.703478, 3374, 1449, 673, 637, 575, 435, 320, 161
NH3top−0.84−0.61 *−0.20-
Ru
Hfcc−0.66−0.42−0.241122, 823, 818
Nfcc0.680.210.47514, 384, 384
NHfcc−0.20−0.220.013431, 693, 687, 572, 370, 368
NH2bridge−0.44−0.590.153452, 3364, 1488, 674, 628, 620, 460, 307, 155
NH3top−0.92−0.61−0.31-
Ag
Hfcc0.07−0.400.47799, 771, 771
Nfcc3.970.223.75396, 396, 395
NHfcc2.23−0.182.413427, 555, 555, 398, 354, 354
NH2bridge0.81−0.511.333511, 3409, 1481, 527, 502, 490, 350, 242, 112
NH3top−0.42−0.61 *0.19-
Au
Hfcc0.03−0.390.42825, 678, 678
Nfcc3.650.203.45454, 454, 424
NHfcc2.20−0.232.433445, 759, 759, 455, 455, 422
NH2bridge1.04−0.571.613537, 3425, 1468, 693, 633, 582, 366, 282, 156
NH3top−0.41−0.61 *0.20-
Cu
Hfcc−0.29−0.420.141042, 854, 854
Nfcc2.420.182.23508, 482, 482
NHfcc0.99−0.211.203449, 608, 607, 513, 408, 407
NH2bridge0.27−0.550.823496, 3404, 1496, 575, 559, 552, 419, 287, 127
NH3top−0.49−0.61 *0.11-
Table 2. Calculated adsorption thermodynamics for hydrogen and NH3-related species on the Pd3M-terminated (1 1 1) Pd3M surfaces at T = 623 K and p H 2 = p N H 3 = p 0 = 1 bar. The adsorption entropy of NH3 was obtained from the empirical relations in Ref. [35].
SpeciesSite Δ H a d s
(eV)
T Δ S a d s
(eV)
Δ G a d s
(eV)
ν i (cm−1)
Pd3Ru
Hfcc−0.61−0.41−0.191076, 1074, 431
Nfcc0.620.210.41566, 531, 134
NHfcc0.01−0.210.233375, 725, 538, 488, 442, 281
NH2bridge−0.42−0.590.173493, 3385, 1447, 647, 564, 430, 426, 209, 119
NH3top−1.16−0.61−0.56-
Pd3Ag
Hfcc−0.45−0.40−0.051076, 1074, 431
Nfcc2.530.242.29566, 531, 134
NHfcc1.43−0.201.633375, 725, 538, 488, 442, 281
NH2bridge0.63−0.531.163493, 3385, 1447, 647, 564, 430, 426, 209, 119
NH3top−0.48−0.610.13-
Pd3Au
Hfcc−0.47−0.41−0.06964, 920, 662
Nfcc2.360.192.17511, 502, 378
NHfcc1.36−0.221.583390, 715, 684, 479, 430, 396
NH2bridge0.67−0.571.233508, 3398, 1446, 627, 607, 568, 411, 271, 146
NH3top−0.39−0.610.22-
Pd3Cu
Hfcc−0.46−0.42−0.041045, 898, 740
Nfcc2.230.192.04517, 492, 419
NHfcc1.05−0.221.273393, 701, 665, 490, 425, 403
NH2bridge0.36−0.570.933478, 3379, 1462, 603, 590, 526, 415, 300, 149
NH3top−0.64−0.61−0.03-
Disclaimer/Publisher’s Note: The statements, opinions and data contained in all publications are solely those of the individual author(s) and contributor(s) and not of MDPI and/or the editor(s). MDPI and/or the editor(s) disclaim responsibility for any injury to people or property resulting from any ideas, methods, instructions or products referred to in the content.

