Article

Hydrogen (H2)/Toluene (TOL) Separation via One and Two Stages of the Bis(triethoxysily)ethane (BTESE) Membranes

1
eSep Inc., Keihanna Open Innovation Center@Kyoto (KICK), Annex 320, 7-5-1, Seikadai, Seika-cho, Soraku-gun, Kyoto 619-0238, Japan
2
Department of Chemical Engineering, Hiroshima University, 1-4-1 Kagamiyama, Higashihiroshima 739-8527, Japan
*
Authors to whom correspondence should be addressed.
Membranes 2024, 14(8), 165; https://doi.org/10.3390/membranes14080165
Submission received: 7 May 2024 / Revised: 12 July 2024 / Accepted: 23 July 2024 / Published: 25 July 2024
(This article belongs to the Section Membrane Applications for Gas Separation)

Abstract

:
The separation ability of bis(triethoxysilyl)ethane (BTESE) membranes for hydrogen (H2) purification from hydrogen (H2)/toluene (TOL) gas mixtures after a methylcyclohexane (MCH) dehydrogenation process was investigated via one-stage and two-stage membrane processes. This study revealed that BTESE membranes of varied pore sizes (0.4, 0.5, and 0.7 nm) in a one-stage configuration can manage to achieve a H2 purity ~99.9%. However, the TOL concentrations fell within a wide range, ranging from 280 to 5441 ppm. A primary goal of this research was to lower the TOL concentration in the permeate stream below 200 ppm. Hence, by applying the two-stage membrane, it was demonstrated that the TOL concentration in the permeate stream could be lowered below 200 ppm.

1. Introduction

Hydrogen (H2) is one of the potential renewable energy sources of the future [1,2,3,4,5]. The International Energy Agency (IEA) predicts that the world’s need for H2 will increase seven-fold to 520 Mt by 2070 [6]. Various types of inorganic membranes, such as metal, molecular sieving carbon, zeolites, and ceramic membranes [7,8,9], have been considered for H2 separation. As one of the new classes of membranes, organosilica membranes, especially BTESE-derived membranes, have been extensively investigated for the last decade since they show excellent H2 permeance (H2 permeance > 10−6 mol m−2 s−1 Pa−1 and H2/TOL > 1000) [10,11]. In the present study, the pore size distribution of our BTESE membranes was controlled by altering the number of coating layers of the BTESE solution [12,13] instead of focusing on different water ratios [14,15,16], firing temperature [17,18], doping with ZIF-7 [19], and copolymerization [20]. Previously, our membrane was successfully used in the separation of DMF and H2O [13]. Hence, we believe our in-house membranes are capable of H2/TOL separation as well.
Since H2 cannot be obtained directly from nature, it is a secondary energy source. Green H2 is produced by water electrolysis using electricity generated from solar or wind energy, whereas blue hydrogen is extracted alongside the CO2 emitted from the hydrocarbons in fossil fuels [21,22,23]. For both types of H2, the greatest difficulties in expanding the use of H2 energy are safe storage and transportation. To overcome this barrier, organic chemical hydrides such as methylcyclohexane (MCH) are proposed as hydrogen carriers because of their ease of handling.
It is well known that MCH, which catalytically decomposes to H2 and TOL, liquefies at room temperature and has a volume equivalent to several hundred thousandths of H2. Since MCH is stable at normal temperatures, it can be utilized in the existing fuel supply chain, including gas stations. Hence, H2 and TOL need to be separated at the use site. This is achieved by vaporizing the MCH and catalytic decomposition at 250–300 °C, followed by purification or separation of H2 and TOL using a ceramic membrane [14,24,25,26,27,28,29,30]. To achieve a high purity of H2, a typical process includes the condensation of decomposed MCH to separate gas (H2) and liquid product (TOL) from the MCH dehydrogenation reaction, followed by the purification of H2 gas from that containing saturated TOL vapor.
However, most of the researchers are focusing on the BTESE and silica membrane reactors coupled with catalysts [14,25,26,27,28] for the dehydrogenation of methylcyclohexane (MCH) to toluene (TOL). Only limited studies have been reported focusing on the production of high-purity H2 from the H2/TOL mixture. In the present study, we used H2 and TOL as our feed components instead of MCH. It is well known that H2 separation membranes can be used in two ways. The first approach involves a membrane for a one-stage purification process after the MCH dehydrogenation reaction. However, a one-stage membrane of extremely high selectivity is required to achieve the minimal specification of fuel cell application. So as another approach, a two-stage membrane is proposed for further purification. As the main goal of this study is to achieve H2 purity > 99.9% and a TOL concentration in the permeate stream below 200 ppm, the present study will only focus on the one-stage and two-stage BTESE membrane systems by using our own in-house-produced BTESE membrane.

2. Materials and Methods

2.1. Preparation of BTESE-Derived Sols and Membranes

The organosilica precursor BTESE was dissolved in an ethanol (EtOH) solution. After that, under vigorous agitation, dropwise additions of nitric acid (HNO3) and H2O were made with the final molar ratios of BTESE/H2O/HNO3 = 1/240/0.2. The concentration of BTESE was maintained at 5 weight percent (wt.%) by adjusting the amount of EtOH added to the solutions. After 6 h of continuous stirring at 25 °C, the solution was stored in a closed system to allow BTESE-derived organosilica sols to develop. It was then aged for 8 days at 50 °C before being used as a top layer.
Porous α-alumina tubes with an outer diameter of 12 mm and 400 mm in length, 50% porosity, and an average pore size of 3 µm were used as a support. The porous support was supplied by IWAO JIKI KYOGYO Co., Ltd., Saga Prefecture, Japan [12]. The exterior of the porous support was first covered with α-alumina particles, which had an average diameter of 0.2 µm. After that, the surface was fired for ten minutes at 550 °C to produce an α-alumina particle layer. Ultimately, the BTESE solution was coated, dried, and fired for 30 min at 300 °C under air to form the BTESE-derived organosilica top layer. Our previous manuscripts [12,13] provide a comprehensive overview of the membrane fabrication procedure.
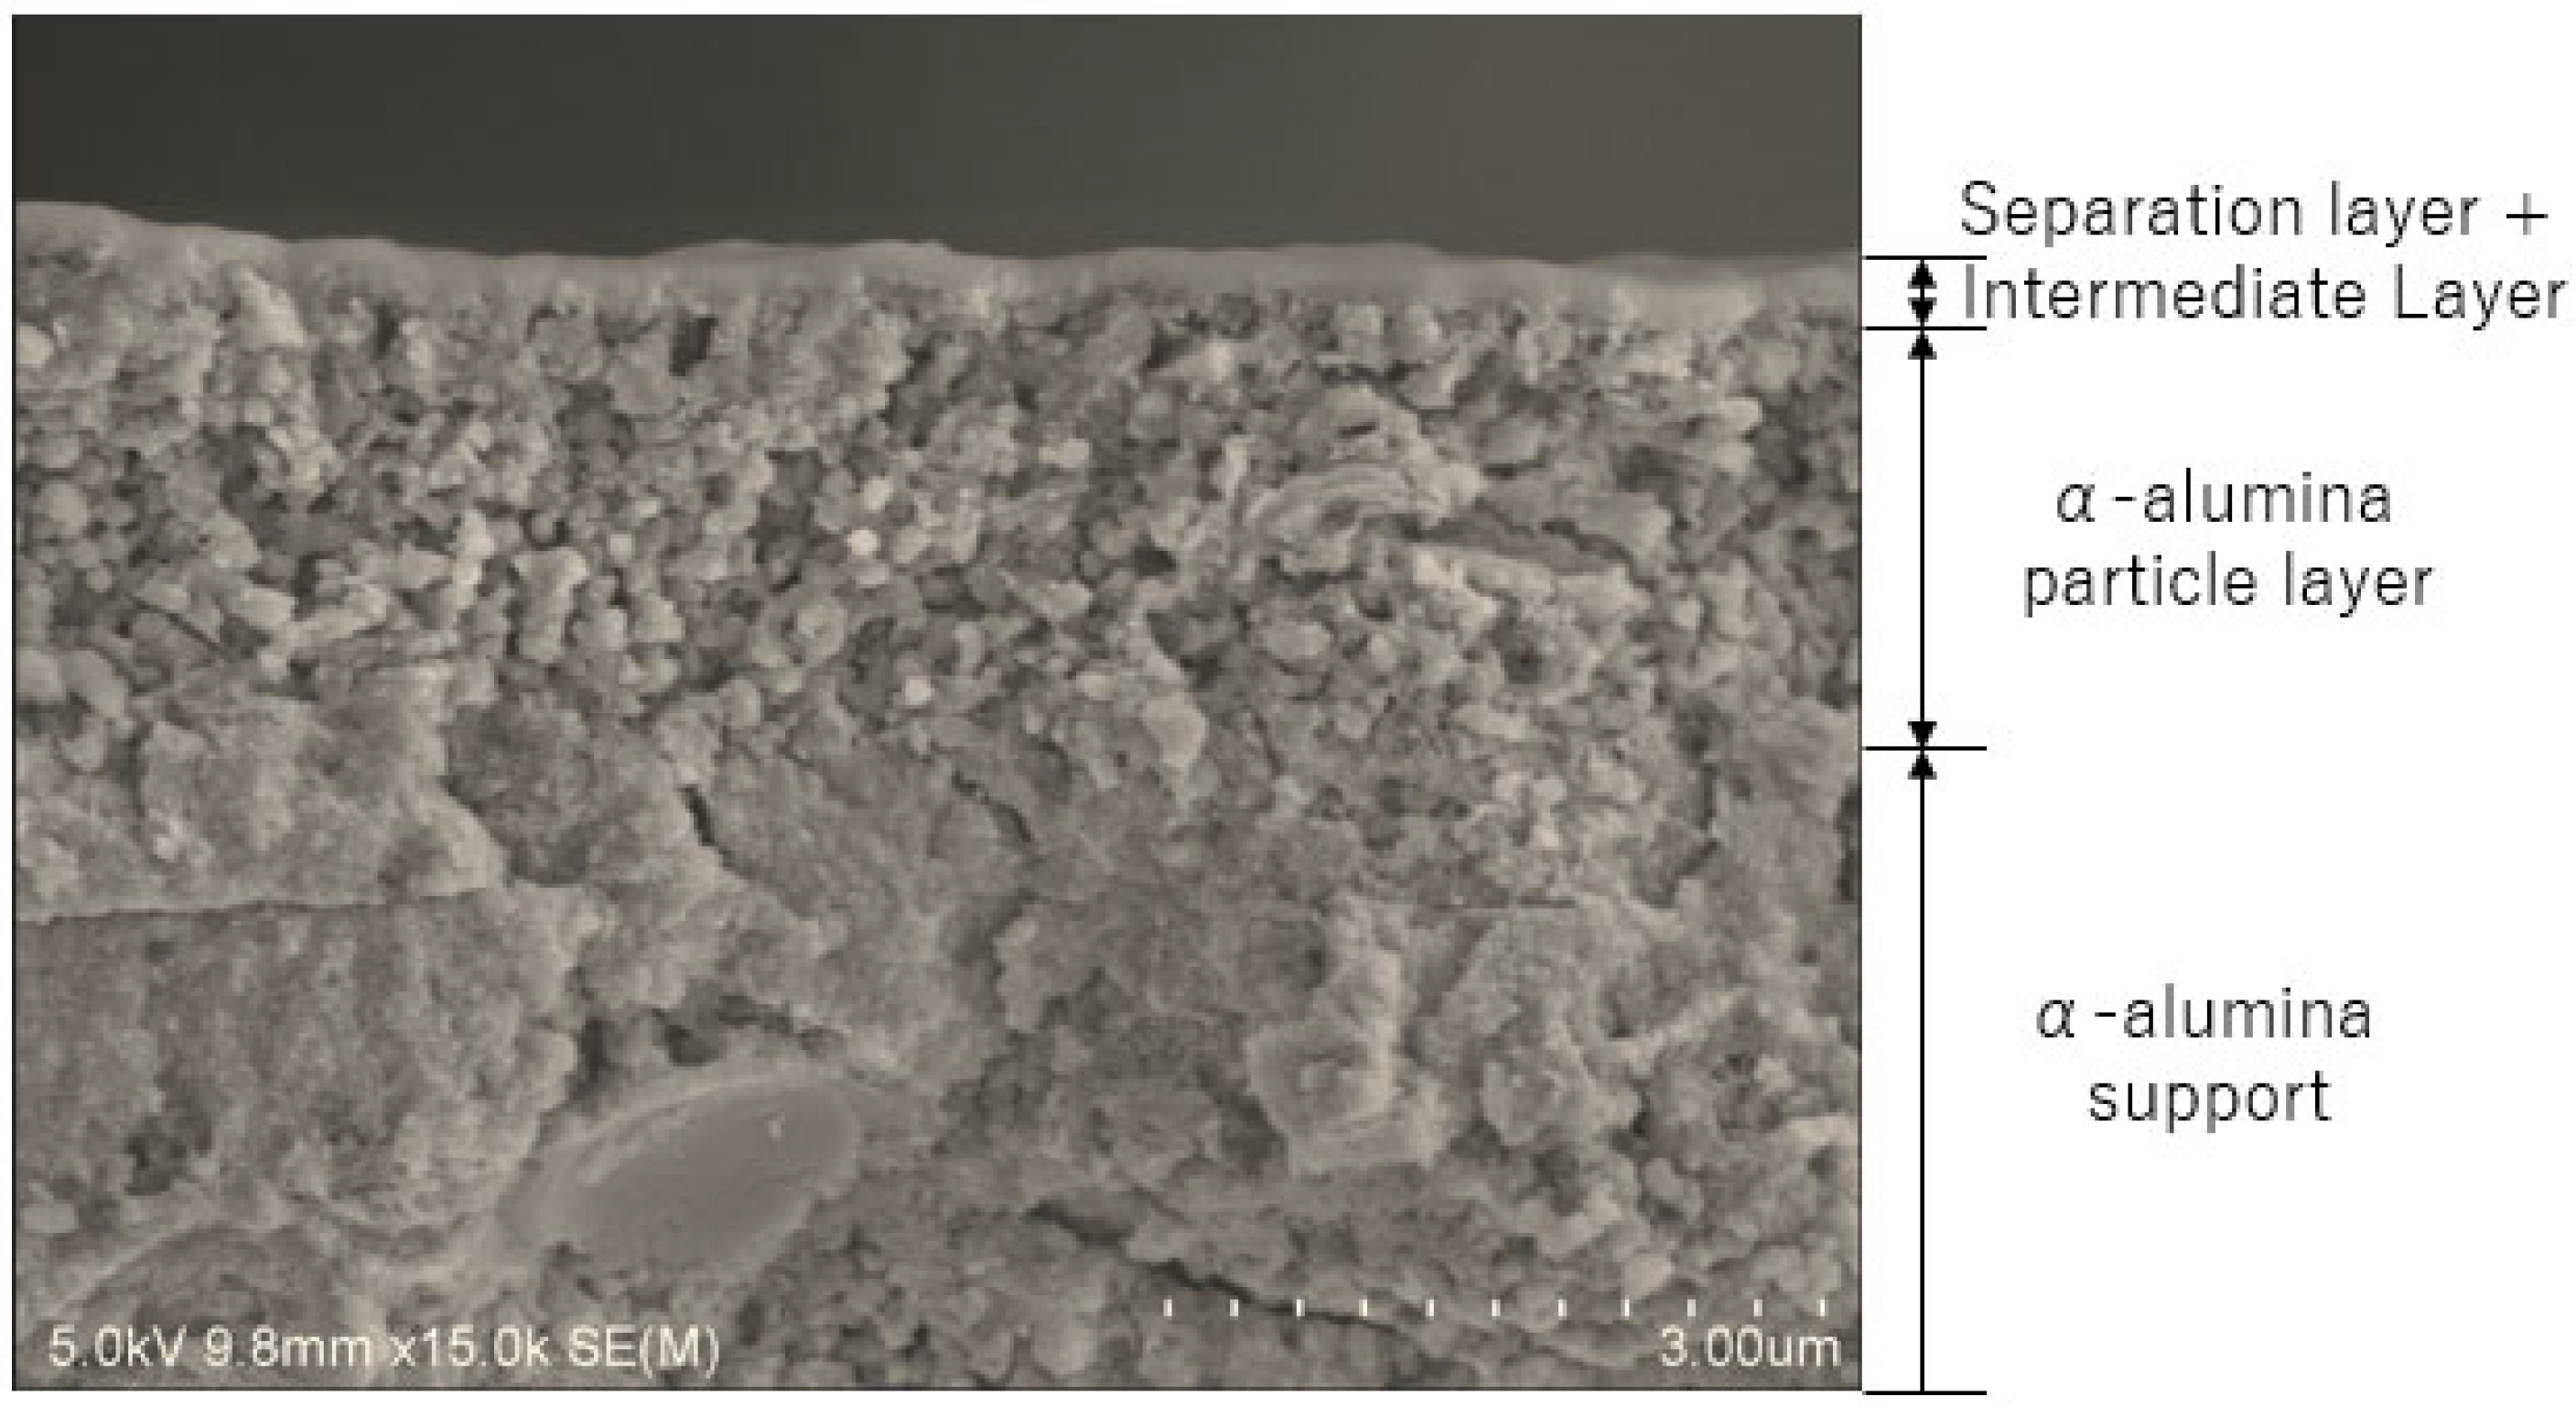
In the present study, BTESE membranes are referred to as BTESE-x-y. The x and y letters indicate the membrane pore size and the membrane serial number, respectively, as shown in Figure 1. In the present study, there is 1 membrane with a pore size around 0.7 nm and another with a pore size around 0.5 nm and 4 membranes with a pore size around 0.4 nm, and Table 1 lists all the membranes that were used in this study. The morphologies of the BTESE membranes were examined using a Hitachi S-48000 field emission scanning electron microscope (FESEM)Hitachi High-Tech, Tokyo, Japan. Figure 2 shows a SEM image of a cross-section of an in-house-prepared BTESE membrane. This clearly shows that a crack-free continuous separation layer thickness below 3 μm was formed on the top of the intermediate and alumina layers after the calcination process at 300 °C. Other characterizations can be found elsewhere [11,14,16].

2.2. Single-Gas Permeation (SGP)

The SGP measurement was carried out at 200 °C using single components of He, H2, N2, CH4, CF4, and SF6. The permeate stream was kept at atmospheric pressure while the membrane module experienced a transmembrane pressure of 0.04–0.1 MPa. The gas permeance, P (mol m−2 s−1 Pa−1), is obtained from Equation (1). The gas flowrates of the permeate streams were monitored using a mass flow meter (Kofloc EX-700R model, Kyoto, Japan) with flow rates up to 100 mL/min and 5 L/min, while the pressure of the retentate stream was measured by a digital pressure manometer (DMS-7A, 200 kPa, Hitachi High-Tech, Tokyo, Japan).
P = n / S p
Equation (1) uses n, or the permeate flow rate (mol s−1), as its unit. S represents the membrane surface area (m2) and Δp stands for the transmembrane pressure differential (Pa). The ratio of gas permeance for A and B is defined as αA/B (-) in Equation (2), which represents the optimal selectivity for A over B.
α A / B   = P A / P B

2.3. H2/TOL Separation Test

Figure 3a displays a schematic diagram of the one-stage gas separation device. The pressure of the feed (F1) stream was set at 200 kPaA and controlled using a needle valve. The pressure of the feed (F1) and retentate (R1) streams were measured by a digital pressure manometer (DMS-7A, 200 kPa, Hitachi High-Tech, Tokyo, Japan). The permeate (P1) stream was kept at atmospheric pressure. H2 was supplied directly from a gas cylinder at a flowrate of 4.94 L/min, while TOL was fed using a pump (LC-10 AD VP Shimadzu, Liquid Chromatography, Tokyo, Japan) at a flowrate of 1.2 mL/min to control the feed concentration at 30,000 ppm. The H2/TOL binary mixture was fed on the shell side of the membrane module, whose temperature was maintained at 200 °C. The gas flow rates of the feed (F1), retentate (R1), and permeate (P1) streams were monitored using a mass flow meter (Horiba, STEC, Z500 model). The Agilent 990 micro gas chromatography (Channel 1 Molsieve 5A (H2 measurement) and Channel 3 CP-SIL 5CB (TOL measurement) were used to measure the gas compositions of the permeate (P1) stream. The gas compositions in the retentate (R1) were calculated from the material balance.
Figure 3b depicts the apparatus diagram for the two-stage gas separation equipment. Here, the pressure of the feed (F1) stream was set at 300 kPaA and controlled using the needle valve. H2 and TOL were supplied similarly to the one-stage process (Figure 3a). The permeate (P1) stream from the first stage becomes the feed of the second stage, with a pressure between 111 kPaA and 133 kPaA. The pressure of the feed (F1), permeate (P1), retentate (R1), and permeate (P2) from second-stage streams were measured by a digital pressure manometer (DMS-7A, 200 kPa, Hitachi High-Tech, Tokyo, Japan). The feed H2/TOL binary mixture flowed in the direction of the shell side of the membrane module, where the temperature was set at 200 °C. A mass flow meter (Horiba, STEC, Z500 model, Kyoto, Japan) was used to monitor the gas flow rates of the feed (F1), retentate (R1), and permeate (P2) streams. The gas compositions of the permeate (P2) and retentate (R2) streams were determined using Agilent 990 micro gas chromatography, Santa Clara, CA United States. The gas compositions in both permeate (P1) and retentate (R1) were calculated from the material balance.
Partial pressure distributions (concentration distributions) in mixed-gas permeation (one- and two-stage gas separation studies) are produced by selective permeation in the flow direction. Therefore, the driving force for permeation was determined using the logarithmic mean pressure difference for the component of i (∆pi,lm):
p i , l m = p i ,   i n p i , o u t l n   p i , i n p i , o u t
where p i ,   i n   a n d   p i , o u t are the partial pressure difference of the i-component between the feed and the permeate stream at the inlet and at the outlet, respectively.
The H2 purity in the permeate or retentate streams is defined as the ratio of the H2 flowrate over total flowrate as follows.
H 2   p u r i t y   i n   p e r m e a t e   s t r e a m = Q p ,     H 2 Q t , p .   ( 100 % )
H 2   p u r i t y   i n   r e t e n t a t e   s t r e a m = Q r ,     H 2 Q t , r .   ( 100 % )
where Q p , H 2 ,   Q t , p , Q r , H 2 , Q t , r are expressed in mol/s, respectively.
The H2 recovery in the permeate stream is defined as the amount of H2 recovered as the product in the permeate stream, while TOL recovery is defined as the amount of the product recovered in the retentate stream.
H 2   r e c o v e r y   i n   p e r m e a t e   s t r e a m = x p ,     H 2 Q t , p x f ,     H 2 Q t , f
T O L   r e c o v e r y   i n   r e t e n t a t e   s t r e a m = x r ,   T O L Q t , r x f ,     T O L Q t , f
where the x p ,   H 2 ,   x r ,   T O L , x f ,   H 2 a n d   x f ,   T O L   are expressed in mol fraction while Q t , p ,   Q t , r   a n d   Q t , f are the flowrates in permeate, retentate, and feed streams, respectively, in L/min unit.

3. Results and Discussion

3.1. Single-Gas Permeation (SGP) and Pore Size Evaluation

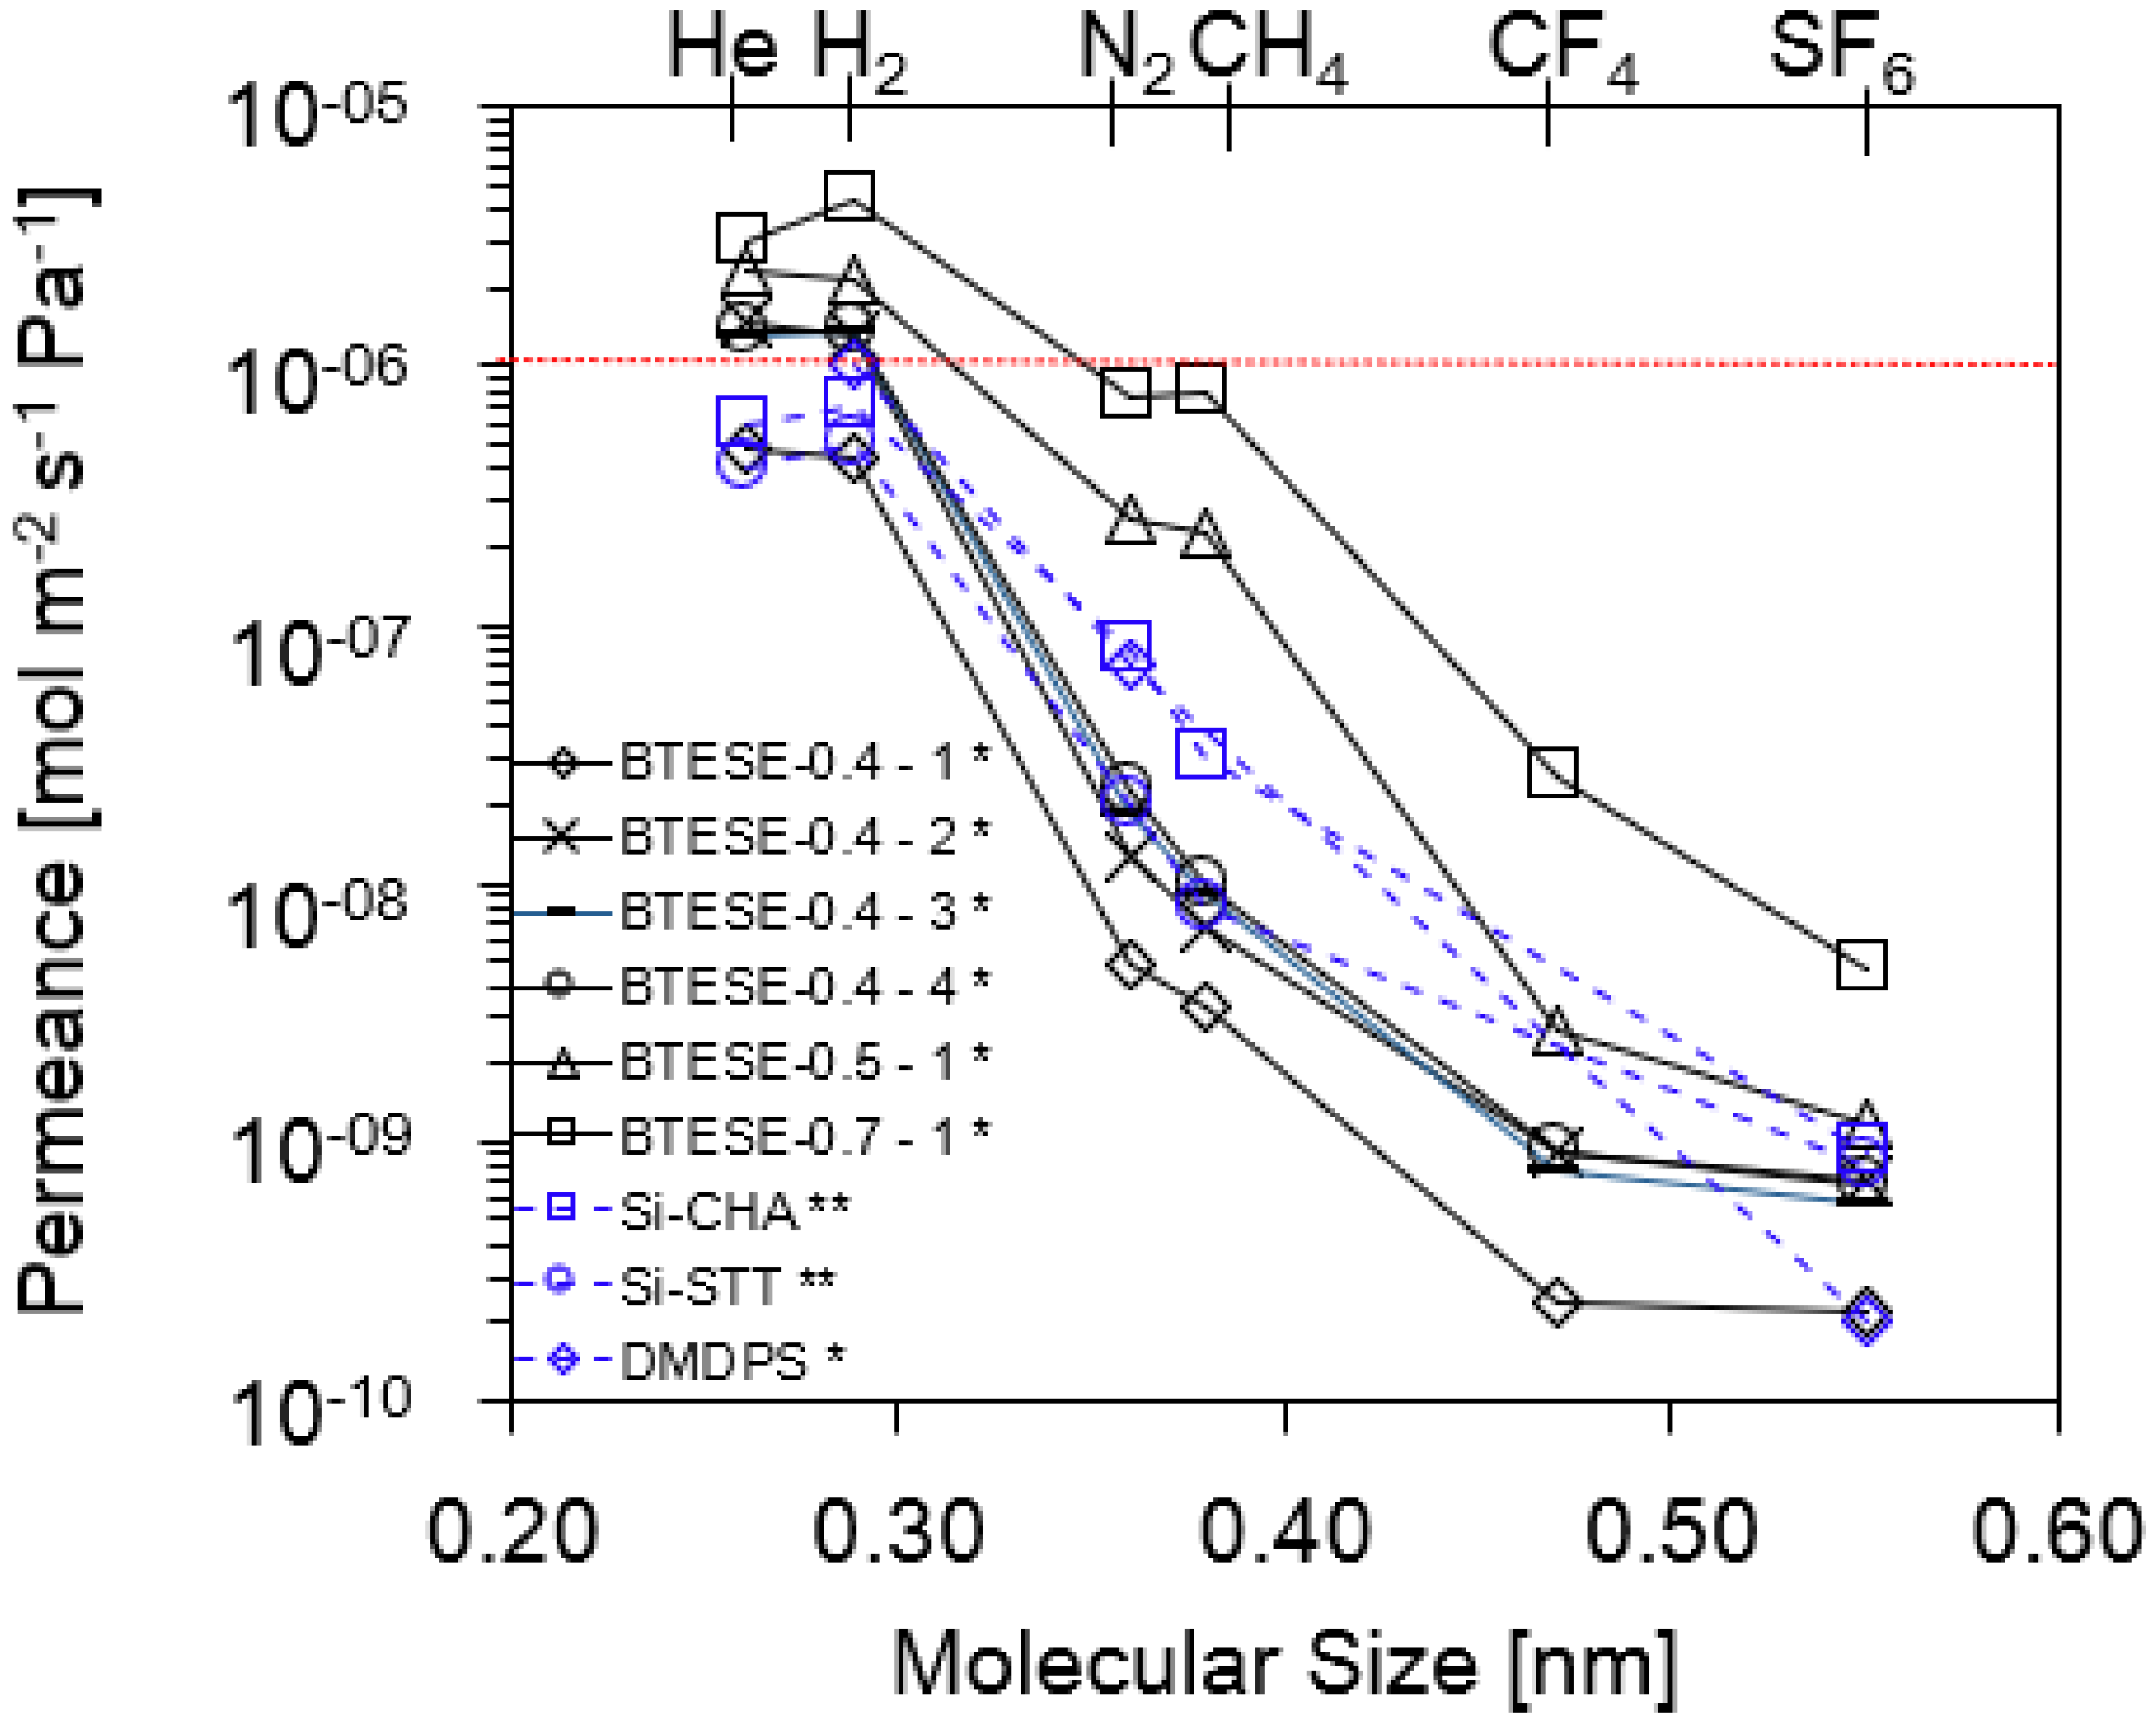
To investigate the permeation effectiveness of the in-house BTESE membranes with other inorganic membranes, the SGP was evaluated using He, H2, N2, CH6, CH4, CF4, and SF6 at a permeation temperature of 200 °C. Si-CHA and Si-STT zeolite membranes [31] evaluated at 300 °C and dimethoxydiphenylsilane (DMDPS)-derived CVD silica membranes [32] evaluated at 200 °C were included, as shown in Figure 4. These two membranes were included in the H2/TOL separation study; the authors used an almost similar feed mixture gas (TOL/H2 = 2/98 mol%) to our present study (TOL/H2 = 3/97 mol%). This condition corresponds to the gas-phase composition after TOL removal by condensation following the methylcyclohexane dehydrogenation process.
Interestingly, despite variations in pore diameters, all of the in-house BTESE membranes showed a H2 permeance of more than 10−6 mol m−2 s−1 Pa−1, as shown in Figure 4. The BTESE-0.4-1 membrane showed a H2 permeance which was lower than other BTESE-0.4 membranes (below 10−6 mol m−2 s−1 Pa−1) and is comparable to that of the Si-CHA [31], Si-STT [31], and DMDPS [32] membranes. However, the permeances of other gases such as N2, CH4, CF4, and SF6 were higher for both Si-CHA and Si-STT membranes than the BTESE-0.4 type of membrane, demonstrating that both zeolites have a loose pore network compared to BTESE-0.4 membranes. In terms of the DMDPS membrane, it is hard to predict the pore size of this membrane as only a limited number of gases (H2, N2, and SF6) were tested on this membrane, which showed higher N2 permeance but similar SF6 permeance to the BTESE-0.4-1 membrane.
Figure 5 demonstrates the permeance ratios of H2/N2 and H2/SF6 as a function of H2 permeance. Generally, the performance follows a trade-off relationship for each system (H2 vs. SF6 and H2 vs. N2). All BTESE membranes have a moderate H2/N2 permeance ratio of approximately 5 to 110 but a high and wide range of H2/SF6 selectivity around 970–2400. The results indicate that when the pore size of the BTESE membranes drops, the gas permeance ratio increases and H2 permeance decreases. These results are based on the gas permeation properties and are obtained using the normalized Knudsen-based permeance (NKP) method, which will be discussed later.
In the case of the Si-CHA [31] and Si-STT [31] membranes, the H2/N2 permeance ratio is 9 and 25, and the H2/SF6 permeance ratio, on the other hand, is 778 and 625, respectively. Both gas permeance ratios for the Si-CHA and Si-STT membranes are moderate compared to those of the BTESE-0.4 membrane group. This observation supports our previous statement that Si-CHA and Si-STT membranes had a loose pore network compared to the BTESE membrane group. In comparison to the BTESE membranes itself, a H2/N2 permeance ratio ~ 61 to 106 indicates that the BTESE-0.4 membrane group exhibits a smaller pore size compared to the H2/N2 permeance ratio < 10 (BTESE-0.5 and BTESE-0.7 membrane groups). The lower H2/N2 permeance ratio is attributed to the looser structure of the BTESE membrane (BTESE-0.5-1 and BTESE-0.7-1). Large-pore membranes (BTESE-0.5-1 and BTESE-0.7-1) also exhibit high H2 permeance due to the low permeation resistance through the membrane. Detailed information on these gas separation properties is summarized in Table 2.
Figure 6a–c illustrate how the NKP approach [33] was used to precisely assess each membrane’s pore size. The modified gas translation (GT) model, which was developed by Xiao and Wei [34] and Shelekhin et al. [35] for the purpose of determining membrane pore sizes of less than 1 nm, is the foundation of this NKP technique. A more detailed explanation of this model can be found elsewhere [33]. NKP is the ratio of the i-th component’s permeance to the permeance predicted by the Knudsen diffusion mechanism using He, the smallest molecule. The normalized Knudsen-based permeance expression can be produced as follows.
N K P = P i P H e M i M H e = d p d k ,   i 3 d p d k , H e 3 e x p E p ,   i E p , H e R T
where dp is the average pore size of the membrane and d k ,   i   is the molecular size of the i-th component. The symbols Ep,i, Ep,He, R, and T stand for the activation energy of the i-th component, He, the gas constant, and the temperature, respectively. To facilitate the evaluation of microporous membrane pore sizes, the current study assumed a small variation in the activation energy of permeation. This led to the following expression for NKP (Equation (9)).
N K P = d p d k ,   i 3 d p d k , H e 3
Figure 6 shows the NKP plot at 200 °C where the surface flow is negligible. This result confirms that BTESE-0.4 membranes had a smaller pore size distribution.

3.2. Hydrogen (H2)/Toluene (TOL) Binary Separation in a One-Stage Membrane Configuration System

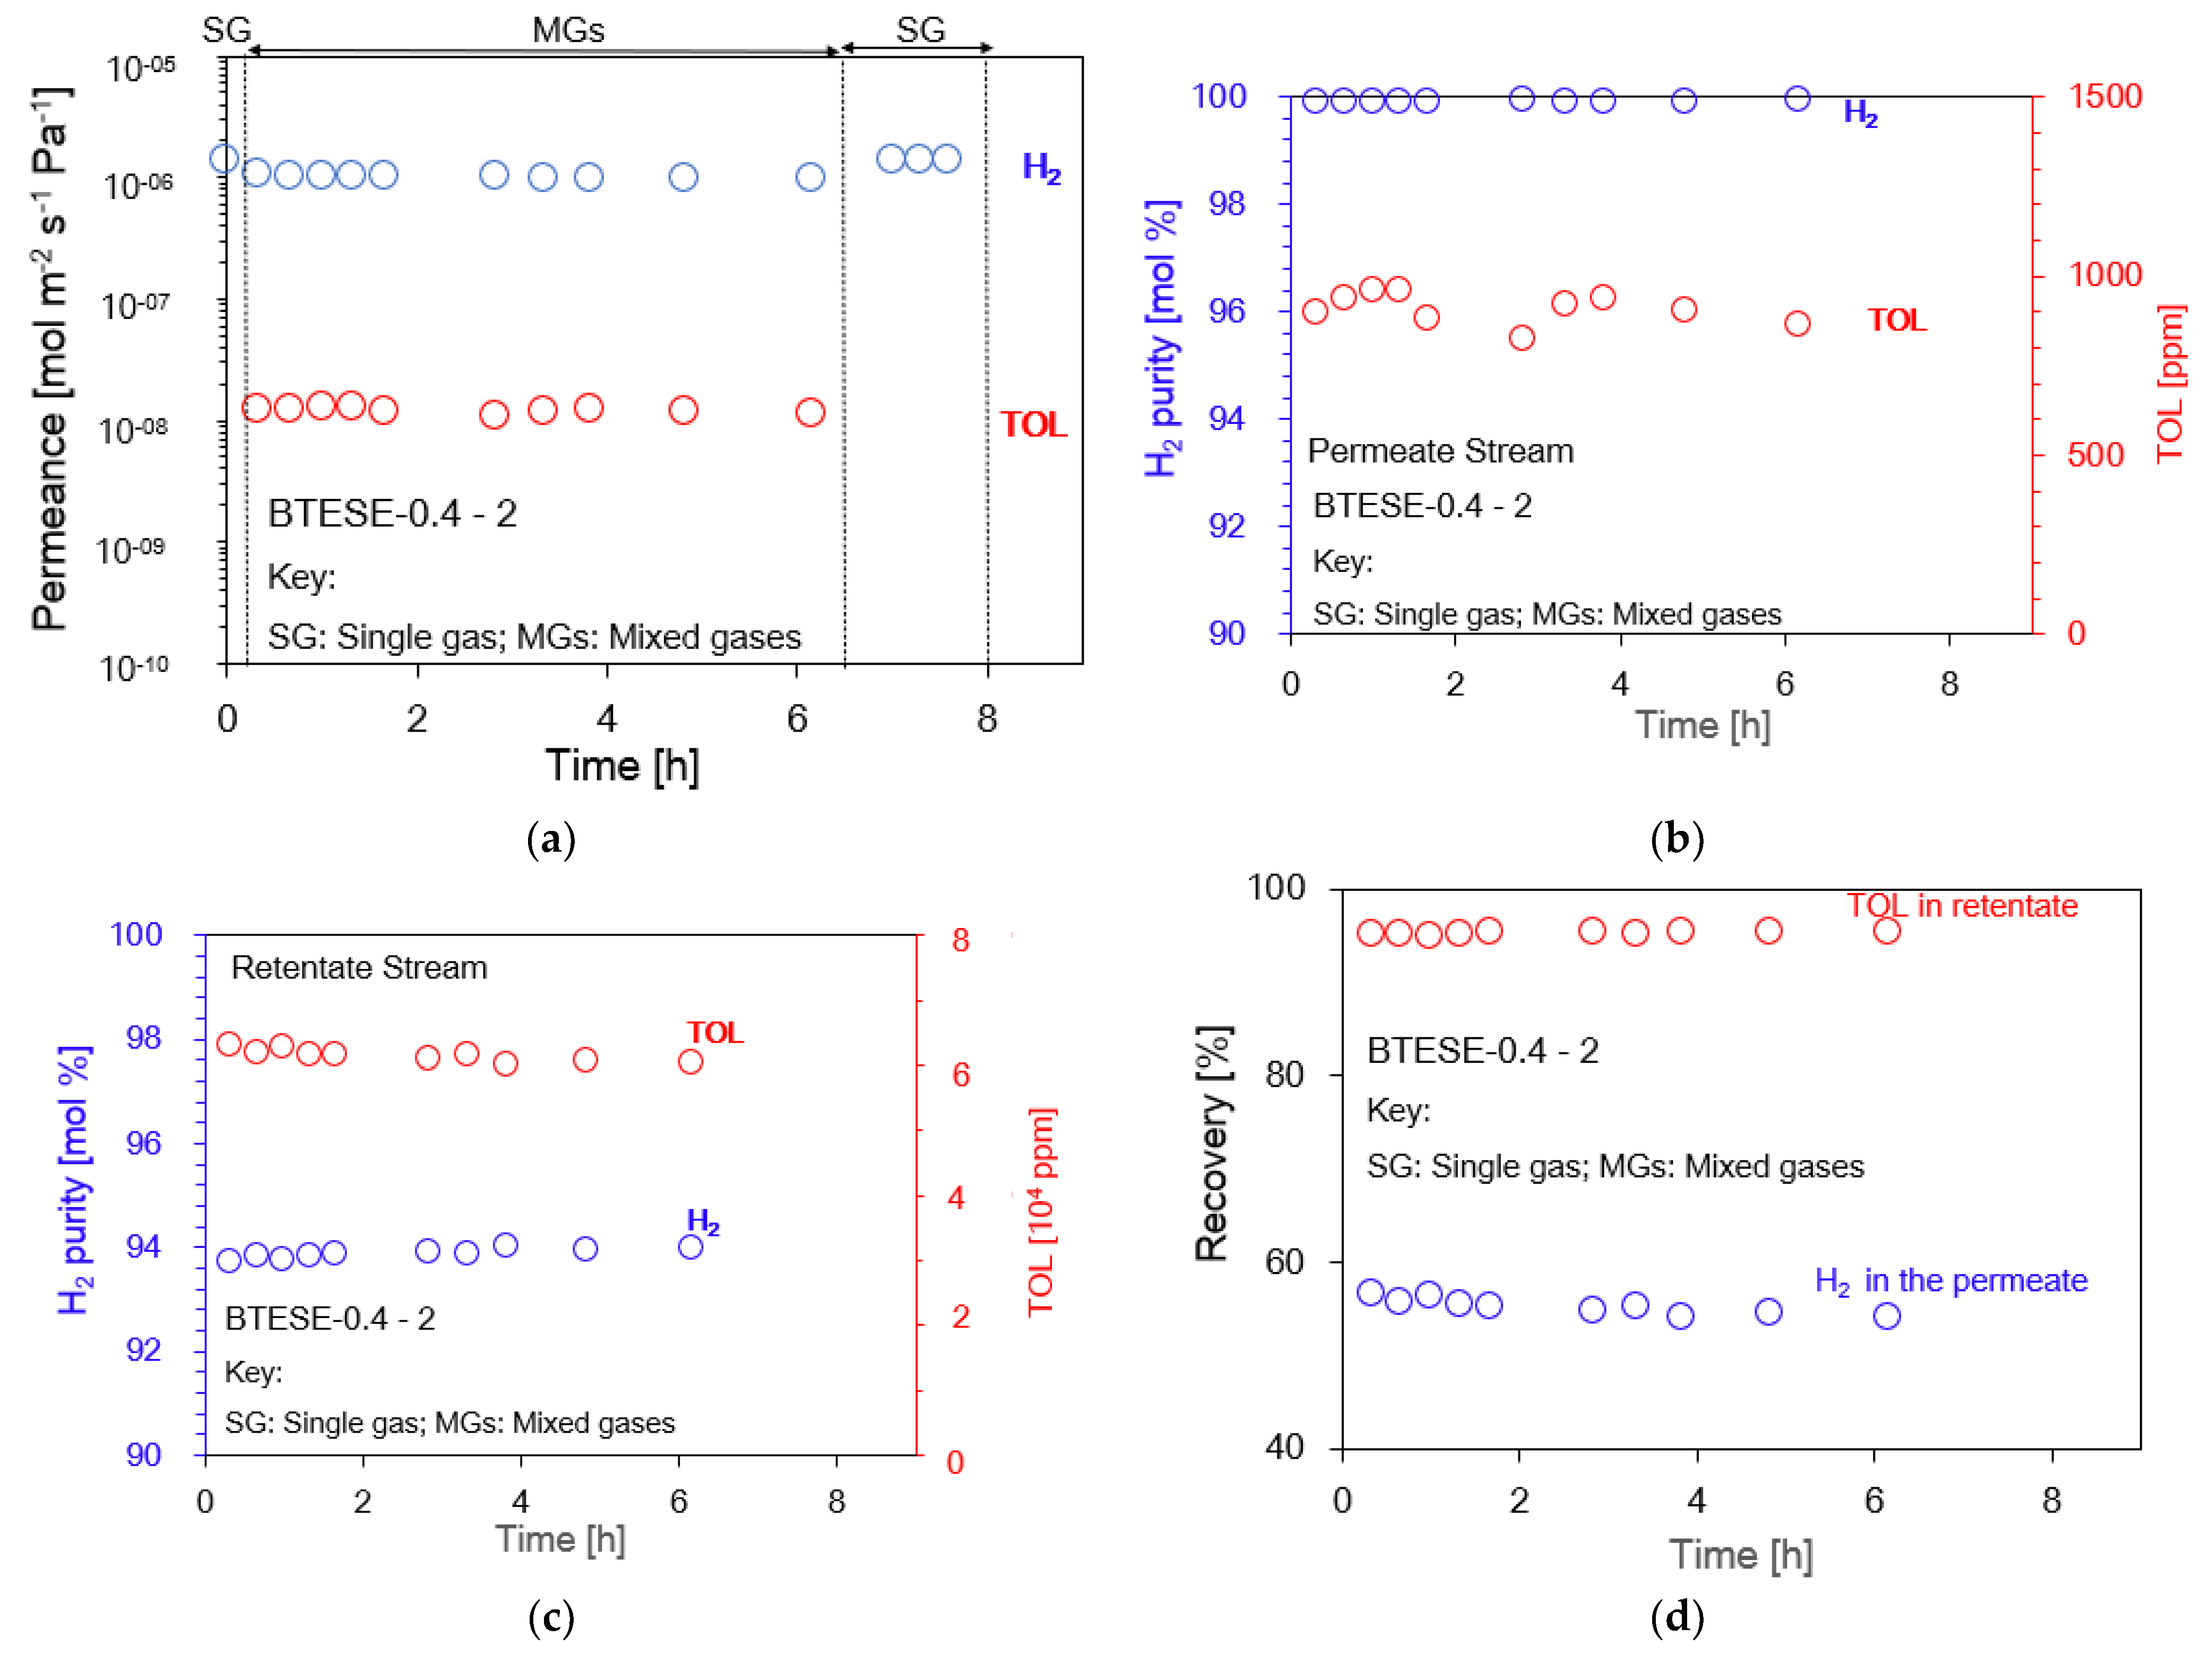
The separation performance via a one-stage membrane configuration system is shown in Figure 7a–d. For the 6 h H2/TOL separation test, the BTESE-0.4-2 membrane, whose pores are around 0.4 nm in size, is shown as a typical example in the figure. The experiment was initiated with single H2, followed by binary separation (H2/TOL), and then single H2. Compared to the initial single H2 gas permeance, the H2 permeance in the mixed H2/TOL appears to be slightly lower. However, during the almost 6 h H2/TOL separation test, the H2 permeance showed stable values > 10−6 mol m−2 s−1 Pa−1, with low TOL permeance < 10−8 mol m−2 s−1 Pa−1. After the mixed-gas test, H2 permeance recovered to the same level as the initial H2 single-gas permeance, as shown in Figure 7a. This finding suggests that TOL molecules did not block the membrane pore network or adsorb on its surface. Figure 7b, c shows the permeate H2 purity and TOL concentration, which correspond to 99.9 mol% and 900 ppm, respectively. Figure 7d exhibits that the H2 recovery in the permeate stream was around 0.5, while the TOL recovery in the retentate stream was 0.9. This study revealed that with only one-stage membranes, the H2 purity in the permeate stream can be achieved at approximately ~99 mol% for all BTESE membranes, similarly to other inorganic membranes [31,32,34].
The H2/TOL and TOL/H2 permeance ratios versus H2 permeance of BTESE and other inorganic membranes using a one-stage membrane system are shown in Figure 8. In terms of H2 permeance and the H2/TOL permeance ratio, our BTESE membranes continue to be regarded as high-performance membranes based on their performance in comparisons with other membrane materials [31,32,36,37]. The ionic liquid membrane [37] is a TOL-permeable membrane as it exhibits a high TOL/H2 permeance ratio. However, TOL-permeable membranes are not appropriate for the purification of H2.
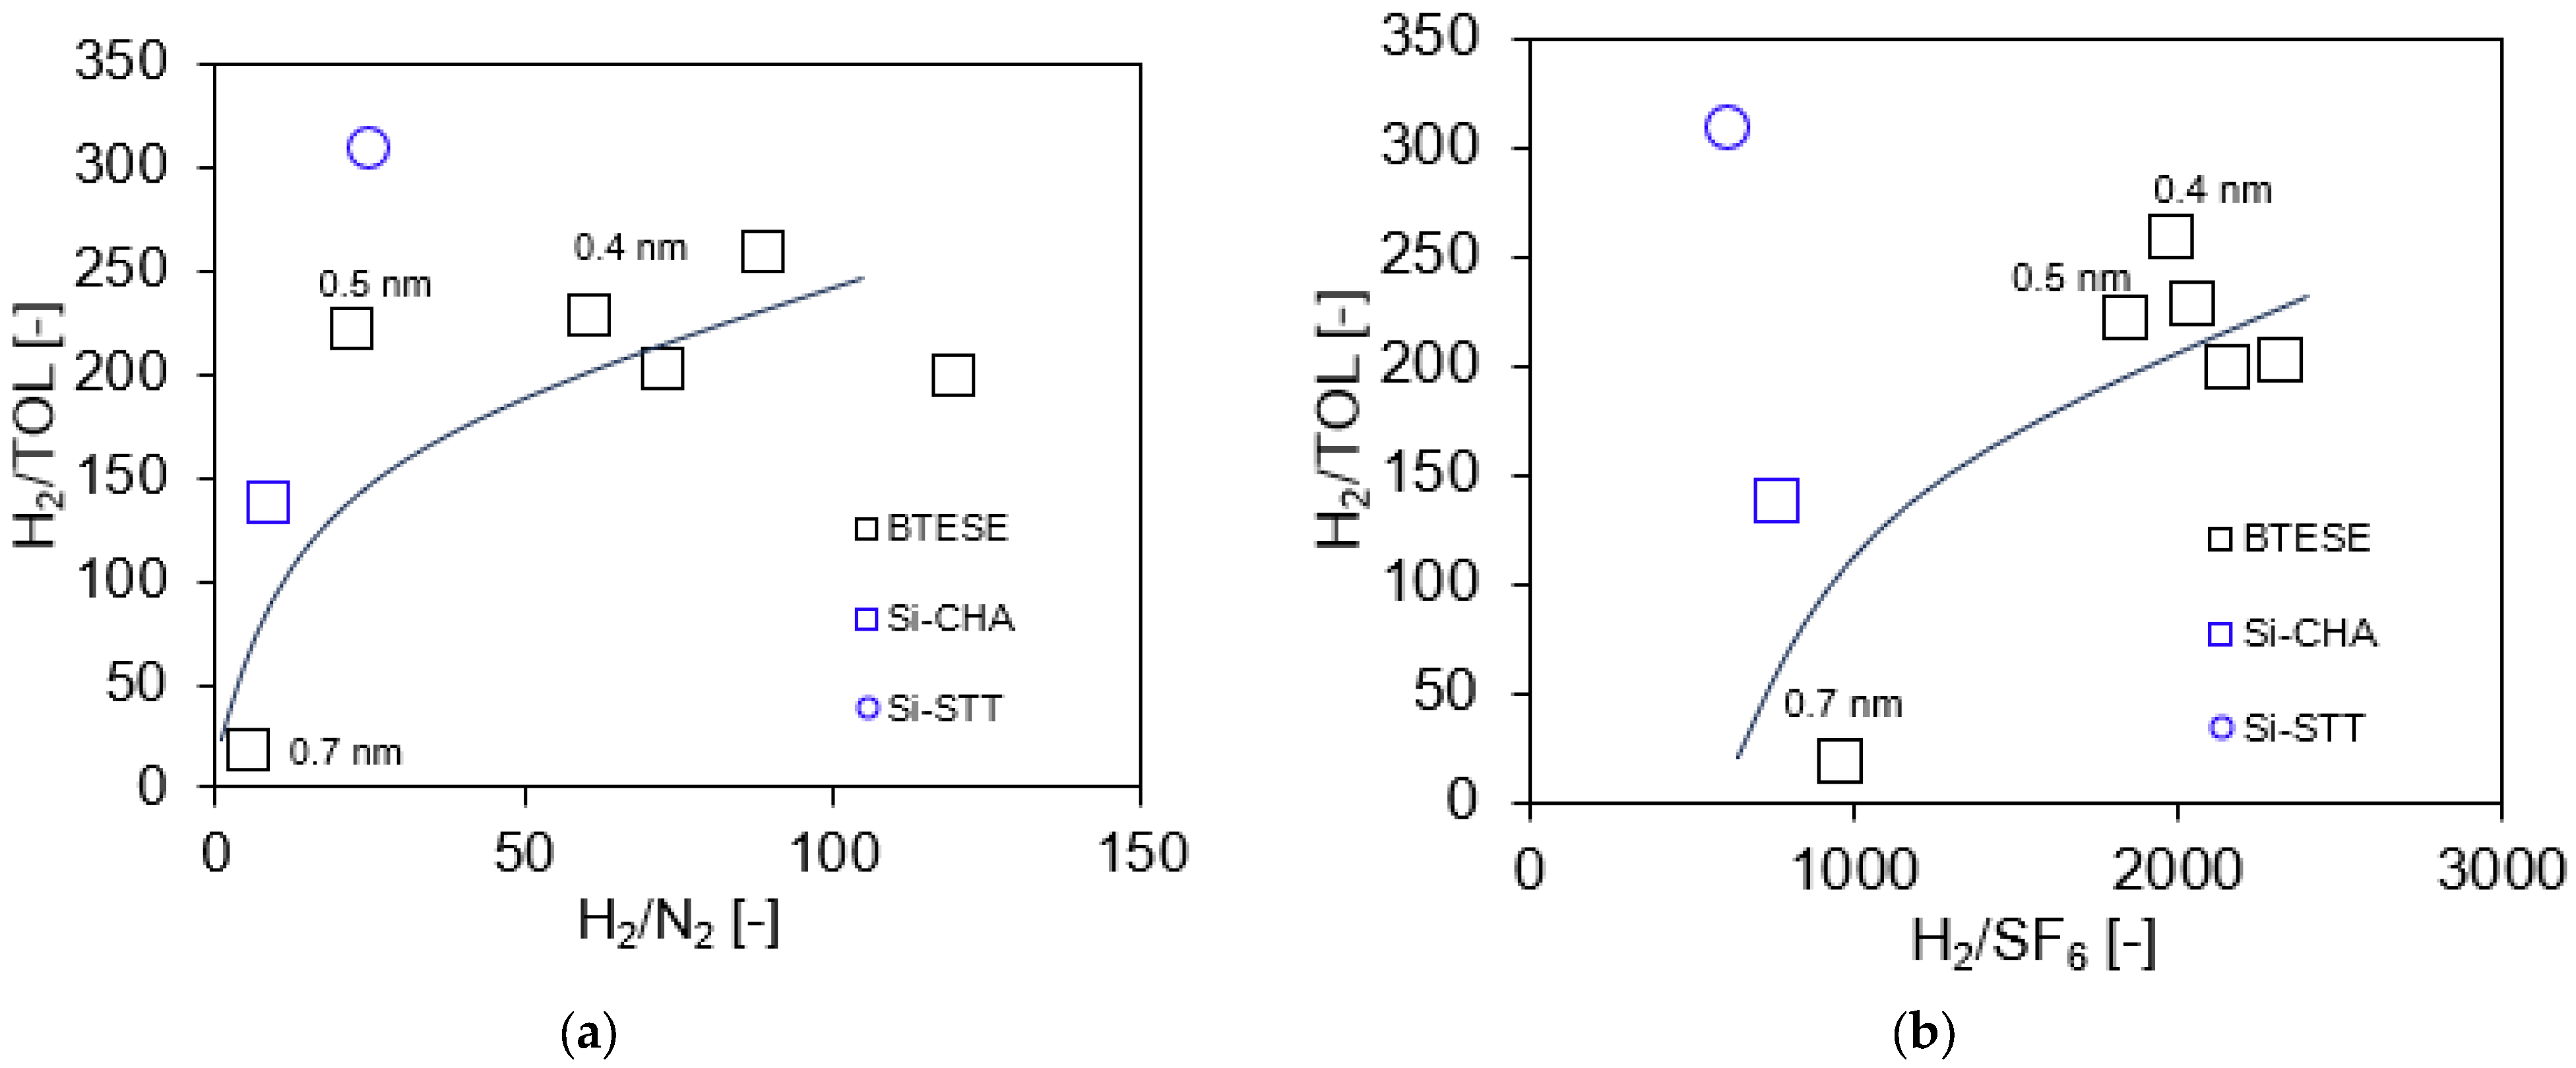
Figure 9 shows the H2/TOL permeance ratio plotted against the permeance ratios of H2/N2 and H2/SF6 in order to examine any possible correlation. Both the mixed H2/TOL and single H2/N2 and H2/SF6 permeance ratios were measured at 200 °C. The molecular sizes of hydrogen (H2), nitrogen (N2), sulfur hexafluoride (SF6), and toluene (TOL) are reportedly 0.29, 0.36, 0.55, and 0.58 nm [14], respectively. Therefore, we assumed it was reasonable to use SF6 gas as a predictor for TOL permeance. The permeance ratio can be considered a measurement of the pore size distribution of the BTESE membrane; that is, the higher the permeance ratios, the smaller the pore sizes. As can be seen in Figure 9a,b, with an increase in the permeance ratio of H2/N2 and H2/SF6, the permeance ratio of H2/TOL also increased. The membranes with small pore sizes (0.4 nm) are plotted at the top right of both figures, as these membranes possessed high separation performance, and the membranes with the membranes with larger pore sizes are plotted at the bottom left of the figures due to their low permeance ratio.
Remarkably, Figure 10a shows that the H2 mixed-gas permeance was slightly lower than the H2 single-gas permeance for all BTESE membranes as well as Si-CHA and Si-STT zeolites membranes. This is possibly due to the fact the fact that some TOL molecules in the mixed-gas system may have absorbed on the membrane surface as well as blocked the pores of the membranes for H2 permeation.
However, upon analyzing the TOL and SF6 gas permeances, as shown in Figure 10b, we discovered that the TOL permeance was higher than the SF6 permeance for all BTESE and Si-CHA membranes. Only the Si-STT membrane shows almost the same permeance as TOL and SF6 gas. Toluene (TOL) and sulfur hexafluoride (SF6) reportedly have molecular sizes of 0.55 and 0.58 nm, respectively. However, it is possible that TOL’s molecular size was smaller than SF6′s. This outcome is consistent with the findings of Niimi et al. [14]. Li et al. [38] reported that the order of permeances was not always correlated with the kinetic diameter. H2O and NH3 are claimed to have kinetic diameters between 0.26 and 0.265 nm, which is less than the H2 size of 0.289 nm. At high temperatures (400–500 °C), however, amorphous SiO2 membranes have consistently demonstrated a higher permeance for H2 than for either NH3 or H2O [38]. The sizes of molecules can be ascertained using a variety of techniques, such as collision diameter and kinetic diameter. According to the findings by Li et al. [38], the appropriate molecular sizes for NH3 and H2O were found to be 0.326 nm and 0.2995 nm, respectively. An additional possibility is the impact of penetrating molecular structures and membrane pores. Since TOL is most likely more planar than spherical, it may have been preferred for penetration through the slit-like pores or pinholes that may be present in our BTESE-derived membranes. This might be one reason why our BTESE membranes exhibited a greater permeance for TOL in comparison to SF6, whose structure is more spherical.
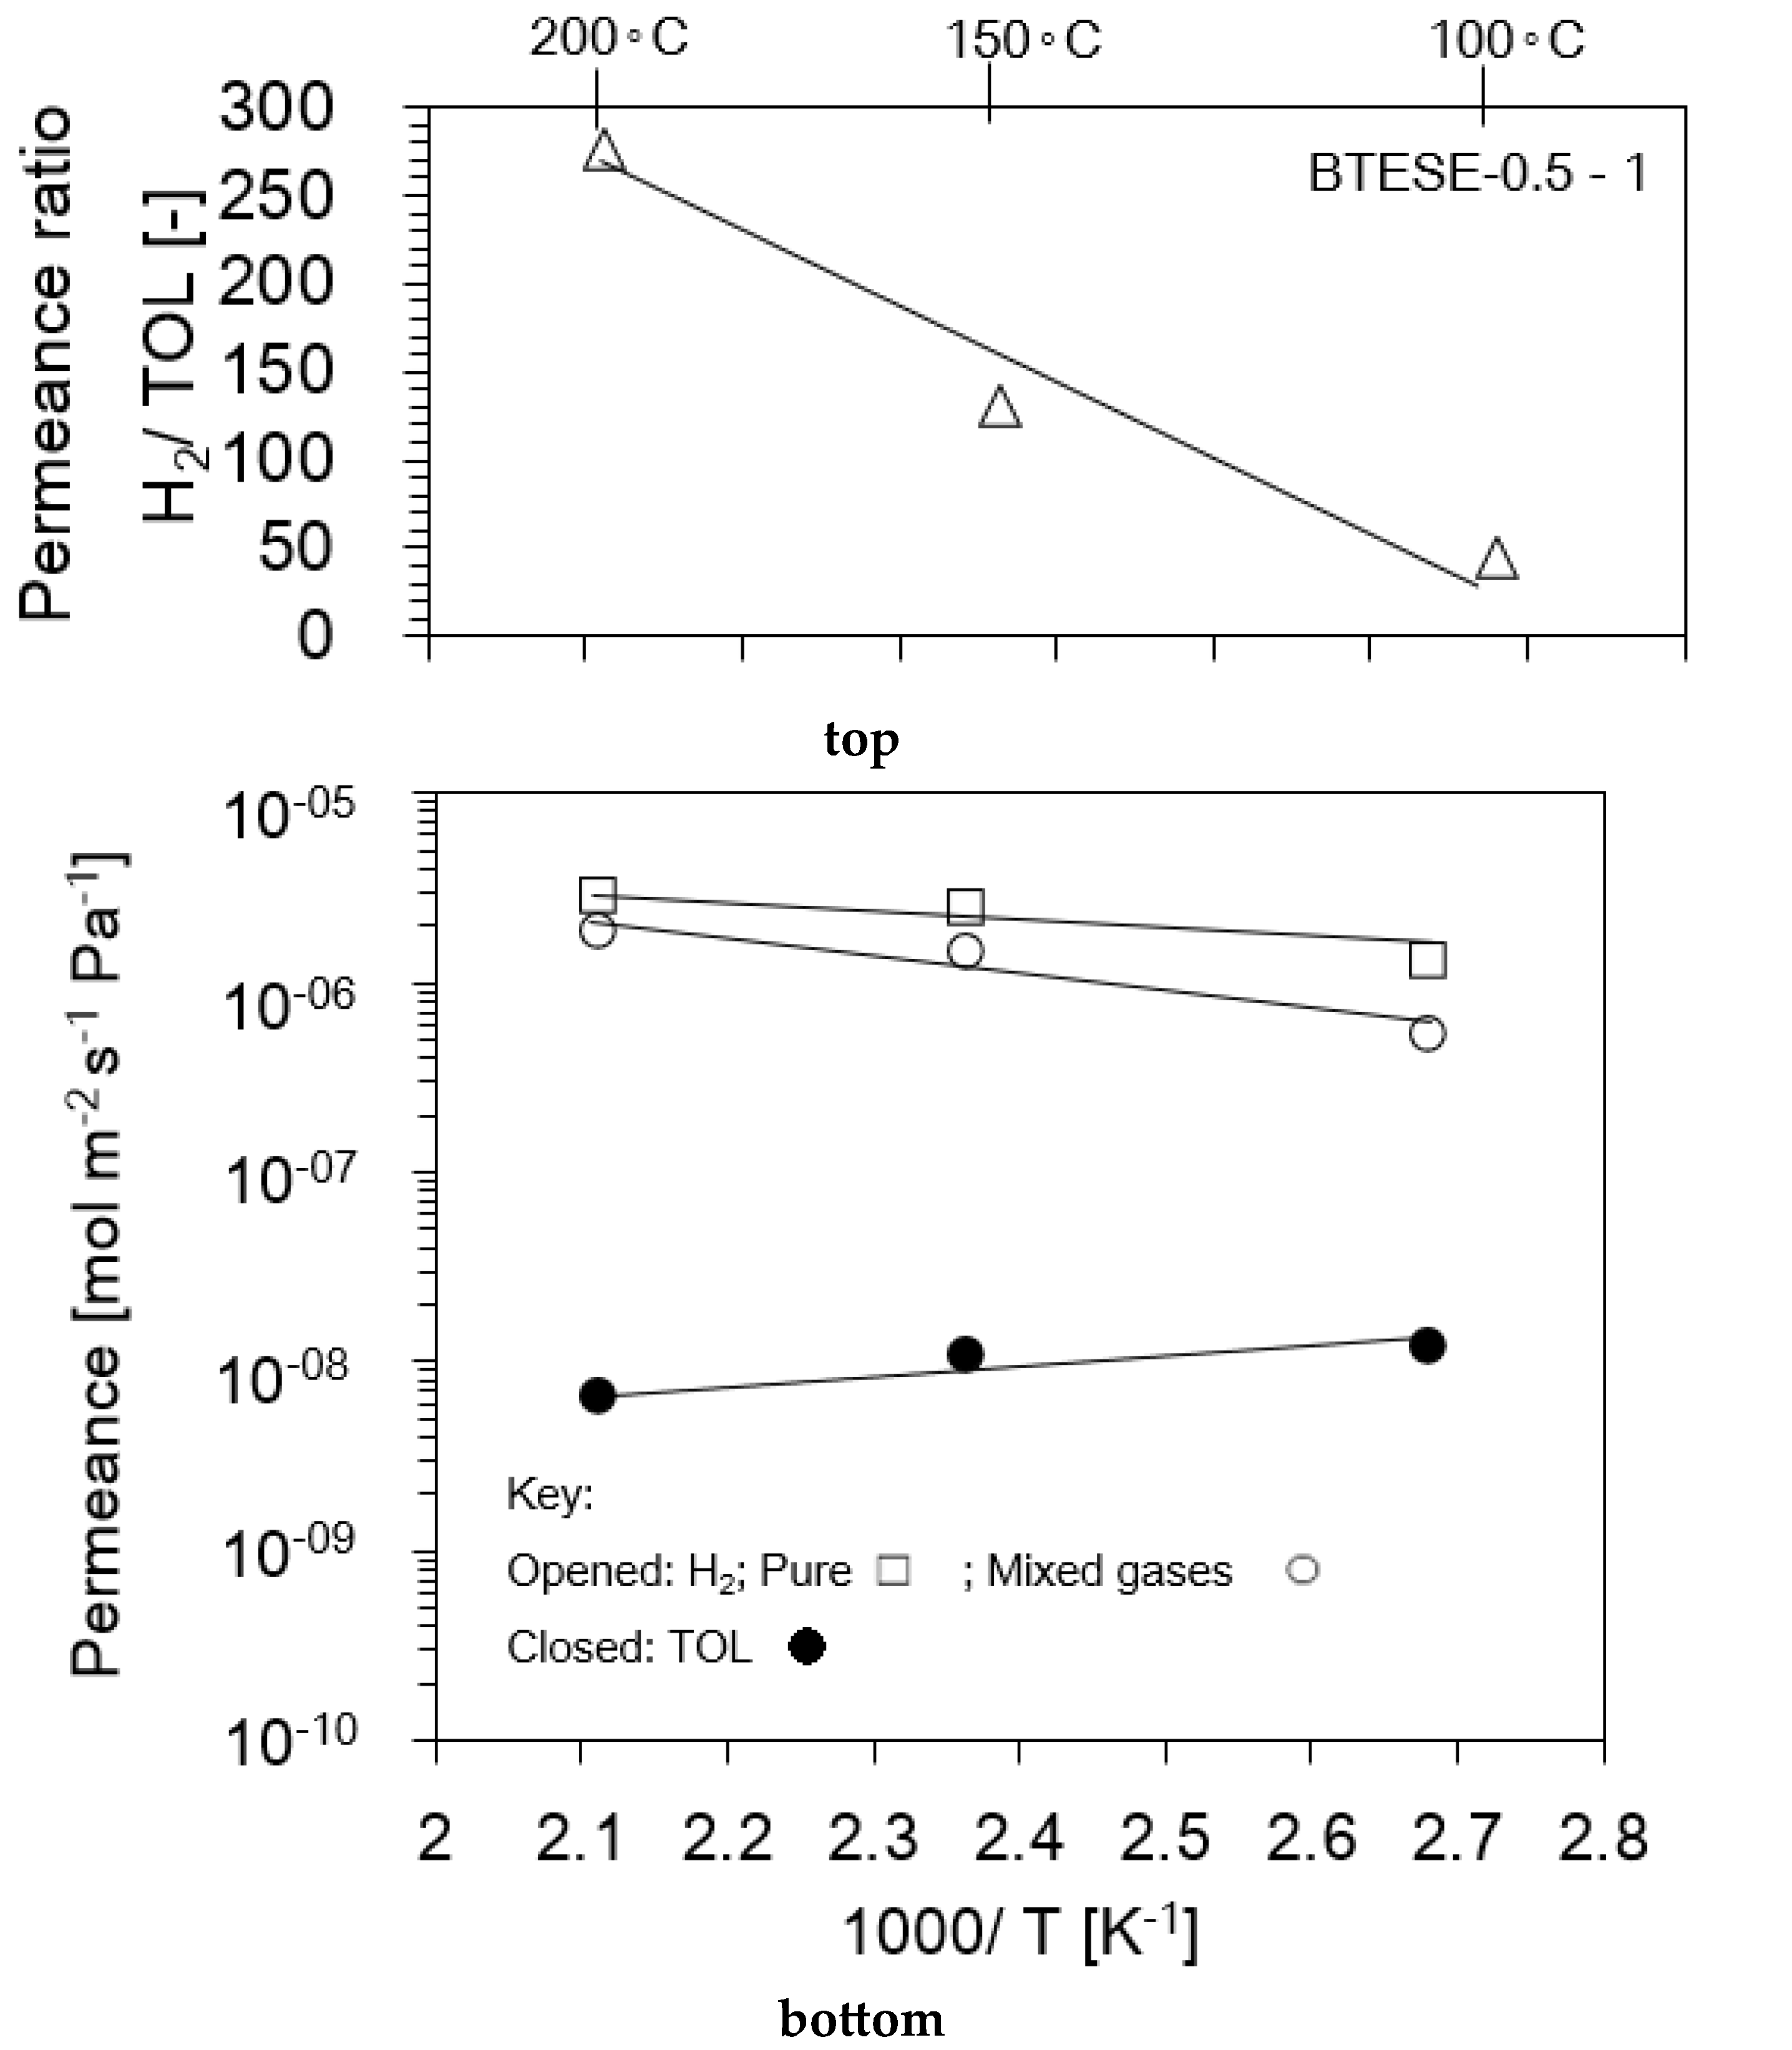
In order to examine the effect of temperature on the BTESE membrane, the BTESE-0.5-1 membrane was tested at different temperatures ranging from 100 to 200 °C, as shown in Figure 10. The feed pressure (Pf) was set at 300 kPaA, and the feed concentrations of H2 and TOL were set at 97 mol% and 3 mol%, respectively. Figure 11 illustrates the temperature dependencies of the single H2, mixed-gas H2, and TOL permeance (bottom figure) and the permeance ratio of H2/TOL (top figure), respectively. In spite of the gas state (pure or mixed gas), H2 permeance increased as temperature increased, which indicates an activated diffusion tendency [14], whereas TOL permeance decreased as temperature increased in such a manner as to indicate surface diffusion. This result is in line with the finding by Niimi et al. [14] that the effect of TOL adsorption on H2 permeation was small at high temperatures. Therefore, it can be concluded that a high-temperature operation is preferable to achieve a high H2 permeance and a high H2/TOL permeance ratio.
As for the comparison with other membranes, our organosilica BTESE membranes showed high H2 permeance compared to the other zeolite membranes [31,32,36]. Most of our BTESE membranes exhibit promising H2 permeance over 1 × 10⁻⁶ mol m−2 s−1 Pa−1 after 60 min of the H2/TOL separation test, with the exception of the BTESE-0.4-1 membrane, which has the smallest pore network. BTESE-0.5-1 membrane with a pore size around 0.5 nm exhibits a remarkable performance of H2 recovery > 80% and H2 purity > 99.9% in the permeate stream. Si-STT membranes showed slightly high H2/TOL compared to the BTESE membranes, which was attributed to the adsorption capability of the Si-STT membranes. Reportedly, Si-STT allows toluene to adsorb without preventing H2 from passing through its two-dimensional pore systems, which have seven- and nine-membered ring windows (0.24 × 0.35 and 0.37 × 0.53 nm2, respectively) [31,37,39,40,41].
Seshimo et al. [32] reported that using a feed mixture of H2/TOL (98/2 mol%) at an operating temperature of 200 °C, their dimethoxydiphenylsilane (DMDPS)-derived silica membrane achieved stable purification of hydrogen higher than 99.99% purity and TOL concentrations of 70 ppm in the permeate stream. However, the H2 permeance for this membrane was below 1 × 10⁻⁶ mol m−2 s−1 Pa−1. We also compared our BTESE membrane H2/TOL performance with a supported ionic liquid membrane (SILM) and ionic liquid organosilica (ILOS) membranes. These two membranes are reported to have a high TOL/H2 separation factor of over 1000–17,000 [37]; however, the H2/TOL separation factor is below 1 for these both membranes, and the H2 permeance ranges from 1 × 10⁻¹⁰ to 1 × 10⁻¹¹ mol m−2 s−1 Pa−1 at operating conditions of feed pressure (Pf: 220 kPaA) and an operating temperature of 70 °C, which seems useful to concentrate TOL but unsuitable to purify H2. The detailed information on these H2/TOL separation test properties is shown in Table 3.

3.3. Hydrogen (H2)/Toluene (TOL) Binary Separation in a Two-Stage Membrane Configuration System

Due to the overall performance of our BTESE membrane in terms of TOL concentration in the permeate stream, it still falls short of our desired level, which is less than 200 ppm. In order to reach the intended goal, the two membranes were placed in a cascade (Figure 3b). The BTESE-0.5-1 membrane was chosen as the first membrane, while the BTESE-0.4-2 membrane was chosen as the second membrane for the two-stage membrane configuration system.
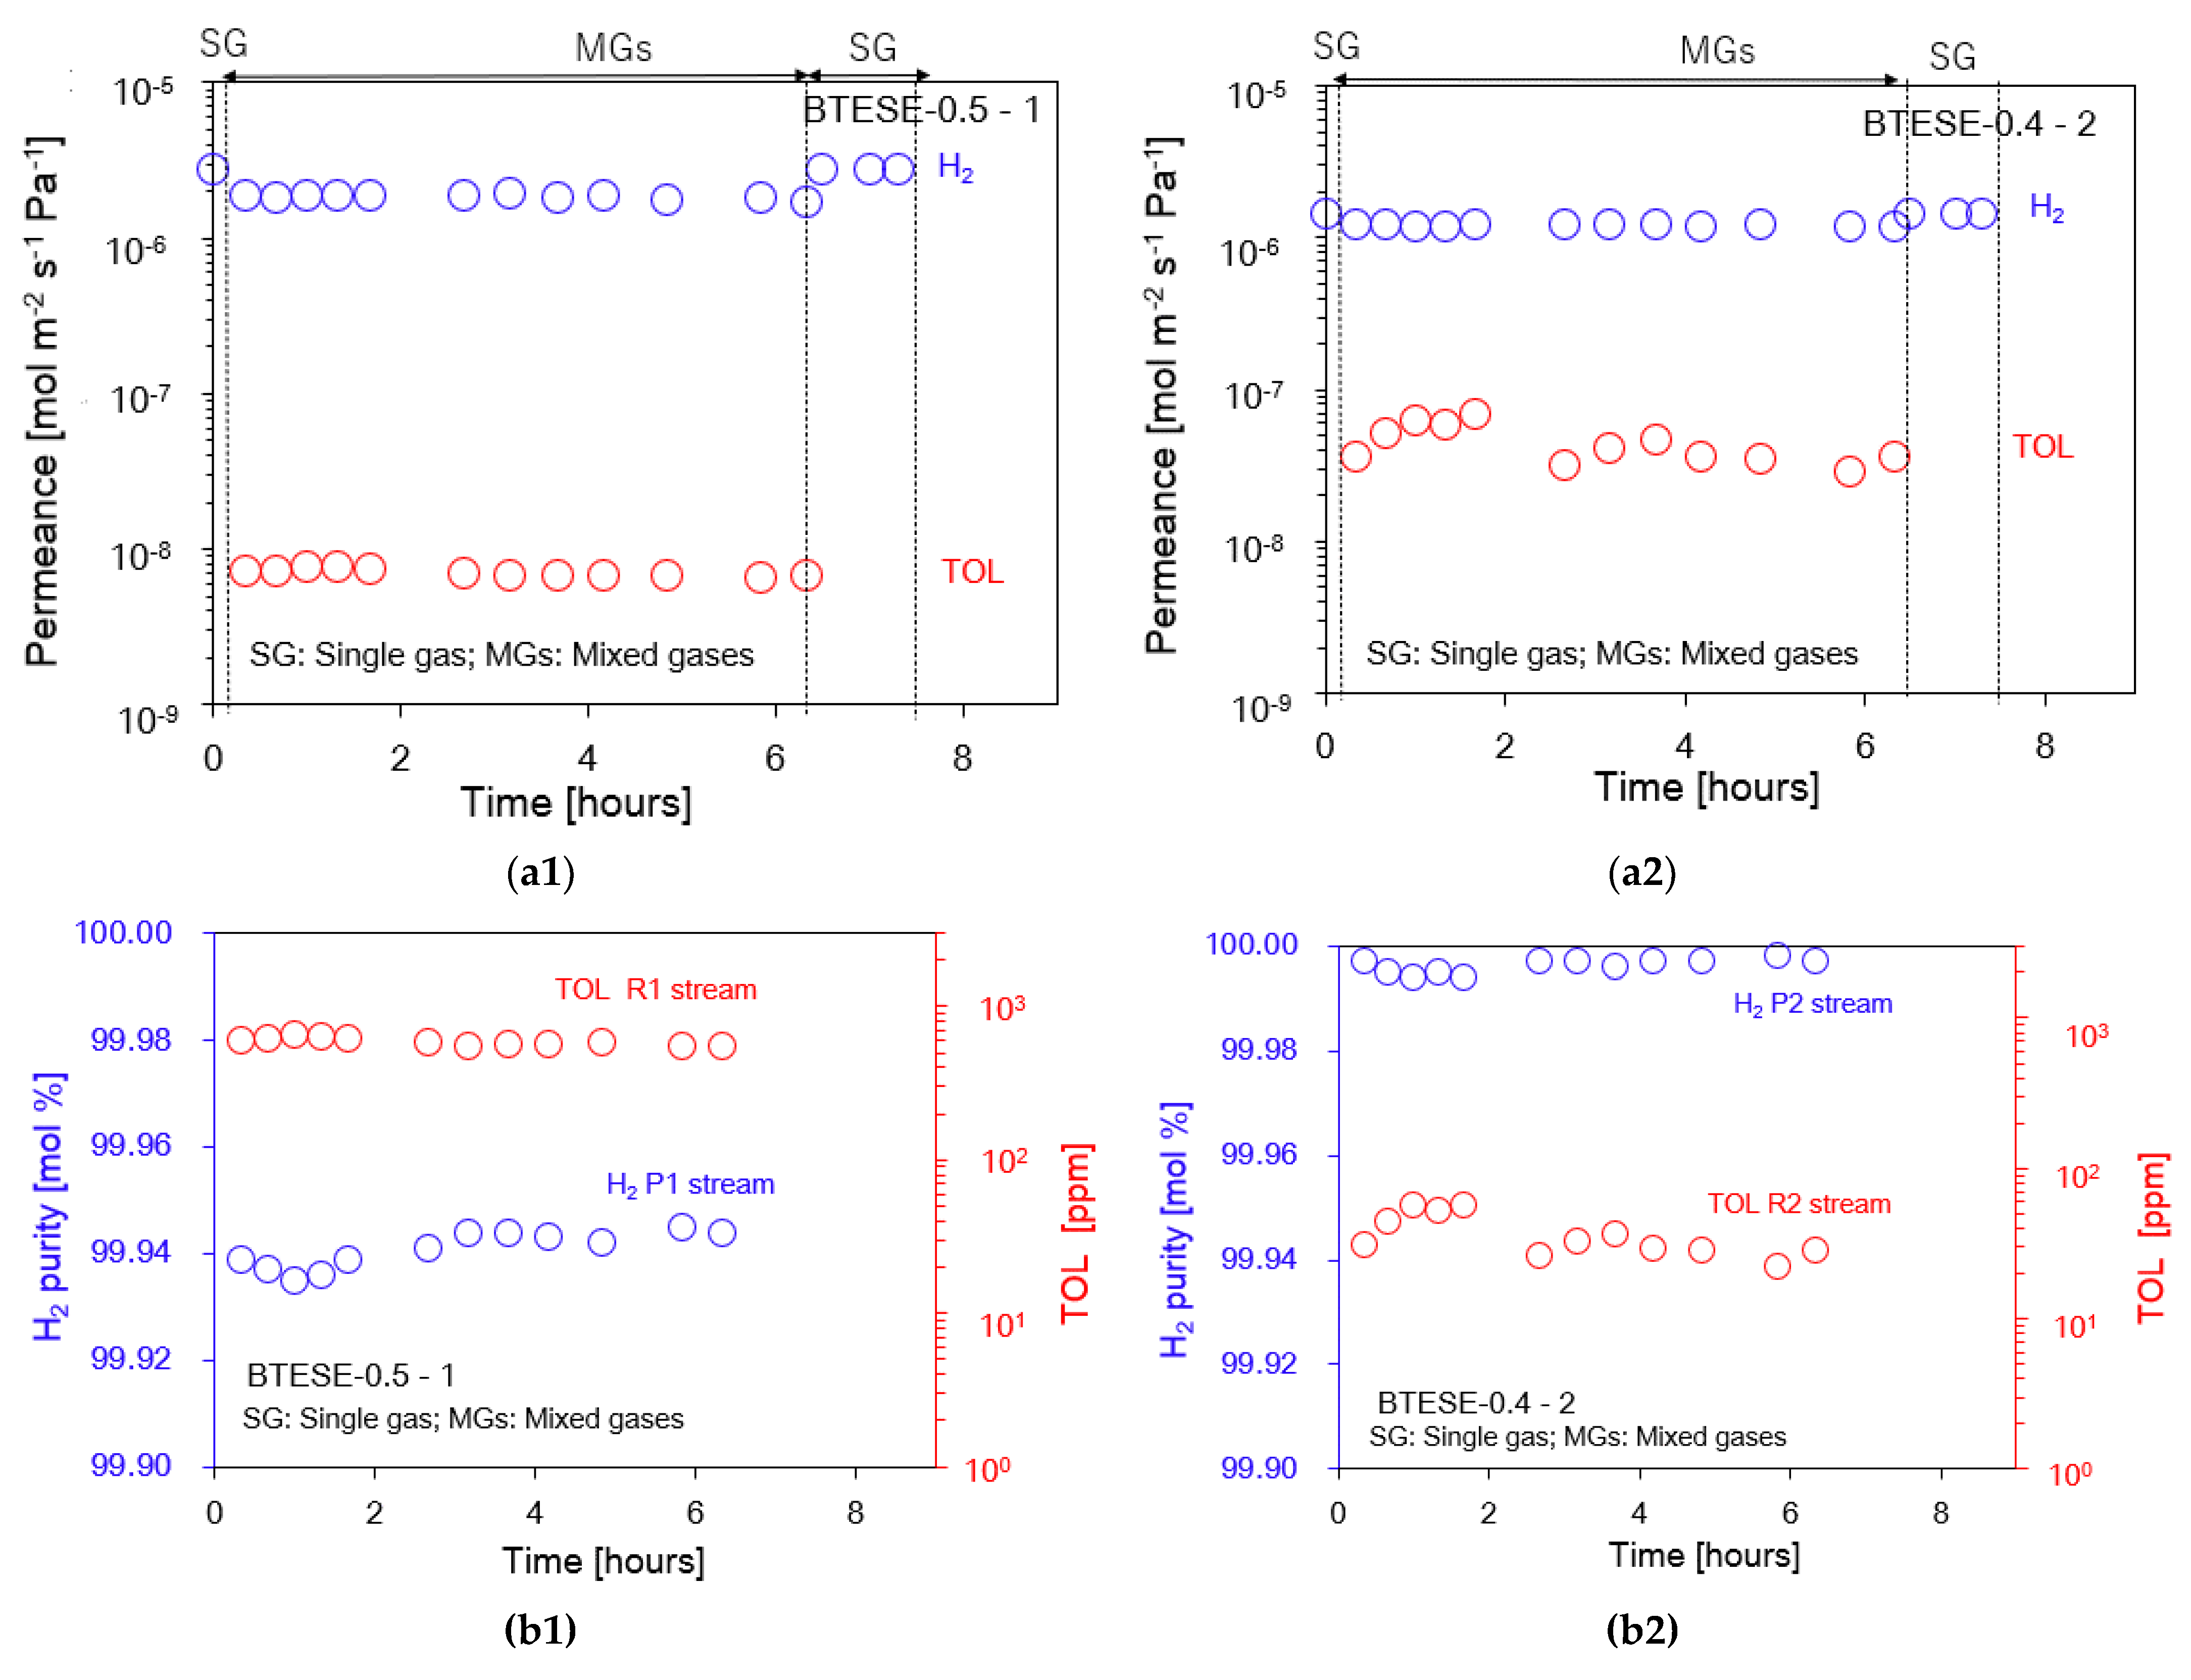
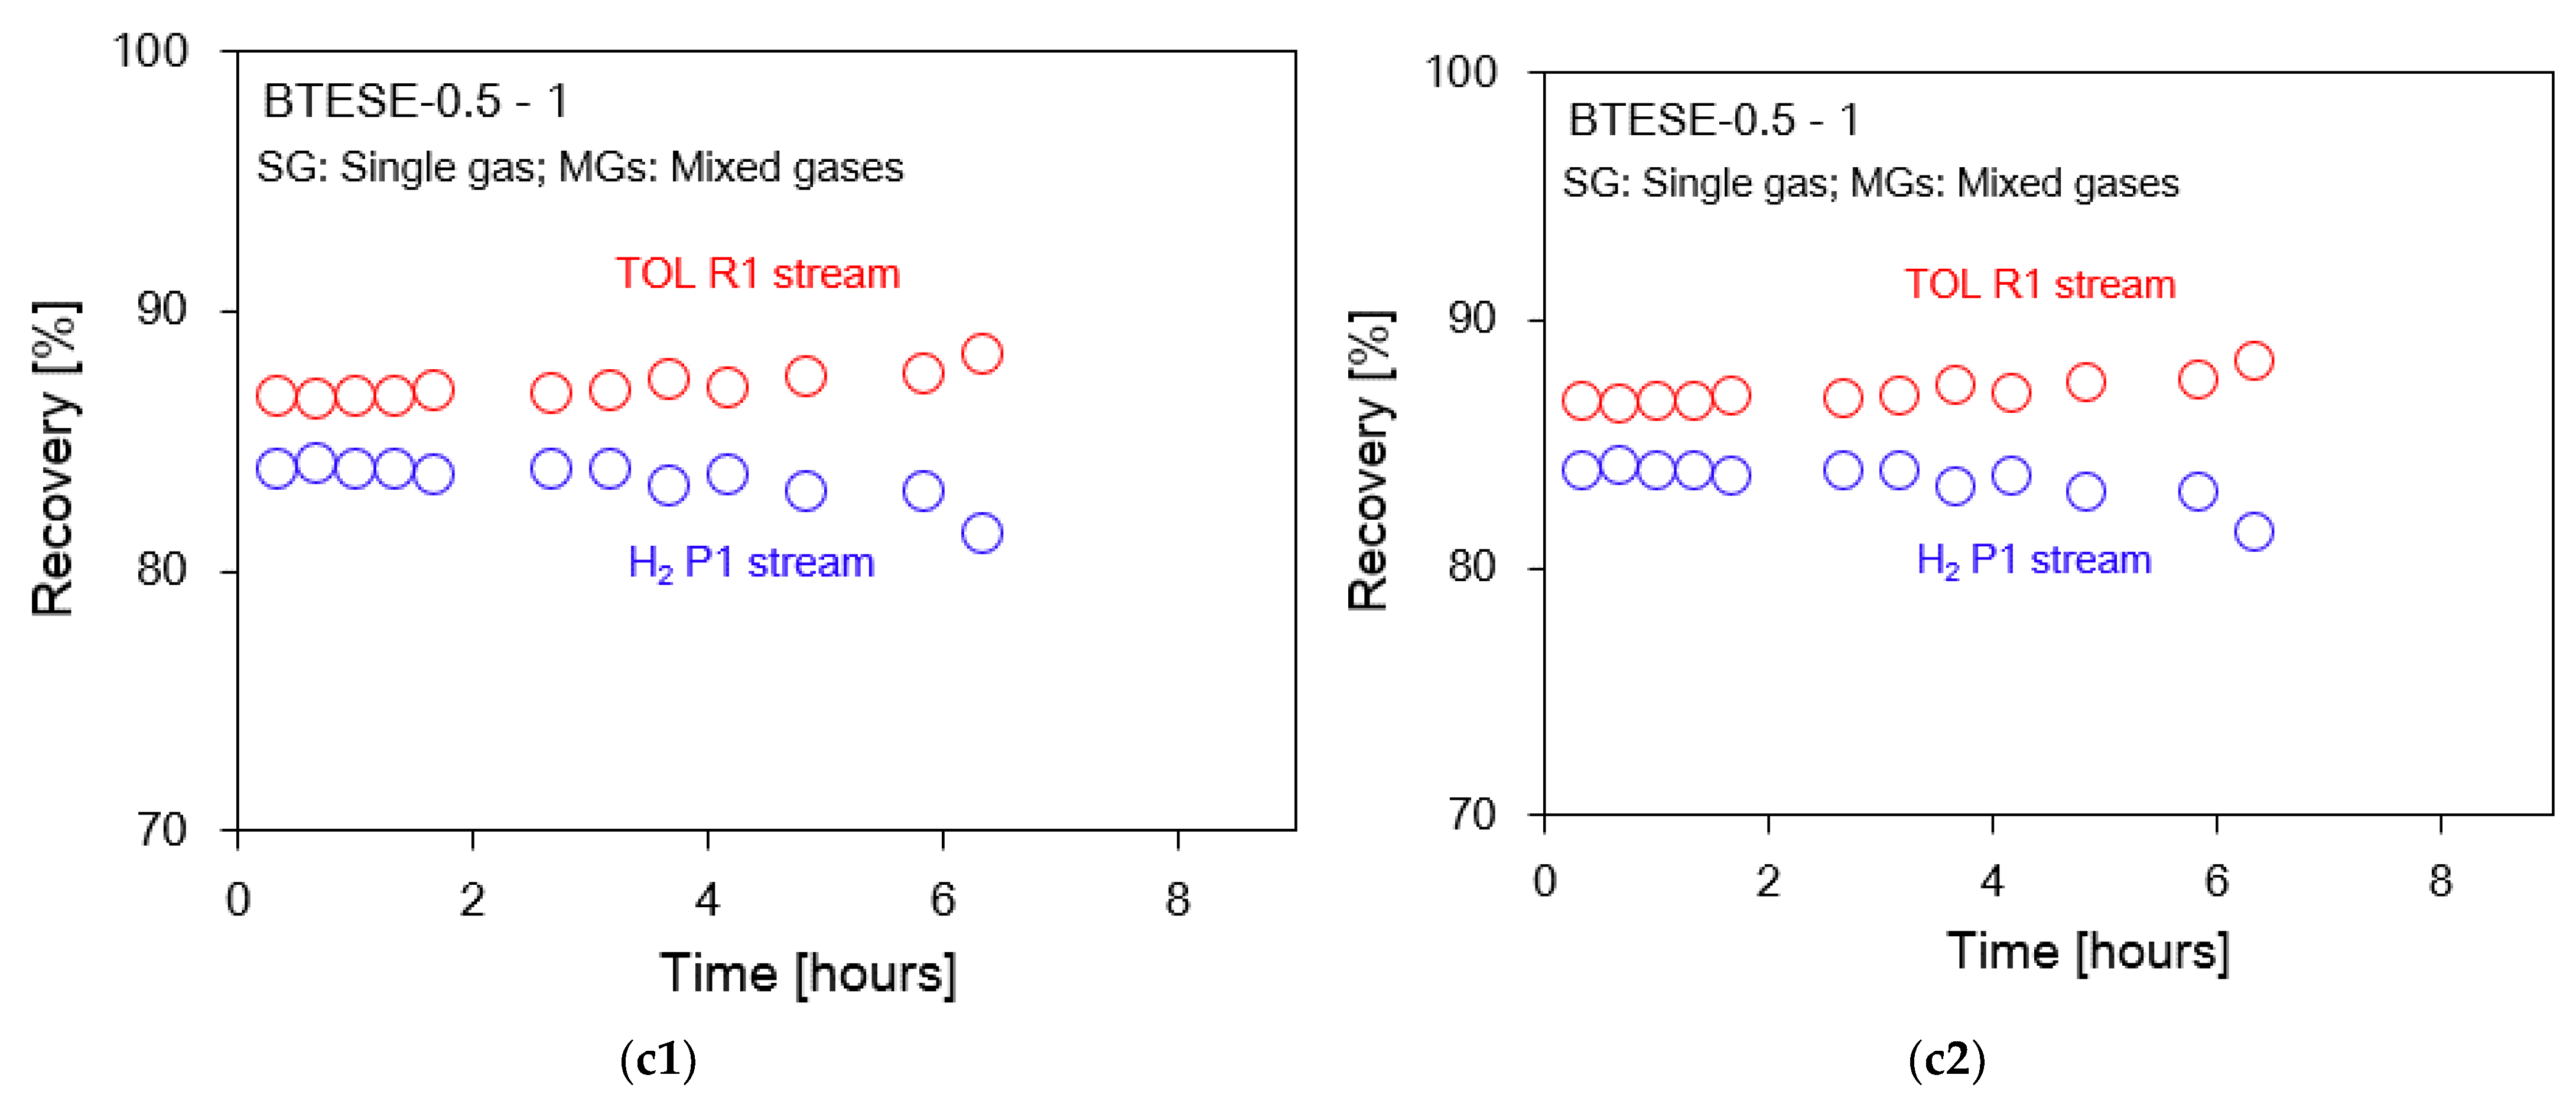
Figure 12 reveals the time course of separation performance of the two-stage membrane configuration system consisting of the BTESE-0.5-1 and BTESE-0.4-2 membranes for an almost 6 h H2/TOL separation test. After the 6 h H2/TOL separation test, the single H2 permeance can still recover to the same value as the initial value of the H2 single gas permeance for one- and two-stage membranes, as shown in Figure 12a1,a2. In addition, our target was that the H2 permeance should be more than 1 × 10⁻⁶ mol m−2 s−1 Pa−1. As can be seen after 6 h, the H2 permeance for both membranes is still above 1 × 10⁻⁶ mol m−2 s−1 Pa−1. It can be observed that the H2 purity, TOL concentration, and H2 and TOL recovery in permeate and retentate for both one- and two-stage membranes were stable for the 6 h H2/TOL separation test, as shown in Figure 12b1,b2. The BTESE-0.5-1 membrane enabled H2 purity > 99.9 mol% in the permeate (P1) stream; nevertheless, the TOL concentration remained higher than 200 ppm. Due to this reason, we purified the P1 stream with another membrane to reduce the TOL concentration to 200 ppm. By applying the two-stage membrane system, the TOL concentration was reduced to be below 200 ppm, and at the same time, the H2 purity was still >99.9 mol% (Figure 12b2). Figure 12c1,c2 show H2 recovery in permeate and TOL recovery in retentate in the first and second membranes. More than 80% recovery of H2 and TOL was achieved in the first membrane. Approximately 40% H2 recovery with a purity of >99.99% was achieved via two-stage configurations.
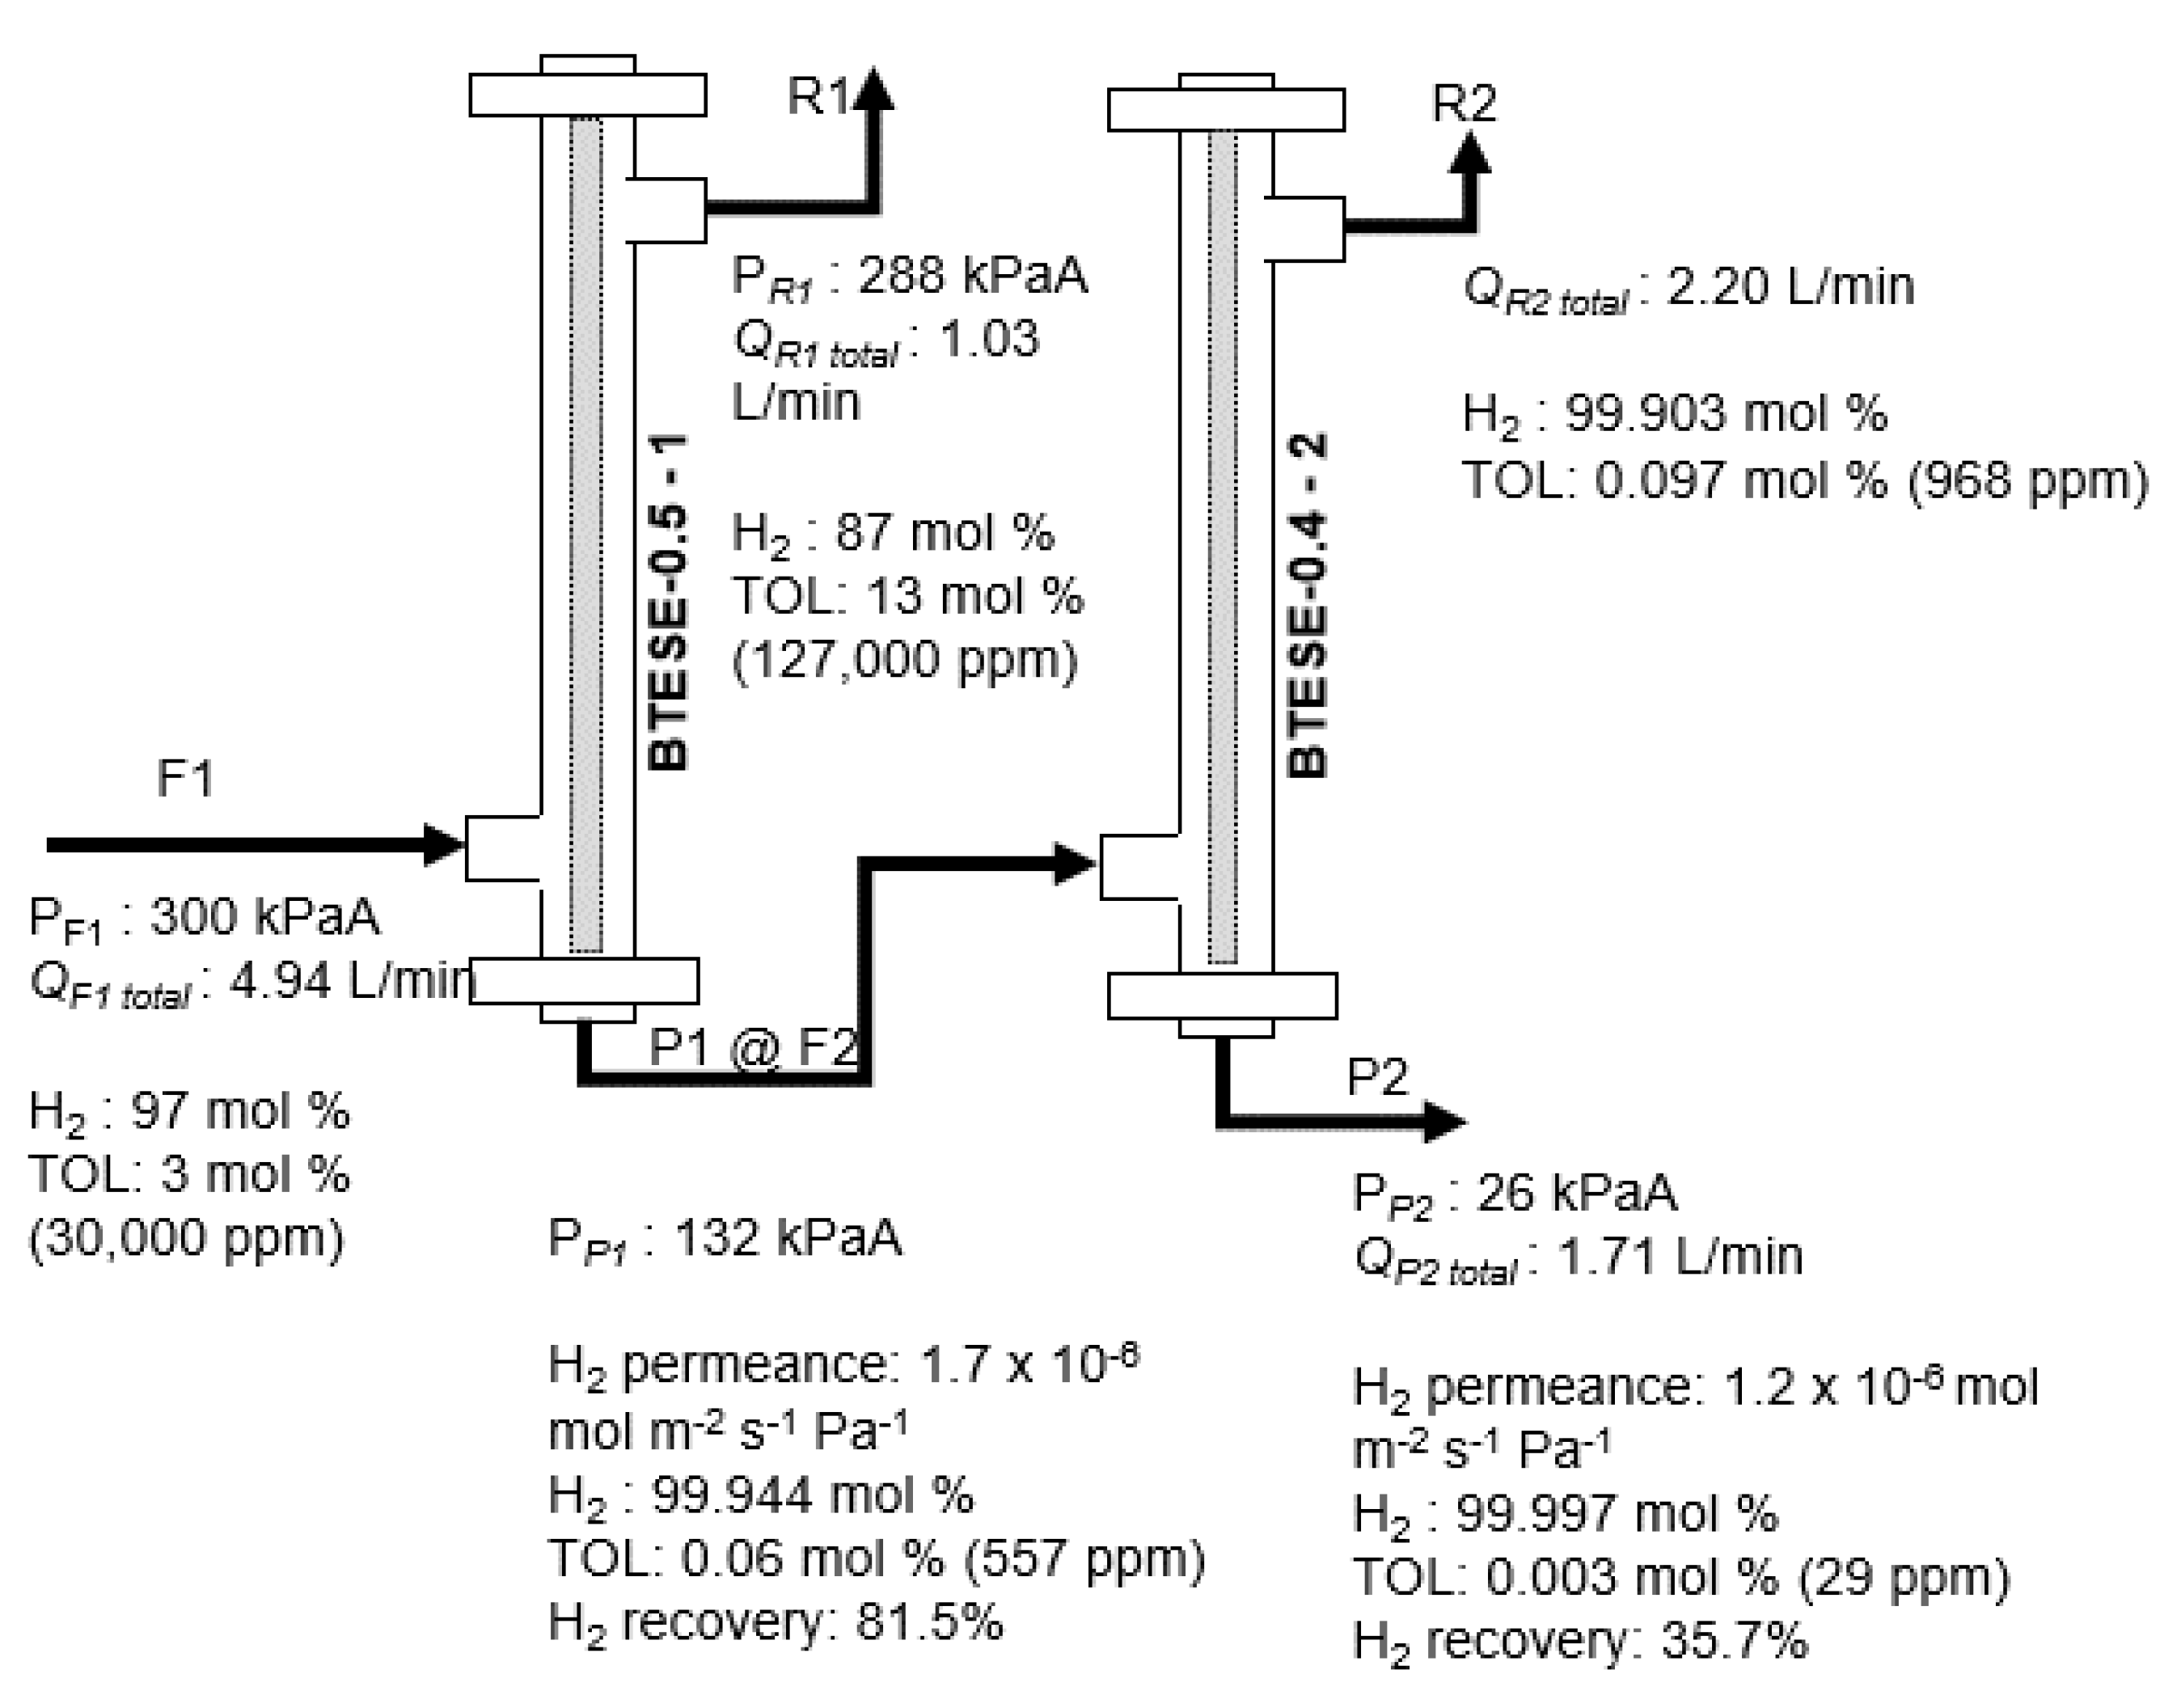
Meanwhile, Figure 13 shows the time course of the performance of the two-stage membrane configuration system at three different temperatures (100, 150, and 200 °C) for a 7 h H2/TOL separation test. It can be seen that at 150 and 200 °C, the H2 permeance for both membranes exceeds 1 × 10⁻⁶ mol m−2 s−1 Pa−1. At temperatures of 150 and 200 °C, the H2 purity in the P2 stream is over 99.99 mol%, while the TOL concentration is around 50 ppm. In addition to this, it can be observed that the final product for the H2 purity and TOL concentration in the P2 stream as a function of time at temperatures between 150 and 200 °C seems to reach a steady state, probably 2 h after supplying the H2/TOL gas mixtures. However, at 100 °C, H2 purity and TOL concentration in the P2 stream are not up to the same performance values as at 150 and 200 °C. This is due to the low permeance of H2 gas via the one- and two-stage membrane modules, which resulted in a low permeance ratio of H2/TOL ~below 50 and 20 (Figure 13a), respectively. Hence, the H2/TOL separation test took a longer time to reach its steady state, probably because some TOL molecules gradually blocked the pore network of the membranes; hence, a longer time is required for H2 gas to pass through. In addition, there is no additional pressure applied to the two-stage membrane; hence, it can be considered another possible reason for this observation. Based on the final result, 150 and 200 °C are the recommended temperatures for H2/TOL separation via the BTESE membrane. Detailed operating data of the two-stage membrane configurations at 200 °C using the BTESE-0.5-1 and BTESE-0.4-2 membrane configuration systems are shown in Figure 14.

4. Conclusions

The present study has effectively demonstrated that we can adjust the pore size distribution of our BTESE membranes by changing the number of coating layers. Despite variations in pore diameters, all of the in-house BTESE membranes showed a H2 permeance greater than 10−6 mol m−2 s−1 Pa−1, with H2/SF6 > 1000. Additionally, the present study also marks the successful preparation of 40 cm long BTESE membranes for H2/TOL separation. The BTESE membranes showed a reasonable correlation for H2/TOL against H2/N2 and H2/SF6. By applying the two-stage BTESE membrane system configuration, it has been shown that the TOL concentration in the permeate stream can be lowered below 200 ppm while the H2 purity is >99.999 mol% and stable for 6 h of operation.

Author Contributions

S.M.I.: methodology, formal analysis, investigation—experimental, writing—original draft preparation, writing—review and editing; X.Y.: formal analysis—H2/TOL system/micro GC equipment setting and setup; S.M.: formal analysis—membrane preparation; K.M.: formal analysis—BTESE solution preparation; F.S.: formal analysis—micro GC equipment setting and setup; S.O.L.: formal analysis—membrane characterization; T.T.: supervision, conceptualization, writing—review and editing; K.-i.S.: supervision, conceptualization, funding acquisition. All authors have read and agreed to the published version of the manuscript.

Funding

This research was funded by the METI Monozukuri R&D Support Grant Program for SMEs Grant Number JPJ005698.

Institutional Review Board Statement

Not applicable.

Data Availability Statement

The raw data supporting the conclusions of this article will be made available by the authors on request.

Acknowledgments

This article is based on results obtained from a project, JPJ005698, subsidized by the Ministry of Economy, Trade and Industry (METI).

Conflicts of Interest

Authors S.M.I., X.Y., K.M., S.M., F.S., S.O.L., T.T. and K.-i.S. were employed by the company eSep Inc. The remaining authors declare that the research was conducted in the absence of any commercial or financial relationships that could be construed as a potential conflict of interest.

References

  1. EU. Hydrogen and Fuel Cells—A Vision of Our Future. High Level Group Draft Report v4.8. Publications Office. 2003. Available online: https://inis.iaea.org/search/search.aspx?orig_q=RN:37121708 (accessed on 22 July 2024).
  2. Levin, D.B.; Chahine, R. Challenges for renewable hydrogen production from biomass. Int. J. Hydrogen Energy 2010, 35, 4962–4969. [Google Scholar] [CrossRef]
  3. Rambhujun, N.; Salman, M.S.; Wang, T.; Pratthana, C.; Sapkota, P.; Costalin, M.; Lai, Q.; Aguey-Zinsou, K.F. Renewable hydrogen for the chemical industry. MRS Energy Sustain. 2020, 7, E33. [Google Scholar] [CrossRef] [PubMed]
  4. IEA. The Future of Hydrogen. 2019. Available online: https://www.iea.org/reports/the-future-of-hydrogen (accessed on 22 July 2024).
  5. Giuli, M. Geopolitics of the Energy Transition. In Handbook of Energy Transitions; CRC Press: Boca Raton, FL, USA, 2022; pp. 41–59. [Google Scholar]
  6. Liu, C.; Zhang, X.; Zhai, J.; Li, X.; Guo, X.; He, G. Research progress and prospects on hydrogen separation membranes. Clean Energy 2023, 7, 217–241. [Google Scholar] [CrossRef]
  7. Bernado, G.; Arau’jo, T.; da Silva Lopes, T.; Sousa, J.; Mendes, A. Recent advances in membrane technologies for hydrogen purification. Int. J. Hydrogen Energy 2020, 45, 7313–7338. [Google Scholar] [CrossRef]
  8. Adhikari, S.; Fernando, S. Hydrogen Membrane Separation Techniques. Ind. Eng. Chem. Res. 2006, 45, 875–881. [Google Scholar] [CrossRef]
  9. Freeman, B.D.; Pinnau, I. Gas and liquid separations using membranes: An overview. In Advanced Materials for Membrane Separations; Pinnau, I., Freeman, B.D., Eds.; ACS Symposium Series; ACS: Washington, DC, USA, 2004; Volume 876, pp. 1–21. [Google Scholar]
  10. Kayı, H.; Kaya, P.; Kurt, T.; Mirza, E.S.; Topuz, B. Ti-substituted organosilica membranes for H2 sieving: Sol-gel and DFT insights. Int. J. Hydrogen Energy 2024, 65, 496–504. [Google Scholar] [CrossRef]
  11. Moriyama, N.; Nagasawa, H.; Kanezashi, M.; Tsuru, T. Improved performance of organosilica membranes for steam recovery at moderate-to-high temperatures via the use of a hydrothermally stable intermediate layer. J. Membr. Sci. 2021, 620, 118895. [Google Scholar] [CrossRef]
  12. Sawamura, K.; Okamoto, S.; Todokoro, Y. Development of Mass Production Technology of Highly Permeable Nano-Porous 534 Supports for Silica-Based Separation Membranes. Membranes 2019, 9, 103. [Google Scholar] [CrossRef]
  13. Ibrahim, S.M.; Sawamura, K.; Mishina, K.; Yu, X.; Salak, F.; Miyata, S.; Moriyama, N.; Nagasawa, H.; Kanezashi, M.; Tsuru, T. Bis(triethoxysilyl)ethane (BTESE)–Organosilica Membranes for H2O/DMF Separation in Reverse Osmosis (RO): Evaluation and Correlation of Subnanopores via Nanopermporometry (NPP), Modified Gas Translation (mGT) and RO Performance. Membranes 2024, 14, 8. [Google Scholar] [CrossRef]
  14. Niimi, T.; Nagasawa, H.; Kanezashi, M.; Yoshioka, T.; Ito, K.; Tsuru, T. Preparation of BTESE-derived organosilica membranes for catalytic membrane reactors of methylcyclohexane dehydrogenation. J. Membr. Sci. 2014, 455, 375–383. [Google Scholar] [CrossRef]
  15. Raza, W.; Yang, J.; Wang, J.; Saulat, H.; He, G.; Lu, J.; Zhang, Y. HCl modification and pervaporation performance of BTESE membrane for the dehydration of acetic acid/water mixture. Sep. Purif. Technol. 2020, 235, 116102. [Google Scholar] [CrossRef]
  16. Ibrahim, S.M.; Nagasawa, H.; Kanezashi, M.; Tsuru, T. Organosilica bis(triethoxysilyl)ethane (BTESE) membranes for gas permeation (GS) and reverse osmosis (RO): The effect of preparation conditions on structure, and the correlation between gas and liquid permeation properties. J. Membr. Sci. 2017, 526, 242–251. [Google Scholar] [CrossRef]
  17. Xu, R.; Liu, Q.; Ren, X.; Lin, P.; Zhong, J. Tuning the Pore Structures of Organosilica Membranes for Enhanced Desalination Performance via the Control of Calcination Temperatures. Membranes 2020, 10, 392. [Google Scholar] [CrossRef] [PubMed]
  18. Song, H.; Wei, Y.; Qi, H. Tailoring pore structures to improve the permselectivity of organosilica membranes by tuning calcination parameters. J. Mater. Chem. A 2017, 5, 24657–24666. [Google Scholar] [CrossRef]
  19. Ren, Y.; He, D.; Wang, T.; Qi, H. Effect of ZIF-7 doping content on H2/CO2 separation performance of 1,2-bis(triethoxysilyl)ethane-derived organosilica membranes. Sep. Purif. Technol. 2023, 311, 123347. [Google Scholar] [CrossRef]
  20. Zhang, H.; He, D.; Niu, S.; Qi, H. Tuning the microstructure of organosilica membranes with improved gas permselectivity via the co-polymerization of 1,2-bis(triethoxysilyl) ethane and 1,2-bis(triethoxysilyl)methane. Int. J. Hydrogen Energy 2021, 46, 17221–17230. [Google Scholar] [CrossRef]
  21. Osman, A.I.; Mehta, N.; Elgarahy, A.M.; Hefny, M.; Al-Hinai, A.; Al-Muhtaseb, A.H.; Rooney, D.W. Hydrogen production, storage, utilisation and environmental impacts: A review. Environ. Chem. Lett. 2022, 20, 153–188. [Google Scholar] [CrossRef]
  22. Massarweh, O.; Al-Khuzaei, M.; Al-Shafi, M.; Bicer, Y.; Abushaikha, A.S. Blue hydrogen production from natural gas reservoirs: A review of application and feasibility. J. CO2 Util. 2023, 70, 102438. [Google Scholar] [CrossRef]
  23. Noussan, M.; Raimondi, P.P.; Scita, R.; Hafner, M. The role of green and blue hydrogen in the energy transition—A technological and geopolitical perspective. Sustainability 2021, 13, 298. [Google Scholar] [CrossRef]
  24. Alhumaidan, F.; Cresswell, D.; Garforth, A. Hydrogen Storage in Liquid Organic Hydride: Producing Hydrogen Catalytically from Methylcyclohexane. Energy Fuels 2011, 25, 4217–4234. [Google Scholar] [CrossRef]
  25. Seshimo, M.; Urai, H.; Sasa, K.; Nishino, H.; Yamaguchi, Y.; Nishida, R.; Nakao, S. Bench-Scale Membrane Reactor for Methylcyclohexane Dehydrogenation using Silica Membrane Module. Membranes 2021, 11, 326. [Google Scholar] [CrossRef] [PubMed]
  26. Ali, J.K.; Baiker, A. Dehydrogenation of methylcyclohexane to toluene in a pilot-scale membrane reactor. Appl. Catal. A-Gen. 1997, 155, 41–57. [Google Scholar] [CrossRef]
  27. Kreuder, H.; Boeltken, T.; Cholewa, M.; Meier, J.; Pfeifer, P.; Dittmeyer, R. Heat storage by the dehydrogenation of methylcyclohexane—Experimental studies for the design of a microstructured membrane reactor. Int. J. Hydrogen Energy 2016, 41, 12082–12092. [Google Scholar] [CrossRef]
  28. Li, G.; Niimi, T.; Kanezashi, M.; Yoshioka, T.; Tsuru, T. Equilibrium shift of methylcyclohexane dehydrogenation in a thermally stable organosilica membrane reactor for high-purity hydrogen production. Int. J. Hydrogen Energy 2013, 38, 15302–15306. [Google Scholar] [CrossRef]
  29. Acharya, D.; Ng, D.; Xie, Z. Recent Advances in Catalysts and Membranes for MCH Dehydrogenation: A Mini Review. Membranes 2021, 11, 955. [Google Scholar] [CrossRef] [PubMed]
  30. Zhang, X.L.; Akamatsu, K.; Nakao, S. Hyrogen Separation in Hydrogen-Methylcylohexane-Toluene Gaseous Mixtures through Triphenylmethoxysilane-derived Silica Membranes Prepared by Chemical Vapor Deposition. Ind. Eng. Chem. Res. 2016, 55, 5395–5402. [Google Scholar] [CrossRef]
  31. Kida, K.; Maeta, Y.; Kuno, T.; Yogo, K. Hydrogen Purification from Chemical Hydride Using Pure Silica Zeolite Membranes. Chem. Lett. 2017, 46, 1724–1727. [Google Scholar] [CrossRef]
  32. Seshimo, M.; Saito, T.; Akamatsu, K.; Segawa, A.; Nakao, S. Influence of toluene vapor on the H2-selective performance of dimethoxydiphenylsilane-derived silica membranes prepared by the chemical vapor deposition method. J. Membr. Sci. 2012, 415–416, 51–56. [Google Scholar] [CrossRef]
  33. Lee, H.L.; Kanezashi, M.; Shimomura, Y.; Yoshioka, T.; Tsuru, T. Evaluation and fabrication of pore size tune silica membranes with tetraethoxydimetyl disiloxane for gas separation. AIChE J. 2011, 57, 2755–2765. [Google Scholar] [CrossRef]
  34. Xiao, J.; Wei, J. Diffusion mechanism of hydrocarbons in zeolites-I. Theory. Chem. Eng. Sci. 1992, 47, 1123–1142. [Google Scholar] [CrossRef]
  35. Shelekhin, A.B.; Dixon, A.G.; Ma, Y.H. Theory of gas diffusion and permeation in inorganic molecular-sieve membranes. AIChE J. 1995, 41, 58–67. [Google Scholar] [CrossRef]
  36. Kumakiri, I.; Qiu, L.; Liu, N.; Tanaka, K.; Kita, H.; Sato, T.; Nishida, R. Application of MFI Zeolite Membrane Prepared with Fluoride Ions to Hydrogen/Toluene. Sep. J. Chem. Eng. Jpn. 2016, 49, 753–755. [Google Scholar] [CrossRef]
  37. Hirota, Y.; Maeda, Y.; Yamamoto, Y.; Miyamoto, M.; Nishiyama, N. Organosilica membrane with ionic liquid properties for separation of toluene/H2 mixture. Materials 2017, 10, 901. [Google Scholar] [CrossRef] [PubMed]
  38. Li, G.; Kanezashi, M.; Yoshioka, T.; Tsuru, T. Ammonia decomposition in catalystic membrane reactors: Simulation and experimental studies. AIChE J. 2013, 59, 168–179. [Google Scholar] [CrossRef]
  39. Imasaka, S.; Nakai, A.; Araki, S.; Yamamoto, H. Syntesis and Gas Permeation Properties of STT-type Zeolite Membranes. J. Jpn. Pet. Inst. 2018, 61, 263–271. [Google Scholar] [CrossRef]
  40. Camblor, M.A.; Diaz-Cabanas, M.J.; Perez-Pariente, J.; Teat, S.J.; Clegg, W.; Shannon, J.; Lightfoot, P.; Wright, P.A.; Morris, R.E. SSZ-23: An Odd Zeolite with Pore Openings of Seven and Nine Tetrahedral Atoms. Angew. Chem. Int. Ed. 1998, 37, 2122–2126. [Google Scholar] [CrossRef]
  41. Funke, H.H.; Argo, A.M.; Falconer, J.L.; Noble, R.D. Separations of Cyclic, Branched and Linear Hydrocarbon Mixtures through Silicate Membranes. Ind. Eng. Chem. Res. 1997, 36, 137–143. [Google Scholar] [CrossRef]
Figure 1. BTESE sample coding.
Membranes 14 00165 g001
Figure 2. SEM image of a cross-section of a BTESE membrane.
Membranes 14 00165 g002
Figure 3. Hydrogen (H2)/toluene (TOL) separation, (a) one-stage and (b) two-stage membrane system configurations.
Membranes 14 00165 g003
Figure 4. Single gas permeance vs. molecular size (* gas permeation evaluated at 200 °C; ** gas permeation evaluated at 300 °C).
Membranes 14 00165 g004
Figure 5. Permeance ratio of H2/N2 and H2/SF6 vs. H2 permeance (* gas permeation evaluated at 200 °C; ** gas permeation evaluated at 300 °C).
Membranes 14 00165 g005
Figure 6. (ac) The pore size estimation via the NKP method as a function of the molecular size of permeating gases (symbols and curves indicate the experimental data and the theoretical curves for dp ~0.7, 0.5 and 0.4 nm, respectively). * Gas permeation in this work was evaluated at 200 °C; ** gas permeation in [31] was evaluated at 300 °C.
Membranes 14 00165 g006
Figure 7. H2/TOL separation test for one-stage membrane system configuration, (a) H2 and TOL permeance; (b) H2 purity [mol %] and TOL concentration [ppm] in the permeate stream; (c) H2 purity [mol %] and TOL concentration [ppm] in the retentate stream; and (d) H2 recovery in permeate and TOL recovery in retentate stream.
Membranes 14 00165 g007
Figure 8. H2/TOL and TOL/H2 permeance ratios versus H2 permeance of BTESE and other inorganic membranes using a one-stage membrane system.
Membranes 14 00165 g008
Figure 9. Permeance ratio of the mixed H2/TOL versus single-gas H2/N2 (a) and permeance ratio of the mixed H2/TOL versus single-gas H2/SF6 (b).
Membranes 14 00165 g009
Figure 10. (a) H2 permeance in binary (H2/TOL) and single system and (b) TOL permeance versus SF6 permeance (* gas permeation evaluated at 200 °C; ** gas permeation evaluated at 150 °C).
Membranes 14 00165 g010
Figure 11. The H2 and TOL permeance dependence on temperature (bottom) and H2/TOL permeance ratio (top).
Membranes 14 00165 g011
Figure 12. H2/TOL separation test for two-stage membrane system configuration. (a) H2 and TOL permeance in the permeate P1 streams (a1) and permeate P2 streams (a2); (b) H2 purity [mol %] and TOL concentration [ppm] in the permeate (P1 and R1) stream (b1) and the permeate (P2 and R2) stream (b2); (c) H2 recovery in permeate (P1) and TOL recovery (R1) in retentate streams (c1) and permeate (P2) and TOL recovery (R2) in retentate streams (c2).
Membranes 14 00165 g012aMembranes 14 00165 g012b
Figure 13. H2/TOL separation test at different temperatures (100, 150, 200 °C) for different membrane configurations: (a) H2 and TOL permeance in the first-stage membrane; (b) H2 and TOL permeance in the second-stage membrane; (c) H2 purity [mol %] in the second-stage membrane; and (d) TOL concentration in permeate stream in the second-stage membrane.
Membranes 14 00165 g013
Figure 14. Schematic diagram of the H2/TOL separation test for the BTESE-0.5-1 and BTESE-0.4-2 membrane configuration systems at 200 °C.
Membranes 14 00165 g014
Table 1. List of membrane samples.
Membrane
Lists
Coating Times of
Top Layers
BTESE Sols for
Top Layers
BTESE-0.7-141 wt.% BTESE sol after aging for 8 days at 50 °C
BTESE-0.5-15
BTESE-0.4-16
BTESE-0.4-2
BTESE-0.4-3
BTESE-0.4-4
Table 2. Summary of gas permeance, gas permeance ratio, and pore sizes of the BTESE and other inorganic membranes.
Membrane NumbersH2 Permeance
[10−6 mol m−2 s−1 Pa−1]
Permeance RatioNKP [nm]
H2/N2H2/SF6
BTESE-0.4-1 *0.43891991~0.46
BTESE-0.4-2 *1.331061908~0.46
BTESE-0.4-3 *1.36732321~0.47
BTESE-0.4-4 *1.38612051~0.47
BTESE-0.5-1 *2.1581846~0.54
BTESE-0.7-1 *4.456972~0.73
Si-CHA [31] **0.709778~0.55
Si-STT [31] **0.5025625~0.53
DMDPS [32] *1.00145000N/A
* Gas permeation evaluated at 200 °C; ** gas permeation evaluated at 300 °C.
Table 3. H2/TOL separation test performance of BTESE and other inorganic membranes via one-stage membrane process.
Membrane CodePressure [kPaA]Temperature
[°C]
H2/TOL
Concentration Feed
mol [%]
Permeate Stream Retentate StreamRefs
Permeance
[10−6 mol m−2 s−1 Pa−1]
H2/
TOL [-]
H2
Purity [mol %]
H2
Recovery
[%]
TOL
Concentration
[ppm]
TOL
Recovery [%]
TOL
Concentration
[ppm]
FeedPermeateH2TOL
BTESE-0.4-1200101.320097/30.320.0012325899.9728.828098.232,668[This work]
BTESE-0.4-2200101.320097/31.160.0058619899.95730.242898.541,730[This work]
BTESE-0.4-2300111.020097/30.960.011048799.91453.985995.360,149[This work]
BTESE-0.4-3200101.320097/31.210.0060220099.95834.141895.943,977[This work]
BTESE-0.4-4200101.320097/31.310.0057922799.96338.7375100.146,972[This work]
BTESE-0.5-1200101.320097/31.830.0083022199.95650.244196.156,490[This work]
BTESE-0.5-1300101.320097/31.730.0068125399.94481.555788.0127,303[This work]
BTESE-0.7-1200101.320097/32.150.123001799.45660.0544192.062,293[This work]
Si-CHA300101.39098/20.880.0050017699.989N/AN/AN/AN/A[31]
Si-CHA300101.312098/20.770.0052014899.987N/AN/AN/AN/A[31]
Si-CHA300101.315098/20.750.0055013699.984N/AN/AN/AN/A[31]
Si-STT300101.39098/20.180.0006030099.992N/AN/AN/AN/A[31]
Si-STT300101.312098/20.190.0006230699.992N/AN/AN/AN/A[31]
Si-STT300101.315098/20.200.0006530899.991N/AN/AN/AN/A[31]
DMDPSN/AN/A20098/20.90N/AN/A99.996 [32]
MFI300101.312098/20.040.009404N/AN/AN/AN/AN/A[36]
MFI300101.320098/20.160.025006N/AN/AN/AN/AN/A[36]
SILM22020070N/A0.00020.100.0020N/AN/AN/AN/AN/A[37]
ILOS22020070N/A0.000010.100.0001N/AN/AN/AN/AN/A[37]
Disclaimer/Publisher’s Note: The statements, opinions and data contained in all publications are solely those of the individual author(s) and contributor(s) and not of MDPI and/or the editor(s). MDPI and/or the editor(s) disclaim responsibility for any injury to people or property resulting from any ideas, methods, instructions or products referred to in the content.