Pretreatment of Glucose–Fructose Syrup with Ceramic Membrane Ultrafiltration Coupled with Activated Carbon

Abstract
1. Introduction
2. Materials and Methods
2.1. Experimental Materials
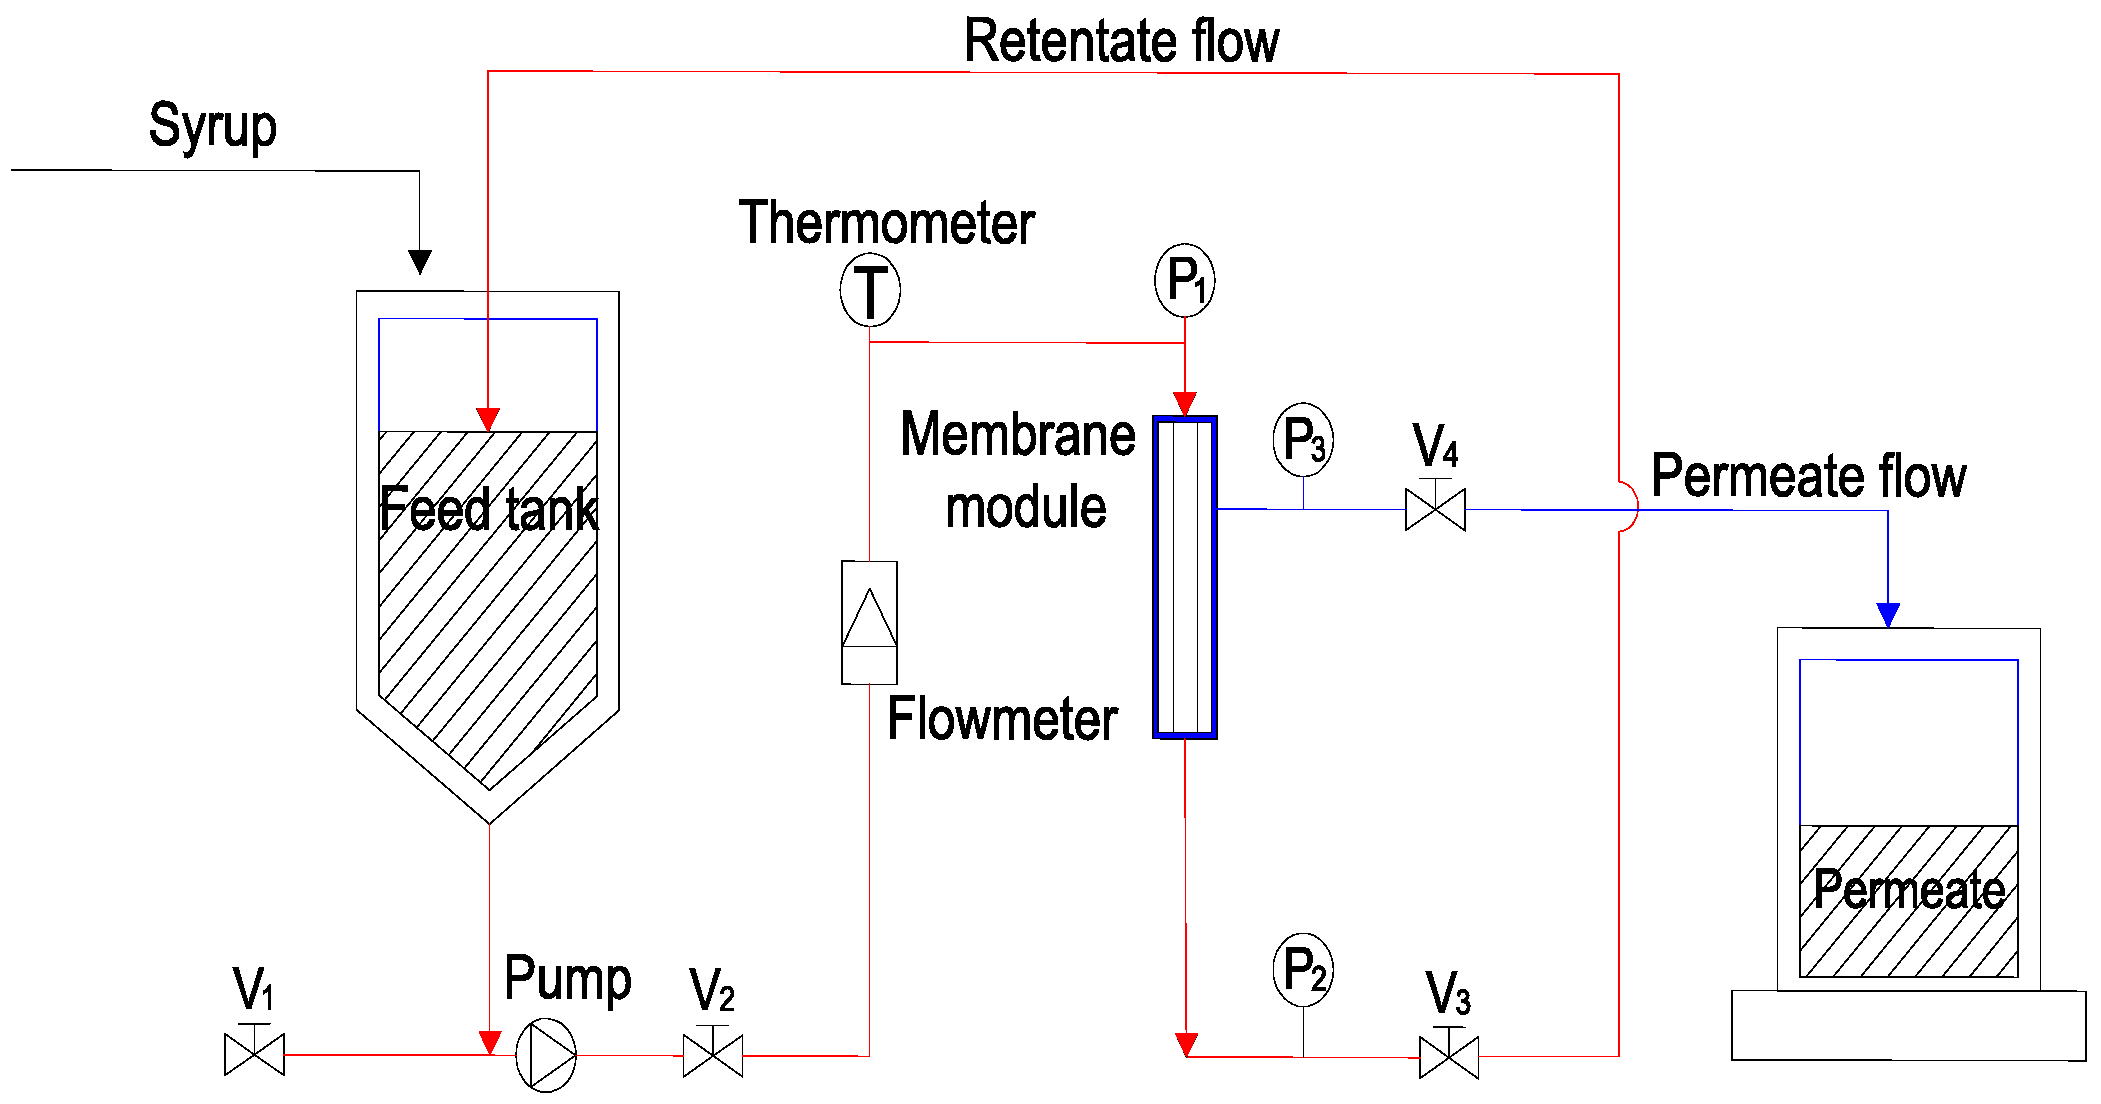
2.2. Experimental Setup
2.3. Experimental Methods
- r is the flux recovery rate (%);
- j1 is the deionized water flux of the new membrane (Lm−2 h−1); and
- j2 is the deionized water flux after cleaning (Lm−2 h−1).
2.4. Analytical Methods
3. Results and Discussions
3.1. Influence of Operating Parameters on Flux and Clarification of Glucose–Fructose Syrup
3.1.1. Temperature
3.1.2. Cross-Flow Velocity
3.1.3. Transmembrane Pressure
3.1.4. Flux Stability of Ceramic Membrane
3.2. Fouling Mechanism Models
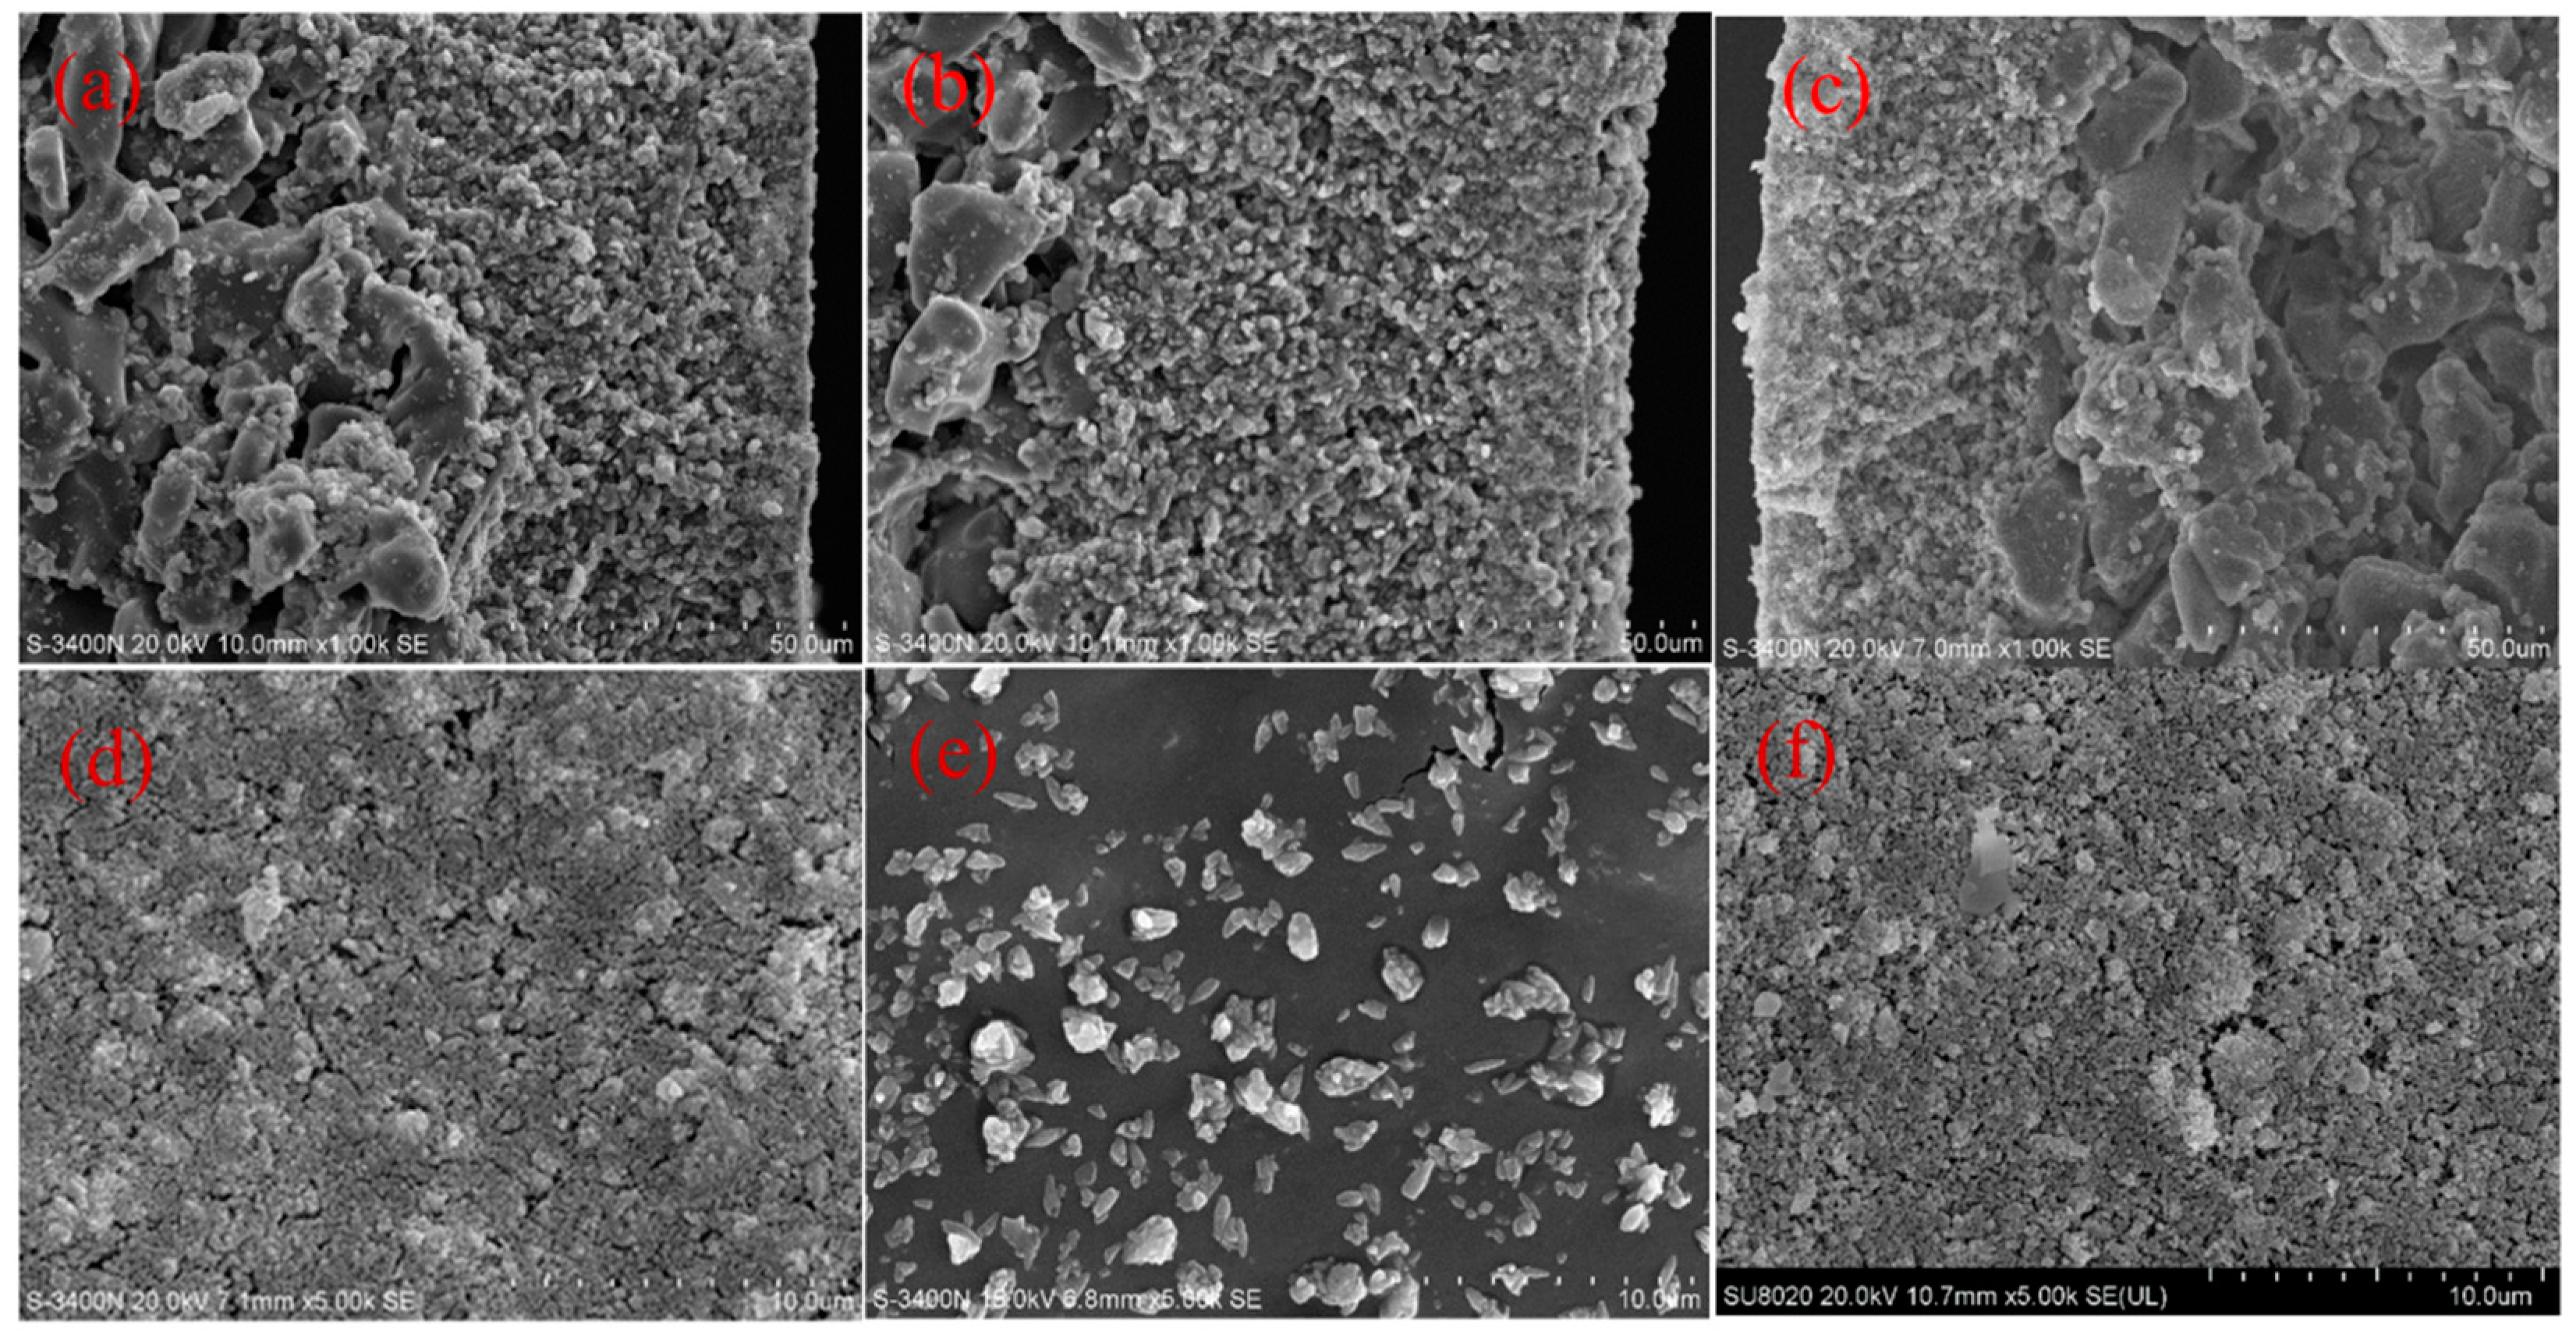
3.3. SEM Analysis
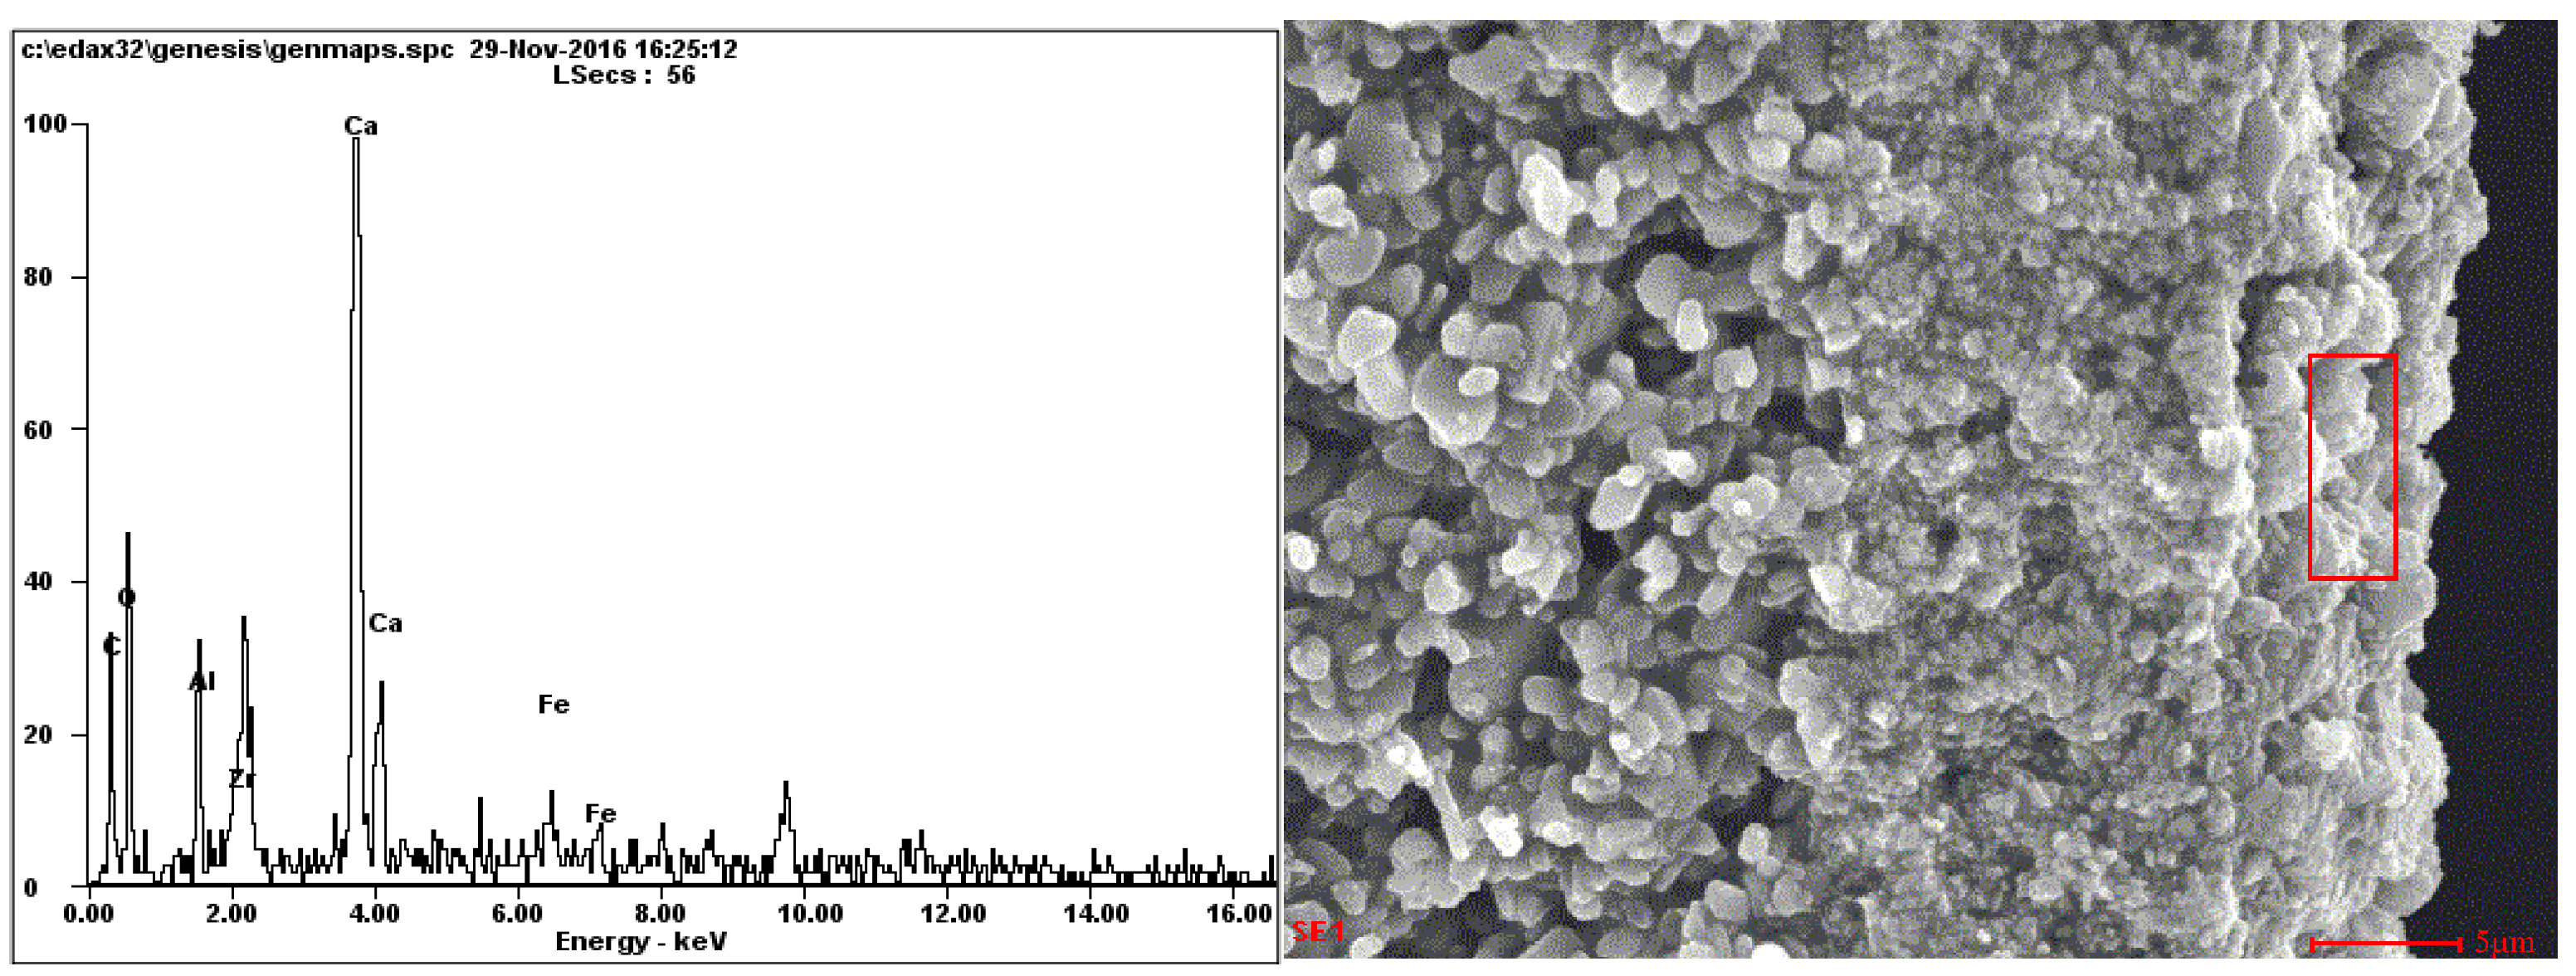
3.4. EDX Analysis
3.5. FTIR Analysis
3.6. Membrane Cleaning
4. Conclusions
- (1)
- At a temperature of 90 °C, a TMP of 2.5 bar, and a cross-flow velocity of 5 m/s under the total reflux operation, the flux decreased rapidly at the commencement of the experiment, but then tended to stabilize. The steady-state flux was 181.65 Lm−2 h−1. The flux of the ceramic membrane is stable and suitable for industrial applications.
- (2)
- Membrane fouling was studied using mathematical model prediction, SEM, EDX, and FTIR. The results indicated that the dominant fouling during ultrafiltration of glucose–fructose syrup was caused by cake formation on the membrane surface, and the membrane pore blocking was a secondary pollution.
- (3)
- Through the removal of suspended solids, the membrane-filtered glucose–fructose syrup was decolorized using activated carbon, and the filtration rate was effectively improved. The pretreatment of glucose–fructose syrup using ceramic membrane coupled with activated carbon results in low turbidity and colorless value.
Author Contributions
Funding
Institutional Review Board Statement
Data Availability Statement
Acknowledgments
Conflicts of Interest
References
- Madsen, R.F. Application of ultrafiltration and reverse osmosis to cane juice. Int. Sugar J. 1973, 75, 163–167. [Google Scholar]
- Doyle, C. Microfiltration of Clarified Juice to Increase Pan Stage Capacity; Sugar Research and Development Corporation: Brisbane, Australia, 1999. [Google Scholar]
- Chou, C.C. (Ed.) Handbook for Sugar Refining: A Manual for the Design and Operation of Sugar Refining Facilities; John Wiley & Sons, Inc.: Hoboken, NJ, USA, 2000. [Google Scholar]
- Jegatheesan, V.; Phong, D.D.; Shu, L.; Ben-Aim, R. Performance of ceramic micro- and ultrafiltration membranes treating limed and partially clarified sugar cane juice. J. Membr. Sci. 2009, 327, 69–77. [Google Scholar] [CrossRef]
- Saha, N.K.; Balakrishnan, M.; Ulbricht, M. Polymeric membrane fouling in sugarcane juice ultrafiltration: Role of juice polysaccharides. Desalination 2006, 189, 59–70. [Google Scholar] [CrossRef]
- Saha, N.K.; Balakrishnan, M.; Ulbricht, M. Sugarcane juice ultrafiltration: FTIR and SEM analysis of polysaccharide fouling. J. Membr. Sci. 2007, 306, 287–297. [Google Scholar] [CrossRef]
- Hinkova, A.; Bubník, Z.; Kadlec, P.; Pridal, J. Potentials of separation membranes in the sugar industry. Sep. Purif. Technol. 2002, 26, 101–110. [Google Scholar] [CrossRef]
- Nene, S.N.; Karode, S.K.; Courtois, T.; Mietton-Peuchot, M.; Gupta, B.B.; Ben-Aim, R. Filtration of raw cane sugar solutions with ceramic membranes. In Proceedings of the WFC8, Brighton, UK, 3–7 April 2000. [Google Scholar]
- Balakrishnan, M.; Dua, M.; Khairnar, P.N. Significance of the membrane type and feed streams in the ultrafiltration of sugar cane juice. Sep. Sci. Technol. 2001, 36, 619–637. [Google Scholar] [CrossRef]
- Hamachi, M.; Gupta, B.B.; Ben-Aim, R. Ultrafiltration: A means for decolorization of cane sugar solution. Sep. Purif. Technol. 2003, 30, 229–239. [Google Scholar] [CrossRef]
- Shahidi, M.; Razavi, S.M.A. Improving thin sugar beet juice quality through ultrafiltration. Desalination 2006, 200, 518–519. [Google Scholar] [CrossRef]
- Ghosh, A.M.; Balakrishnan, M. Pilot demonstration of sugarcane juice ultrafiltration in an Indian sugar factory. J. Food Eng. 2003, 58, 143–150. [Google Scholar] [CrossRef]
- Mak, F.K. Removal of colour impurities in raw sugar by ultrafiltration. Int. Sugar J. 1992, 93, 263–265. [Google Scholar]
- Karode, S.K.; Gupta, B.B.; Courtois, T. Ultrafiltration of Raw Indian Sugar Solution Using Polymeric and Mineral Membranes. Sep. Sci. Technol. 2000, 35, 2473–2483. [Google Scholar] [CrossRef]
- White, J.S. Straight talk about high-fructose corn syrup: What it is and what it ain’t. Am. J. Clin. Nutr. 2008, 88, 1716S–1721S. [Google Scholar] [CrossRef] [PubMed]
- Guerra, K.J.; Pellegrino, J.E. Drewes. Impact of operating conditions on permeate flux and process economics for cross flow ceramic membrane ultrafiltration of surface water. Sep. Purif. Technol. 2012, 87, 47–53. [Google Scholar] [CrossRef]
- Farmani, B.; Haddadekhodaparast, M.H.; Hesari, J.; Aharizad, S. Determining optimum conditions for sugarcane juice refinement by pilot plant dead-end ceramic micro-filtration. J. Agric. Sci. Technol. 2008, 10, 351–357. [Google Scholar]
- Li, W.; Ling, G.; Lei, F.; Li, N.; Peng, W.; Li, K.; Lu, H.; Hang, F.; Zhang, Y. Ceramic membrane fouling and cleaning during ultrafiltration of limed sugarcane juice. Sep. Purif. Technol. 2018, 190, 9–24. [Google Scholar] [CrossRef]
- Li, W.; Ling, G.Q.; Huang, P.; Li, K.; Lu, H.Q.; Hang, F.X.; Zhang, Y.; Xie, C.F.; Lu, D.J.; Li, H.; et al. Performance of ceramic microfiltration membranes for treating carbonated and filtered remelt syrup in sugar refinery. J. Food Eng. 2016, 170, 41–49. [Google Scholar] [CrossRef]
- Gaschi, P.D.S.; Gaschi, P.D.S.; Barros, S.T.D.D.; Pereira, N.C. Pretreatment with ceramic membrane microfiltration in the clarification process of sugarcane juice by ultrafiltration. Acta Sci-Technol. 2014, 36, 303–306. [Google Scholar] [CrossRef]
- Meng, L.; Shi, C.; Wen, T.; Huang, L.; Wang, Q.; Hang, F.; Xie, C.; Li, K. Acidity rectified aggregation behaviour of colloids in sugarcane juice. International. J. Food Sci. Technol. 2022, 57, 7929–7941. [Google Scholar] [CrossRef]
- Du, N.; Pan, L.; Liu, J.; Wang, L.; Li, H.; Li, K.; Xie, C.; Hang, F.; Lu, H.; Li, W. Clarification of Limed Sugarcane Juice by Stainless Steel Membranes and Membrane Fouling Analysis. Membranes 2022, 12, 910. [Google Scholar] [CrossRef]
- Jegatheesan, V.; Phong, D.D.; Shu, L.; Ben-Aim, R. Clarification and concentration of sugar cane juice through ultra, nano and reverse osmosis membranes. Membr. Water Treat. 2012, 3, 99–111. [Google Scholar] [CrossRef][Green Version]
- Shu, L. Effect of operating parameters and cleaning on the performance of ceramic membranes treating partially clarified sugar cane juice. Sep. Sci. Technol. 2009, 44, 3506–3537. [Google Scholar]
- Kim, H.C.; Hong, J.H.; Lee, S. Fouling of microfiltration membranes by natural organic matter after coagulation treatment: A comparison of different initial mixing conditions. J. Membr. Sci. 2006, 283, 266–272. [Google Scholar] [CrossRef]
- Meng, F.; Yang, F.; Shi, B.; Zhang, H. A comprehensive study on membrane fouling in submerged membrane bioreactors operated under different aeration intensities. Sep. Purif. Technol. 2008, 59, 91–100. [Google Scholar] [CrossRef]
- Xie, F.; Chen, W.; Wang, J.; Liu, J. Fouling characteristics and enhancement mechanisms in a submerged flat-sheet membrane bioreactor equipped with micro-channel turbulence promoters with micro-pores. J. Membr. Sci. 2015, 495, 361–371. [Google Scholar] [CrossRef]
- Wang, Z.; Wu, Z.; Yin, X.; Tian, L. Membrane fouling in a submerged membrane bioreactor (mbr) under sub-critical flux operation: Membrane foulant and gel layer characterization. J. Membr. Sci. 2008, 325, 238–244. [Google Scholar] [CrossRef]
- Kimura, K.; Miyoshi, T.; Naruse, T.; Yamato, N.; Ogyu, R.; Watanabe, Y. The difference in characteristics of foulants in submerged mbrs caused by the difference in the membrane flux. Desalination 2008, 231, 268–275. [Google Scholar] [CrossRef]
- Chen, P.; Zhong, Z.; Liu, F.; Xing, W. Cleaning ceramic membranes used in treating desizing wastewater with a complex-surfactant SDBS-assisted method. Desalination 2015, 365, 25–35. [Google Scholar] [CrossRef]
- Pérez-Gálvez, R.; Guadix, E.M.; Bergé, J.P.; Guadix, A. Operation and cleaning of ceramic membranes for the filtration of fish press liquor. J. Membr. Sci. 2011, 384, 142–148. [Google Scholar] [CrossRef]
- Zhang, H.; Zhong, Z.; Xing, W. Application of ceramic membranes in the treatment of oilfield-produced water: Effects of polyacrylamide and inorganic salts. Desalination 2013, 309, 84–90. [Google Scholar] [CrossRef]
- Xing, W.H. Studies on the Equipment and Application of Ceramic Membranes in Industry. Doctoral Dissertation, Nanjing University of Technology, Nanjing, China, 2002. (In Chinese with English Abstract). [Google Scholar]
- Li, W.; Ling, G.-Q.; Huang, P.; Li, K.; Lu, H.-Q.; Hang, F.-X.; Zhang, Y.; Xie, C.-F.; Lu, D.-J.; Li, H.; et al. Pilot demonstration of ceramic membrane ultrafiltration of sugarcane juice for raw sugar production. Sugar Tech. 2016, 19, 83–88. [Google Scholar] [CrossRef]


| Item | Description |
|---|---|
| Manufacturer | Jiangsu Jiuwu Hi-Tech, Nanjing, China |
| Membrane type | Tubular |
| Membrane material | ZrO2 |
| Membrane support material | α-Alumina oxide |
| Pore size | 0.05 μm |
| Pure water permeability | 610 L/(m2 h bar) |
| Length | 1016 mm |
| Outside diameter | 30 mm |
| Number of channels | 37 |
| Operating Condition | Temperature (°C) | CFV (m/s) | TMP (bar) |
|---|---|---|---|
| C1 | 70 | 5 | 2.5 |
| C2 | 80 | 5 | 2.5 |
| C3 | 90 | 5 | 2.5 |
| C4 | 90 | 3 | 2.5 |
| C5 | 90 | 4 | 2.5 |
| C6 | 90 | 6 | 2.5 |
| C7 | 90 | 5 | 1.8 |
| C8 | 90 | 5 | 3.0 |
| C9 | 90 | 5 | 4.0 |
| Parameters | Feed | Permeate | ||
|---|---|---|---|---|
| 70 °C | 80 °C | 90 °C | ||
| Brix (%) | 43.1 | 42.8 | 42.6 | 42.8 |
| Turbidity (NTU) | 92.15 | 0.68 | 0.70 | 0.66 |
| Color (RBU) | 810.8 | 712.1 | 718.6 | 729.4 |
| Conductivity (μS/cm) | 806 | 725 | 716 | 722 |
| Light transmittance (%) | 63.7 | 96.9 | 95.0 | 95.0 |
| Total colloid removal rate (%) | 0 | 69.13% | 68.78% | 68.43% |
| Parameters | Feed | Permeate | |||
|---|---|---|---|---|---|
| 3.0 m/s | 4.0 m/s | 5.0 m/s | 6.0 m/s | ||
| Brix (%) | 44.0 | 43.1 | 43.0 | 42.8 | 43.0 |
| Turbidity (NTU) | 92.10 | 0.68 | 0.70 | 0.66 | 0.72 |
| Color (RBU) | 815.6 | 721.5 | 728.6 | 729.4 | 729.8 |
| Conductivity (μS/cm) | 801 | 734 | 741 | 730 | 726 |
| Light transmittance (%) | 62.8 | 95.3 | 95.5 | 95.0 | 95.4 |
| Total colloid removal rate (%) | 0 | 68.93% | 68.36% | 68.78% | 67.90% |
| Parameters | Feed | Permeate | |||
|---|---|---|---|---|---|
| 1.8 bar | 2.5 bar | 3.0 bar | 4.0 bar | ||
| Brix (%) | 43.8 | 42.9 | 42.8 | 42.9 | 42.7 |
| Turbidity (NTU) | 92.35 | 0.63 | 0.66 | 0.65 | 0.68 |
| Color (RBU) | 818.9 | 722.7 | 729.4 | 726.9 | 728.3 |
| Conductivity (μS/cm) | 807 | 729 | 730 | 732 | 725 |
| Light transmittance (%) | 61.9 | 95.6 | 95.0 | 95.1 | 95.3 |
| Total colloid removal rate (%) | 0 | 68.91% | 68.78% | 69.28% | 69.75% |
| Model | Equation |
|---|---|
| Complete pore blocking. | |
| Pore narrowing. | |
| Cake filtration. |
| Weight (%) | C | O | Al | Zr | Ca | Fe |
|---|---|---|---|---|---|---|
| Fouling layer | 21.42 | 26.21 | 3.26 | 5.48 | 35.72 | 7.92 |
| Fouled membrane layer | 30.68 | 18.47 | 0.44 | 47.7 | 2.72 | 0 |
| Fouled membrane transition layer | 15.11 | 35.77 | 46.65 | 2.47 | 0 | 0 |
| Fouled membrane support layer | 18.48 | 36.47 | 43.98 | 1.07 | 0 | 0 |
| Cleaned membrane layer | 13.83 | 16.08 | 0 | 70.09 | 0 | 0 |
| Cleaned membrane transition layer | 14.18 | 31.29 | 44.57 | 5.28 | 0 | 0 |
| Cleaned membrane support layer | 9.21 | 37.07 | 51.3 | 2.42 | 0 | 0 |
Disclaimer/Publisher’s Note: The statements, opinions and data contained in all publications are solely those of the individual author(s) and contributor(s) and not of MDPI and/or the editor(s). MDPI and/or the editor(s) disclaim responsibility for any injury to people or property resulting from any ideas, methods, instructions or products referred to in the content. |
© 2024 by the authors. Licensee MDPI, Basel, Switzerland. This article is an open access article distributed under the terms and conditions of the Creative Commons Attribution (CC BY) license (https://creativecommons.org/licenses/by/4.0/).
Share and Cite
Hang, F.; Xu, H.; Xie, C.; Li, K.; Wen, T.; Meng, L. Pretreatment of Glucose–Fructose Syrup with Ceramic Membrane Ultrafiltration Coupled with Activated Carbon. Membranes 2024, 14, 57. https://doi.org/10.3390/membranes14030057
Hang F, Xu H, Xie C, Li K, Wen T, Meng L. Pretreatment of Glucose–Fructose Syrup with Ceramic Membrane Ultrafiltration Coupled with Activated Carbon. Membranes. 2024; 14(3):57. https://doi.org/10.3390/membranes14030057
Chicago/Turabian StyleHang, Fangxue, Hongmei Xu, Caifeng Xie, Kai Li, Tao Wen, and Lidan Meng. 2024. "Pretreatment of Glucose–Fructose Syrup with Ceramic Membrane Ultrafiltration Coupled with Activated Carbon" Membranes 14, no. 3: 57. https://doi.org/10.3390/membranes14030057
APA StyleHang, F., Xu, H., Xie, C., Li, K., Wen, T., & Meng, L. (2024). Pretreatment of Glucose–Fructose Syrup with Ceramic Membrane Ultrafiltration Coupled with Activated Carbon. Membranes, 14(3), 57. https://doi.org/10.3390/membranes14030057