

Nanocomposite Polymer Gel Electrolyte Based on TiO2 Nanoparticles for Lithium Batteries

 , ,
, , 
Abstract
:1. Introduction
2. Materials and Methods
2.1. Materials
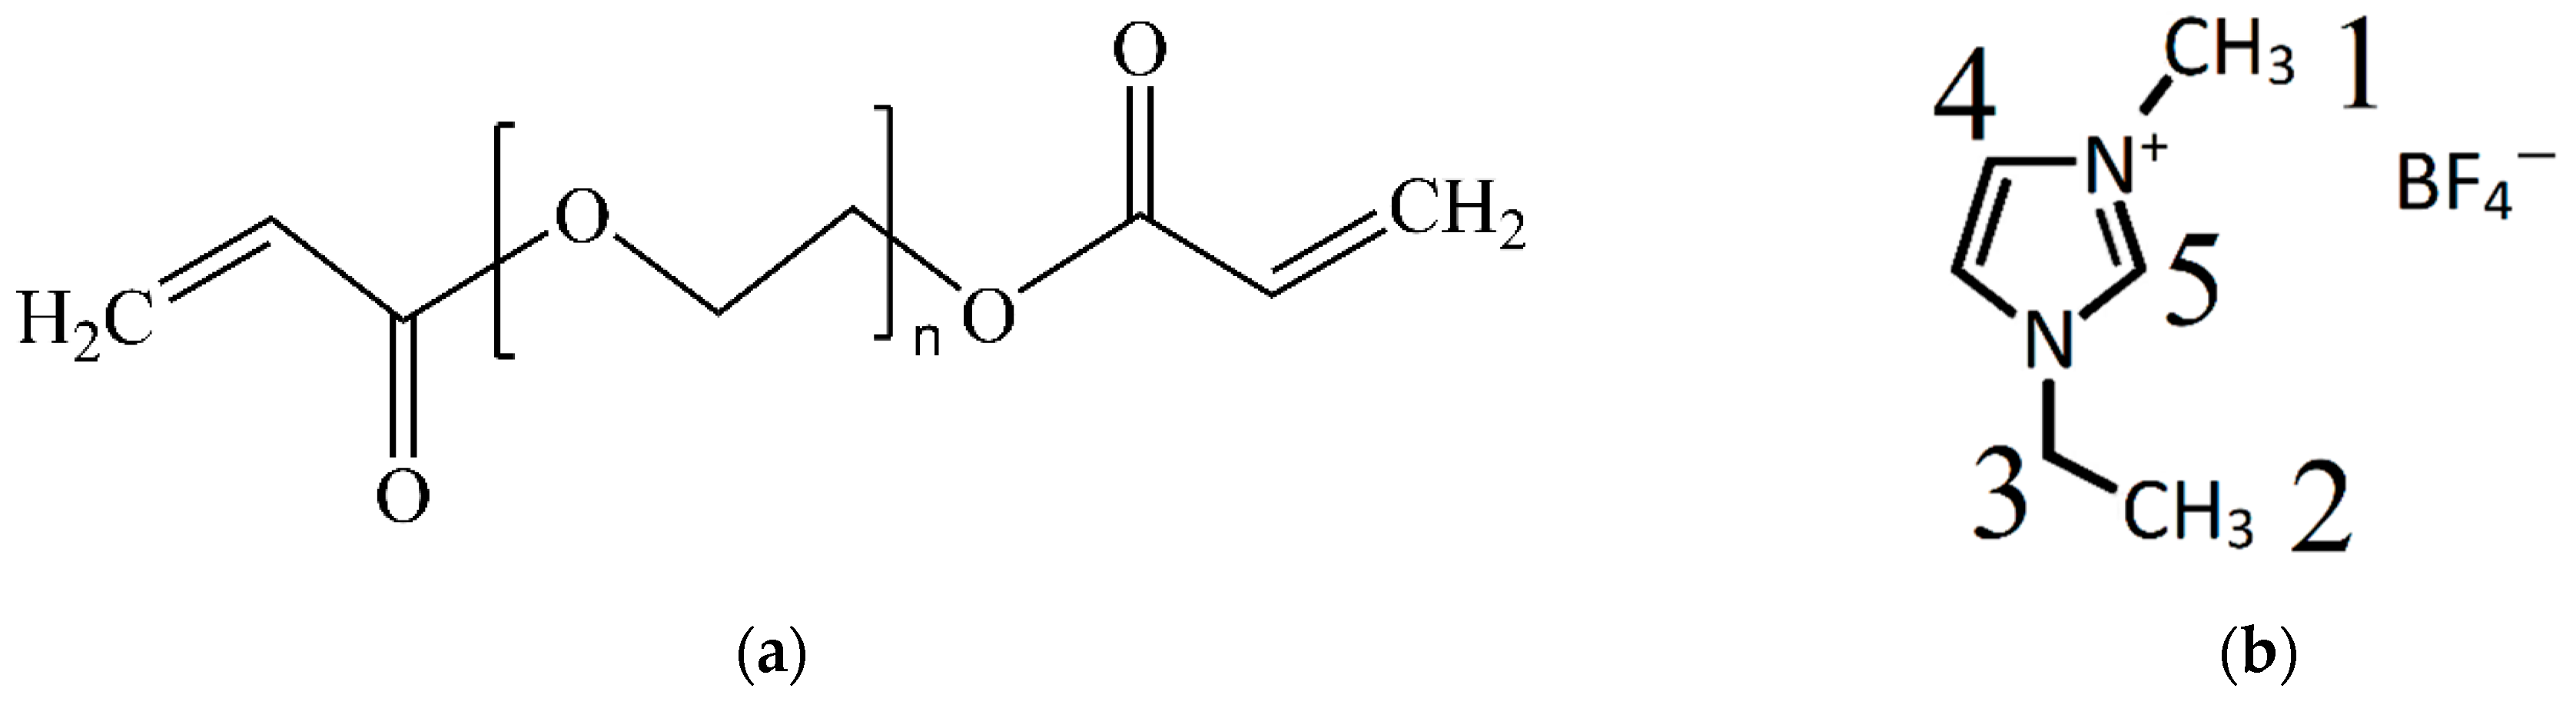
2.2. Synthesis of Nanocomposite Polymer Electrolyte
2.3. Differential Scanning Calorimetry (DSC) Method
2.4. Thermogravimetric Analysis (TGA) Method
2.5. Electrochemical Methods
2.6. Pulsed Field Gradient NMR
2.7. High-Resolution NMR
2.8. Quantum Chemical Modeling
3. Results and Discussion
3.1. NPEs Synthesis
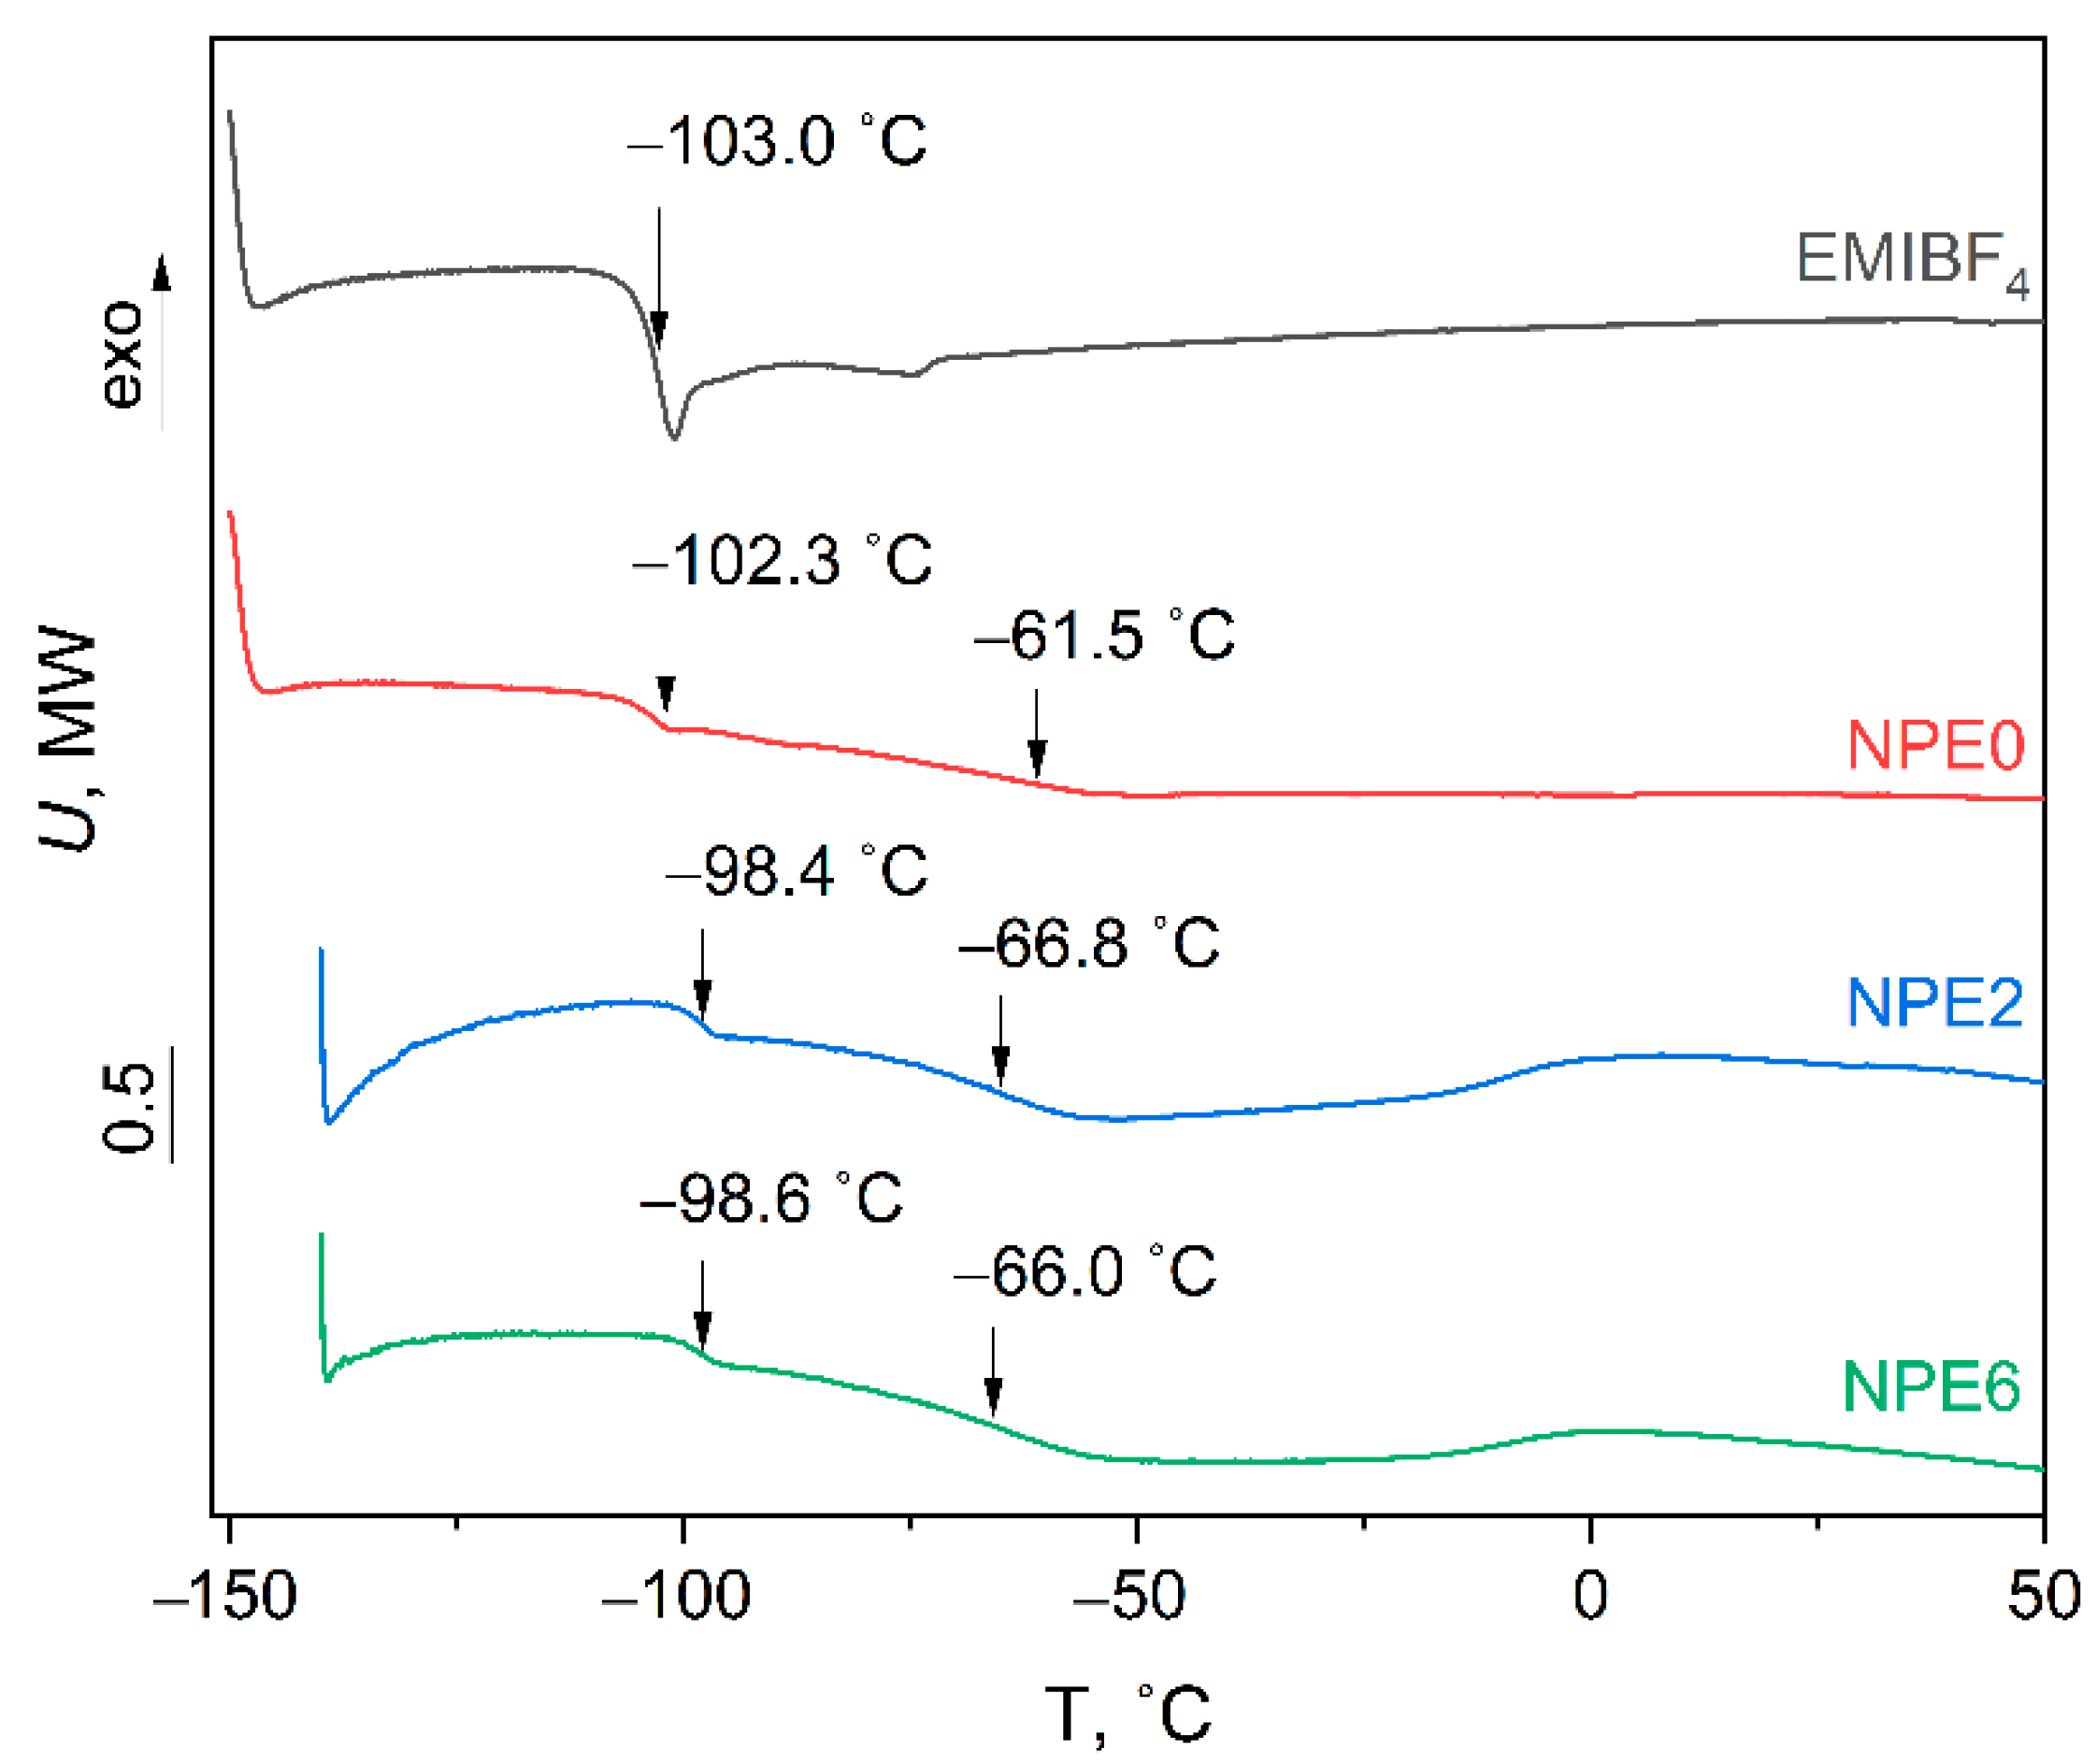
3.2. DSC of NPEs
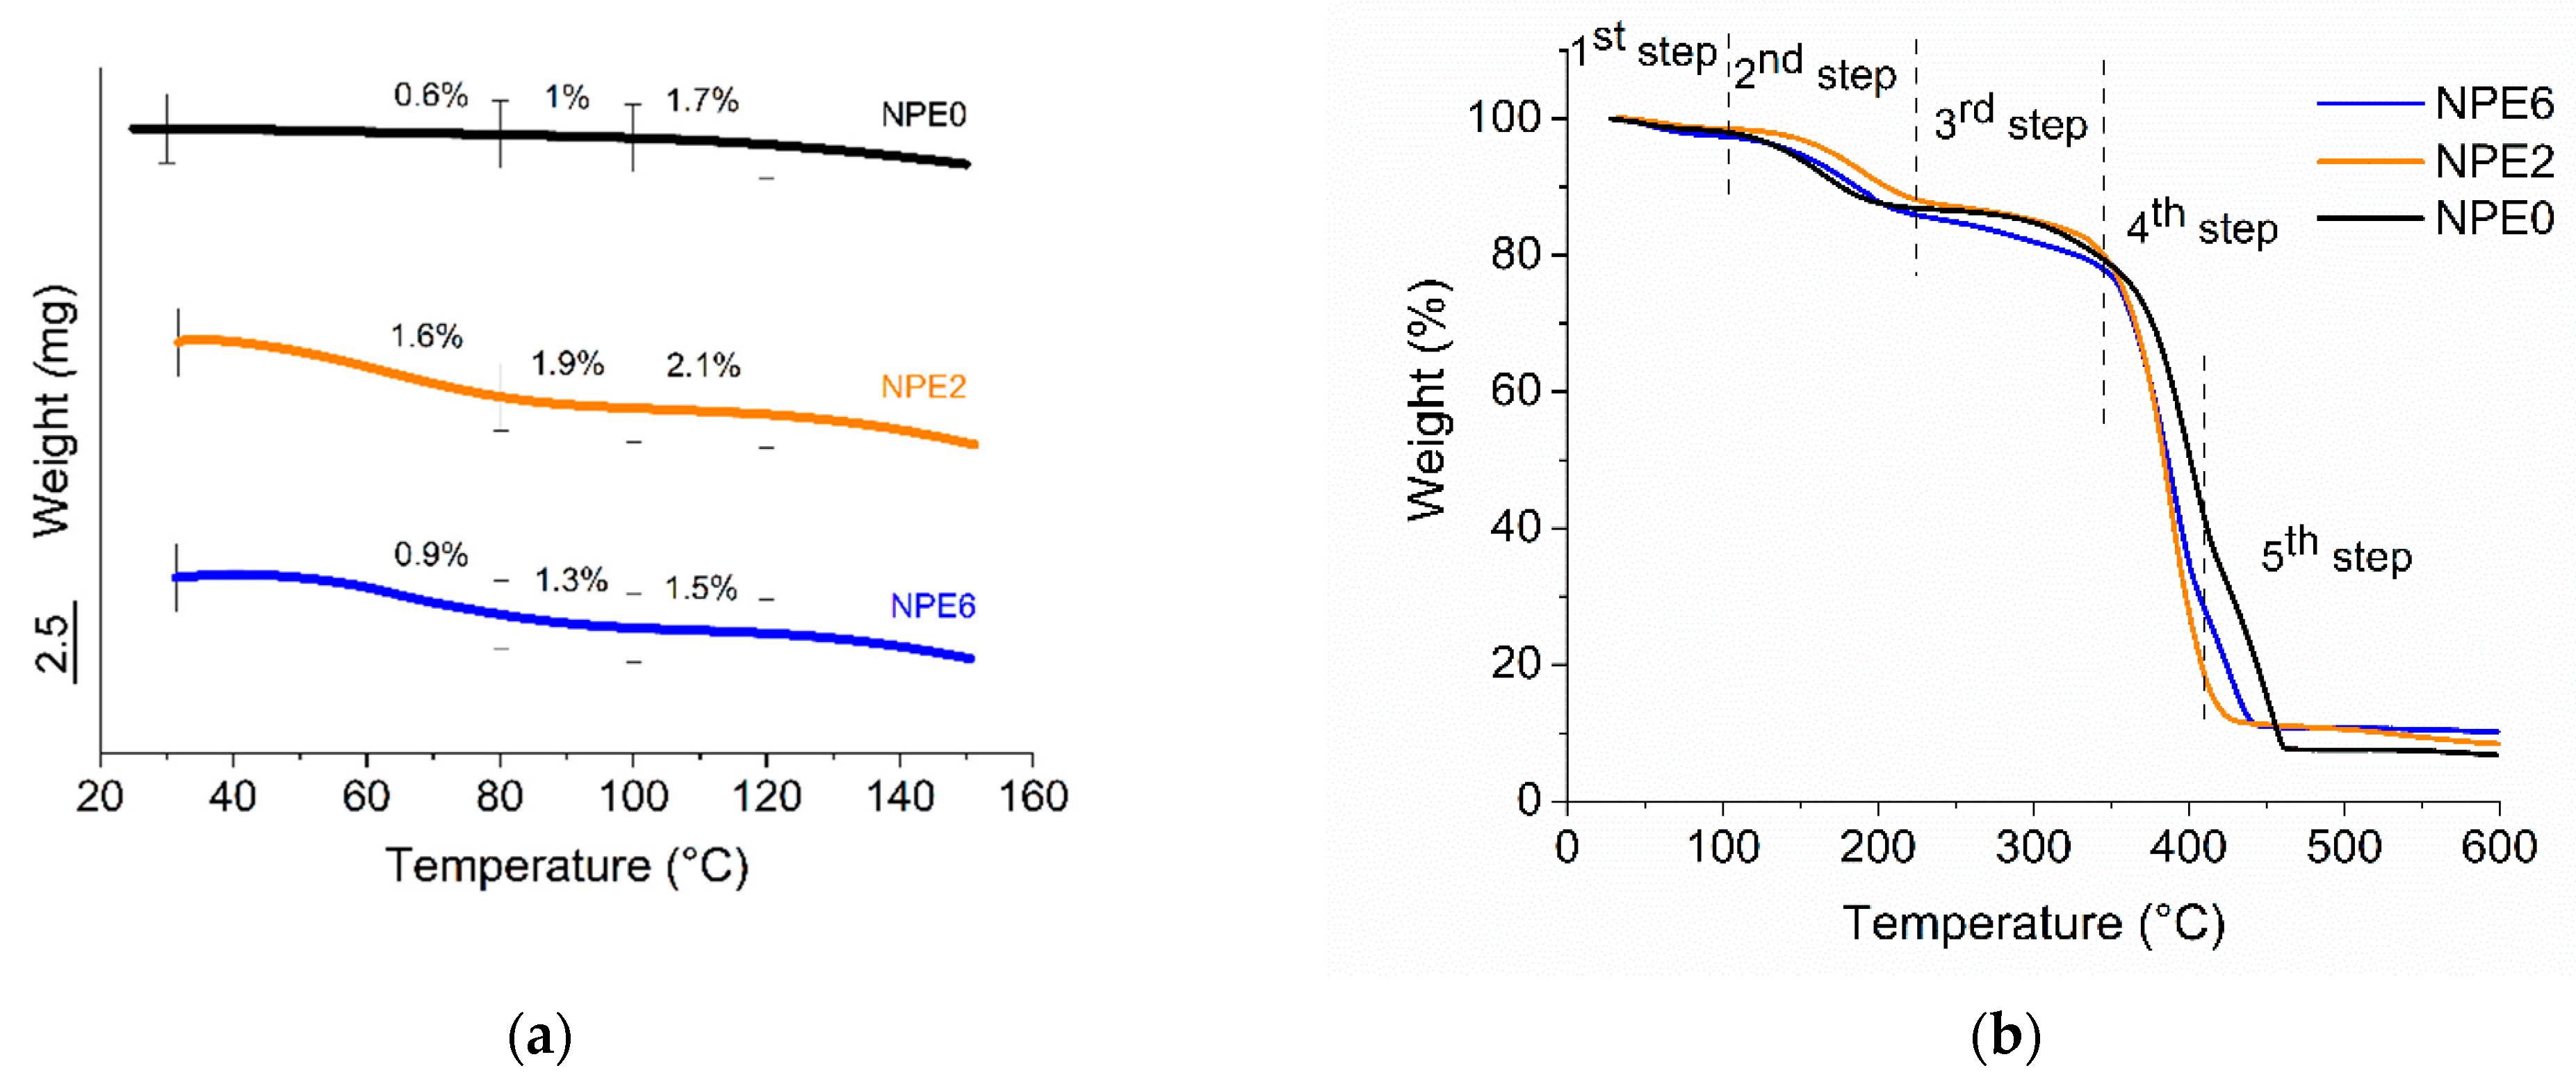
3.3. TGA of NPEs
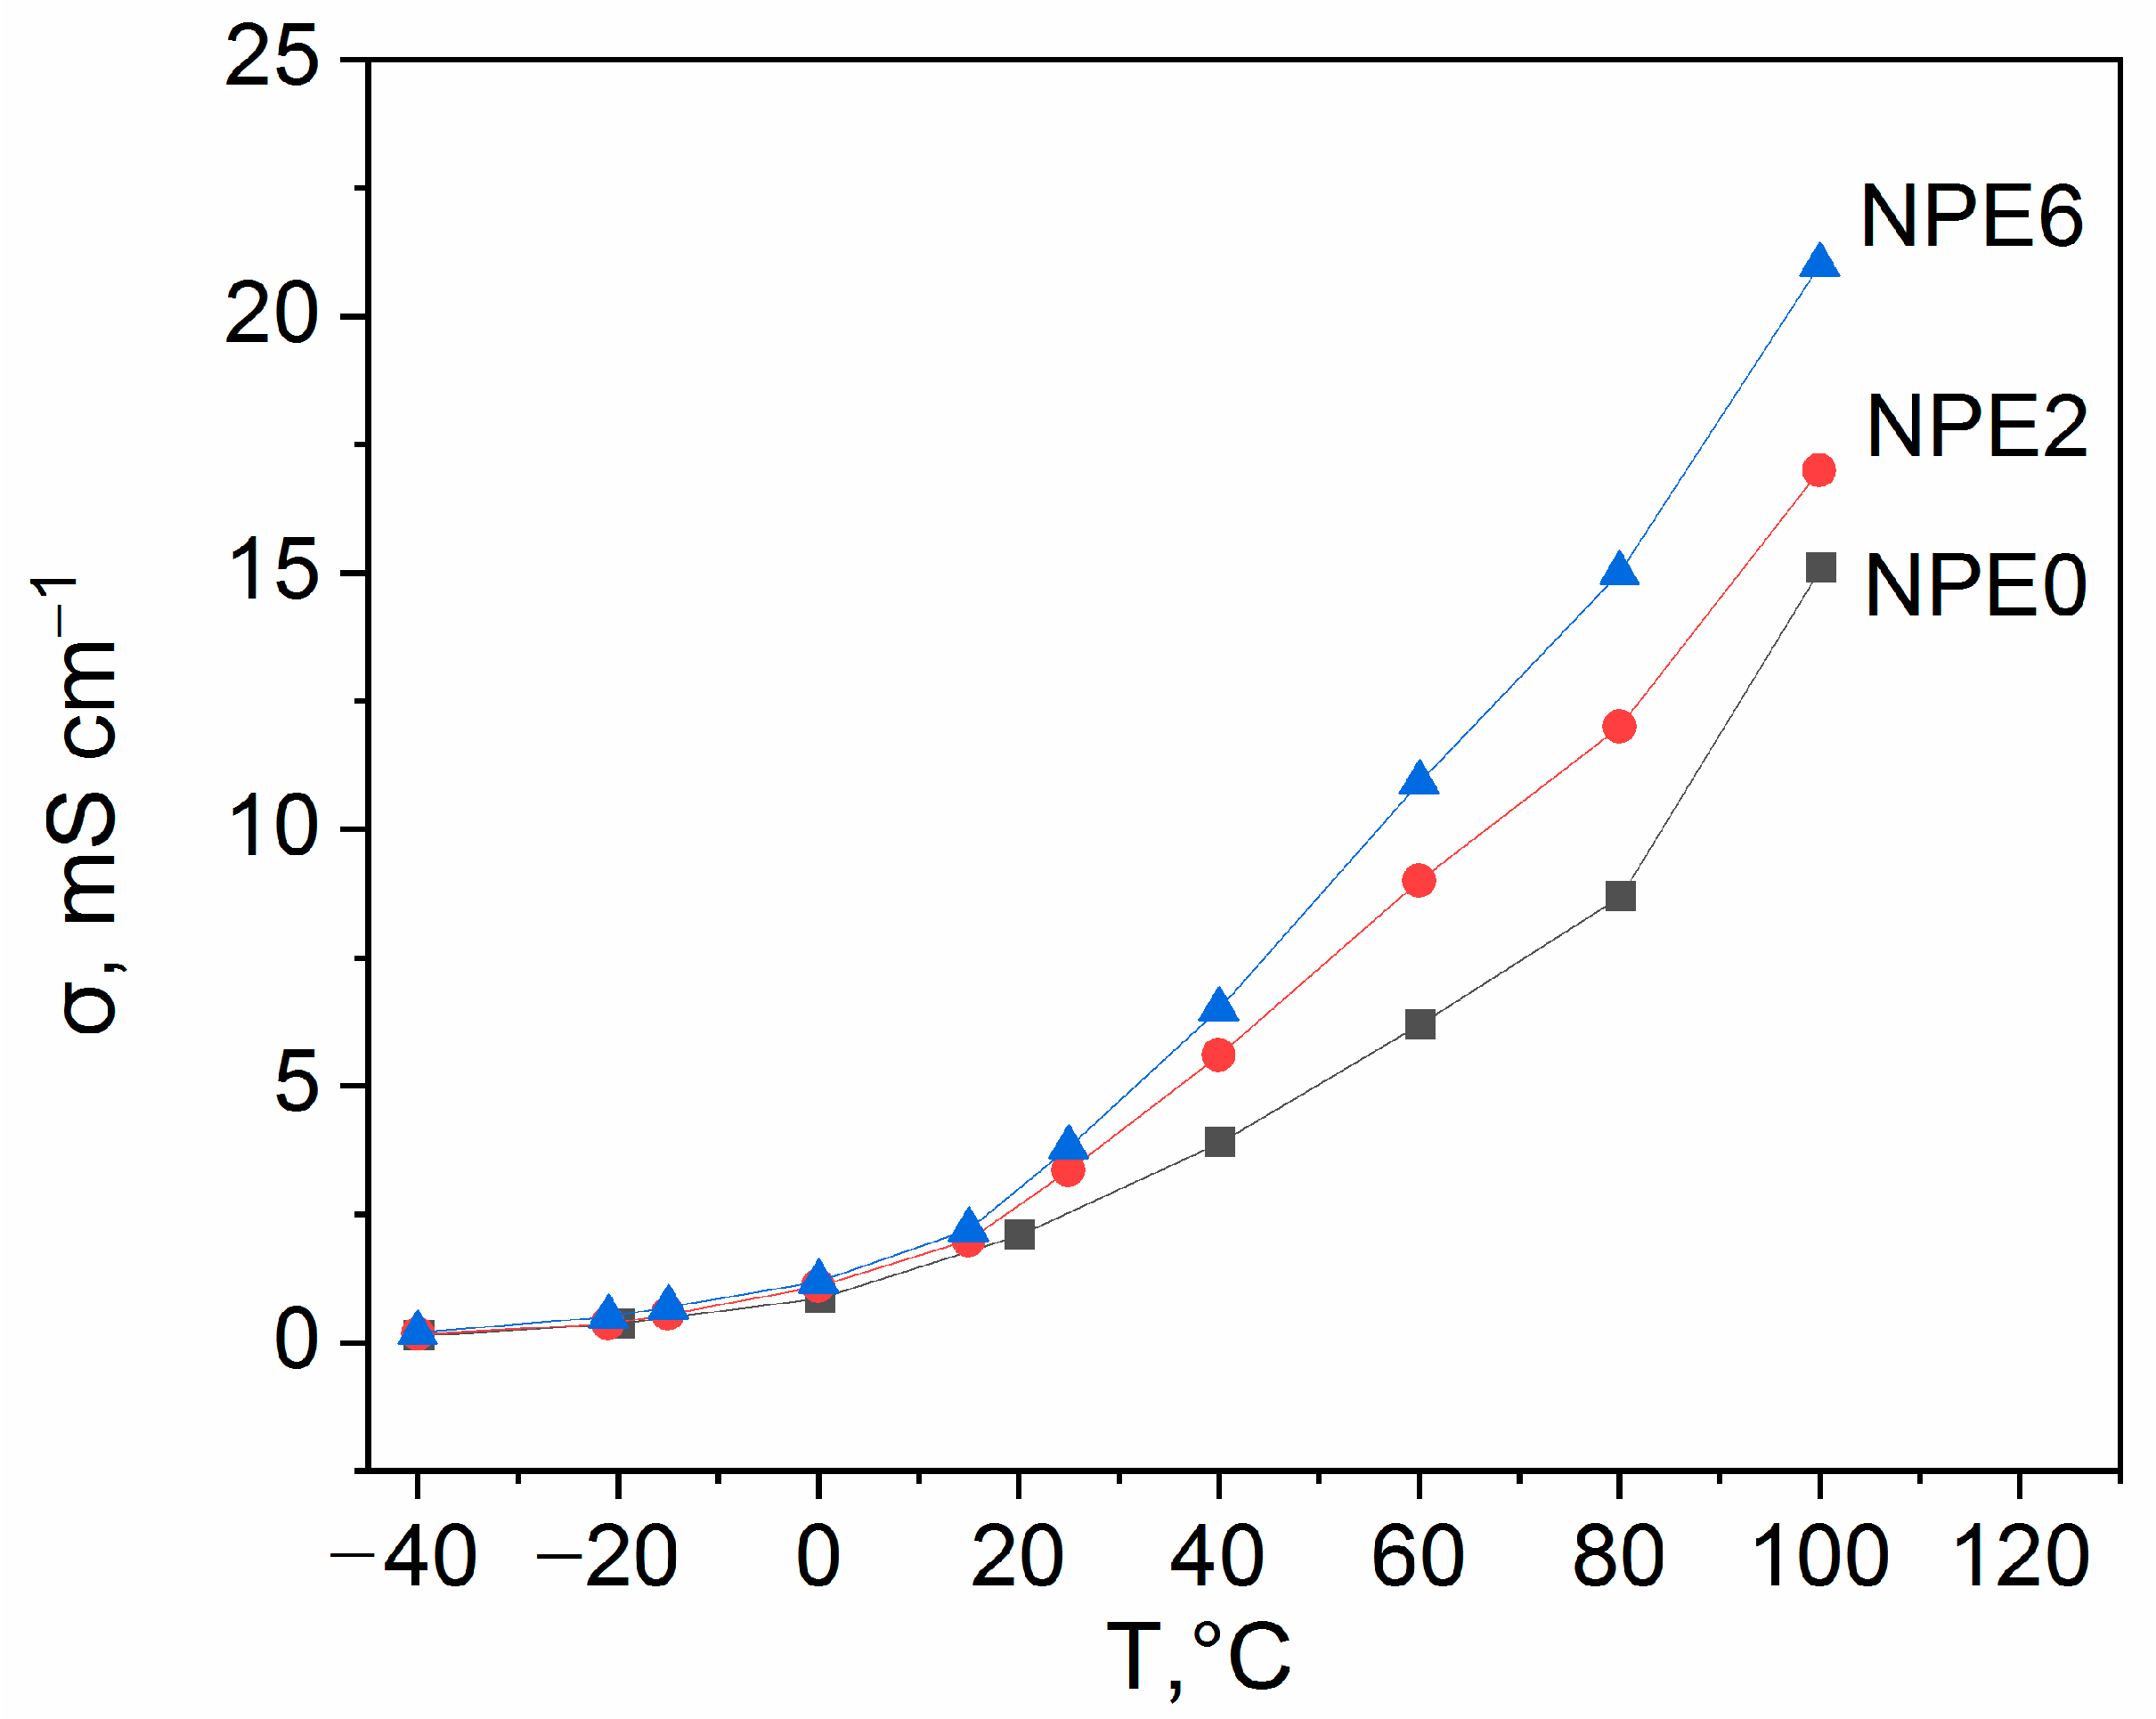
3.4. Electrochemical Study of NPEs
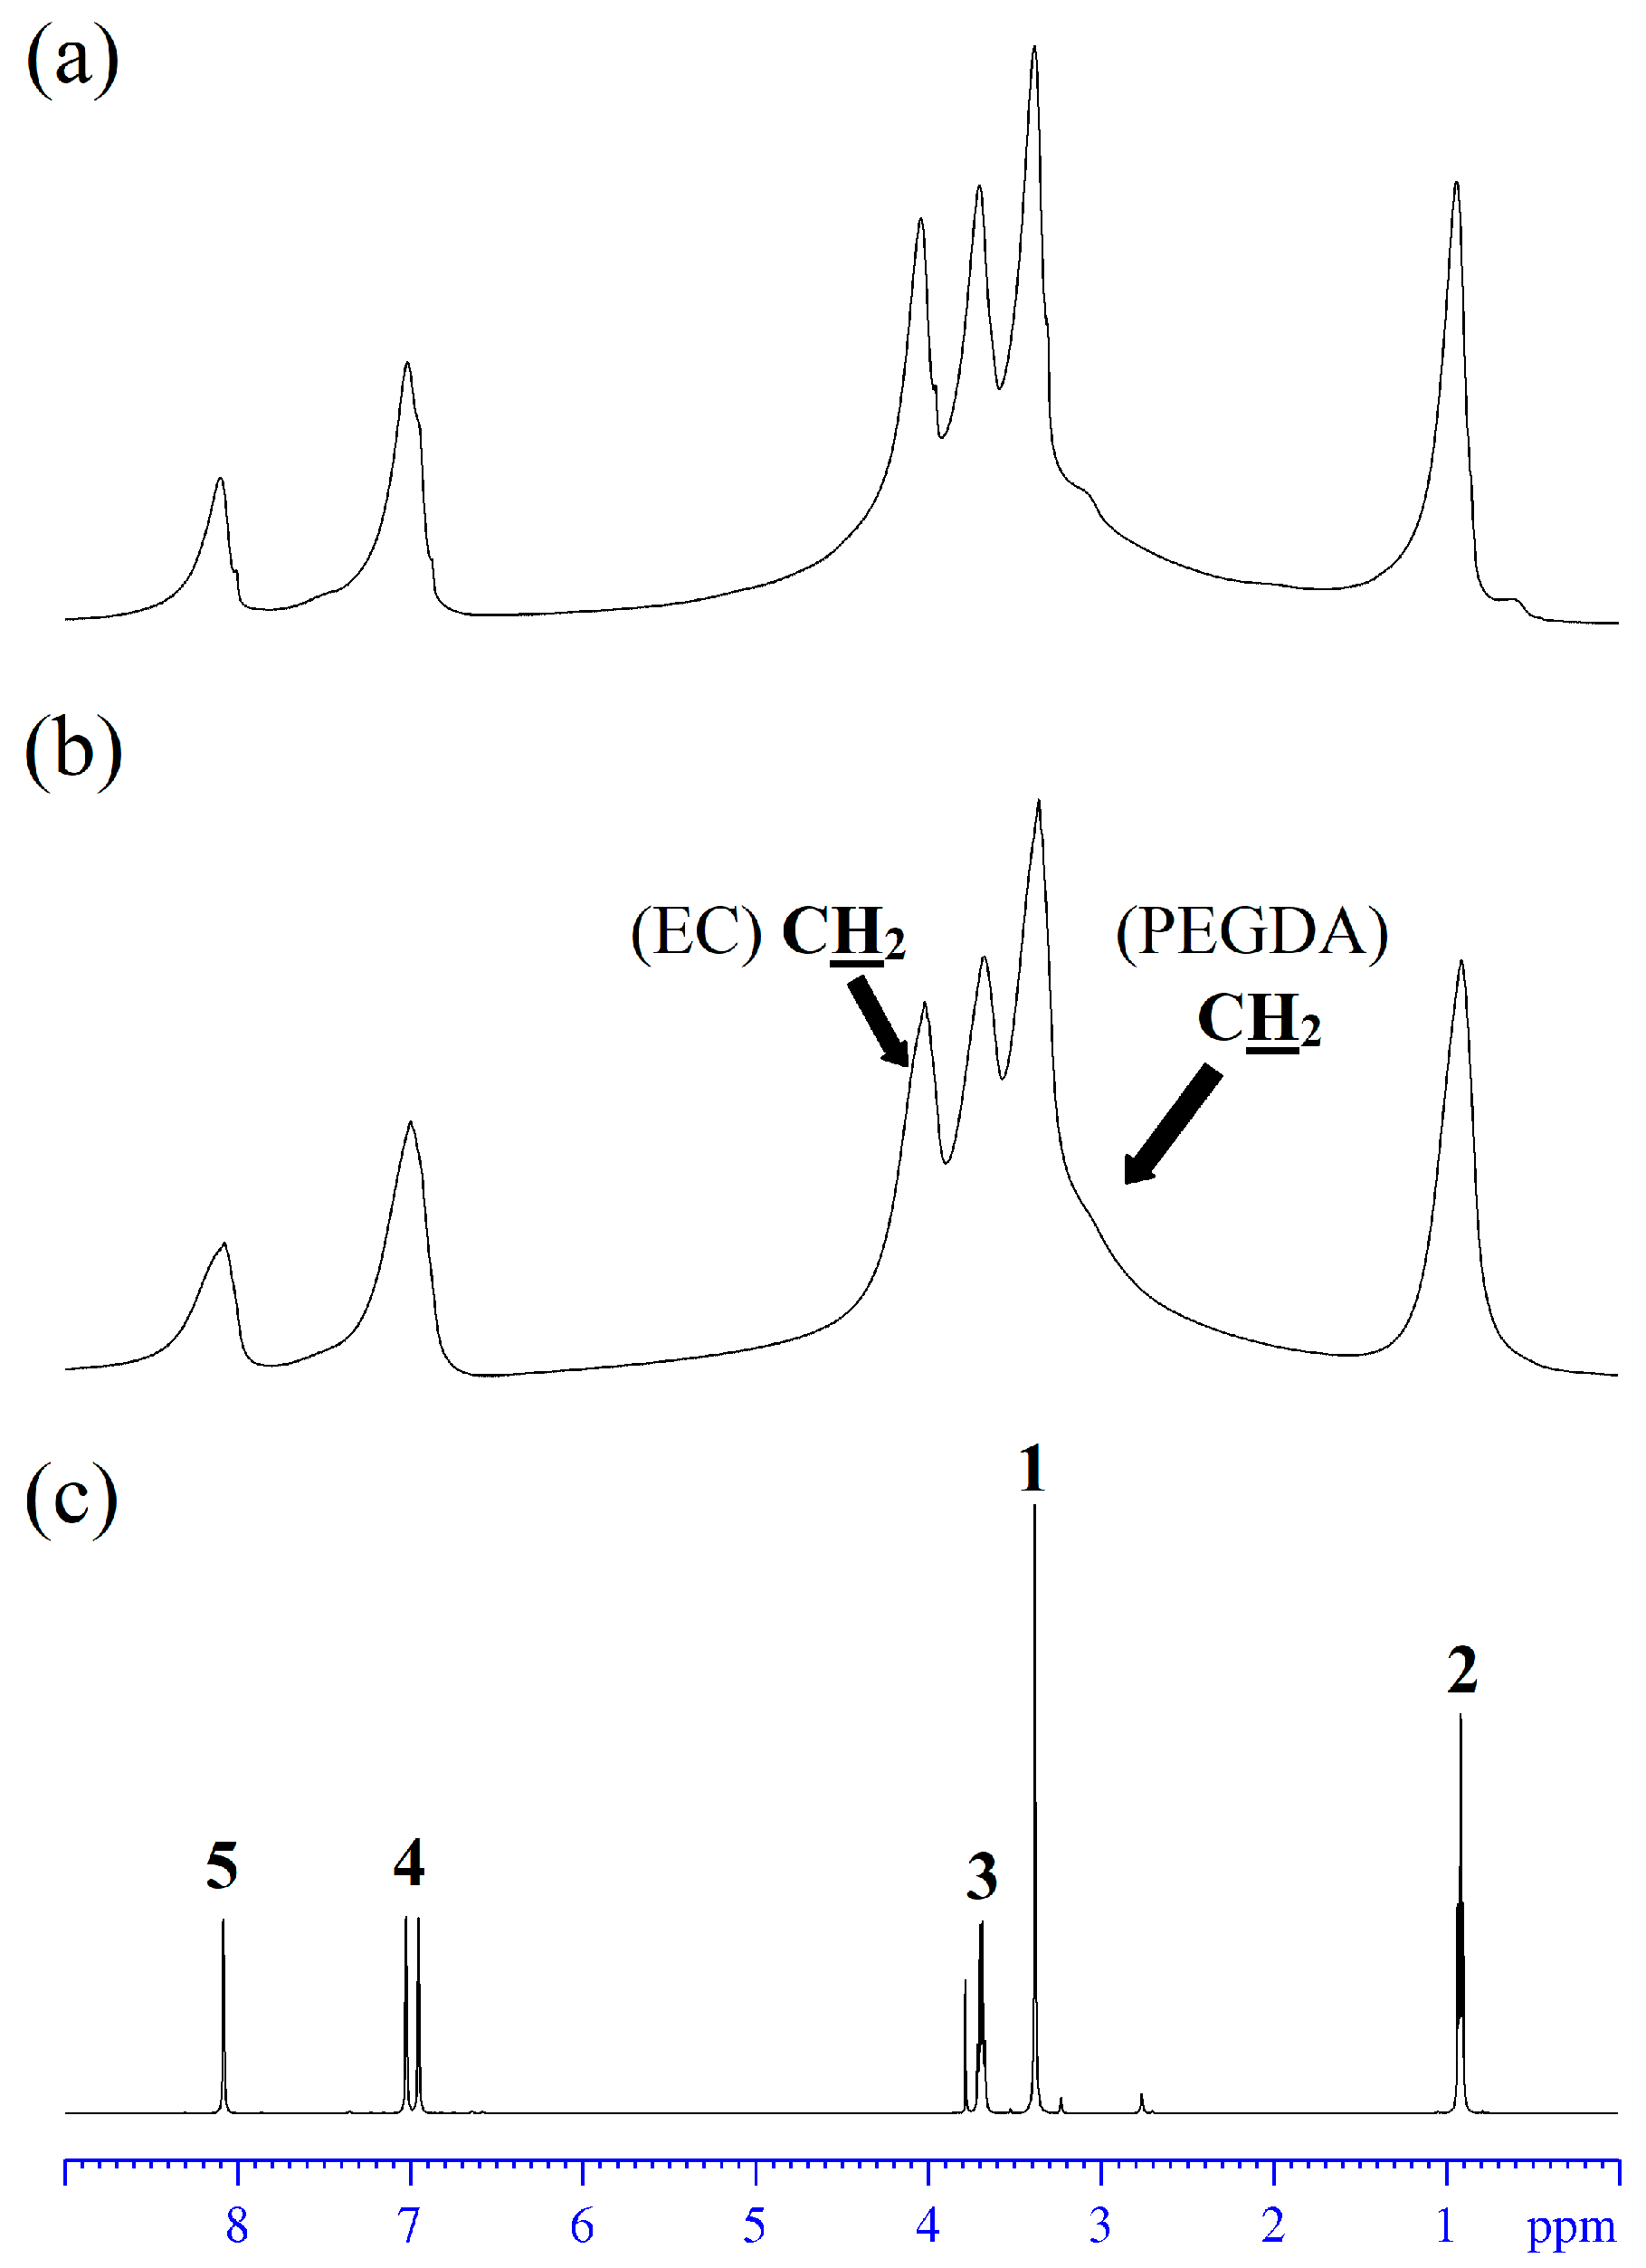
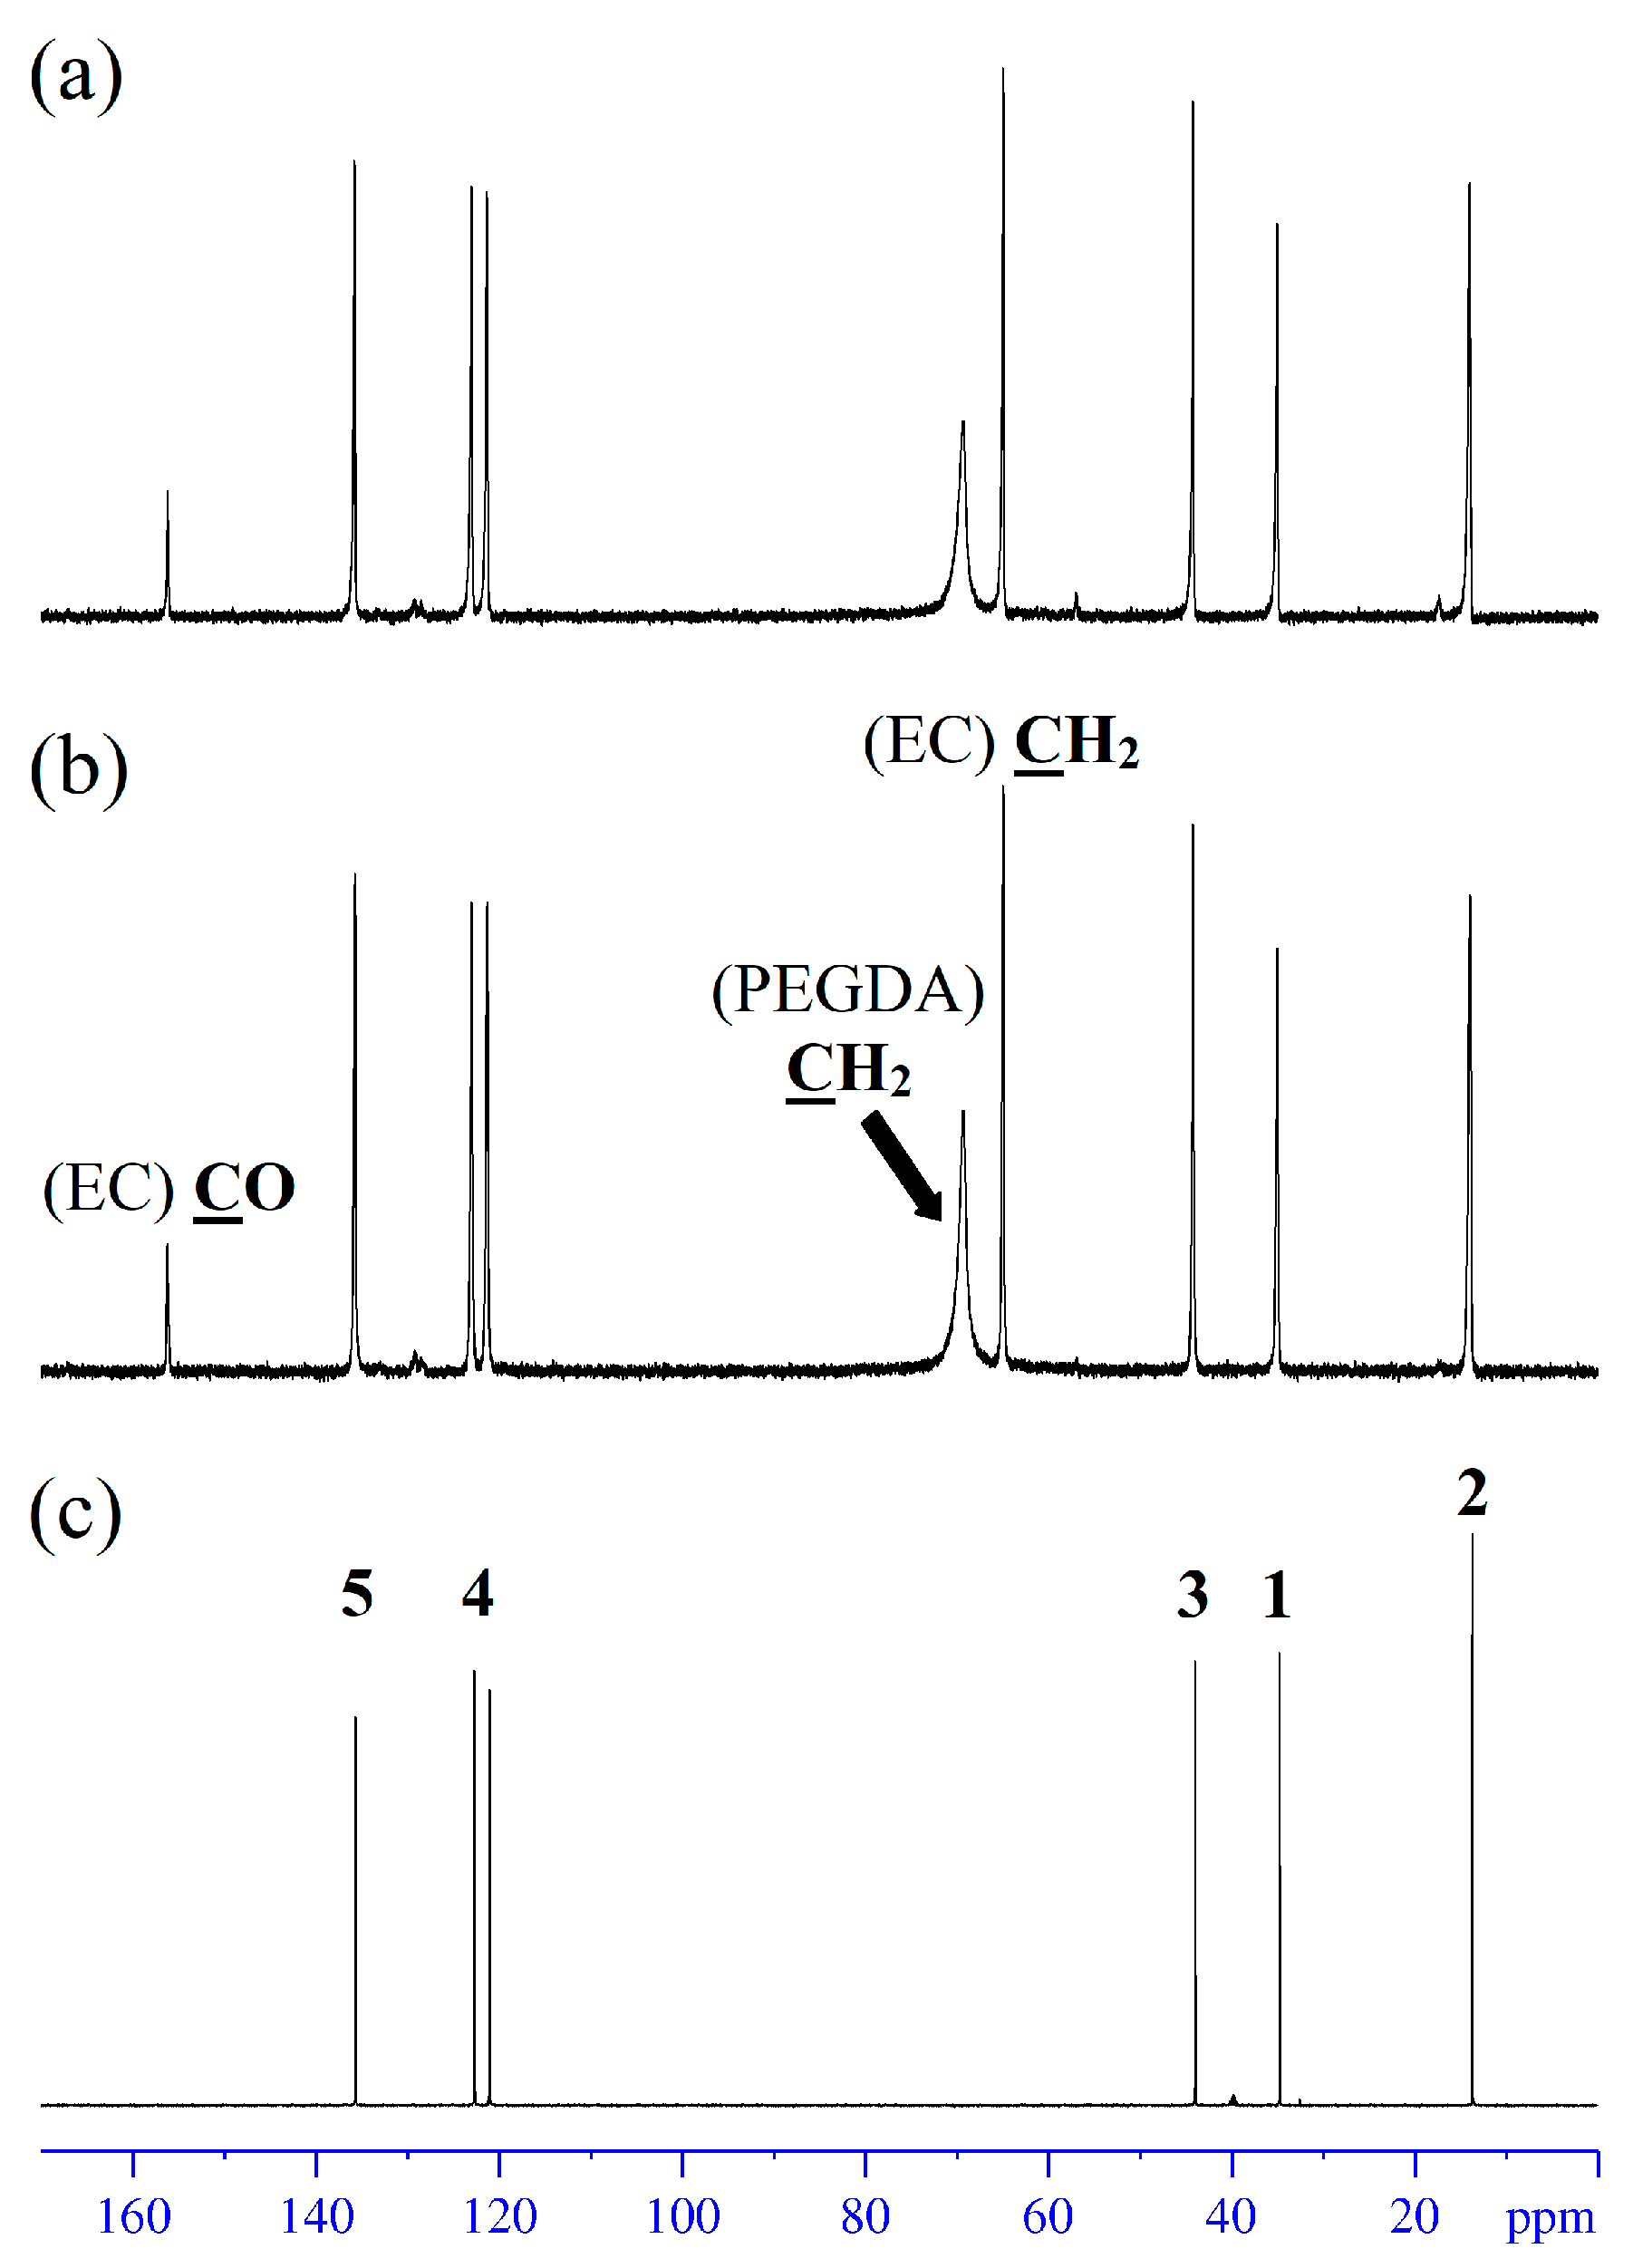
3.5. High-Resolution NMR
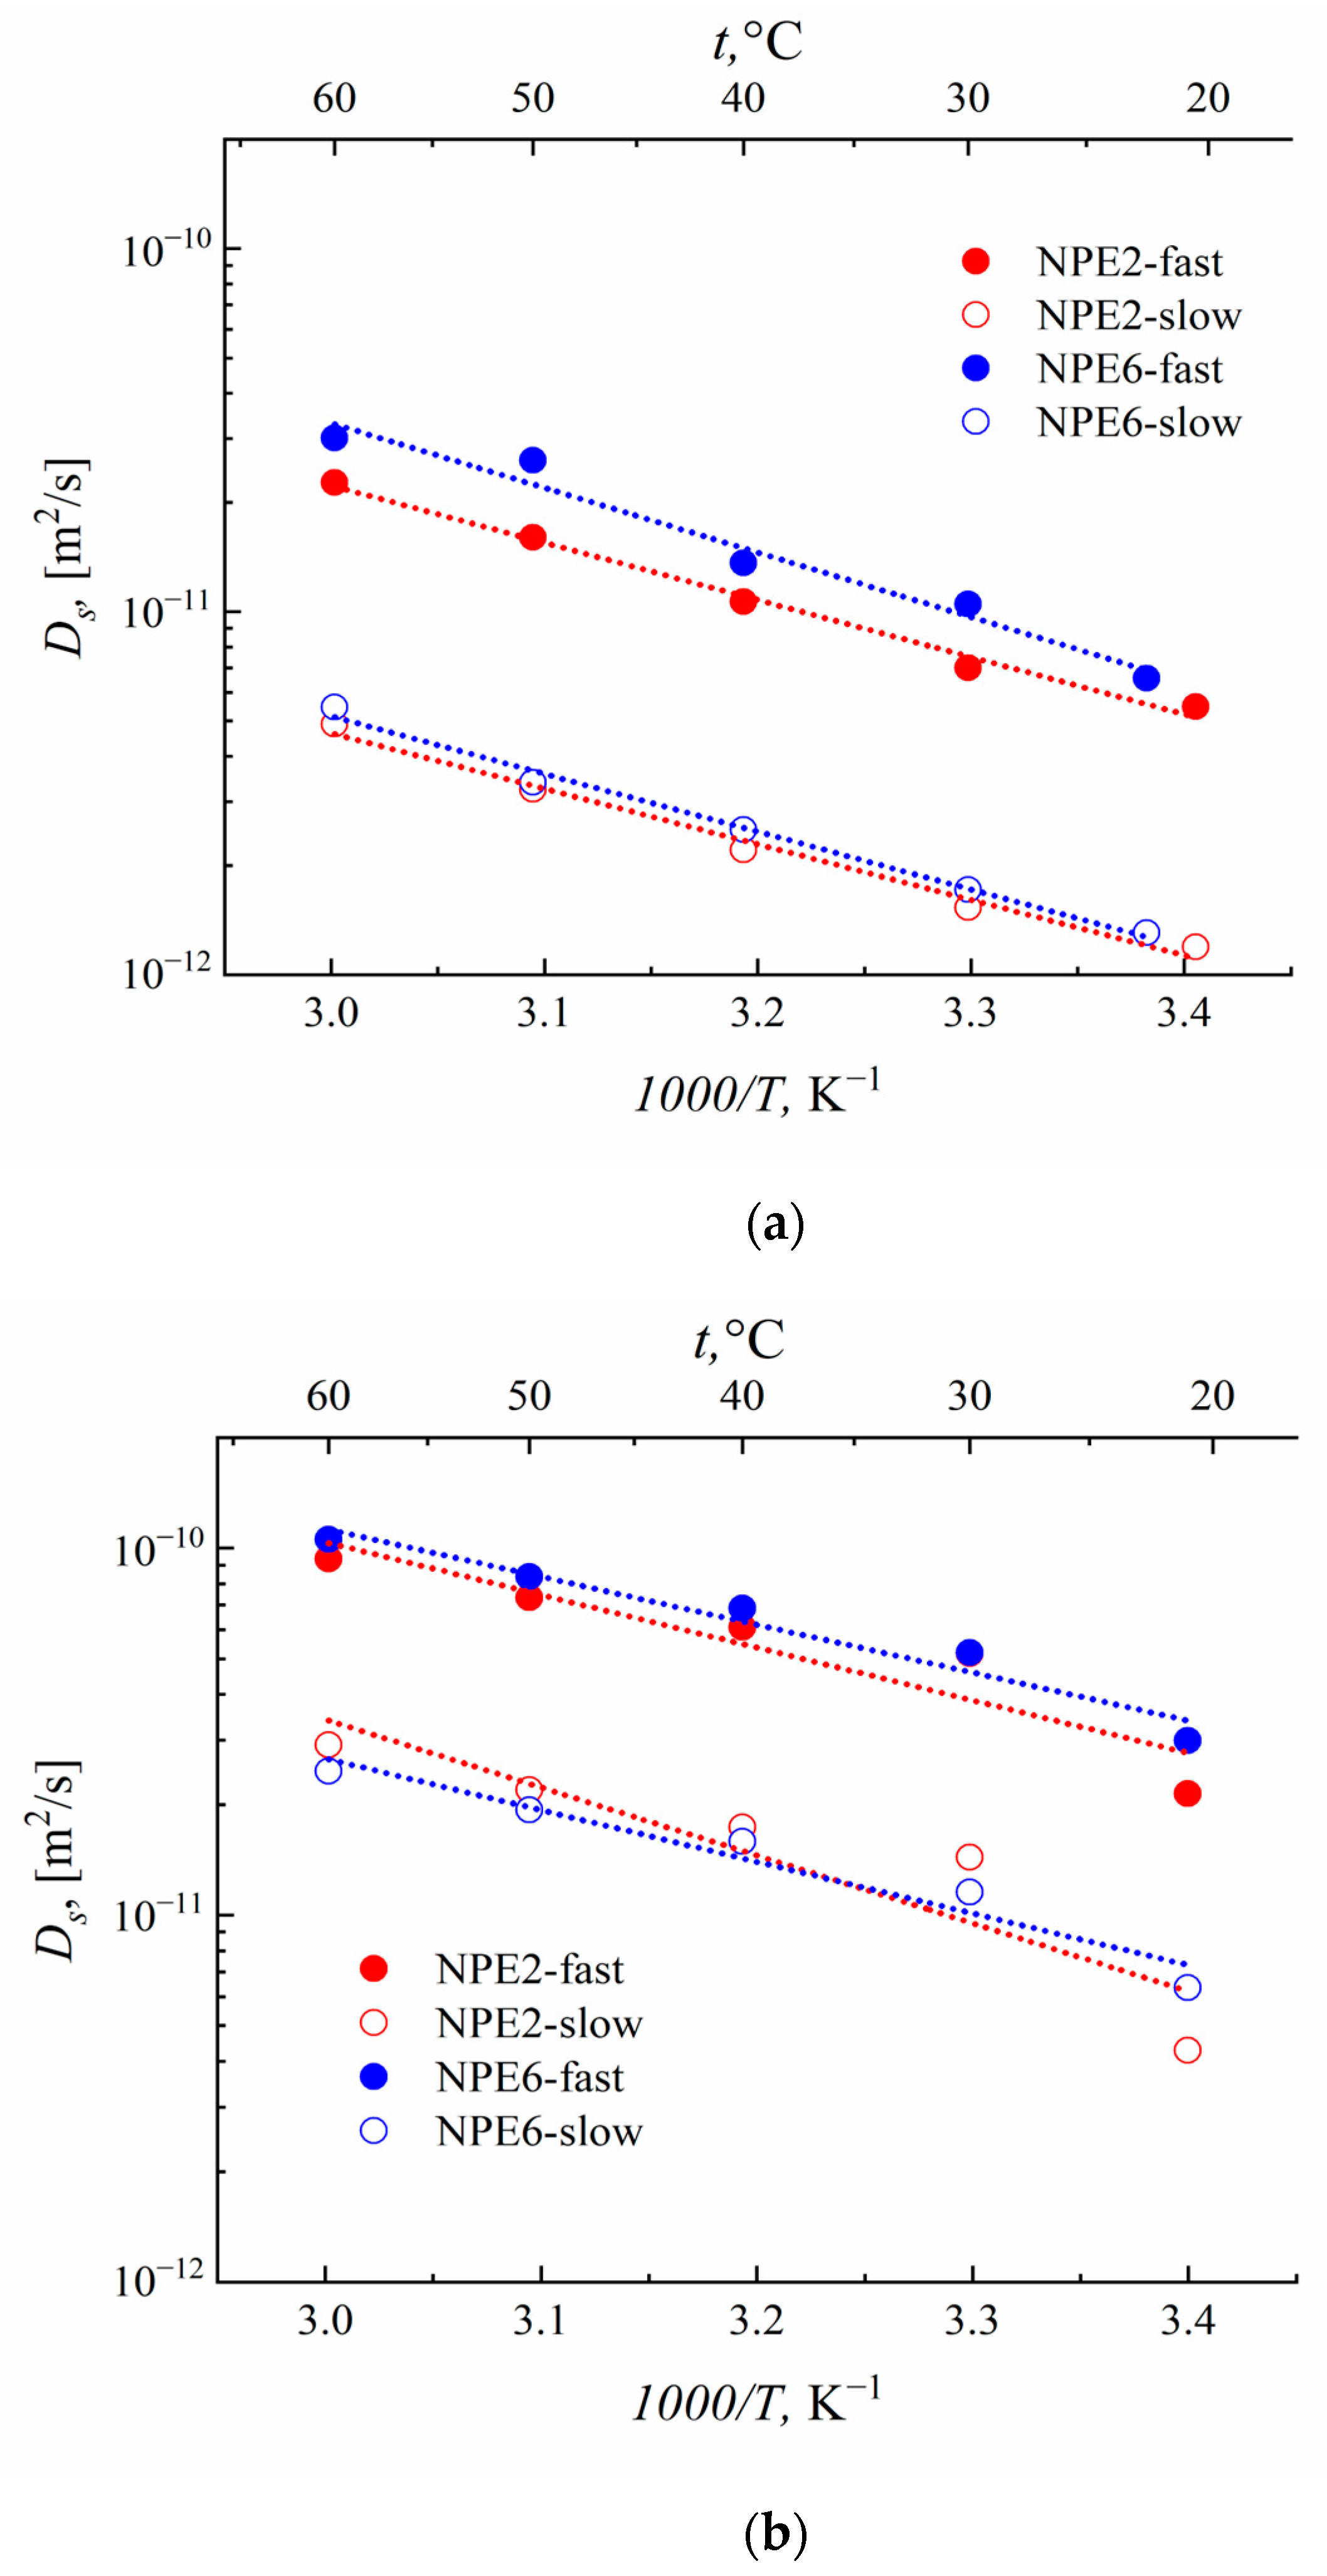
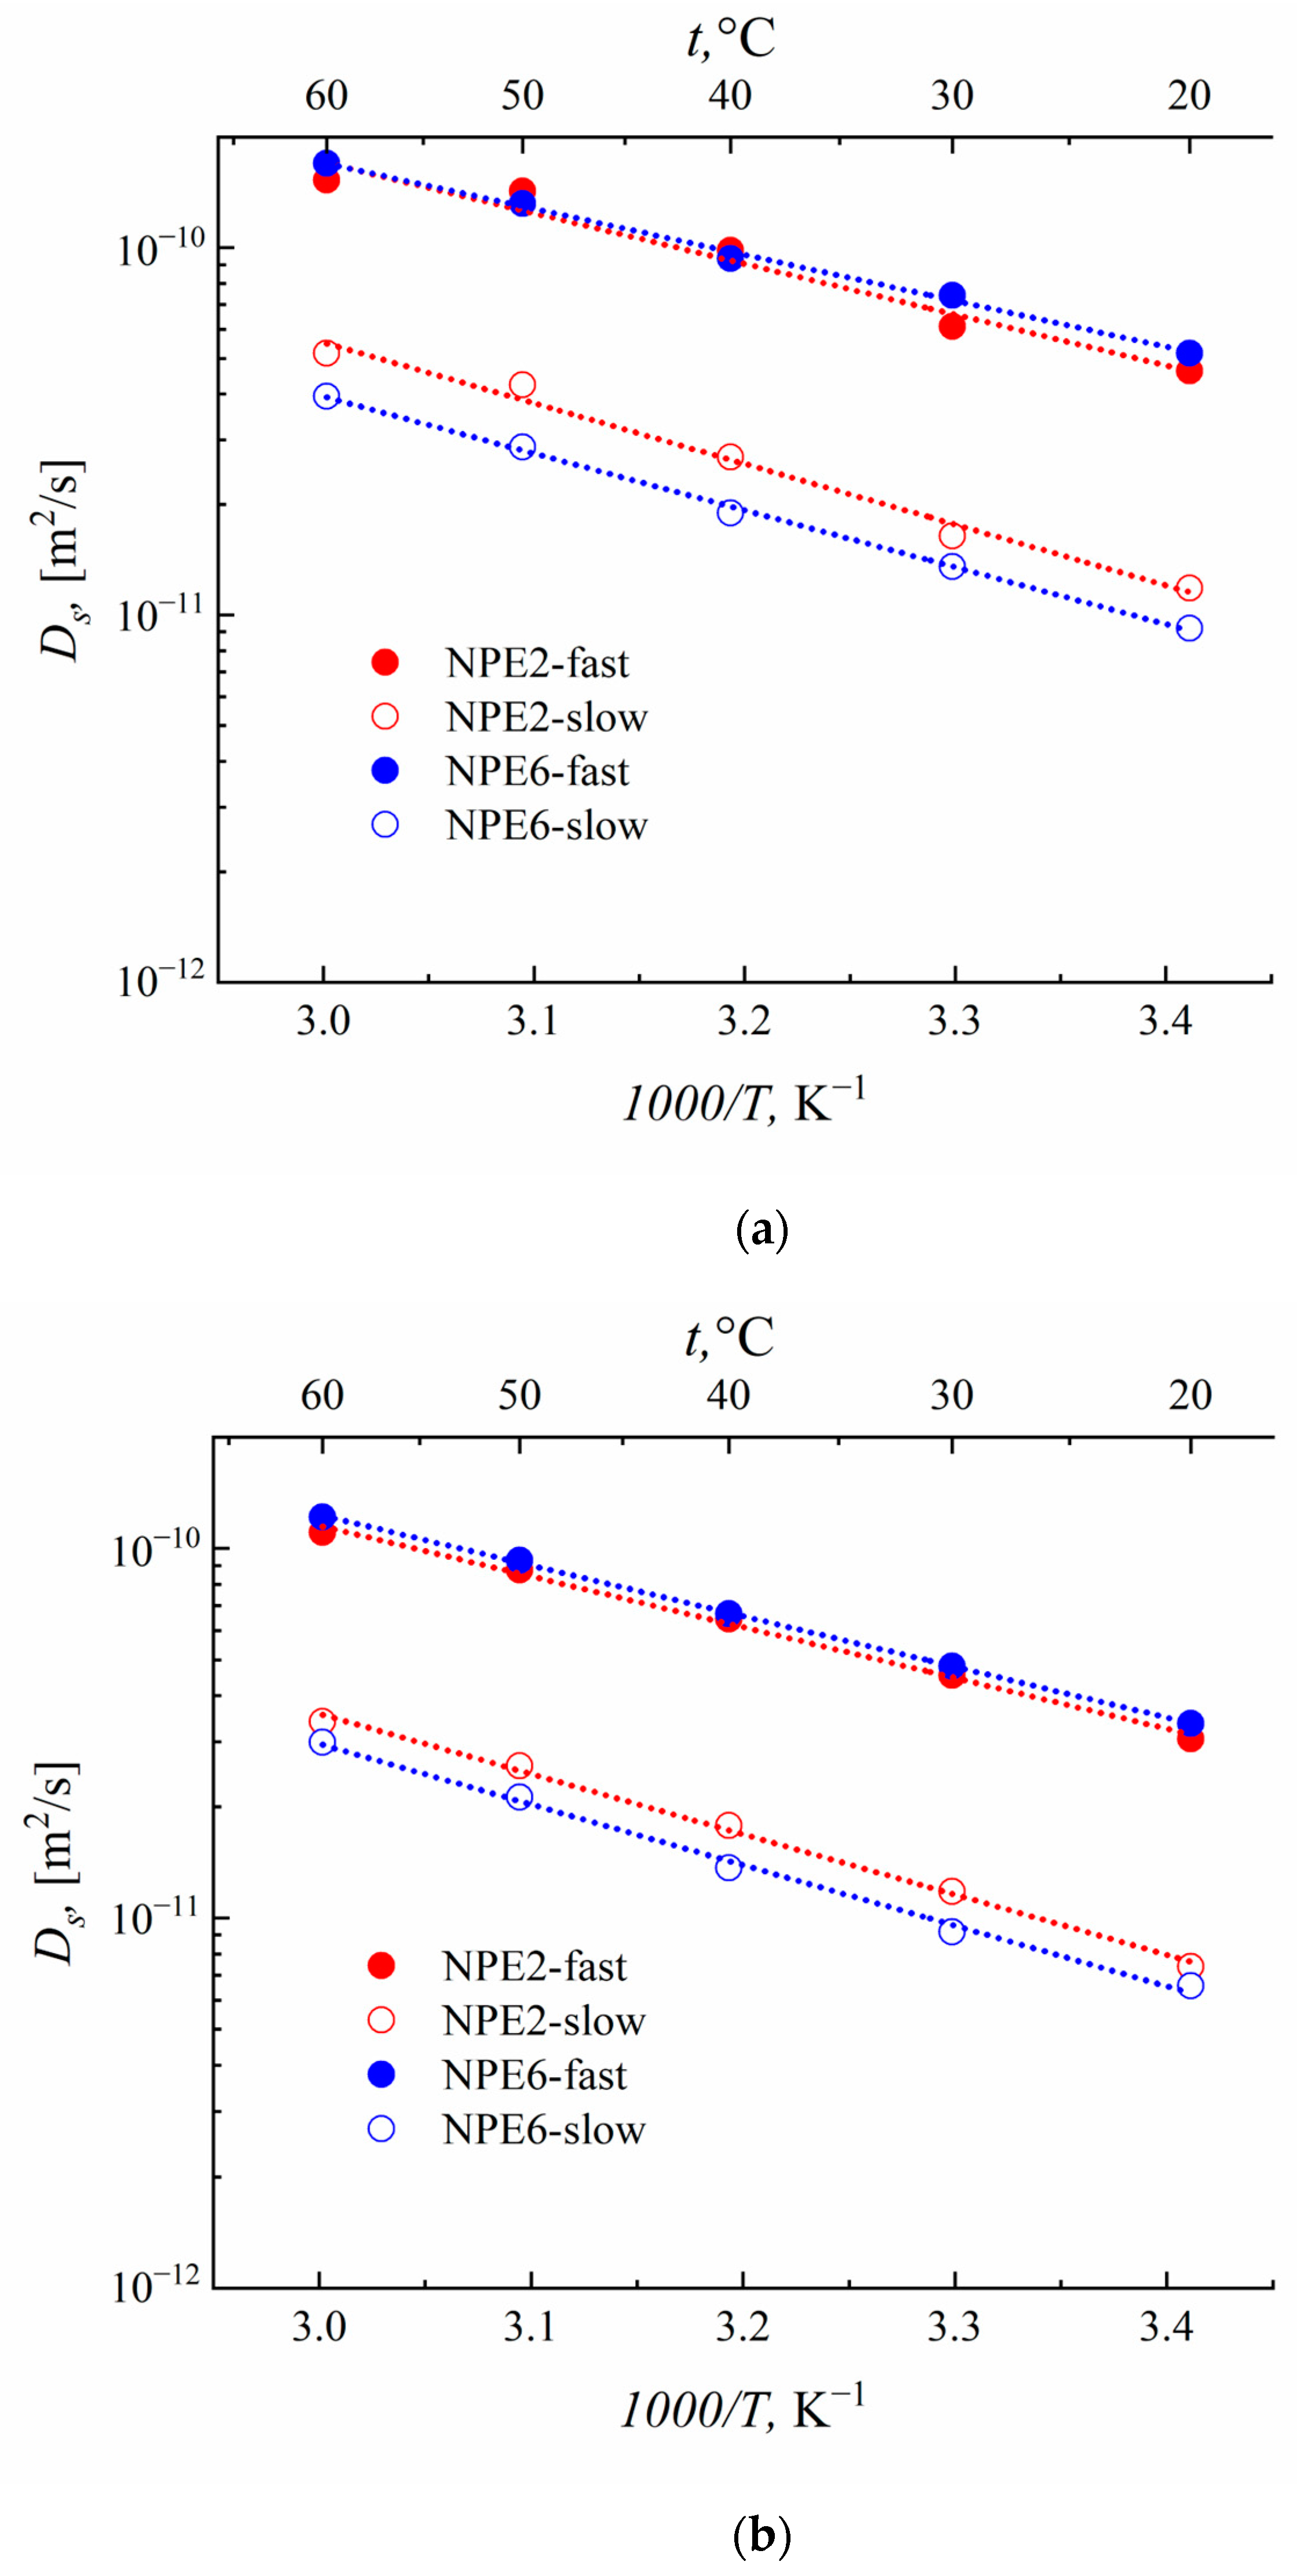
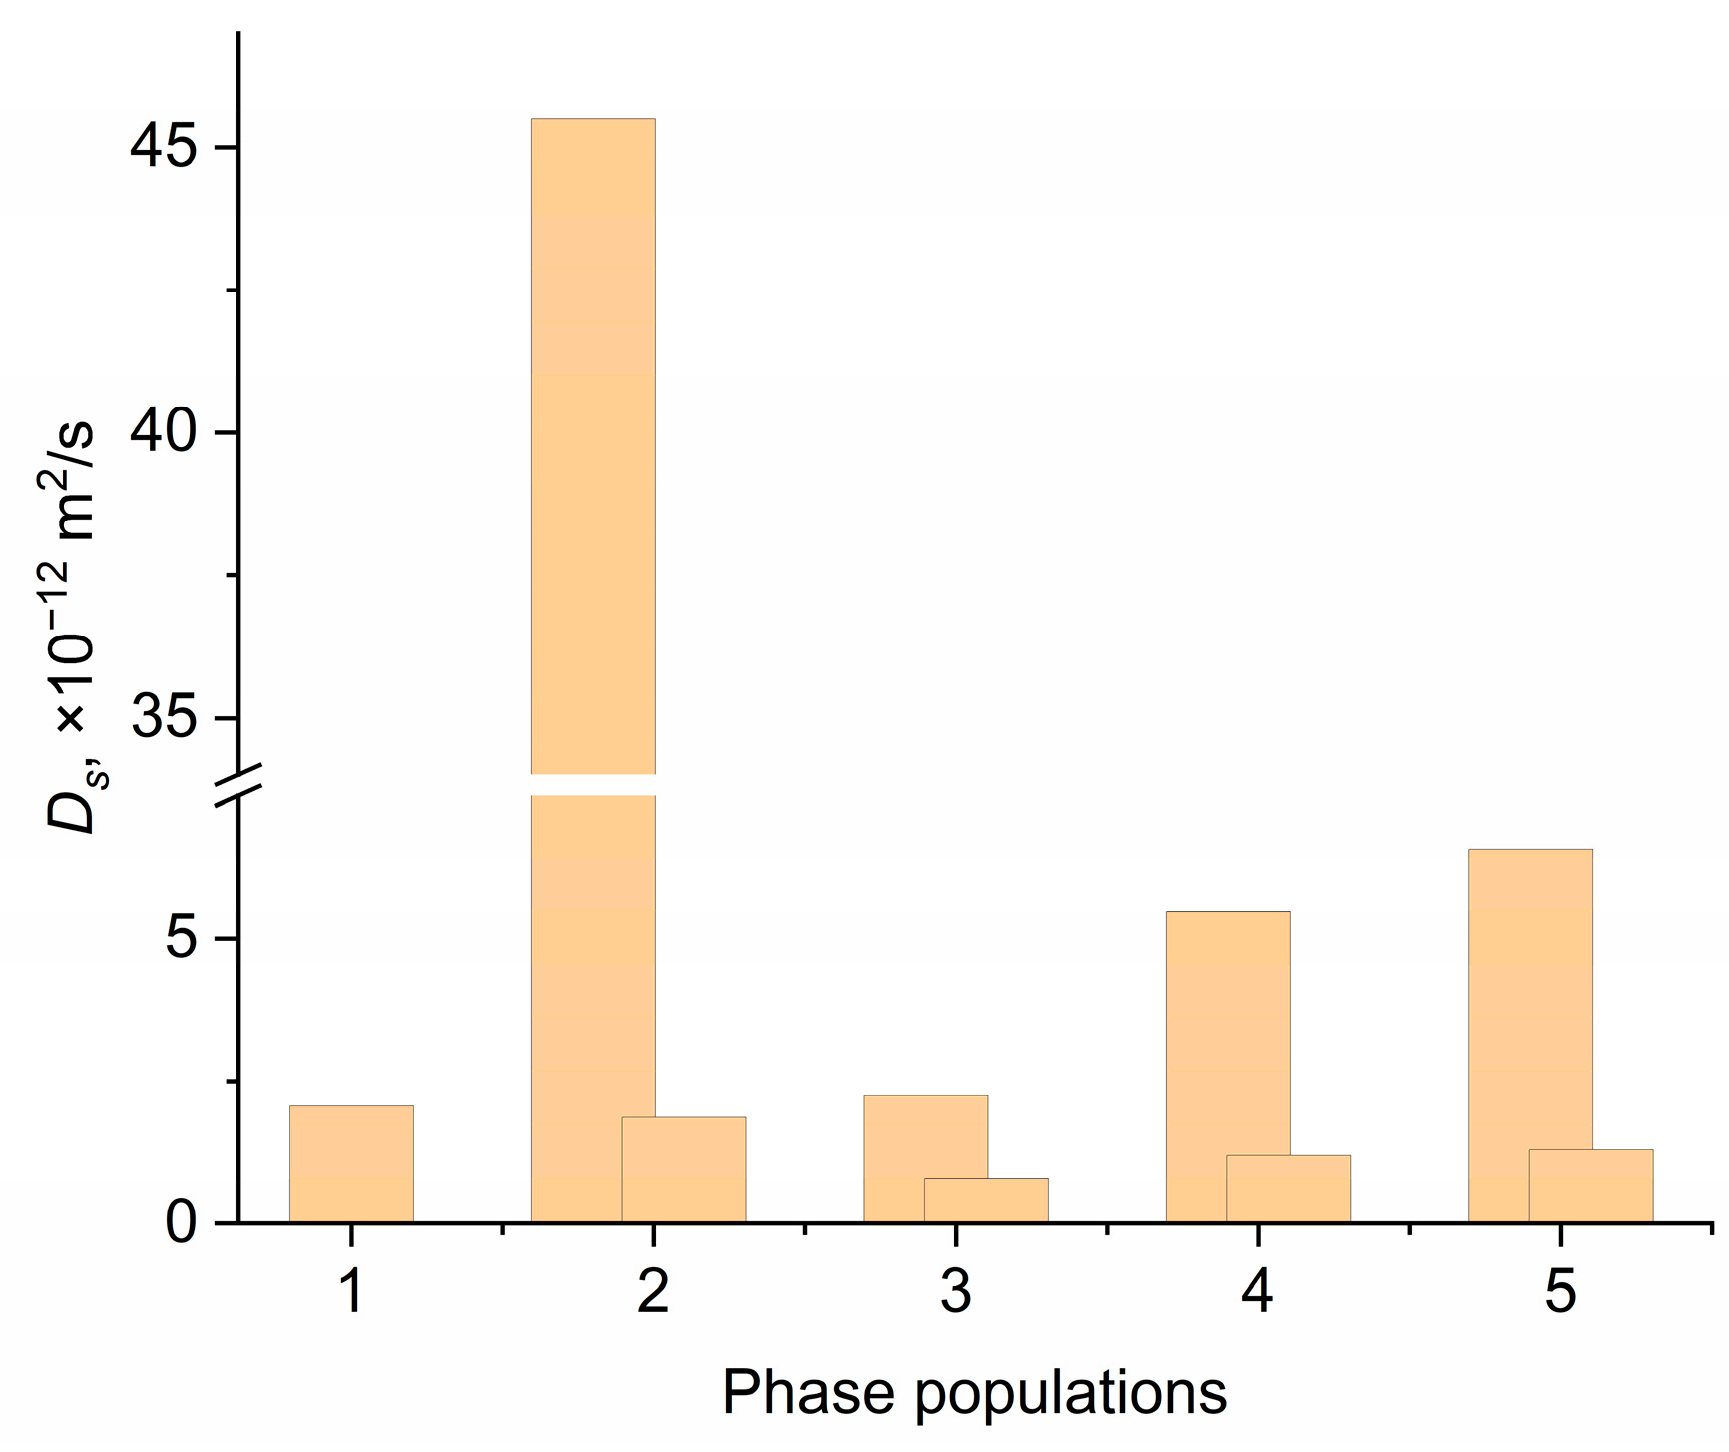
3.6. Self-Diffusion Coefficients According to the PFG NMR Data
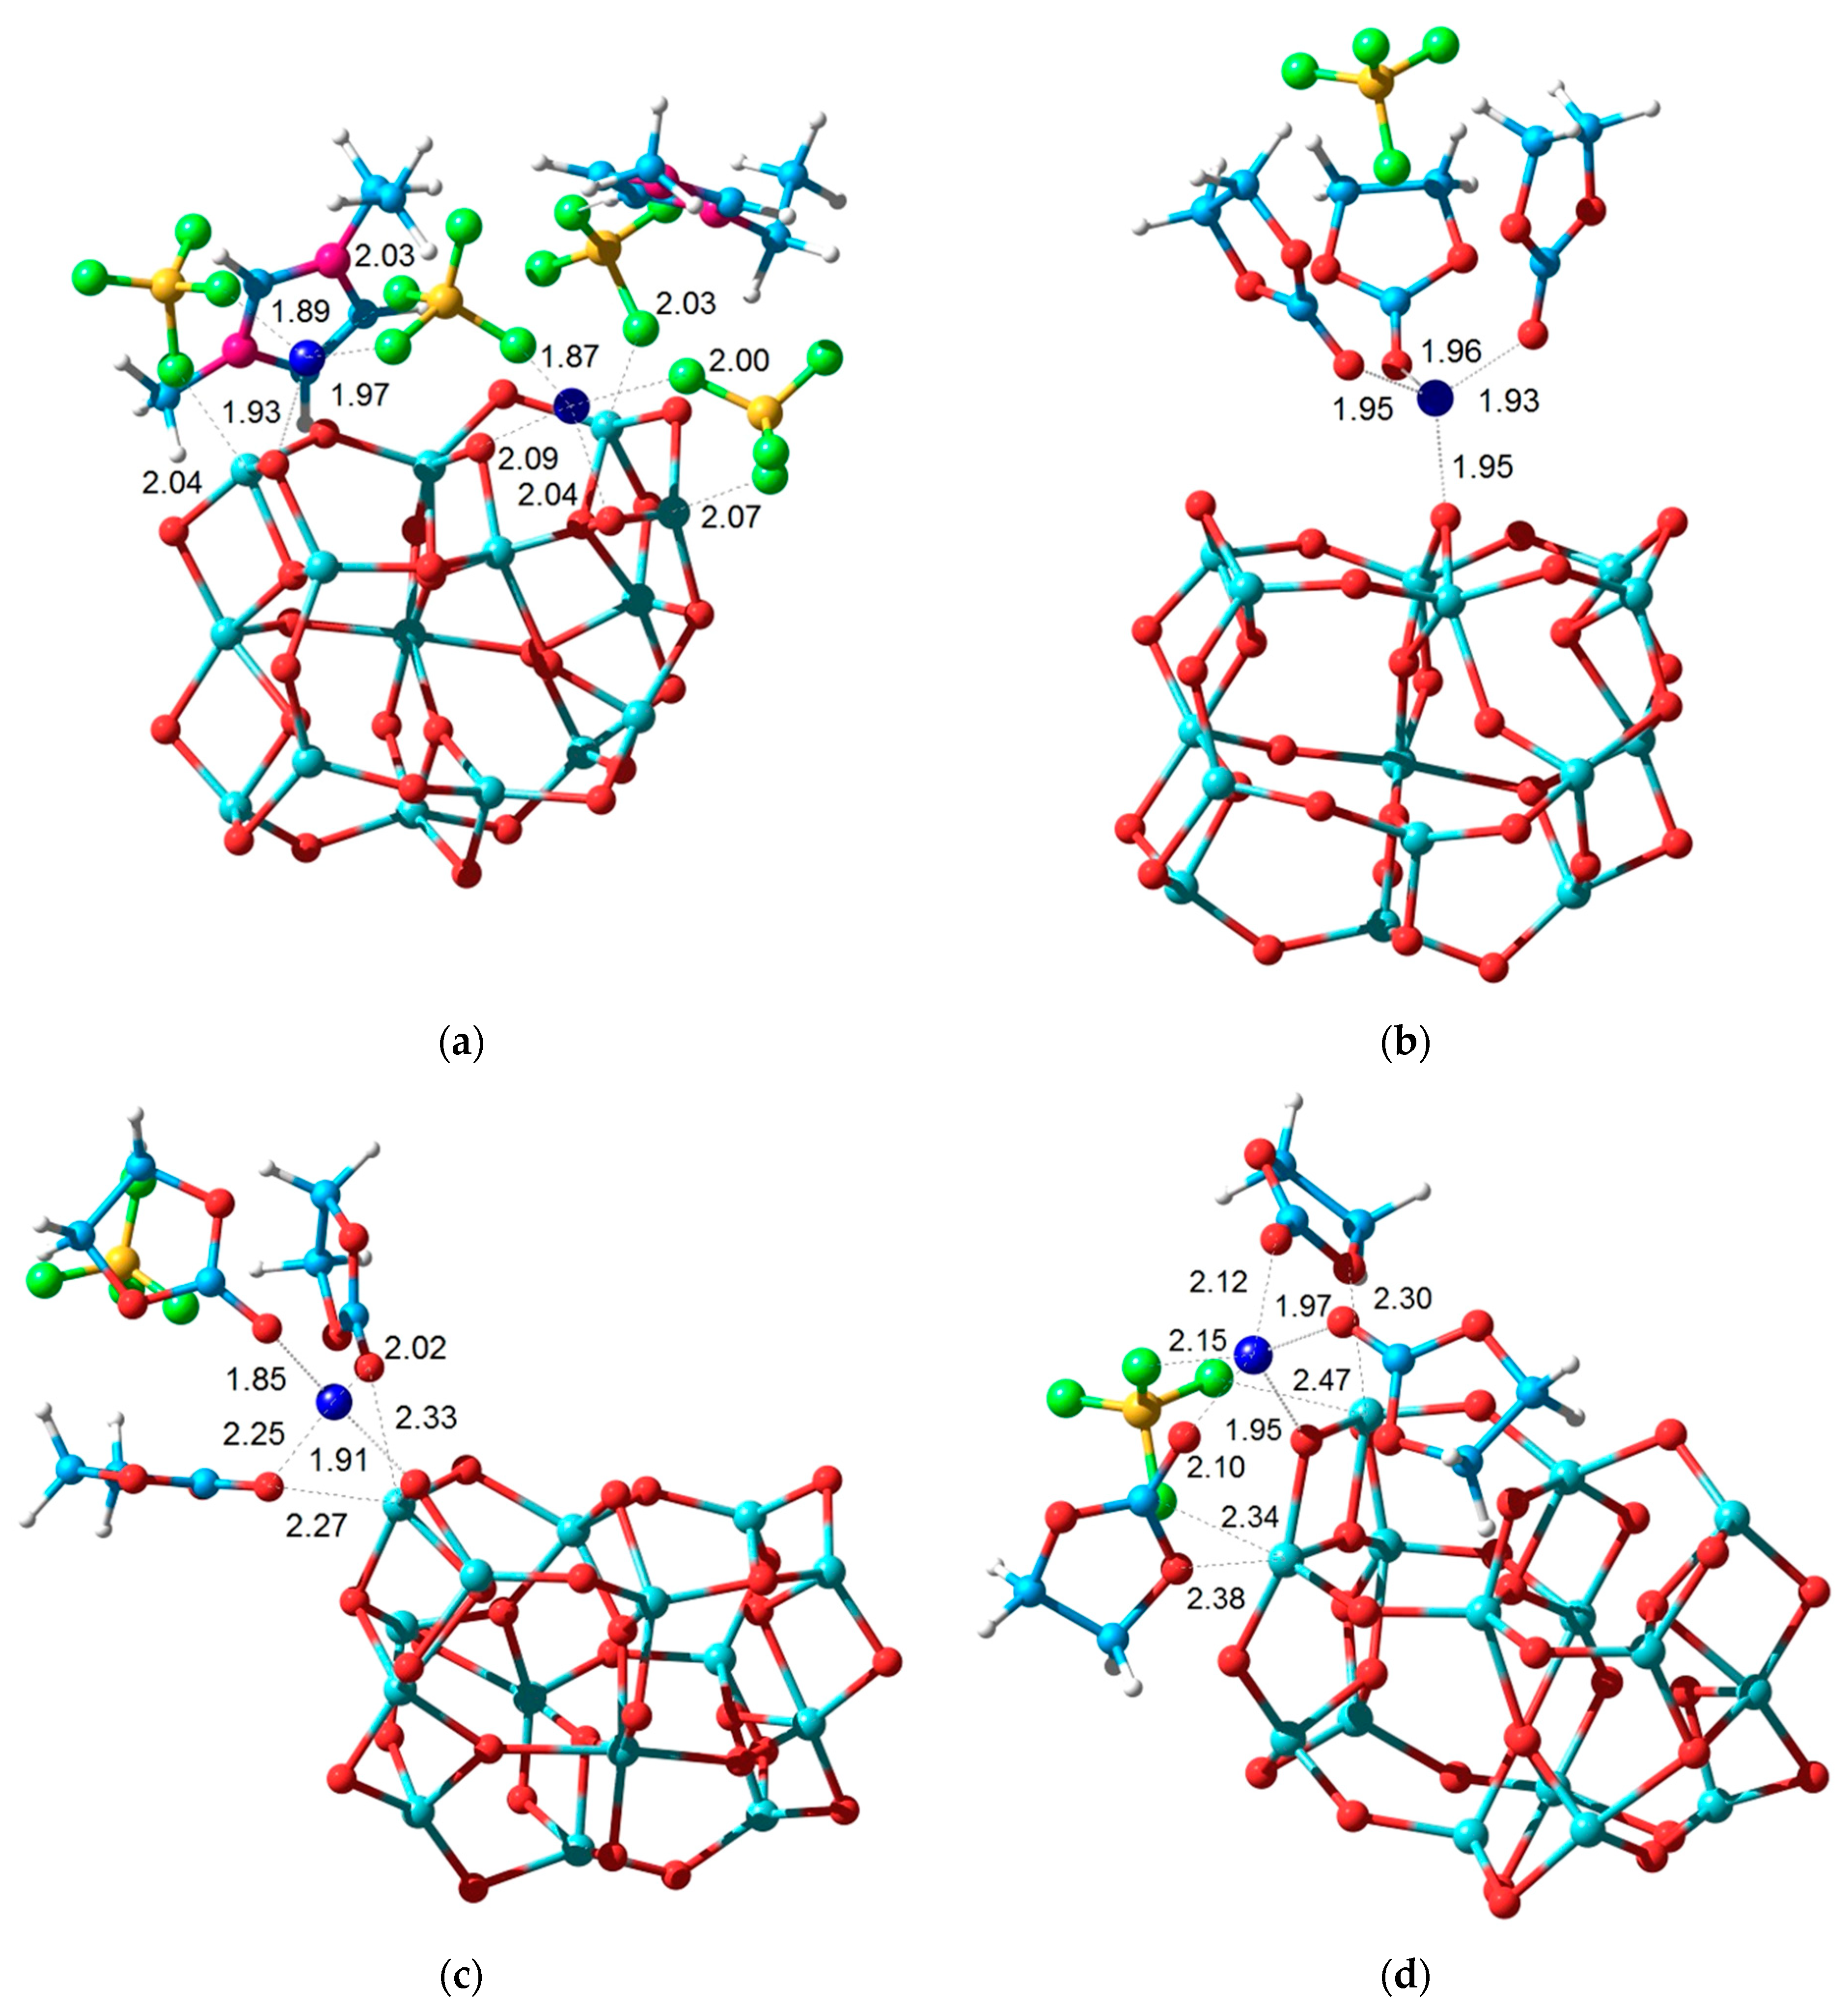
3.7. Theoretical Analysis
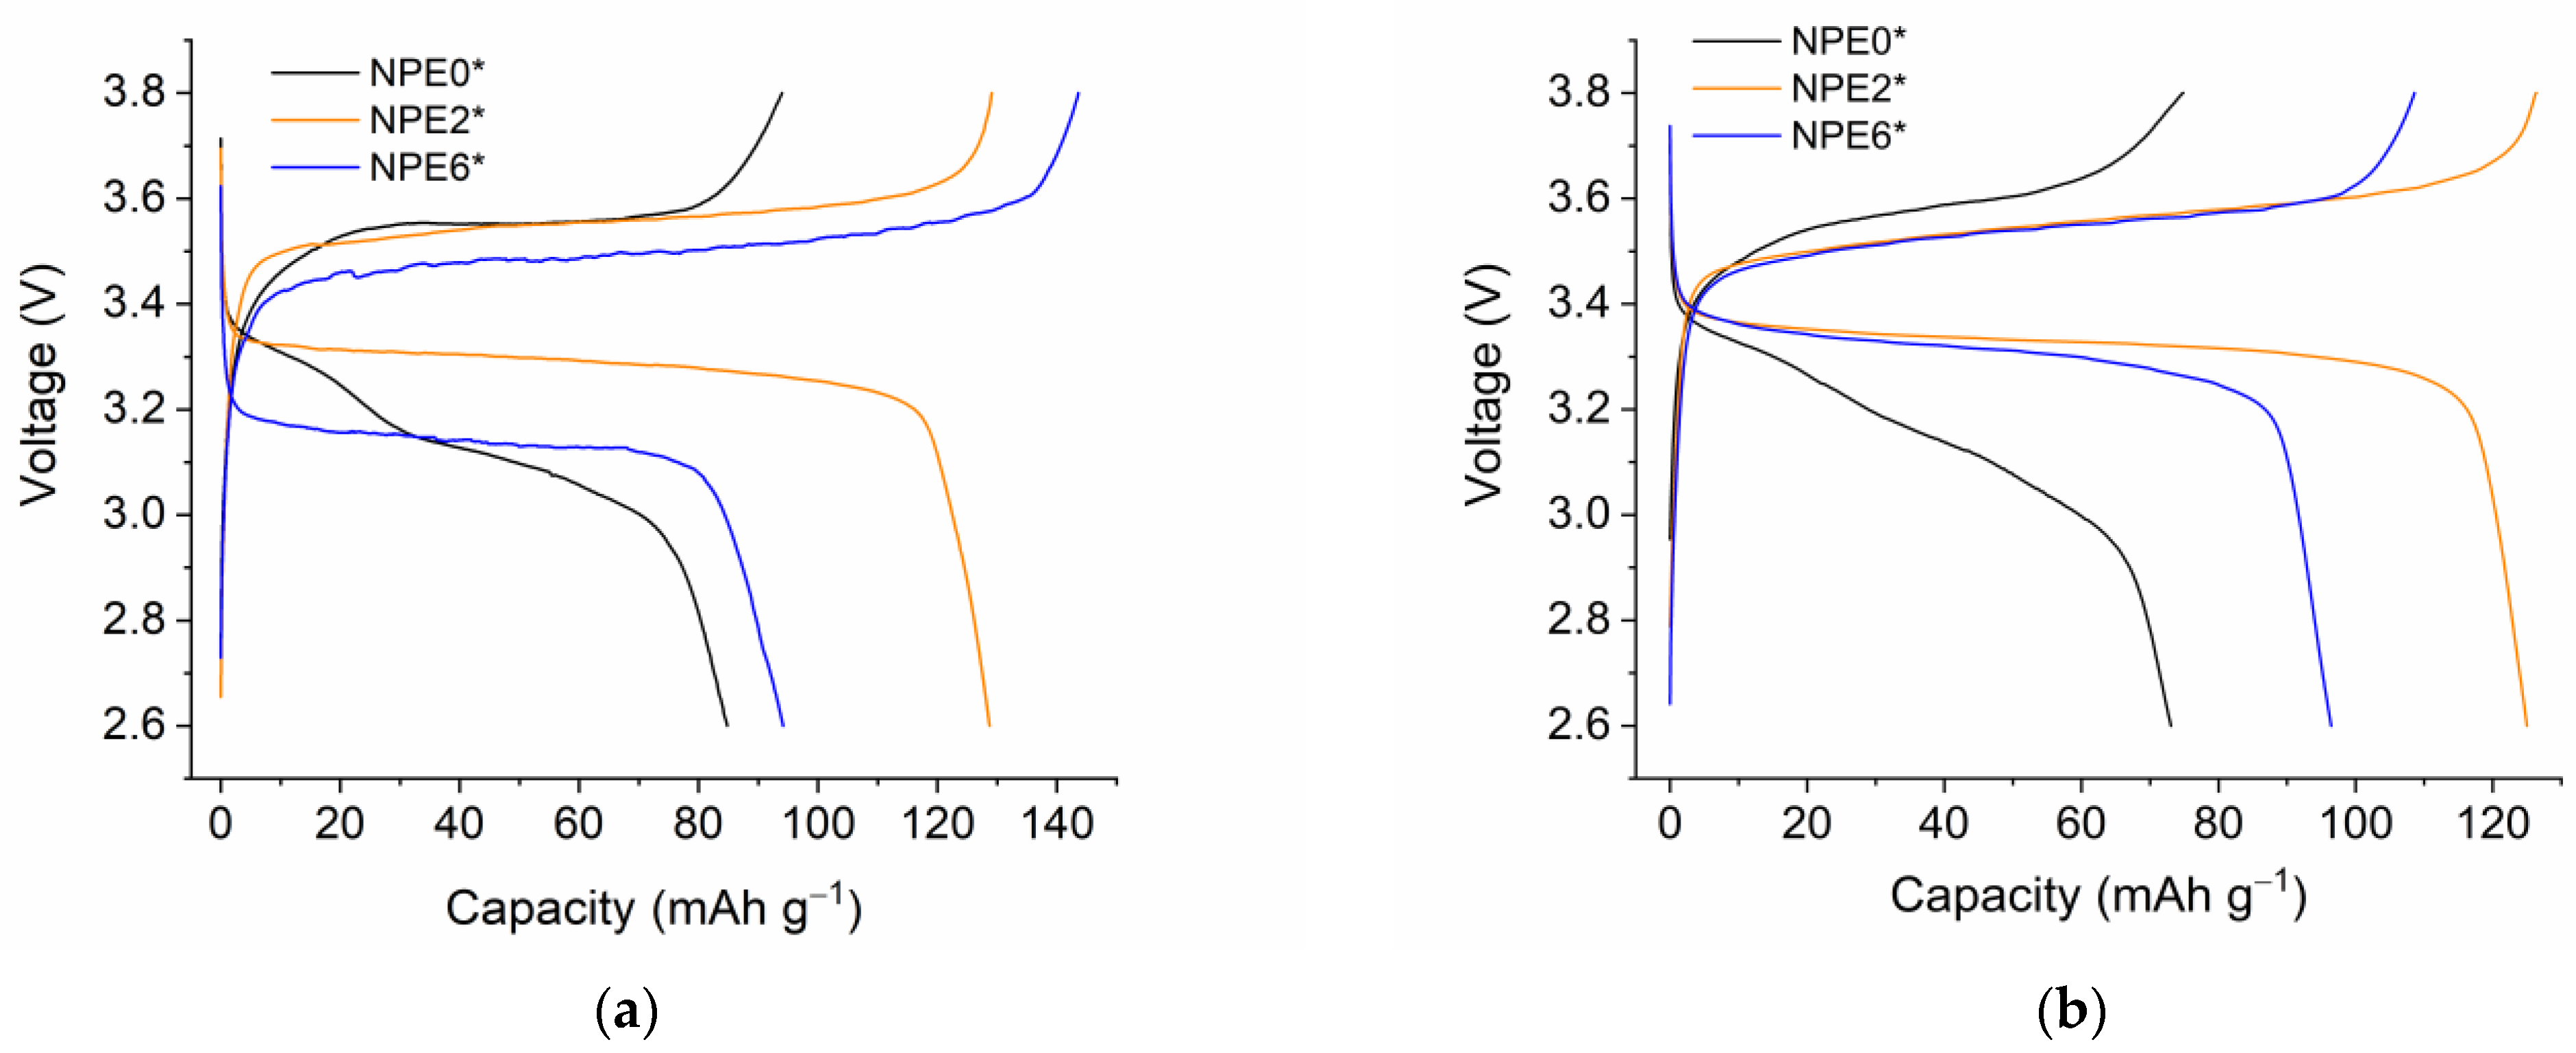
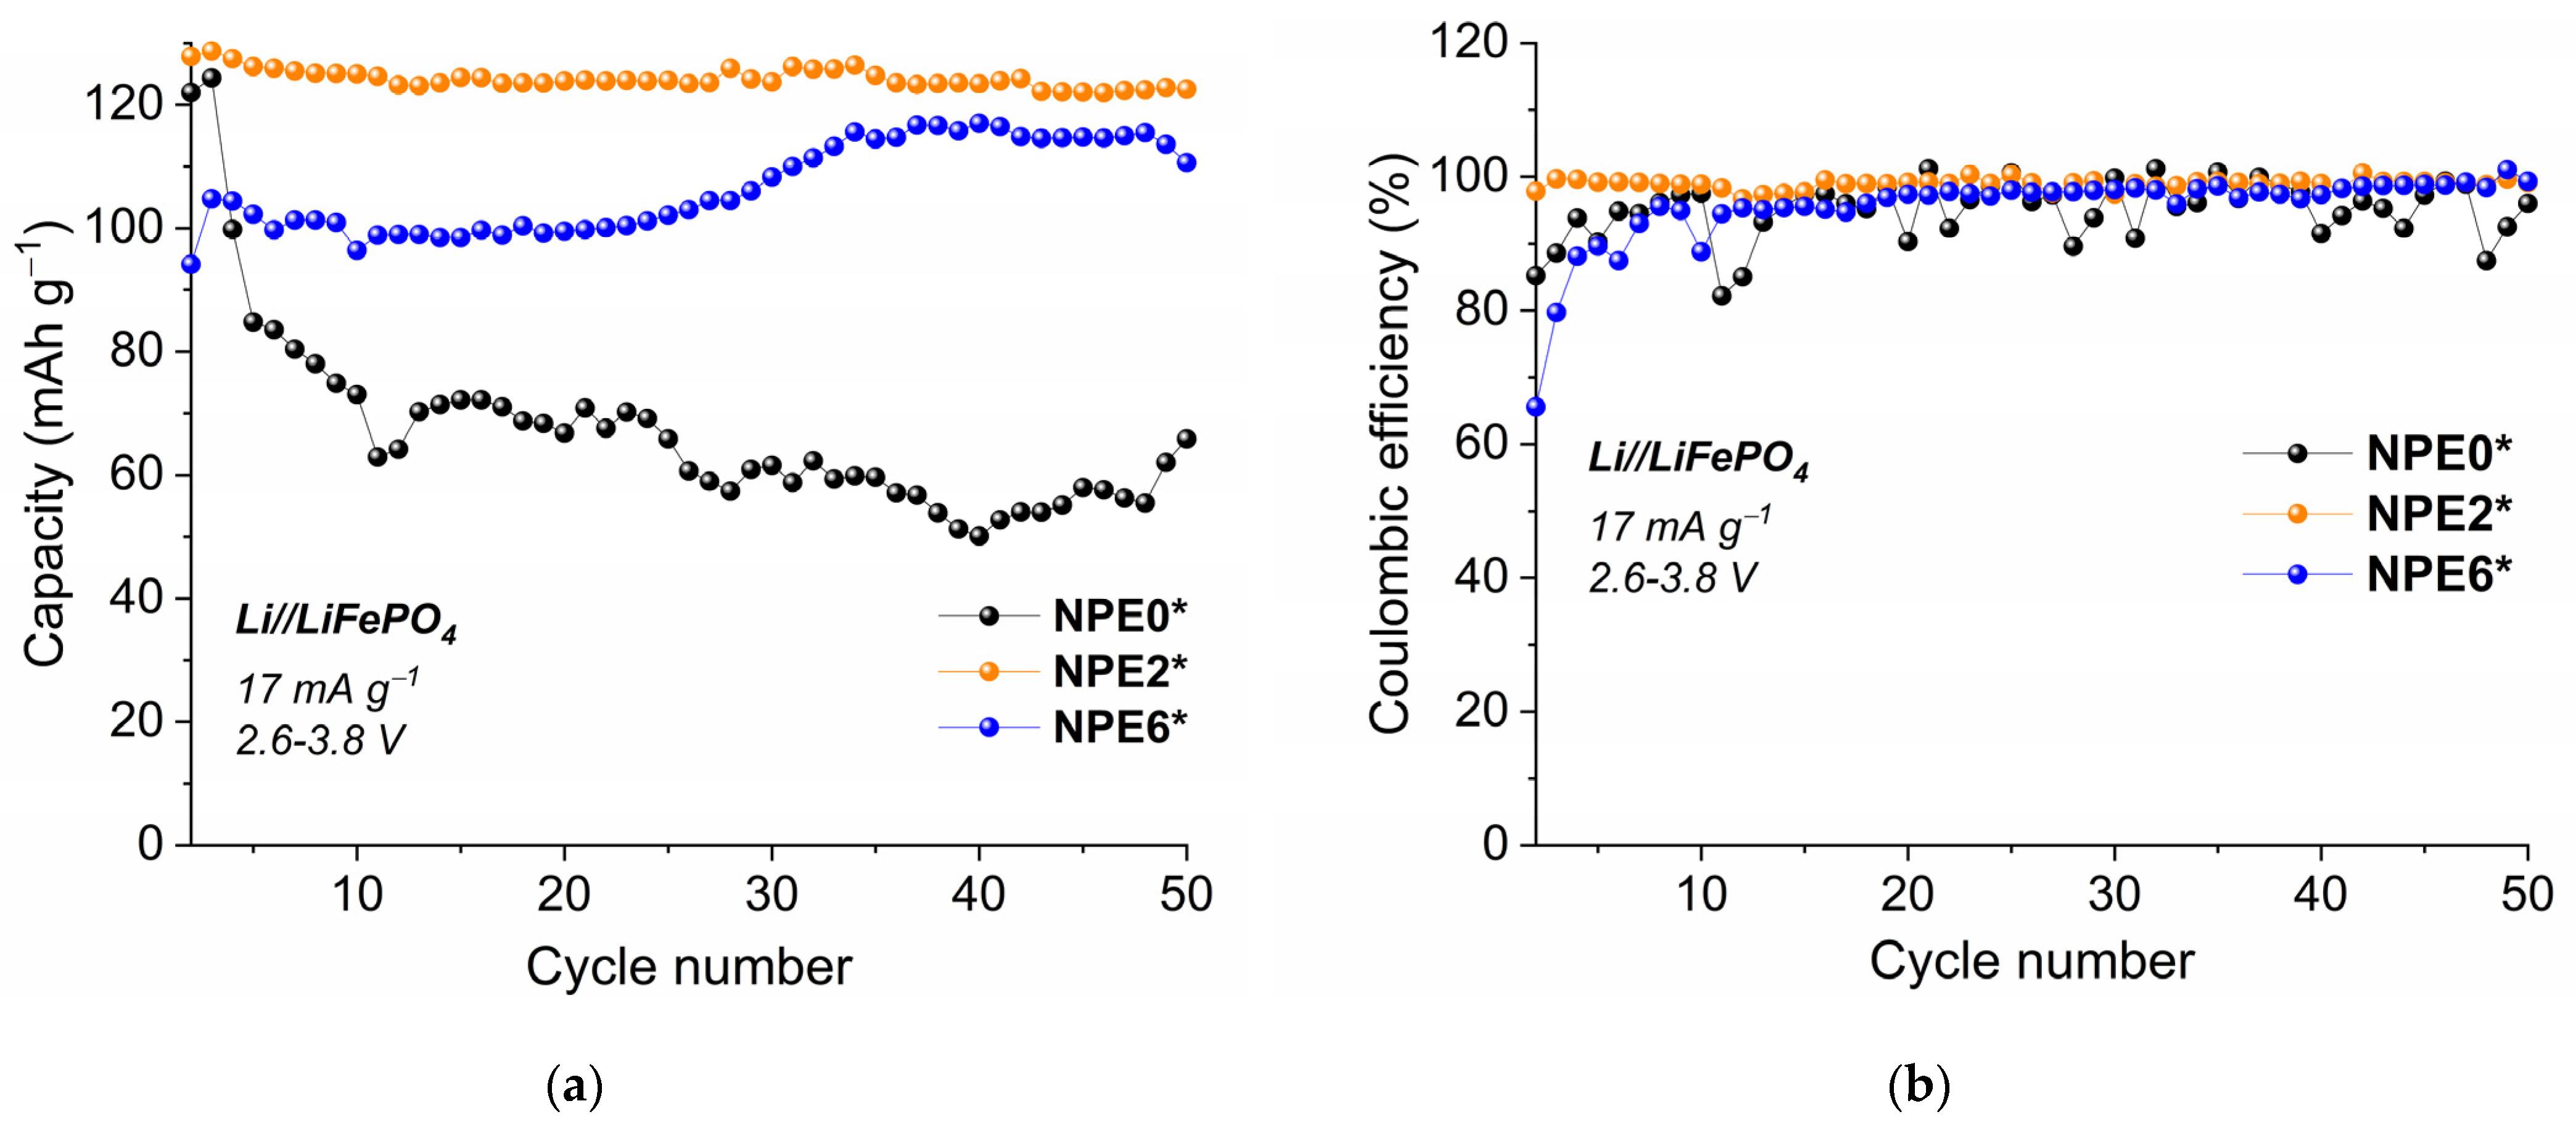
3.8. Electrochemical Study of NPEs in Li//LiFePO4 Cells
4. Conclusions
Supplementary Materials
Author Contributions
Funding
Institutional Review Board Statement
Data Availability Statement
Conflicts of Interest
References
- Khataee, A.; Mansoori, G.A. Nanostructured Titanium Dioxide Materials: Properties, Preparation and Applications; World Scientific Publishing: Hackensack, NJ, USA, 2011; p. 204. [Google Scholar]
- Serga, V.; Burve, R.; Krumina, A.; Pankratova, V.; Popov, A.I.; Pankratov, V. Study of phase composition, photocatalytic activity, and photoluminescence of TiO2 with Eu additive produced by the extraction-pyrolytic method. J. Mater. Res. Technol. 2021, 13, 2350–2360. [Google Scholar] [CrossRef]
- Dorosheva, I.B.; Adiyak, E.V.; Valeeva, A.A.; Rempel, A.A. Synthesis of Nonstoichiometric Titanium Dioxide in the Hydrogen Flow. AIP Conf. Proc. 2019, 2174, 020019. [Google Scholar] [CrossRef]
- Tsebriienko, T.; Popov, A.I. Effect of Poly(Titanium Oxide) on the Viscoelastic and Thermophysical Properties of Interpenetrating Polymer Networks. Crystals 2021, 11, 794. [Google Scholar] [CrossRef]
- Fabre, E.; Murshed, S.M.S. A Review of the Thermophysical Properties and Potential of Ionic Liquids for Thermal Applications. J. Mater. Chem. A 2021, 9, 15861–15879. [Google Scholar] [CrossRef]
- Hayes, R.; Warr, G.G.; Atkin, R. Structure and Nanostructure in Ionic Liquids. Chem. Rev. 2015, 115, 6357–6426. [Google Scholar] [CrossRef]
- Dong, K.; Liu, X.; Dong, H.; Zhang, X.; Zhang, S. Multiscale Studies on Ionic Liquids. Chem. Rev. 2017, 117, 6636–6695. [Google Scholar] [CrossRef] [PubMed]
- Qiao, Y.; Ma, W.; Theyssen, N.; Chen, C.; Hou, Z. Temperature—Responsive Ionic Liquids: Fundamental Behaviors and Catalytic Applications. Chem. Rev. 2017, 117, 6881–6928. [Google Scholar] [CrossRef]
- Pei, Y.; Zhang, Y.; Ma, J.; Fan, M.; Zhang, S.; Wang, J. Ionic Liquids for Advanced Materials. Mater. Today Nano 2022, 17, 100159. [Google Scholar] [CrossRef]
- Chen, N.; Zhang, H.; Li, L.; Chen, R.; Guo, S. Ionogel Electrolytes for High-Performance Lithium Batteries: A Review. Adv. Energy Mater. 2018, 8, 1702675. [Google Scholar] [CrossRef]
- Watanabe, M.; Thomas, M.L.; Zhang, S.; Ueno, K.; Yasuda, T.; Dokko, K. Application of Ionic Liquids to Energy Storage and Conversion Materials and Devices. Chem. Rev. 2017, 117, 7190–7239. [Google Scholar] [CrossRef]
- Yu, L.; Chen, G.Z. Ionic Liquid—Based Electrolytes for Supercapacitor and Supercapattery. Front. Chem. 2019, 7, 272. [Google Scholar] [CrossRef] [PubMed]
- Qiu, C.; Li, Z.; Pan, J.; Hong, Y.; Li, J.; Lin, Y.; Shi, K.; Liu, Q. Designing Stable Electrode Interfaces from a Pyrrolidine—Based Electrolyte for Improving LiNi0.8Co0.1Mn0.1O2 Batteries. Ind. Eng. Chem. Res. 2022, 61, 14173–14180. [Google Scholar] [CrossRef]
- Tripathi, A.K. Ionic Liquid–Based Solid Electrolytes (Ionogels) for Application in Rechargeable Lithium Battery. Mater. Today Energy 2021, 20, 100643. [Google Scholar] [CrossRef]
- Correia, D.M.; Fernandes, L.C.; Martins, P.M.; García-Astrain, C.; Costa, C.M.; Reguera, J.; Lanceros-Méndez, S. Ionic Liquid–Polymer Composites: A New Platform for Multifunctional Applications. Adv. Funct. Mater. 2020, 30, 1909736. [Google Scholar] [CrossRef]
- Cheng, Y.; Zhang, L.; Xu, S.; Zhang, H.; Ren, B.; Li, T.; Zhang, S. Ionic Liquid Functionalized Electrospun Gel Polymer Electrolyte for Use in a High—Performance Lithium Metal Battery. J. Mater. Chem. A 2018, 6, 18479–18487. [Google Scholar] [CrossRef]
- Mishra, K.; Rai, D.K. Studies on Ionic Liquid Based Nanocomposite Gel Polymer Electrolyte and Its Application in Sodium Battery. Mater. Sci. Eng. B 2021, 267, 115098. [Google Scholar] [CrossRef]
- Bo, L.; Zhang, X.; Luo, Z.; Saboori, T.; Dehghan, M.; Ghasemizadeh, M.; Karimi-Maleh, H.; Alagumalai, A.; Mahian, O. An Overview of the Applications of Ionic Fluids and Deep Eutectic Solvents Enhanced by Nanoparticles. J. Therm. Anal. Calorim. 2022, 147, 7589–7601. [Google Scholar] [CrossRef]
- Bosque, A.; Muñoz, B.K.; Sánchez, M.; Ureña, A. Thermomechanically Robust Ceramic/Polymer Nanocomposites Modified with Ionic Liquid for Hybrid Polymer Electrolyte Applications. ACS Appl. Energy Mater. 2022, 5, 4247–4258. [Google Scholar] [CrossRef]
- Li, M.; Liao, Y.; Liu, Q.; Xu, J.; Sun, P.; Shi, H.; Li, W. Application of the Imidazolium Ionic Liquid Based Nano—Particle Decorated Gel Polymer Electrolyte for High Safety Lithium Ion Battery. Electrochim. Acta 2018, 284, 188–201. [Google Scholar] [CrossRef]
- Dutta, B.; Deb, D.; Bhattacharya, S. Ionic Liquid—SnO2 Nanoparticle Hybrid Electrolytes for Secondary Charge Storage Devices: Physicochemical and Electrochemical Studies. Int. J. Hydrogen Energy 2018, 43, 4081–4089. [Google Scholar] [CrossRef]
- Verma, Y.L.; Tripathi, A.K.; Shalu; Singh, V.K.; Balo, L.; Gupta, H.; Singh, S.K.; Singh, R.K. Preparation and Properties of Titania Based Ionogels Synthesized Using Ionic Liquid 1-Ethyl-3-Methyl ImidazoliumThiocyanate. Mater. Sci. Eng. B 2017, 220, 37–43. [Google Scholar] [CrossRef]
- Verma, H.; Mishra, K.; Rai, D.K. Sodium Ion Conducting Nanocomposite Polymer Electrolyte Membrane for Sodium Ion Batteries. J. Solid State Electrochem. 2020, 24, 521–532. [Google Scholar] [CrossRef]
- Sun, P.; Liao, Y.; Xie, H.; Chen, T.; Rao, M.; Li, W. Poly(Methyl Methacrylate–Acrylonitrile–Ethyl Acrylate) Terpolymer Based Gel Electrolyte for LiNi0.5Mn1.5O4 Cathode of High Voltage Lithium Ion Battery. J. Power Sources 2014, 269, 299–307. [Google Scholar] [CrossRef]
- Das, S.; Ghosh, A. Solid Polymer Electrolyte Based on PVDF—HFP and Ionic Liquid Embedded with TiO2 Nanoparticle for Electric Double Layer Capacitor (EDLC) Application. J. Electrochem. Soc. 2017, 164, F1348–F1353. [Google Scholar] [CrossRef]
- Yarmolenko, O.V.; Yudina, A.V.; Ignatova, A.A.; Shuvalova, N.I.; Martynenko, V.M.; Bogdanova, L.M.; Chernyak, A.V.; Zabrodin, V.A.; Volkov, V.I. New Polymer Electrolytes Based on Polyethylene Glycol Diacrylate–LiBF4–1-Ethyl-3—Methylimidazolium Tetrafluoroborate with the Introduction of Alkylene Carbonates. Russ. Chem. Bull. 2015, 64, 2505–2511. [Google Scholar] [CrossRef]
- Volkov, V.I.; Yarmolenko, O.V.; Chernyak, A.V.; Slesarenko, N.A.; Avilova, I.A.; Baymuratova, G.R.; Yudina, A.V. Polymer Electrolytes for Lithium—Ion Batteries Studied by NMR Techniques. Membranes 2022, 12, 416. [Google Scholar] [CrossRef]
- Chernyak, A.V.; Berezin, M.P.; Slesarenko, N.A.; Zabrodin, V.A.; Volkov, V.I.; Yudina, A.V.; Shuvalova, N.I.; Yarmolenko, O.V. Influence of the Reticular Polymeric Gel—Electrolyte Structure on Ionic and Molecular Mobility of an Electrolyte System Salt—Ionic Liquid: LiBF4-1-Ethyl-3-Methylimidazolium Tetrafluoroborate. Russ. Chem. Bull. 2016, 65, 2053–2058. [Google Scholar] [CrossRef]
- Suh, K.-J.; Hong, Y.-S.; Skirda, V.D.; Volkov, V.I.; Lee, C.-Y.J.; Lee, C.-H. Water Self—Diffusion Behavior in Yeast Cells Studied by Pulsed Field Gradient NMR. Biophys. Chem. 2003, 104, 121–130. [Google Scholar] [CrossRef]
- Hayamizu, K.; Aihara, Y. Ion and Solvent Diffusion and Ion Conduction of PC-DEC and PC-DME Binary Solvent Electrolytes of LiN(SO2CF3)2. Electrochim. Acta 2004, 49, 3397–3402. [Google Scholar] [CrossRef]
- Perdew, J.P.; Burke, K.; Ernzerhof, M. Generalized Gradient Approximation Made Simple. Phys. Rev. Lett. 1996, 77, 3865–3868. [Google Scholar] [CrossRef]
- Hirshfeld, F.L. Bonded-Atom Fragments for Describing Molecular Charge Densities. Theoret. Chim. Acta 1977, 44, 129–138. [Google Scholar] [CrossRef]
- Laikov, D.N. Fast Evaluation of Density Functional Exchange-Correlation Terms Using the Expansion of the Electron Density in Auxiliary Basis Sets. Chem. Phys. Lett. 1997, 281, 151–156. [Google Scholar] [CrossRef]
- Yarmolenko, O.V.; Khatmullina, K.G.; Baymuratova, G.R.; Tulibaeva, G.Z.; Bogdanova, L.M.; Shestakov, A.F. Causes of the Double Maximum Conductivity of Nanocomposite Polymer Electrolytes for Lithium Power Sources. Mendeleev Commun. 2018, 28, 41–43. [Google Scholar] [CrossRef]
- Yarmolenko, O.V.; Yudina, A.V.; Khatmullina, K.G. Nanocomposite Polymer Electrolytes for the Lithium Power Sources (a Review). Russ. J. Electrochem. 2018, 54, 325–343. [Google Scholar] [CrossRef]
- Khatmullina, K.G.; Slesarenko, N.A.; Chernyak, A.V.; Baymuratova, G.R.; Yudina, A.V.; Berezin, M.P.; Tulibaeva, G.Z.; Slesarenko, A.A.; Shestakov, A.F.; Yarmolenko, O.V. New Network Polymer Electrolytes Based on Ionic Liquid and SiO2 Nanoparticles for Energy Storage Systems. Membranes 2023, 13, 548. [Google Scholar] [CrossRef]
- Chernyak, A.V.; Slesarenko, N.A.; Slesarenko, A.A.; Baymuratova, G.R.; Tulibaeva, G.Z.; Yudina, A.V.; Volkov, V.I.; Shestakov, A.F.; Yarmolenko, O.V. Effect of the Solvate Environment of Lithium Cations on the Resistance of the Polymer Electrolyte/Electrode Interface in a Solid-State Lithium Battery. Membranes 2022, 12, 1111. [Google Scholar] [CrossRef]
- Ma, J.; Wang, Z.; Wu, J.; Gu, Z.; Xin, X.; Yao, X. In Situ Solidified Gel Polymer Electrolytes for Stable Solid−State Lithium Batteries at High Temperatures. Batteries 2023, 9, 28. [Google Scholar] [CrossRef]
- Wang, Z.; Shen, L.; Deng, S.; Cui, P.; Yao, X. 10 μm-Thick High-Strength Solid Polymer Electrolytes with Excellent Interface Compatibility for Flexible All-Solid-State Lithium-Metal Batteries. Adv. Mater. 2021, 33, 2100353. [Google Scholar] [CrossRef]
- Dai, W.; Qiao, Y.; Ma, Z.; Wang, T.; Fu, Z. All-solid-state thin-film batteries based on lithium phosphorus oxynitrides. Mater. Futures 2022, 1, 032101. [Google Scholar] [CrossRef]
- Yuan, X.; Razzaq, A.A.; Chen, Y.; Lian, Y.; Zhao, X.; Peng, Y.; Deng, Z. Polyacrylonitrile-based gel polymer electrolyte filled with Prussian blue for high-performance lithium polymer batteries. Chin. Chem. Lett. 2021, 32, 890–894. [Google Scholar] [CrossRef]
- Liu, Z.; Guo, D.; Fan, W.; Xu, F.; Yao, X. Expansion-Tolerant Lithium Anode with Built-In LiF-Rich Interface for STable 400 Wh kg−1 Lithium Metal Pouch Cells. ACS Mater. Lett. 2022, 4, 1516–1522. [Google Scholar] [CrossRef]


| No. | Content | PEGDA | LiBF4 | EMIBF4 | EC | TiO2 | PB |
|---|---|---|---|---|---|---|---|
| NPE0 | mol | 1 | 1 | 6 | 3 | ||
| wt.% | 27 | 4 | 55 | 12 | 0 | 1 | |
| NPE2 | mol | 1 | 1 | 6 | 3 | ||
| wt.% | 30 | 4 | 51 | 12 | 2 | 1 | |
| NPE6 | mol | 1 | 1 | 6 | 3 | ||
| wt.% | 29 | 4 | 49 | 11 | 6 | 1 |
| No. | σ, mS cm−1 (25 °C) | Ea, kJ mol−1 | |
|---|---|---|---|
| −40 to +15 °C | 25 to 100 °C | ||
| NPE0 | 2.1 | 25.4 ± 0.8 | 21.2 ± 1.8 |
| NPE2 | 3.4 | 25.5 ± 1.3 | 19.4 ± 1.2 |
| NPE6 | 3.8 | 24.1 ± 0.5 | 20.7 ± 1.3 |
| Sample | Ds, m2s−1 (10−12) | |||
|---|---|---|---|---|
| 7Li (p) | 19F (p) | |||
| NPE2 | 5.47 (0.7) | 1.19 (0.3) | 21.4 (0.7) | 4.29 (0.3) |
| NPE6 | 6.56 (0.7) | 1.31 (0.3) | 29.9 (0.7) | 6.35 (0.3) |
| EMIBF4 | — | 38.5 (1) | ||
| Sample | Ds, m2s−1 (10−12) | |||
|---|---|---|---|---|
| 1H (p), EMI+ | 1H (p), EC | |||
| NPE2 | 30.6 (0.7) | 7.40 (0.3) | 46.1 (0.7) | 11.8 (0.3) |
| NPE6 | 33.6 (0.7) | 6.56 (0.3) | 51.7 (0.7) | 9.22 (0.3) |
| EMIBF4 | 51.5 (1) | — | ||
| Sample | Ea, kJmol−1 (eV) | |||||||
|---|---|---|---|---|---|---|---|---|
| 1H_EMI+ | 1H_EC | 7Li | 19F | |||||
| fast | slow | fast | slow | fast | slow | fast | Slow | |
| NPE2 | 26.3 (0.27) | 31.2 (0.32) | 26.4 (0.27) | 31.6 (0.33) | 30.1 (0.31) | 29.2 (0.30) | 27.5 (0.28) | 35.4 (0.37) |
| NPE6 | 26.2 (0.27) | 31.3 (0.32) | 23.9 (0.25) | 29.6 (0.31) | 34.0 (0.35) | 30.4 (0.32) | 25.0 (0.26) | 26.9 (0.28) |
| EMIBF4 | 20.9 (0.22) | — | 27.0 (0.28) | |||||
| Electrolyte | Conductivity, S cm−1 | Cells Performance | Reference |
|---|---|---|---|
| PEGMEA/LiTFSI + 1 M LiPF6 in EC/DMC/EMC (1/1/1, v/v/v) (PE—separator) | 10−5 (20 °C) | Li//LiFePO4 * | [38] |
| 2 × 10⁻⁴ (60 °C) | 158 mAh g−1 (80 °C) | ||
| PEGMEA/LiTFSI (PE—separator) | 1.1 × 10⁻⁴ (20 °C) | Li//LiFePO4 | [39] |
| 149 mAh g−1 (60 °C) | |||
| PEGDA, LiBF4, EMIBF4, EC, and TiO2 nanopowder | 2 × 10⁻⁴ (−40 °C) | Li//LiFePO4 | This work |
| 1 × 10⁻³ (0 °C) | 124 mAh g−1 (20 °C) | ||
| 4.8 × 10⁻³ (20 °C) | |||
| 2.1 × 10⁻² (100 °C) | |||
| LiPON solid electrolytes | 2 × 10⁻⁶ | — | [40] |
| PAN—PBA composite membrane with liquid electrolyte | 2.7 × 10⁻³ | Li//LiFePO4 | [41] |
| 152 mAh g−1 | |||
| LiTFSI/PVDF-HFP on LiB anode | — | Li//NMC83 ** | [42] |
| 1 M LiPF6 in EMC/DMC/FEC (7:2:1 by volume) | 203 mAh g−1 |
Disclaimer/Publisher’s Note: The statements, opinions and data contained in all publications are solely those of the individual author(s) and contributor(s) and not of MDPI and/or the editor(s). MDPI and/or the editor(s) disclaim responsibility for any injury to people or property resulting from any ideas, methods, instructions or products referred to in the content. |
© 2023 by the authors. Licensee MDPI, Basel, Switzerland. This article is an open access article distributed under the terms and conditions of the Creative Commons Attribution (CC BY) license (https://creativecommons.org/licenses/by/4.0/).
Share and Cite
Slesarenko, N.A.; Chernyak, A.V.; Khatmullina, K.G.; Baymuratova, G.R.; Yudina, A.V.; Tulibaeva, G.Z.; Shestakov, A.F.; Volkov, V.I.; Yarmolenko, O.V. Nanocomposite Polymer Gel Electrolyte Based on TiO2 Nanoparticles for Lithium Batteries. Membranes 2023, 13, 776. https://doi.org/10.3390/membranes13090776
Slesarenko NA, Chernyak AV, Khatmullina KG, Baymuratova GR, Yudina AV, Tulibaeva GZ, Shestakov AF, Volkov VI, Yarmolenko OV. Nanocomposite Polymer Gel Electrolyte Based on TiO2 Nanoparticles for Lithium Batteries. Membranes. 2023; 13(9):776. https://doi.org/10.3390/membranes13090776
Chicago/Turabian StyleSlesarenko, Nikita A., Alexander V. Chernyak, Kyunsylu G. Khatmullina, Guzaliya R. Baymuratova, Alena V. Yudina, Galiya Z. Tulibaeva, Alexander F. Shestakov, Vitaly I. Volkov, and Olga V. Yarmolenko. 2023. "Nanocomposite Polymer Gel Electrolyte Based on TiO2 Nanoparticles for Lithium Batteries" Membranes 13, no. 9: 776. https://doi.org/10.3390/membranes13090776
APA StyleSlesarenko, N. A., Chernyak, A. V., Khatmullina, K. G., Baymuratova, G. R., Yudina, A. V., Tulibaeva, G. Z., Shestakov, A. F., Volkov, V. I., & Yarmolenko, O. V. (2023). Nanocomposite Polymer Gel Electrolyte Based on TiO2 Nanoparticles for Lithium Batteries. Membranes, 13(9), 776. https://doi.org/10.3390/membranes13090776