Abstract
Tomato pomace is a low-cost, renewable resource that has been studied for the extraction of the biopolyester cutin, which is mainly composed of long-chain hydroxy fatty acids. These are excellent building blocks to produce new hydrophobic biopolymers. In this work, the monomers of cutin were extracted and isolated from tomato pomace and utilized to produce cutin-based films. Several strategies for the depolymerization and isolation of monomeric cutin were explored. Strategies differed in the state of the raw material at the beginning of the extraction process, the existence of a tomato peel dewaxing step, the type of solvent used, the type of alkaline hydrolysis, and the isolation method of cutin monomers. These strategies enabled the production of extracts enriched in fatty acids (16-hydroxyhexadecanoic, hexadecanedioic, stearic, and linoleic, among others). Cutin and chitosan-based films were successfully cast from cutin extracts and commercial chitosan. Films were characterized regarding their thickness (0.103 ± 0.004 mm and 0.106 ± 0.005 mm), color, surface morphology, water contact angle (93.37 ± 0.31° and 95.15 ± 0.53°), and water vapor permeability ((3.84 ± 0.39) × 10−11 mol·m/m2·s·Pa and (4.91 ± 1.33) × 10−11 mol·m/m2·s·Pa). Cutin and chitosan-based films showed great potential to be used in food packaging and provide an application for tomato processing waste.
1. Introduction
According to the Food and Agriculture Organization (FAO) of the United Nations, about one-third of all food resources produced for human consumption are lost [1]. This large fraction is due to the fact that food production is a wasteful process, with significant losses along its value chain, from crop residues through processing to sale and consumption [2].
Particularly, the fruit and vegetable processing industries generate a huge amount of itwaste every year [3]. These residues are extremely diverse due to the use of a wide variety of fruits and vegetables, representing excellent resources for a diversity of compounds, such as proteins, peptides, polysaccharides, dietary fiber, polyphenols, antioxidants, and natural pigments [3,4].
The tomato processing industry is a good example of this [3,4,5]. Tomato (Solanum lycopersicum) is one of the most produced and extensively consumed crops, after potatoes, with a worldwide rising production of 180 million tonnes in 2018, 183 million tonnes in 2019, and 186 million tonnes in 2020 [6,7]. Several applications have been exploited for the residue that arises from the tomato processing activity, designated as tomato pomace [3,4,5]. Among them are the use of this by-product as a supplement for animal feed [8,9,10], due to its high protein content, and the extraction of lycopene, an antioxidant, for incorporation into food, pharmaceuticals, and cosmetics [11,12,13]. More recently, the possibility of using this by-product for the extraction of a biopolymer, cutin, for the production of renewable materials has been explored [5,14,15].
Cutin represents 40 to 85% of the tomato cuticle’s dry weight [16]. This polymer is made up of long-chain (mainly C16 and C18) hydroxy fatty acids linked together by ester bonds [17]. Many of these monomers are polyhydroxylated, containing a terminal hydroxyl group but also medium-chain hydroxyl groups [14,18]. The presence of monomers with epoxy and oxo mid-chain groups is also reported [14,16,17,18]. The C16 dihydroxy fatty acids typically have the second hydroxyl group at C-10, C-9, C-8, and/or C-7, and the C18 dihydroxy fatty acids at C-9 and C-10 [19]. Cross-linking via these hydroxyl groups allows the formation of a rigid three-dimensional matrix characteristic of cutin [17]. Although in smaller amounts, the presence of aromatic groups, dicarboxylic acids, and glycerol are also reported [14,18].
Cutin’s hydrophobic, thermal, and mechanical properties have prompted consideration of the applicability of this material for the production of bioplastics as an alternative to the use of conventional plastics [5].
Production of cutin bioplastics requires the isolation of the cuticle from the raw materials (such as plant leaves, fruit peels, etc.). Cutin extraction is commonly achieved by its depolymerization, i.e., the breakdown into its constituent monomers, rather than extracting it as a whole. From the literature reported on this subject, it is noticeable that the cutin depolymerization procedure has been evolving from more complex, expensive, time-consuming, and non-green methods to simpler, more affordable, faster, and more sustainable methods [14]. Currently, simpler methodologies include direct hydrolysis of the material. Cigognini et al., 2015 [20], produced monomeric cutin extracts by direct hydrolysis of tomato peels with an alkaline sodium hydroxide solution. Marc et al., 2021 [21] also produced extracts enriched in cutin monomers from tomato peels by alkaline hydrolysis; however, prior to cutin depolymerization, peels were dewaxed with a mixture of acetone and ethanol.
The polysaccharide pectin was reported to be formulated with cutin to produce films by the casting method to mimic tomato peel [22]. Alternatively, the well-known polysaccharide chitosan is a promising candidate to produce films with cutin. Chitosan has been extensively studied in recent decades. Recently, one of the areas of focus had been the production of films and coatings for the preservation of fresh and processed foods, due to their excellent properties of antimicrobial activity, nontoxicity, biocompatibility, and biodegradability [23,24,25]. It is a derivative of chitin after deacetylation that can be extracted from shrimp shells and other crustaceans. Structurally, it is a linear polysaccharide composed of randomly distributed β-(1→4)-linked d-glucosamine and N-acetyl-d-glucosamine [23,24,25,26].
Pure chitosan films have already been tested in the preservation of various foods, including bananas, carrots, tomatoes, fish, and blueberries, among others. Delay of qualitative and nutraceutical alterations, prevention of the growth of microorganisms, maintenance of antioxidant activity, and extended shelf life were some of the positive effects observed on food when using chitosan-based films [23,24].
This macromolecule not only enables the production of pure films, but it is also a suitable compound to combine with other biopolymers to produce chitosan/biopolymer films. Some of these biopolymers include polysaccharides (e.g., starch, cellulose, pectin, etc.), proteins (e.g., caseinate, collagen, quinoa protein, etc.), and extracts (e.g., beeswax, citrus extract, olive oil, Silybum marianum L. extract, etc.) [23,27,28,29,30].
Considering the overwhelming amount of waste that results from tomato processing every year, the work developed in this study aimed to valorize this raw material through the production and characterization of cutin monomer-enriched extracts. After obtaining monomeric cutin extracts, their applicability in the production of hydrophobic films was studied. Films with cutin were developed together with a polysaccharide, chitosan, in a unique combination of two biopolymers in films not yet reported in the literature. Specifically, the polysaccharide chitosan was selected due to its excellent biocompatibility, biodegradability, film-forming, and antimicrobial properties commonly reported in the literature [23,24,25,30]. Despite all these favorable characteristics for its application in food packaging, chitosan-based films typically have a hydrophilic character, which translates into a decrease in their barrier properties when they are in the presence of water and in humid environments [31,32]. It is expected that the addition of hydrophobic materials such as fatty acids from tomato cutin may improve the moisture barrier properties, thus providing an advantage for these films. They were then characterized in terms of their optical properties, surface morphology, surface hydrophobicity, and barrier properties (against water vapor), envisaging their application in food packaging.
2. Materials and Methods
2.1. Materials
The raw material of the work was tomato pomace (Sumol, Compal, S.A., Almeirim, Portugal).
For the dewaxing of the tomato peels, ethanol (99.9%, Carlo Erba Reagents, Val de Reuil, France) and acetone (≥99.5%, Merck, Darmstadt, Germany) or n-heptane (99.0%, Carlo Erba Reagents, Val de Reuil, France) were used. For cutin depolymerization, NaOH pellets (98–100.5%, Sigma-Aldrich, St. Louis, MI, USA) or KOH pellets (99.99%, Sigma-Aldrich, St. Louis, MI, USA) were used and for the isolation and purification of the cutin monomers, HCl (≥37%, Honeywell, Wien, Austria) was used. For the monomeric cutin extracts’ characterization, methanol, sulfuric acid, and chloroform (HPLC-grade, Sigma-Aldrich, St. Louis, MO, USA) were used.
For the films’ production, chitosan (Golden-Shell Biochemical Co., Ltd., Zhejiang, China), glacial acetic acid (99.8%, Carlo Erba Reagents, Val de Reuil, France), glycerol (≥99.0%, Sigma-Aldrich, Darmstadt, Germany), ethanol (99.9%, Carlo Erba Reagents, Val de Reuil, France), and Tween® 20 (≥40.0%, Sigma-Aldrich, St. Quentin Fallavier, France) were used.
The water used in this work was purified using a Diwer Technologies purification unit.
For the isolation and purification of cutin monomers, as an alternative method to precipitation, filtration with two polyethersulfone PES membranes, Nadir® NP010 P and Nadir® NP030 P (Mann + Hummel Water & Fluid Solutions, Goleta, CA, USA) (Table 1).

Table 1.
Characteristics of the membranes used in this study, according to the manufacturers’ data.
2.2. Determination of the Moisture Content
To determine the moisture content of the tomato pomace, 3 samples of approximately 10 g of pomace were weighed and placed for a total of 120 h (5 days) at 60 °C in an oven (Venticell® 111 Eco line, MMM Group, Planegg, Germany). Samples were taken out from time to time, and after the temperature dropped to room temperature, their weight was registered. When a stabilization of the weight was achieved, i.e., no significant changes in the weight values (inferior to 0.01 g), the moisture content (wet basis)—MCwb—of the samples was determined using Equation (1).
where mhumid refers to the mass of the humid tomato pomace and mdried refers to the mass of the dried material.
2.3. Tomato Pomace Pre-Treatment
Tomato peels were separated from the remaining components of the tomato pomace (pulp, seeds, and fibers) by decantation in a water tank. The floating peels were recovered with a fine metallic mesh to drain off the excess water.
The tomato peels were dried in a hot air oven (Venticell® 111 Eco line, MMM Group, Planegg, Germany) for 48 h at 60 °C. Next, the dried tomato peels were milled into fine flakes using an analytical grinder (A10 basic, Ika, Staufen, Germany) to increase the transfer area between the extracting solvent and the solid material.
2.4. Tomato Peel Monomeric Cutin Extraction and Isolation
Several methods were tested to depolymerize and consequently isolate cutin from the tomato peels. All these methods are summarized in Figure 1.
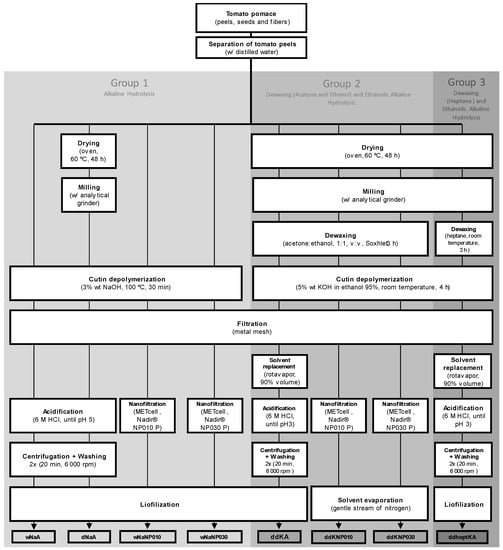
Figure 1.
Flow diagram summarizing all the methods tested in this study to depolymerize and extract cutin. Group 1 Alkaline Hydrolysis: wNaA, wet tomato peels, depolymerization with NaOH, acidification; dNaA, dry tomato peels, depolymerization with NaOH, acidification; wNaNP010, wet tomato peels, depolymerization with NaOH, processed with NP010; wNaNP030, wet tomato peels, depolymerization with NaOH, processed with NP030. Group 2 Dewaxing (Acetone and Ethanol) and Ethanolic Alkaline Hydrolysis: ddKA, dry tomato peels, dewaxing with acetone and ethanol, depolymerization with KOH, acidification; ddKNP010, dry tomato peels, dewaxing with acetone and ethanol, depolymerization with KOH, processed with NP010; ddKNP030, dry tomato peels, dewaxing with acetone and ethanol, depolymerization with KOH, processed with NP030. Group 3 Dewaxing (Heptane) and Ethanolic Alkaline Hydrolysis: ddheptKA, dry tomato peels, dewaxing with heptane, depolymerization with KOH, acidification. Obs: For the sake of simplicity, not all processing steps are described in the legend, particularly: 1—after drying, there is a milling process; 2—after depolymerization, there is a filtration process; 3—after the acidification step, there is centrifugation and washing; 4—the final step is lyophilization, except during the processing sequence of Group 2, where membrane processing is the final step.
2.4.1. Group 1—Alkaline Hydrolysis
Cutin extraction was conducted according to the method proposed by Cigognini et al., 2015 [20], with some modifications. The tomato peels (wet or dried and milled, Figure 1) were mixed with a 3 wt.% NaOH solution (NaOH solution/tomato peels ≈ 4/1, w/w). The mixture was then heated at 100 °C for 30 min, under continuous stirring (300 rpm). To remove spent skins, the mixture was filtered through a fine metallic mesh, and the liquid fraction was collected. Cutin monomers were isolated and purified using one of two different methods-precipitation with an acidic solution or membrane processing (Figure 1). Precipitation of cutin monomers was promoted by adjusting pH to 5 (SensION™+ pH3, Hach, Düsseldorf, Germany) with a 6 M HCl solution. The extract enriched in cutin monomers was then recovered through centrifugation (Frontier™ Centrifuge FC5706, OHAUS, Zürich, Switzerland) of the suspension for 20 min at 6000 rpm, washed twice with Milli-Q water, and centrifuged likewise. Alternatively to precipitation, membrane filtration was performed in a MET® Cell Dead-End filtration system (Evonik Membrane Extraction Technology Ltd., London, UK), under constant pressure (10 bar), using flat sheet membranes (membrane area of 51.4 cm2). During filtration, an electronic balance (Kern 572, KERN, Balingen, Germany) was used to measure the permeate mass. For each filtration, a total of 100 g of liquid extract enriched in cutin monomers was added to the system. The filtration process was conducted at room temperature under continuous stirring (400 rpm). The extracts were processed until a final Volume Reduction Factor VRF (the ratio between the initial feed volume and the retentate volume) of three was reached. Samples resulting from both methods—acidification and membrane processing—were freeze-dried (48 h treatment cycle) and then stored in a cold, dry, and dark environment until further use and/or analyses.
2.4.2. Group 2—Dewaxing (Acetone and Ethanol) and Ethanolic Alkaline Hydrolysis
Cutin extraction was conducted according to the method proposed by Marc et al., 2021 [21], with some modifications. Dried and milled tomato peels were dewaxed under the reflux of acetone:ethanol 1:1 (v/v) in a Soxhlet extractor. The mass ratio of the extracting medium to the dried and milled tomato peels was 23:1, and the time of extraction was 3 h. Dewaxed tomato peels were dried overnight in a fume hood. For cutin depolymerization, the dewaxed tomato peels were mixed with 5 wt.% KOH in ethanol 95% (KOH in ethanol solution/tomato peels ≈ 17/1, w/w). The depolymerization was performed at room temperature, with constant stirring at 300 rpm for 4 h. To remove spent skins, the mixture was filtered through a fine metallic mesh, and the liquid fraction was collected. For three methods, one from Group 2 and two from Group 3 (see Figure 1), about 90% of the filtrate’s volume was evaporated under vacuum in a rotary evaporator (R-210, Buchi®, Flawil, Switzerland) at 35 °C and under reduced pressure (33 mbar). The volume that evaporated was replaced by water. As in Group 1, isolation and purification of cutin monomers were achieved with precipitation with an acidic solution or membrane processing. Precipitation of cutin was promoted by adjusting pH at 3.5 (SensION™+ pH3, Hach, Düsseldorf, Germany) with a 6 M HCl solution. Cutin was then recovered through centrifugation of the suspension for 20 min at 6000 rpm, washed twice with Milli-Q water, and centrifuged likewise. The membrane processing protocol was the same as for the methods in Group 1. Samples resulting from both methods—acidification and membrane processing—were freeze-dried (48 h treatment cycle) and then stored in a cold, dry, and dark environment until further use and/or analyses.
2.4.3. Group 3—Dewaxing (Heptane) and Ethanolic Alkaline Hydrolysis
The cutin depolymerization methods of Group 3 are very similar to those of Group 2, as can be seen in Figure 1, except for the dewaxing step. In Group 3, the dried and milled tomato peels were dewaxed with heptane. For one of the methods, the dewaxing was performed at room temperature with constant stirring at 300 rpm for 3 h. For the other, dried and milled tomato peels were dewaxed under reflux in a Soxhlet extractor. The mass ratio of the extracting medium to the dried and milled tomato peels was 23:1, and the time of extraction was 3 h. Dewaxed tomato peels were dried overnight in a fume hood. Depolymerization was performed exactly as in Group 2 methods, as was the isolation and purification of cutin monomers through precipitation with an acidic solution. No membrane processing was performed in this group of methods. The resulting samples were freeze-dried (48 h treatment cycle) and then stored in a cold, dry, and dark environment until further use and/or analyses.
2.5. Characterization of the Monomeric Cutin Extracts (GC-FID)
The fatty acid content of the cutin monomer-enriched extracts was determined by GC-FID analysis. A first digestion step was performed following the method described by Lanham et al., 2013 [33], with some modifications. Briefly, 2–4 mg of each cutin lyophilized extract was incubated for methanolysis at 100 °C for 3.5 h with 1 mL of acidic methanol (20% sulfuric acid) and 1 mL of chloroform that contained nonadecanoic acid (1 g/L) as an internal standard (≥98%, Sigma-Aldrich, Darmstadt, Germany). After cooling, to separate the organic from the inorganic phase, 1 mL of Milli-Q water was added, and the mixture was vortexed for 1 min. The lower phases (organic phases) were extracted into 2 mL vials with molecular sieves to remove traces of water. After the digestion step, the organic phase (methylated monomers dissolved in chloroform) of each sample was extracted and injected into a gas chromatograph coupled to a Flame Ionization Detector (GC-FID 6890, Agilent Technologies, Inc., Santa Clara, CA, USA, and GC Autosampler HT3100A, HTA, Brescia, Italy). An OPTIMA 240 column (60 m, 0.25 mm ID, and 0.25 µm film) (Macherey-Nagel, Duren, Germany) was used at a flow rate of 1.5 mL/min. The mobile phase used was 33% cyanopropylmethyl–67% dimethy polysiloxane. The oven temperature program was as follows: 80 °C; then 20 °C/min until 120 °C; and finally, 3 °C/min until 260 °C. The detector temperature was set at 280 °C. Palmitic acid (≥99%), stearic acid (≥98.5%), oleic acid (≥99%), linoleic acid (≥99%), 16-hydroxyhexadecanoic acid (98%), hexadecanedioic acid (98%), and octadecanedioic acid (98%) concentrations were determined using commercial (Sigma-Aldrich, Darmstadt, Germany) external standards (concentration range of 0.03125–1 g/L) and corrected using a nonadecanoic acid as internal standard.
2.6. Determination of the Extraction Yields
The extraction yield was calculated for each of the monomeric cutin extracts using Equation (2).
In this equation, mfreeze-dried extract refers to the mass of the freeze-dried monomeric cutin extract, and mdried tomato peels refers to the mass of the dried tomato peels from which the cutin has been extracted.
2.7. Preparation of Chitosan Solutions and Cutin Suspensions
The chitosan film-forming solution was prepared as described by Ferreira et al., 2016 [34], with certain modifications. Chitosan was dissolved in a glacial acetic acid solution (1% w/w) at a concentration of 1.5% w/w and left stirring overnight at room temperature. Glycerol (25% wglycerol/wchitosan) was added to the solution, followed by another 20 min of stirring for complete homogenization.
The monomeric cutin suspensions were prepared as previously described by Tedeschi et al., 2018 [15], with a few modifications. The two monomeric cutin extracts, with the highest mass percentage of total fatty acid per mass of freeze-dried extract, were added to a mixture of Milli-Q water and ethanol (1:1, v/v), at a concentration of 0.5% w/w. Tween® 20 (25% wTween/wcutin) was added, and the mixtures were dispersed by successive ultrasound cycles using a 6 mm diameter tapered microtip attached to a VCX750 ultrasonic processor (Sonics and Materials, Inc., Newtown, CT, USA).
2.7.1. Preparation of the Chitosan Films (Control)
For the chitosan film (control), 10 g of the chitosan solution was cast onto a 50 mm diameter PFA (perfluoroalkoxy) evaporating dish (Bohlender, Grünsfeld, Germany) and dried overnight at 40 °C in an oven (Venticell® 111 Eco line, MMM Group, Planegg, Germany). After being peeled from the dish, the film was stored and sealed in a glass petri dish and left in a desiccator at room temperature.
2.7.2. Preparation of Cutin and Chitosan Blend Films
For the cutin and chitosan blend films, the monomeric cutin suspension was added to the chitosan solution (monomeric cutin suspension/chitosan solution ≈ 1/2, w/w), and the mixture was stirred for 20 min at room temperature until total homogenization. A mass of 15 g of the cutin and chitosan solution was cast onto the PFA evaporating dish (Bohlender, Grünsfeld, Germany). These were then left to dry overnight in a 40 °C oven (Venticell® 111 Eco line, MMM Group, Planegg, Germany). After being peeled from the PFA evaporating dishes, the films were stored and sealed in glass Petri dishes and left in a desiccator at room temperature.
All films produced are listed in Table 2, along with the strategy used, composition of the chitosan solution and the cutin monomer suspension, and ultrasonic dispersion program.
Table 2.
Chitosan solution and cutin suspensions used to produce cutin and chitosan blend films.
2.8. Film Characterization
Before any of the following characterization procedures, the films were previously equilibrated at a relative humidity of 50.5% RH.
2.8.1. Scanning Electron Microscopy (SEM)
The film’s surface morphology was analyzed by scanning electron microscopy (SEM). Samples were placed on aluminum stubs using double-sided carbon tape and were sputter-coated with a thin Au/Pd film with a Quorum Technologies coater (Q150T ES, E Hong Instruments Co., Ltd., Taipei, Taiwan). They were then analyzed with a Thermo Fischer Scientific (Waltham, MA, USA) desktop scanning electron microscope (Phenom ProX G6) equipped with an energy dispersive spectroscopy (EDS) light element.
2.8.2. Thickness
The thickness of the films was measured with a digital micrometer (Filetta, Schut Geometrical Metrology, Groningen, The Netherlands). Measurements were made in three different places on the films.
2.8.3. Color Measurements
To assess the films in terms of color, the CIELAB (or CIE L* a* b*) color system was used [35]. In this system, the parameter L* measures lightness, and its values range from 0 (black) to 100 (white). Parameters a* and b* measure the green/red and the blue/yellow color components, respectively. Negative values of a* (−a*) correspond to green, and positive values (+a*) correspond to red. The same happens for the coordinate b*; negative values of b* (−b*) correspond to blue, and positive values (+b*) correspond to yellow.
A digital colorimeter (Chroma Meter CR-400, Konica Minolta, Tokyo, Japan) was used to obtain the values of these three parameters (L*, a*, and b*) for each of the films. Five measurements of different areas of the films were performed after calibration of the colorimeter against a white calibration plate, where L* = 94.52, a* = −0.58, and b* = 3.79.
By obtaining these values, two other parameters were calculated—the hue (h°), which refers to the absorbance or reflection of specific wavelengths of light, and the chroma (C*), which indicates the saturation of color.
The h° was calculated using Equations (3), (4), or (5):
The C* was calculated using Equation (6):
The color difference () was calculated (Equation (7)) in order to compare the color between each of the cutin and chitosan film samples and the control film sample (chitosan film).
If >1 the color difference between the samples should be observable by the human eye [35].
2.8.4. Water Contact Angle (WCA)
Water drop contact angles with the film surfaces were measured in order to access the film surface hydrophobicity. Measurements were performed with the Drop Shape Analyser—DSA25 (Krüss, Hamburg, Germany), using the Sessile Drop method. A 3 µL drop of distilled water was dropped onto the upper surface of previously cut squares of the film (1 cm × 1 cm). All measurements were performed at room temperature. Image analysis software Advance (Krüss) was used to calculate the contact angles of the drops, and the resulting values were given by the average on both sides of the drops. For each film type, three replicates were collected.
2.8.5. Water Vapor Permeability (WVP)
The water vapor permeability (WVP) of the films was determined gravimetrically following the method used by Ferreira et al., 2016 [34], with slight modifications. Triplicates of flat circular film samples were sealed over cylindrical glass permeation cells with aluminum tape. The cylindrical glass cells (inner diameter = 40 mm) were previously filled with 9 mL of a saturated NaCl solution (aw = 0.755).
After this, each of the permeation sets (one permeation set = cylindrical glass cell + NaCl solution + film sample + aluminum tape) was quickly weighed. Then all the sets were put in a desiccator containing a saturated MgCl2 solution (aw = 0.328) and equipped with a fan to promote air circulation. The permeation sets were weighed at regular intervals for eight hours. During this time, the temperature and relative humidity inside the desiccator were measured with a thermohygrometer (Humicap® HM40, Vaisala, Helsinki, Finland).
The WVP was calculated using Equation (8):
In this Equation, Nw (mol/m2·s) is the water vapor flux, δ (m) is the film thickness, and ∆Pw.eff (Pa) is the effective driving force, which was estimated according to the method used by Alves et al., 2010 [36].
3. Results
3.1. Moisture Content of Tomato Pomace and of Dry Matter Content of Its Fractions
The tomato pomace used in this study showed a high moisture content of 84.07 ± 0.42% (wet basis-w.b.). Similar or even higher moisture values were observed in other studies. Bhat and Ahsan, 2018 [37] reported a moisture content value of tomato pomace of 87.63 ± 0.12% (w/w), and Lavelli and Torresani, 2011 [11] obtained a moisture content value of 90.0 ± 0.2% (w/w).
The dry matter content of each fraction of tomato pomace, peels, seeds, and fibers was calculated (Table 3). Peels were the main fraction, followed by seeds and fibers.
Table 3.
Peel, seed, and fiber ratio values determined for the batch of tomato pomace used in the present work. Results are given as % (wdried component/wdried tomato pomace).
In this study, the fraction with the highest content in dried matter was the peel fraction, which is in line with the results reported [12,38,39].
3.2. Tomato Monomeric Cutin Extracts
The extraction yield value was calculated for each of the monomer-enriched cutin extracts produced (Table 4).
Table 4.
Extraction yields of monomeric cutin from tomato peels. Results are given as % (wfreeze-dried extract/wdried tomato peels). Group 1 Alkaline Hydrolysis: wNaA, wet tomato peels, depolymerization with NaOH, acidification; dNaA, dry tomato peels, depolymerization with NaOH, acidification; wNaNP010 wet tomato peels, depolymerization with NaOH, processed with NP010; wNaNP030, wet tomato peels, depolymerization with NaOH, processed with NP030. Group 2 Dewaxing (Acetone and Ethanol) and Ethanolic Alkaline Hydrolysis: ddKA, dry tomato peels, dewaxing with acetone and ethanol, de-polymerization with KOH, acidification; ddKNP010, dry tomato peels, dewaxing with acetone and ethanol, depolymerization with KOH, processed with NP010; ddKNP030, dry tomato peels, dewaxing with acetone and ethanol, depolymerization with KOH, processed with NP030. Group 3 Dewaxing (Heptane) and Ethanolic Alkaline Hydrolysis: ddheptdKA, dry tomato peels, dewaxing with heptane, depolymerization with KOH, acidification.
The cutin extraction methods investigated showed significant differences in terms of extraction yield.
By comparing the extraction yield values of samples obtained with NaOH hydrolysis with different moisture contenst, wet or dried (wNaA and dNaA), one can infer that the sample in which tomato peels were dried and milled prior to cutin depolymerization (sample dNaA) had the highest yield. This may suggest that the efficiency of the depolymerization reaction is influenced by the moisture content of the material soon to be hydrolyzed and the surface area between the solvent and the solid material.
The effect of cutin isolation methods, particularly membrane processing and acidification for cutin precipitation, was also studied. Within Group 1, the samples with the same initial moisture content (wet tomato peels), the same depolymerization method (with NaOH), and processed by membranes, the samples wNaNP010 and wNaNP030, exhibited a higher cutin extraction yield when compared to the sample processed by acidification (wNaA). Within Group 2, the samples with the same initial moisture content (dry tomato peels), the same dewaxing method (acetone and ethanol), the same depolymerization method (with KOH), and processed by membranes, the samples ddKNP010 and ddKNP030, exhibited a higher cutin extraction yield when compared to the sample processed by acidification (sample ddKA).
The sample dewaxed with heptane at room temperature (ddheptKA from Group 3) had a slightly higher cutin yield extraction value than that obtained for the sample from KOH hydrolysis (ddKA from Group 2).
Cigognini et al., 2015 [20] reported a 15% (w/w) yield value using NaOH hydrolysis, the method used in this work to produce sample wNaA, for which a lower value of 6.74% (w/w) was obtained. This difference may be due to either the time or the temperature values chosen for the depolymerization reaction, or more likely both. In this work, the reaction was run for 30 min at 100 °C, while the authors let the reaction run for 2 h without specifying the temperature used, giving only a range.
The extraction yield value of the sample using KOH hydrolysis (ddKA) was 21.11% (w/w), significantly lower than the 60% (w/w) obtained by Marc et al., 2021 [21]. However, this difference can be directly related to the reaction time of the depolymerization step. While Marc et al., 2021 [21] left the reaction running for 24 h, in this study only the effect of 4 h of depolymerization was studied.
Despite this, ethanolic alkaline hydrolysis at room temperature (ddKA) led to a higher extraction yield of monomeric cutin extract (21.11% w/w) than that for aqueous alkaline hydrolysis at 100 °C (samples wNaA and dNaA), 6.74 and 16.46% (w/w), respectively, which may be a very interesting finding in terms of process sustainability.
3.3. Fatty Acid Composition
The results of the fatty acid composition of the monomeric cutin extracts investigated by GC-FID, are presented in Table 5 (results given as % (wfatty acid/wtotal selected fatty acids)) and Table 6 (results given as % (wfatty acid/wfreeze-dried extract)).
Table 5.
GC-FID analysis of the constituents identified in cutin samples. Results are given as % (wfatty acid/wtotal selected fatty acids).
Table 6.
GC-FID analysis of the constituents identified in cutin samples. Results are given as % (wfatty acid/wfreeze-dried extract).
Considering the results presented in Table 5, the major fatty acid identified was 16-hydroxyhexadecanoic acid, with the highest percentage (wfatty acid/wtotal selected fatty acids) in seven out of the eight samples analyzed, ranging from 62.05% in the sample obtained from KOH hydrolysis and acidification (ddKA) to 8.07% in the sample obtained from NaOH hydrolysis of dried tomato peels and acidification (dNaA). Followed by hexadecanedioic acid, the second major fatty acid in six out of the eight samples, with a range of values from 17.54% (sample wNaA) to 10.51% (sample ddKA). Stearic, linoleic, palmitic, and octadecanedioic acids have also been identified, although in smaller amounts than the previous fatty acids. The component with the lowest percentage (wfatty acid/wtotal selected fatty acids) in seven out of the eight samples analyzed was oleic acid, ranging from 10.71% in sample dNaA to 2.82% in sample ddKA.
On a more thorough level, when analyzing samples that are within the same group, there are also some observations that can be drawn. When comparing samples wNaA and dNaA (Group 1), whose difference in the extraction method is based on the use of humid tomato peels (sample wNaA) or dried and milled tomato peels (sample dNaA), it is evident that there are differences in the fatty acid profiles of the two samples. Although the second major component, hexadecanedioic acid, was the same for both samples, representing 17.54% of the total fatty acids investigated in sample wNaA and 15.41% in sample dNaA, that was not the case for the most predominant compound. The major fatty acid identified in sample wNaA was 16-hydroxyhexadecanoic with a total percentage of 23.66%. In sample dNaA, on the other hand, it was palmitic acid, representing 31.04% of total fatty acids.
Therefore, it is possible that the drying and milling pre-treatment of tomato peels may influences the final fatty acid profile in the sense that the existence of this pre-treatment may contribute to more or less complete depolymerization of cutin.
In addition, within Group 1, for samples resulting from hydrolysis with NaOH and processed by membranes (wNaNP010 and wNaNP030), very similar fatty acid profiles were obtained. It should be noted that the only difference between the extraction methods that originated the two samples was the use of a membrane with a smaller pore size in the case of sample wNaNP030 (MWCO of 500–1000 Da), and a larger pore size in the case of sample wNaNP010 (MWCO of 1000–1500 Da). This may indicate that the membrane processing step was not efficient in isolating the cutin monomers. Combining the cutin extraction yield values (Table 4) with the fatty acid profiles further supports this hypothesis. Samples wNaNP010 and wNaNP030 have extraction yields of 38.83 and 28.48% (wfreeze-dried extract/wdried residue), respectively, while sample wNaA has a yield value of 6.74%. However, samples wNaNP010 and wNaNP030 do not show a higher weight percentage of fatty acids per weight of freeze-dried extract (Table 6). Thus, this supports what was previously indicated in the previous section, suggesting that the membrane processing step was not more efficient when compared to the alternative method of cutin monomer isolation-precipitation with an acidic solution (sample wNaA).
It can also be observed with samples from Group 2. The samples dKNP010 and dKNP030 had extraction yield values that were four times higher than those of ddKA. However, these values do not translate into higher values of fatty acid concentration.
These results are in agreement with those reported in other studies [5,16,18], in the sense that the presence of many of the same compounds was detected in the extracts produced, namely 16-hydroxyhexadecanoic acid, linoleic acid, oleic acid, palmitic acid, etc.
The samples selected for the study of the cutin-based film production were the samples dNaA (Group 1) and ddKA (Group 2) because these samples had the highest mass percentage of total fatty acid per mass of freeze-dried extract.
3.4. Cutin and Chitosan Films
All films were produced by the casting method and are shown in Table 7.
Table 7.
Composition of film-forming solution and visual appearance of the films produced in this work.
Film sample (1) resulted from the casting of a solution of chitosan dissolved in acetic acid (1.5% w/w), which contained glycerol as a plasticizer.
Film samples (2) and (3) were produced by drying a blend of a 1.5% w/w chitosan solution with a suspension of cutin monomers—monomeric cutin extract ddKA or dNaA—in water and ethanol and containing the dispersing agent Tween® 20.
After being removed from the oven, where the films dried at 40 °C overnight, all films were easily peeled from the PFA evaporating dishes.
Of the chitosan films produced (Table 7), film sample (1) had smooth, uniform, and homogeneous surfaces. These films were flexible, very easy to handle, and visually appeared to be transparent with a slightly yellowish coloration.
Of the cutin and chitosan films (Table 7), film samples (2) and (3) displayed a dark yellow/orange color as a result of adding the cutin extracts (Table 4) to the solution. These blended films (2) and (3) were malleable and intact. Even so, when comparing both, film (2) had the smoothest, most uniform, and most homogeneous surface detectable to the naked eye. It is very likely that these observable differences in the two film samples are due to the monomeric cutin extracts that each of these films has in their composition. Differences between the two cutin extraction methods that originated dNaA and ddKA extracts, such as the existence of a dewaxing step and the type of alkaline solution and temperature at which the depolymerization of the cutin occurred, most likely contributed to the formation of different monomeric cutin extracts and, consequently, resulted in films with different appearances.
3.4.1. Film Morphology
The film’s surface morphology, analyzed by scanning electron microscopy (SEM), is shown in Table 8.
Table 8.
SEM images of the surfaces of all the film samples.
The images acquired by SEM corroborate what was observed with the naked eye (Section 3.4), namely that the chitosan control film (Table 8, images A1 and A2) exhibits a smooth, uniform surface with no visible cracks. This morphology is consistent with that usually obtained for other chitosan films [34]. In comparison to the chitosan control film (Table 8, images A1 and A2), the cutin and chitosan films (2) and (3) (Table 8, images B1, B2, C1, and C2) show a more irregular structure. This characteristic can possibly be attributed to some aggregates of cutin monomers that were not completely dissolved. This was to be expected in the case of film (3), since the cutin suspension was not completely homogeneous.
3.4.2. Thickness
The thickness values of the films are listed in Table 9.
Table 9.
Thickness (mm) of the selected film samples.
The chitosan film (control)—film sample (1)—presented the lowest thickness value, being the thinnest film produced in this work, with an average thickness of 0.092 ± 0.008 mm. Cutin and chitosan film samples (2) and (3) showed slightly higher thickness values, respectively, of 0.103 ± 0.004 and 0.106 ± 0.005 mm.
These results were as expected since the cutin and chitosan films were produced with the same mass of chitosan film-forming solution as the control film, i.e., 10 g of chitosan filmogenic solution. Therefore, the difference in thickness between these films and the control should be mostly due to the non-volatile matter of the monomeric cutin suspensions added. Additionally, it was also anticipated that the thickness value of film sample (2) would be very close to that of film sample (3) since the only difference in the composition of the two films is the depolymerized cutin extract used. For the production of film sample (2), the monomeric cutin extract used was ddKA, and for film sample (3), was dNaA.
3.4.3. Color
The exact colors of the films were determined according to the CIELAB color system.
The measured (L*, a*, and b*) and the calculated (h° and C*) color parameters are summarized in Table 10.
Table 10.
Measured color parameter values: lightness (L*), chromaticity coordinates (a* and b*), and calculated hue (h°) and chroma (C*) of the selected film samples.
For the chitosan control film sample (1), a very high lightness (L*) value was obtained (92.72). This value was very close to 100 (white) and, therefore, very far from 0 (black), indicating that the film had a very light shade. As for the a* and b* coordinates, this film presented a negative a* value (−1.99) and a positive b* value (10.50), resulting in a h° value of 100.72 and a C* value of 10.68. These values confirm what was observed with the naked eye, i.e., that the films had a yellowish tone with a low color saturation.
These color results for the chitosan-based films match those produced by Leceta et al., 2013 [25], especially the films produced with low molecular weight (LMw) chitosan and 30% wglycerol/wchitosan.
The color parameters of the cutin and chitosan film samples (2) and (3) varied, as expected, from the chitosan control film. Both samples, (2) and (3), had lower L* values, which is consistent with the film’s darker colors observed visually. Unlike the control film, these two samples showed positive values of the a* coordinate, which indicates a color transition from green to red tones. This was completely expected given that orange/red extracts of depolymerized cutin were added to the chitosan film-forming solutions for the production of these films. On the other hand, the control film and the samples both revealed positive b* coordinates, but significantly higher values in the cutin and chitosan samples, indicating that these films have a more intense yellow color component. These differences in a* and b* coordinate values resulted in lower h° values for samples (2) and (3). Finally, higher chroma (C*) values were obtained for the cutin and chitosan film samples, mirroring the increase in color saturation that could be observed when comparing these to the control film.
By obtaining these color parameters, in particular the a* and b* chromaticity coordinates, it was possible to determine the approximate color position of these films in the CIELAB hue circle (Figure 2).
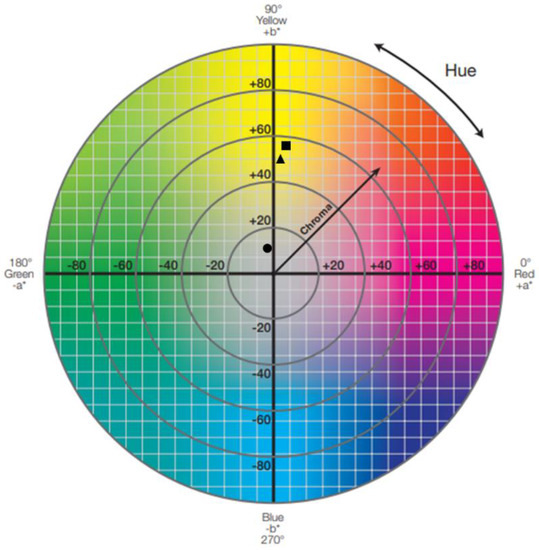
Figure 2.
Graphic representation of the color of the three films, (1), (2), and (3), in the CIELAB hue circle (adapted from [40]). Legend: ●—film sample (1): 1.5% chitosan (control); ■—film sample (2): 1.5% chitosan + 0.5% cutin ddKA + Tween® 20; ▲—film sample (3): 1.5% chitosan + 0.5% cutin dNaA + Tween® 20.
As expected, the position of the chitosan control film is in the second quadrant of the graph, a quadrant that ranges from yellow to green, while the two cutin and chitosan films are in the first quadrant, which ranges from red to yellow.
To thoroughly evaluate how the incorporation of the depolymerized cutin suspension changed the color of the cutin and chitosan films compared to the chitosan control film and to what extent this change is detectable to the human eye, the color difference (∆E*ab) between the films was calculated (Table 11).
Table 11.
Color difference () values between the chitosan film sample (1) and the two selected cutin and chitosan film samples (2) and (3).
The values obtained were well above one, more precisely 50.07 for film sample (2) and 42.60 for film sample (3). This confirms a significant variation in the colors of the cutin and chitosan films compared to the chitosan film and that this can be clearly perceived by the human eye.
3.4.4. Water Contact Angle
In order to assess the surface hydrophobicity of the produced films, the static contact angles between a water droplet and the upper surface of each of the films were measured (Table 12).
Table 12.
Static water contact angle values (θ, °) of the film samples.
The measurements were performed on the upper surface of the films, so the data shown above has no influence on the flat PFA evaporating dish surface where the films were dried. The measurement of the contact angle with a solvent is a way to evaluate the affinity between that solvent and the surface of the material being tested.
Leceta et al., 2013 [25] reported a water contact angle result similar to that obtained for the control film of this study, reaching a value between 90 and 95° for low molecular weight (LMw) chitosan and 30% wglycerol/wchitosan films.
The results gathered in Table 12 suggest that all the samples revealed similar static water contact angle values for both the control and the cutin and chitosan films. Since high contact angles are characteristic of hydrophobic surfaces, these results suggest that the films produced have a hydrophobic character, even though the incorporation of cutin did not produce a significant increase in the water contact angle of the films, as one might expect.
3.4.5. Water Vapor Permeability
The water vapor permeability (WVP) results for chitosan (control) and cutin and chitosan blend films for a driving force of 75.5–32.8% RH (relative humidity) are presented in Table 13.
Table 13.
Water Vapor Permeability values of the selected film samples.
The WVP parameter is a very important parameter, especially if these films are to be used for food packaging. However, it is also a very challenging parameter to compare, since the WVP is highly dependent on a number of factors, including film thickness, the driving force used in the assay, the concentration and type of plasticizer used, other additives added, the molecular weight of the polymer, etc. [34].
The chitosan film (control) presented a WVP value of (5.33 ± 1.66) × 10−11 (mol·m/m2sPa), which was higher than the 4.13 ± 0.13 × 10⁻¹¹ (mol·m/m2sPa) value reported by Ferreira et al., 2016 [34] for a film with 1.5% (w/w) chitosan, 30% wglycerol/wchitosan and 50% wcitric acid/wchitosan and a driving force of 76.9–22.5% RH.
The cutin and chitosan film samples (2) and (3) obtained the lowest values of WVP, of 3.84 0.39 × 10⁻¹¹ and 4.91 1.33 × 10⁻¹¹ (mol·m/m2sPa), respectively.
Tedeschi et al., 2018 [15] reported an improvement in the barrier properties, including WVP, of films composed of sodium alginate, fatty acids from tomato pomace, and beeswax. The authors observed a decrease in the WVP parameter with the proportion of tomato pomace monomers, attributing this result to the hydrophobic nature of the polyhydroxylated and unsaturated long-chain fatty acids of tomato pomace.
The results obtained for film samples (2) and (3) match those obtained by Tedeschi et al., 2018 [15], despite the fact that the WVP value obtained for film sample (3) is only slightly lower than that obtained for control film (1), which may be related to the lower uniformity and homogeneity of this film when compared to film (2) as previously observed (Section 3.4.1).
4. Conclusions
The massive increase in food processing waste and the urgent need to replace conventional plastics in packaging applications are major problems of the present time. This work contributed to the development of an alternative involving biodegradable materials based on cutin and to replace conventional plastics for packaging.
Tomato pomace, a waste product from the tomato processing industry, was characterized regarding its moisture content (84.07 ± 0.42% w/w) and its fractional composition (63.62 ± 1.85% peel, 34.59 ± 2.51% seed, and 1.80 ± 0.73% fiber, w/w).
Several methods for extracting and depolymerizing cutin, a biopolymer of the tomato cuticle, were explored. Methods included common processes, affordable chemicals, such as aqueous solutions of NaOH, KOH, and HCl, and membrane processing.
Monomeric extracts of cutin were successfully obtained and confirmed to be enriched in several fatty acids, including 16-hydroxyhexadecanoic acid, hexadecanedioic acid, stearic acid, and linoleic acid, among others.
Cutin and chitosan-based films were prepared from the extracts of recovered tomato cutin monomers and commercial chitosan by casting and drying at 40 °C. Cutin and chitosan blend films were malleable, homogeneous, hydrophobic (water contact angle values higher than 90°), and had high water vapor permeability.
The hydrophobic films produced in the course of this study undoubtedly show great potential, even though some improvements are needed before starting to replace food packaging made from petroleum-based polymers. In addition, they may provide an application for tomato processing waste, making the process of tomato production and processing more profitable and sustainable.
This study was mainly focused on the optimization of the cutin extraction process, ending with a preliminary characterization of cutin and chitosan-based films. In future work, a deeper study will be carried out to thoroughly characterize the films in terms of their mechanical properties, barrier properties to gases, and antimicrobial activity.
Author Contributions
Conceptualization: A.S., C.B., I.M.C. and V.D.A.; methodology: A.S., C.B., I.M.C. and V.D.A.; investigation: A.S., C.B., I.M.C. and V.D.A.; resources: C.B., I.M.C. and V.D.A.; data curation, A.S.; writing—original draft preparation: A.S.; writing—review and editing: A.S., C.B., I.M.C. and V.D.A.; supervision: C.B., I.M.C. and V.D.A.; project administration, C.B.; funding acquisition: C.B., I.M.C. and V.D.A. All authors have read and agreed to the published version of the manuscript.
Funding
This research was supported by the Associate Laboratory for Green Chemistry—LAQV and LEAF—Linking Landscape, Environment, Agriculture, and Food research units, which are financed by national funds from FCT/MCTES (UIDB/50006/2020, UIDP/50006/2020, and UID/AGR/04129/2020). This research was also funded by Sociedade Ponto Verde—Sociedade Gestora de Resíduos de Embalagens, S.A., through the project entitled “Bioplastics and Edible, Vegan Films”.
Institutional Review Board Statement
Not applicable.
Informed Consent Statement
Not applicable.
Data Availability Statement
Not applicable.
Acknowledgments
The company Sumol and Compal, S.A., is acknowledged for kindly providing the tomato pomace for this work.
Conflicts of Interest
The authors declare no conflict of interest.
References
- FAO. Mitigation of Food Waste: Societal Costs and Benefits; FAO: Rome, Italy, 2014; ISBN 978-92-5-108511-0. [Google Scholar]
- Clark, J.H.; Luque, R.; Matharu, A.S. Green Chemistry, Biofuels, and Biorefinery. Annu. Rev. Chem. Biomol. Eng. 2012, 3, 183–207. [Google Scholar] [CrossRef] [PubMed]
- Joshi, V.K.; Kumar, A.; Kumar, V. Antimicrobial, Antioxidant and Phyto-Chemicals from Fruit and Vegetable Wastes: A Review. Intl. J. Food. Ferment. Technol. 2012, 2, 123–136. [Google Scholar]
- Sharma, M.; Usmani, Z.; Gupta, V.K.; Bhat, R. Valorization of Fruits and Vegetable Wastes and By-Products to Produce Natural Pigments. Crit. Rev. Biotechnol. 2021, 41, 535–563. [Google Scholar] [CrossRef] [PubMed]
- Benítez, J.J.; Castillo, P.M.; del Río, J.C.; León-Camacho, M.; Domínguez, E.; Heredia, A.; Guzmán-Puyol, S.; Athanassiou, A.; Heredia-Guerrero, J.A. Valorization of Tomato Processing By-Products: Fatty Acid Extraction and Production of Bio-Based Materials. Materials 2018, 11, 2211. [Google Scholar] [CrossRef] [PubMed]
- Food and Agriculture Organization of the United Nations. FAO Statistical Databases Online. Available online: http://apps.fao.org/ (accessed on 11 January 2022).
- Kakabouki, I.; Folina, A.; Efthimiadou, A.; Karydogianni, S.; Zisi, C.; Kouneli, V.; Kapsalis, N.C.; Katsenios, N.; Travlos, I. Evaluation of Processing Tomato Pomace after Composting on Soil Properties, Yield, and Quality of Processing Tomato in Greece. Agronomy 2021, 11, 88. [Google Scholar] [CrossRef]
- Ventura, M.R.; Pieltain, M.C.; Castanon, J.I.R. Evaluation of Tomato Crop By-Products as Feed for Goats. Anim. Feed Sci. Technol. 2009, 154, 271–275. [Google Scholar] [CrossRef]
- Yuangklang, C.; Vasupen, K.; Wongsuthavas, S.; Panyakaew, P.; Alhaidary, A.; Mohamed, H.E.; Beynen, A.C. Growth Performance in Beef Cattle Fed Rations Containing Dried Tomato Pomace. J. Anim. Vet. Adv. 2010, 9, 2261–2264. [Google Scholar] [CrossRef]
- Lu, Z.; Wang, J.; Gao, R.; Ye, F.; Zhao, G. Sustainable Valorisation of Tomato Pomace: A Comprehensive Review. Trends Food Sci. Technol. 2019, 86, 172–187. [Google Scholar] [CrossRef]
- Lavelli, V.; Torresani, M.C. Modelling the Stability of Lycopene-Rich by-Products of Tomato Processing. Food Chem. 2011, 125, 529–535. [Google Scholar] [CrossRef]
- Costa, A.; Marques, M.; Congiu, F.; Paiva, A.; Simões, P.; Ferreira, A.; Bronze, M.R.; Marto, J.; Ribeiro, H.M.; Simões, S. Evaluating the Presence of Lycopene-Enriched Extracts from Tomato on Topical Emulsions: Physico-Chemical Characterization and Sensory Analysis. Appl. Sci. 2021, 11, 5120. [Google Scholar] [CrossRef]
- Ali, M.Y.; Sina, A.A.I.; Khandker, S.S.; Neesa, L.; Tanvir, E.M.; Kabir, A.; Khalil, M.I.; Gan, S.H. Nutritional Composition and Bioactive Compounds in Tomatoes and Their Impact on Human Health and Disease: A Review. Foods 2021, 10, 45. [Google Scholar] [CrossRef] [PubMed]
- Heredia-Guerrero, J.A.; Heredia, A.; Domínguez, E.; Cingolani, R.; Bayer, I.S.; Athanassiou, A.; Benítez, J.J. Cutin from Agro-Waste as a Raw Material for the Production of Bioplastics. J. Exp. Bot. 2017, 68, 5401–5410. [Google Scholar] [CrossRef] [PubMed]
- Tedeschi, G.; Benitez, J.J.; Ceseracciu, L.; Dastmalchi, K.; Itin, B.; Stark, R.E.; Heredia, A.; Athanassiou, A.; Heredia-Guerrero, J.A. Sustainable Fabrication of Plant Cuticle-Like Packaging Films from Tomato Pomace Agro-Waste, Beeswax, and Alginate. ACS Sustain. Chem. Eng. 2018, 6, 14955–14966. [Google Scholar] [CrossRef]
- Cifarelli, A.; Cigognini, I.M.; Bolzoni, L.; Montanari, A. Physical-Chemical Characteristics of Cutin Separated from Tomato Waste for the Preparation of Bio-Lacquers. Adv. Sci. Eng. 2019, 11, 33–45. [Google Scholar] [CrossRef]
- Heredia, A. Biophysical and Biochemical Characteristics of Cutin, a Plant Barrier Biopolymer. Biochim. Biophys. Acta—Gen. Subj. 2003, 1620, 1–7. [Google Scholar] [CrossRef]
- Moreira, C.J.S.; Bento, A.; Pais, J.; Petit, J.; Escórcio, R.; Correia, V.G.; Pinheiro, Â.; Halinski, Ł.P.; Mykhaylyk, O.O.; Rothan, C.; et al. An Ionic Liquid Extraction That Preserves the Molecular Structure of Cutin Shown by Nuclear Magnetic Resonance. Plant Physiol. 2020, 184, 592–606. [Google Scholar] [CrossRef]
- Guzmán-Puyol, S.; Heredia, A.; Heredia-Guerrero, J.A.; Benítez, J.J. Cutin-Inspired Polymers and Plant Cuticle-like Composites as Sustainable Food Packaging Materials. In Sustainable Food Packaging Technology; Athanassiou, A., Ed.; Wiley: Hoboken, NJ, USA, 2021; pp. 161–198. [Google Scholar] [CrossRef]
- Cigognini, I.; Montanari, A.; De La Torre Carreras, R. Extraction Method of a Polyester Polymer or Cutin from the Wasted Tomato Peels and Polyester Polimer so Extracted. WO2015028299A1, 5 March 2015. [Google Scholar]
- Marc, M.; Risani, R.; Desnoes, E.; Falourd, X.; Pontoire, B.; Rodrigues, R.; Escórcio, R.; Batista, A.P.; Valentin, R.; Gontard, N.; et al. Bioinspired Co-Polyesters of Hydroxy-Fatty Acids Extracted from Tomato Peel Agro-Wastes and Glycerol with Tunable Mechanical, Thermal and Barrier Properties. Ind. Crops Prod. 2021, 170, 113718. [Google Scholar] [CrossRef]
- Manricha, A.; Moreira, F.K.V.; Otoni, C.G.; Lorevicea, M.V.; Martins, M.A.; Mattoso, L.H.C. Hydrophobic Edible Films Made up of Tomato Cutin and Pectin. Carbohydr. Polym. 2017, 164, 83–91. [Google Scholar] [CrossRef]
- Wang, H.; Qian, J.; Ding, F. Emerging Chitosan-Based Films for Food Packaging Applications. J. Agric. Food Chem. 2018, 66, 395–413. [Google Scholar] [CrossRef]
- Elsabee, M.Z.; Abdou, E.S. Chitosan Based Edible Films and Coatings: A Review. Mater. Sci. Eng. C 2013, 33, 1819–1841. [Google Scholar] [CrossRef]
- Leceta, I.; Guerrero, P.; De La Caba, K. Functional Properties of Chitosan-Based Films. Carbohydr. Polym. 2013, 93, 339–346. [Google Scholar] [CrossRef]
- Leceta, I.; Guerrero, P.; Ibarburu, I.; Dueñas, M.T.; De La Caba, K. Characterization and Antimicrobial Analysis of Chitosan-Based Films. J. Food Eng. 2013, 116, 889–899. [Google Scholar] [CrossRef]
- Wang, P.; Fei, P.; Zhou, C.; Hong, P. Stearic Acid Esterified Pectin: Preparation, Characterization, and Application in Edible Hydrophobic Pectin/Chitosan Composite Films. Int. J. Biol. Macromol. 2021, 186, 528–534. [Google Scholar] [CrossRef]
- Ye, Y.; Zeng, F.; Zhang, M.; Zheng, S.; Li, J.; Fei, P. Hydrophobic Edible Composite Packaging Membrane Based on Low-Methoxyl Pectin/Chitosan: Effects of Lotus Leaf Cutin. Food Packag. Shelf Life 2020, 26, 100592. [Google Scholar] [CrossRef]
- Beigzadeh Ghelejlu, S.; Esmaiili, M.; Almasi, H. Characterization of Chitosan-Nanoclay Bionanocomposite Active Films Containing Milk Thistle Extract. Int. J. Biol. Macromol. 2016, 86, 613–621. [Google Scholar] [CrossRef]
- Peng, Y.; Li, Y. Combined Effects of Two Kinds of Essential Oils on Physical, Mechanical and Structural Properties of Chitosan Films. Food Hydrocoll. 2014, 36, 287–293. [Google Scholar] [CrossRef]
- Wang, S.F.; Shen, L.; Tong, Y.J.; Chen, L.; Phang, I.Y.; Lim, P.Q.; Liu, T.X. Biopolymer Chitosan/Montmorillonite Nanocomposites: Preparation and Characterization. Polym. Degrad. Stab. 2005, 90, 123–131. [Google Scholar] [CrossRef]
- Xu, Y.; Ren, X.; Hanna, M.A. Chitosan/Clay Nanocomposite Film Preparation and Characterization. J. Appl. Polym. Sci. 2006, 99, 1684–1691. [Google Scholar] [CrossRef]
- Lanham, A.B.; Ricardo, A.R.; Albuquerque, M.G.E.; Pardelha, F.; Carvalheira, M.; Coma, M.; Fradinho, J.; Carvalho, G.; Oehmen, A.; Reis, M.A.M. Determination of the Extraction Kinetics for the Quantification of Polyhydroxyalkanoate Monomers in Mixed Microbial Systems. Process Biochem. 2013, 48, 1626–1634. [Google Scholar] [CrossRef]
- Ferreira, A.R.V.; Torres, C.A.V.; Freitas, F.; Sevrin, C.; Grandfils, C.; Reis, M.A.M.; Alves, V.D.; Coelhoso, I.M. Development and Characterization of Bilayer Films of FucoPol and Chitosan. Carbohydr. Polym. 2016, 147, 8–15. [Google Scholar] [CrossRef]
- Ly, B.C.K.; Dyer, E.B.; Feig, J.L.; Chien, A.L.; Del Bino, S. Research Techniques Made Simple: Cutaneous Colorimetry: A Reliable Technique for Objective Skin Color Measurement. J. Investig. Dermatol. 2020, 140, 3–12.e1. [Google Scholar] [CrossRef] [PubMed]
- Alves, V.D.; Costa, N.; Coelhoso, I.M. Barrier Properties of Biodegradable Composite Films Based on Kappa-Carrageenan/Pectin Blends and Mica Flakes. Carbohydr. Polym. 2010, 79, 269–276. [Google Scholar] [CrossRef]
- Ahmad Bhat, M.; Ahsan, H. Quality Characteristics of Freeze and Cabinet Dried Tomato Pomace. Int. J. Pure App. Biosci 2018, 6, 891–897. [Google Scholar] [CrossRef]
- Pa Silva, Y.; Borba, B.C.; Pereira, V.A.; Reis, M.G.; Caliari, M.; Brooks, M.S.L.; Ferreira, T.A.P.C. Characterization of Tomato Processing By-Product for Use as a Potential Functional Food Ingredient: Nutritional Composition, Antioxidant Activity and Bioactive Compounds. Int. J. Food Sci. Nutr. 2019, 70, 150–160. [Google Scholar] [CrossRef]
- Kaur, D.; Sogi, D.S.; Garg, S.K.; Bawa, A.S. Flotation-Cum-Sedimentation System for Skin and Seed Separation from Tomato Pomace. J. Food Eng. 2005, 71, 341–344. [Google Scholar] [CrossRef]
- Mouw, T. X-Rite Color Management, Measurement, Solutions, and Software—LAB Color Values/Color Spaces. Available online: https://www.xrite.com/ (accessed on 20 January 2022).


Disclaimer/Publisher’s Note: The statements, opinions and data contained in all publications are solely those of the individual author(s) and contributor(s) and not of MDPI and/or the editor(s). MDPI and/or the editor(s) disclaim responsibility for any injury to people or property resulting from any ideas, methods, instructions or products referred to in the content. |
© 2023 by the authors. Licensee MDPI, Basel, Switzerland. This article is an open access article distributed under the terms and conditions of the Creative Commons Attribution (CC BY) license (https://creativecommons.org/licenses/by/4.0/).