


Design and Validation of an Experimental Setup for Evaluation of Gas Permeation in Ceramic Membranes


Abstract
1. Introduction
1.1. Membranes
1.1.1. Membranes for Oxygen
1.1.2. Membranes for Hydrogen
1.1.3. Membranes for Carbon Dioxide
1.2. Carbon Dioxide Permeation
 CO32− (MC)
2. Materials and Methods
2.1. Membrane Preparation
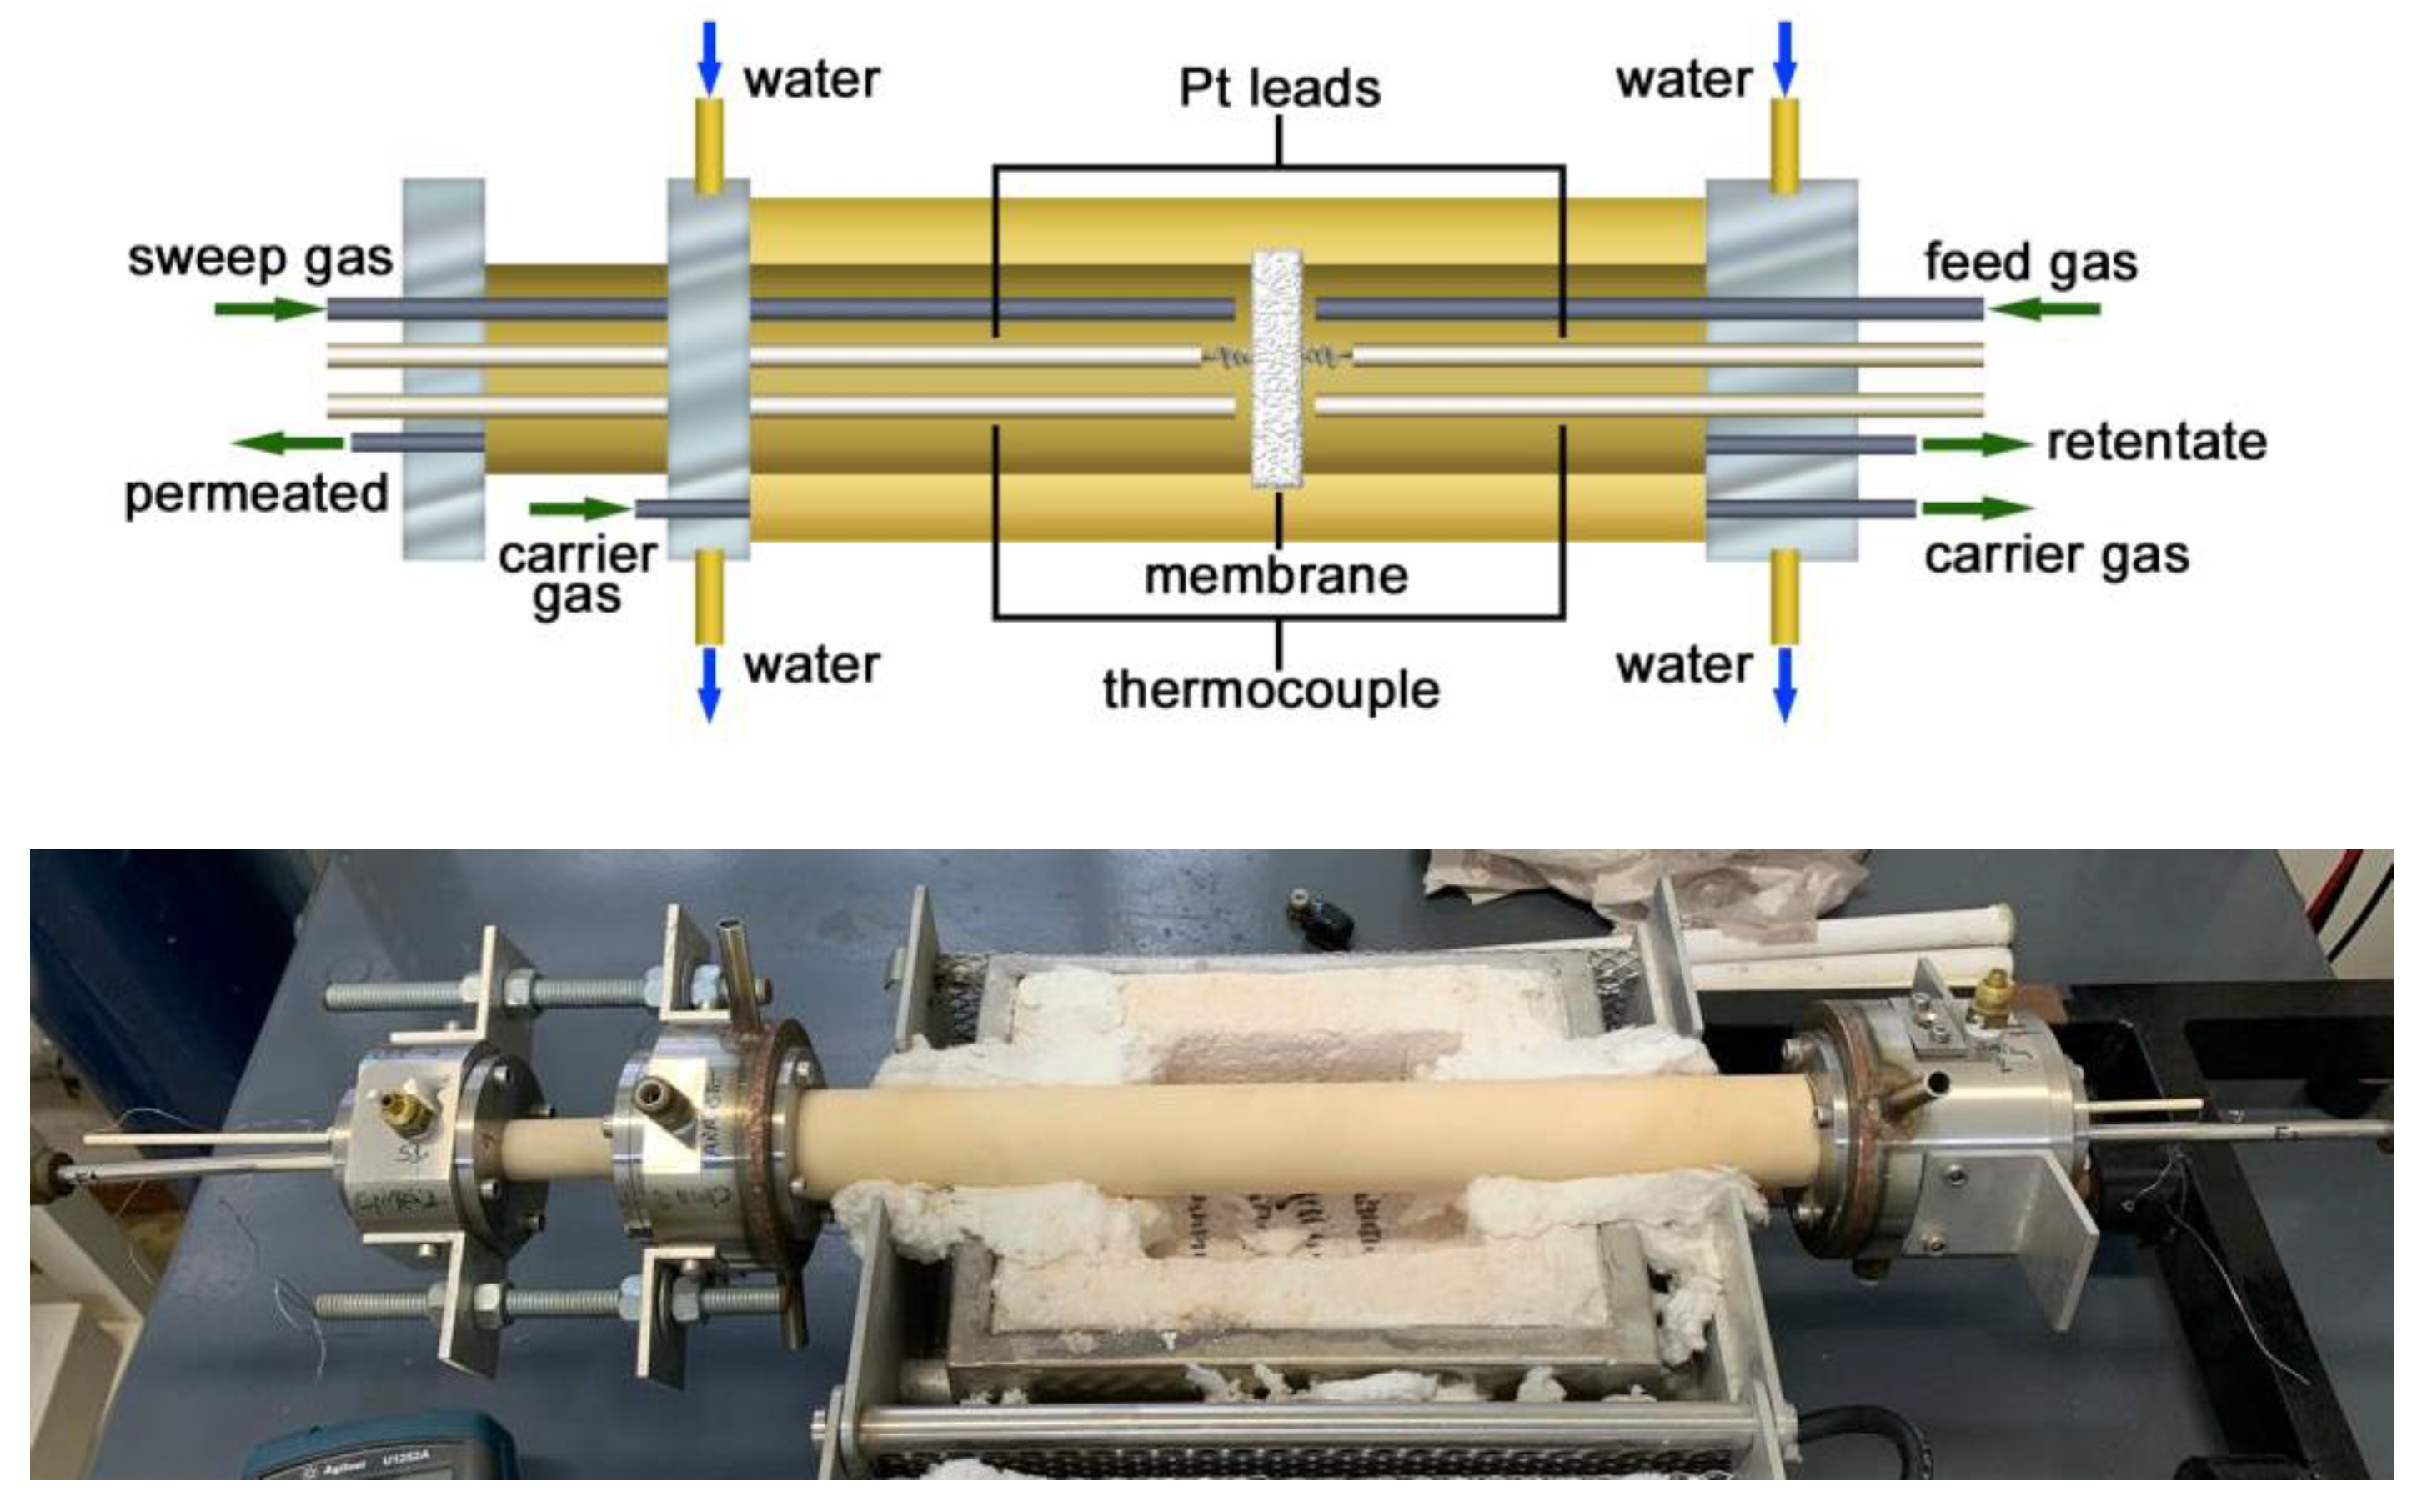
2.2. Experimental Setup
3. Results and Discussion
4. Conclusions
Author Contributions
Funding
Data Availability Statement
Conflicts of Interest
References
- Kiebach, R.; Pirou, S.; Aguilera, L.M.; Haugen, A.B.; Kaiser, A.; Hendriksen, P.V.; Balaguer, M.; Garciıa-Fayos, J.; Serra, J.M.; Schulze-Küppers, F.; et al. A review on dual-phase oxygen transport membranes: From fundamentals to commercial deployment. J. Mater. Chem. A 2022, 10, 2152–2195. [Google Scholar] [CrossRef]
- Balachandran, U.; Lee, T.H.; Dorris, S.E. Hydrogen production by water dissociation using mixed conducting dense ceramic membranes. Int. J. Hydrogen Energy 2007, 32, 451–456. [Google Scholar] [CrossRef]
- Cheng, H. Dual-Phase Mixed Protonic-Electronic Conducting Hydrogen Separation Membranes: A Review. Membranes 2022, 12, 647. [Google Scholar] [CrossRef]
- Rochelle, G.T. Amine scrubbing for CO2 capture. Science 2009, 325, 1652–1654. [Google Scholar] [CrossRef]
- Ozkan, M.; Custelcean, R. The status and prospects of materials for carbon capture technologies. MRS Bull. 2022, 47, 390–394. [Google Scholar] [CrossRef]
- Phair, J.W.; Badwal, S.P.S. Materials for separation membranes in hydrogen and oxygen production and future power generation. Sci. Technol. Adv. Mater. 2006, 7, 792–805. [Google Scholar] [CrossRef]
- Rondão, A.I.B.; Patrício, S.G.; Figueiredo, F.M.L.; Marques, F.M.B. Impact of ceramic matrix functionality on composite electrolytes performance. Electrochim. Acta 2013, 109, 701–709. [Google Scholar] [CrossRef]
- Kenarsari, S.D.; Yang, D.; Jiang, G.; Zhang, S.; Wang, J.; Russell, A.G.; Wei, Q.; Fan, M. Review of recent advances in carbon dioxide separation and capture. RSC Adv. 2013, 3, 22739–22773. [Google Scholar] [CrossRef]
- Pera-Titus, M. Porous inorganic membranes for CO2 capture: Present and prospects. Chem. Rev. 2014, 114, 1413–1492. [Google Scholar] [CrossRef]
- Patrício, S.G.; Papaioannou, E.I.; Ray, B.M.; Metcalfe, I.S.; Marques, F.M.B. Composite CO2 separation membranes: Insights on kinetics and stability. J. Membr. Sci. 2017, 541, 253–261. [Google Scholar] [CrossRef]
- Zhang, A.P.; Tong, J.; Huang, K.; Zhu, X.; Yang, W. The current status of high temperature electrochemistry-based CO2 transport membranes and reactors for direct CO2 capture and conversion. Progr. Energy Combust. Sci. 2021, 82, 100888. [Google Scholar] [CrossRef]
- Starykevich, M.; Jamale, A.; Yasakau, K.A.; Marques, F.M.B. Novel molten phase route for composite CO2 separation membranes. J. Membr. Sci. 2022, 659, 120806. [Google Scholar] [CrossRef]
- Frangini, S.; Masi, A. Molten carbonates for advanced and sustainable energy applications: Part I. Revisiting molten carbonate properties from a sustainable viewpoint. Int. J. Hydrogen Energy 2016, 41, 18739–18746. [Google Scholar] [CrossRef]
- Li, Y.D.; Rui, Z.B.; Xia, C.; Anderson, M.; Lin, Y.S. Performance of ionic- conducting ceramic/carbonate composite material as solid oxide fuel cell electrolyte and CO2 permeation membrane. Catal. Today 2009, 148, 303–309. [Google Scholar] [CrossRef]
- Anderson, M.; Lin, Y.S. Carbonate-ceramic dual-phase membrane for carbon dioxide separation. J. Membr. Sci. 2010, 357, 122–129. [Google Scholar] [CrossRef]
- Patricio, S.G.; Papaioannou, E.I.; Zhang, G.; Metcalfe, I.S.; Marques, F.M.B. High performance composite CO2 separation membranes. J. Membr. Sci. 2014, 471, 211–218. [Google Scholar] [CrossRef]
- Papaioannou, E.I.; Qi, H.; Metcalfe, I.S. ‘Uphill’ permeation of carbon dioxide across a composite molten salt-ceramic membrane. J. Membr. Sci. 2015, 485, 87–93. [Google Scholar] [CrossRef]
- Kazakli, M.; Mutch, G.A.; Triantafyllou, G.; Gil, A.G.; Li, T.; Wang, B.; Bailey, J.J.; Brett, D.J.L.; Shearing, P.R.; Li, K.; et al. Controlling molten carbonate distribution in dual-phase molten salt-ceramic membranes to increase carbon dioxide permeation rates. J. Membr. Sci. 2021, 617, 118640. [Google Scholar] [CrossRef]
- Carvalho, S.G.M.; Muccillo, E.N.S.; Fonseca, F.C.; Müller, M.; Schulze-Küppers, F.; Baumann, S.; Meulenberg, W.A.; Guillon, O.; Muccillo, R. Tape-casting and freeze drying gadolinia-doped ceria composite membranes for carbon dioxide permeation. J. Membr. Sci. 2022, 648, 120355. [Google Scholar] [CrossRef]
- Wade, J.L.; Lee, C.; West, A.C.; Lackner, K.S. Composite electrolyte membranes for high temperature CO2 separation. J. Membr. Sci. 2011, 369, 20–29. [Google Scholar] [CrossRef]
- Mutch, G.A.; Qu, L.; Triantafyllou, G.; Xing, W.; Fontaine, M.L.; Metcalfe, I.S. Supported molten-salt membranes for carbon dioxide permeation. J. Mater. Chem. 2019, 7, 12951–12973. [Google Scholar] [CrossRef]
- Xia, C.; Li, Y.; Tian, Y.; Liu, Q.; Zhao, Y.; Jia, L.; Li, Y. A high performance composite ionic conducting electrolyte for intermediate temperature fuel cell and evidence for ternary ionic conduction. J. Power Source 2009, 188, 156–162. [Google Scholar] [CrossRef]
- Norton, T.T.; Lu, B.; Lin, Y.S. Carbon dioxide permeation properties and stability of samarium-doped-ceria carbonate dual-phase membranes. J. Membr. Sci. 2014, 467, 244–252. [Google Scholar] [CrossRef]
- Lu, B.; Lin, Y.S. Asymmetric thin samarium doped cerium oxide-carbonate dual-phase membrane for carbon dioxide separation. Ind. Eng. Chem. Res. 2014, 53, 13459–13466. [Google Scholar] [CrossRef]
- Nikolaeva, E.V.; Bovet, A.L.; Zakiryanova, I.D. Electrical conductivity of molten carbonate and carbonate-chloride systems coexisting with aluminum oxide powder. Z. Naturforsch. 2018, 73, 79–83. [Google Scholar] [CrossRef]
- Grilo, J.P.F.; Macedo, D.A.; Nascimento, R.M.; Marques, F.M.B. Electronic conductivity in Gd-doped ceria with salt additions. Electrochim. Acta 2019, 318, 977–988. [Google Scholar] [CrossRef]
- Kleitz, M.; Kennedy, J.H. Resolution of multicomponent impedance diagrams. In Fast Ion Transport in Solids, Electrodes and Electrolytes; Mundy, J.N., Shenoy, G.K., Vashishta, P., Eds.; Elsevier: Amsterdam, The Netherlands, 1979; pp. 185–188. [Google Scholar]
- Chen, T.; Wang, Z.; Hu, J.; Wai, M.H.; Kawi, S.; Lin, Y.S. High CO2 permeability of ceramic-carbonate dual-phase hollow fiber membrane at medium-high temperature. J. Membr. Sci. 2020, 597, 117770. [Google Scholar] [CrossRef]
- Rui, Z.; Anderson, M.; Li, Y.; Lin, Y.S. Ionic conducting ceramic and carbonate dual phase membranes for carbon dioxide separation. J. Membr. Sci. 2012, 417–418, 174–182. [Google Scholar] [CrossRef]
- Chen, T.; Wu, H.C.; Li, Y.; Lin, Y.S. Poisoning effect of H2S on CO2 permeation of samarium-doped-ceria/carbonate dual-phase membrane. Ind. Eng. Chem. Res. 2017, 56, 14662–14669. [Google Scholar] [CrossRef]
- Dong, X.; Wu, H.C.; Lin, Y.S. CO2 permeation through asymmetric thin tubular ceramic-carbonate dual-phase membranes. J. Membr. Sci. 2018, 564, 73–81. [Google Scholar] [CrossRef]
- Muccillo, R. Impedance spectroscopy analysis of zirconia:8 mol% yttria solid electrolytes with graphite pore former. J. Mater. Res. 2022, 24, 1780–1784. [Google Scholar] [CrossRef]
- Horovistiz, A.L.; Rocha, R.A.; Muccillo, E.N.S. Electrical conductivity and microstructure relationship in ternary systems based on cerium oxide. Ceram. Int. 2013, 39, 5887–5892. [Google Scholar] [CrossRef]
- Kojima, T.; Miyazaki, Y.; Nomura, K.; Tanimoto, K. Electrical conductivity of molten Li2CO3–X2CO3 (X: Na, K, Rb, and Cs) and Na2CO3–Z2CO3 (Z: K, Rb, and Cs). J. Electrochem. Soc. 2007, 154, F222. [Google Scholar] [CrossRef]


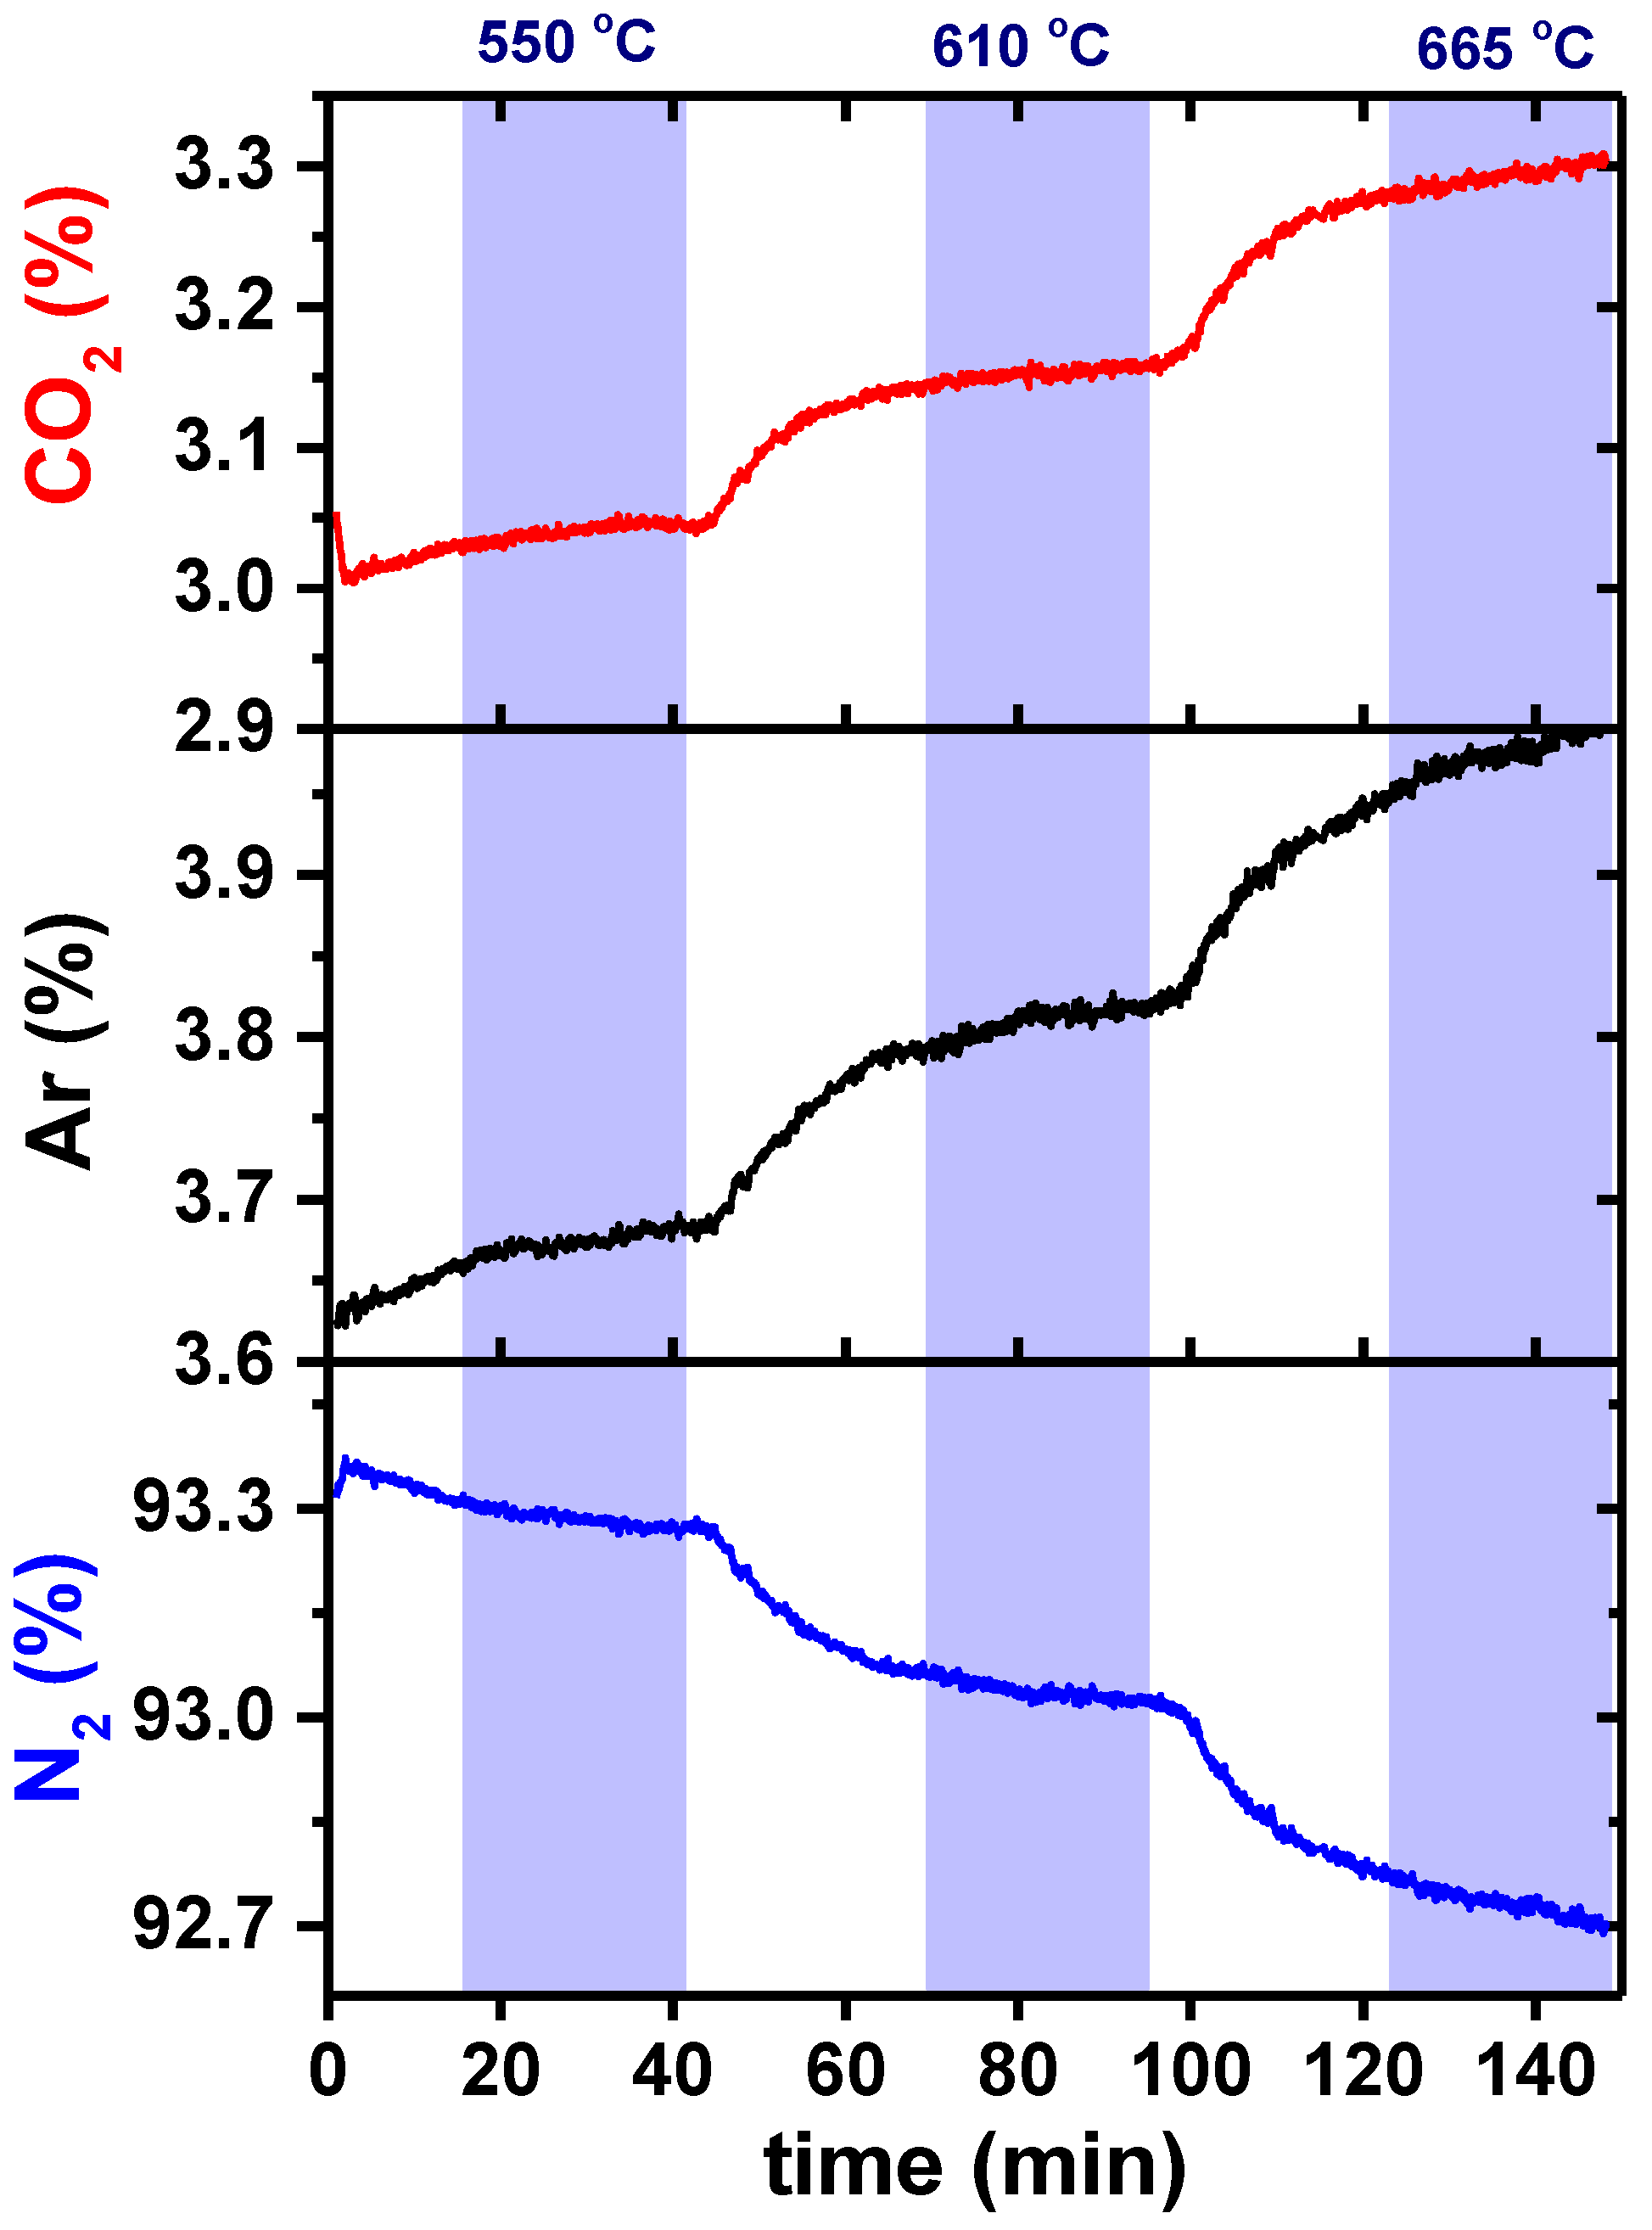
| Temperature (°C) | Gas Flux (mL min−1) | |
|---|---|---|
| CO2 | Ar | |
| 550 | 3.2 | 3.9 |
| 610 | 3.4 | 4.1 |
| 665 | 3.6 | 4.3 |
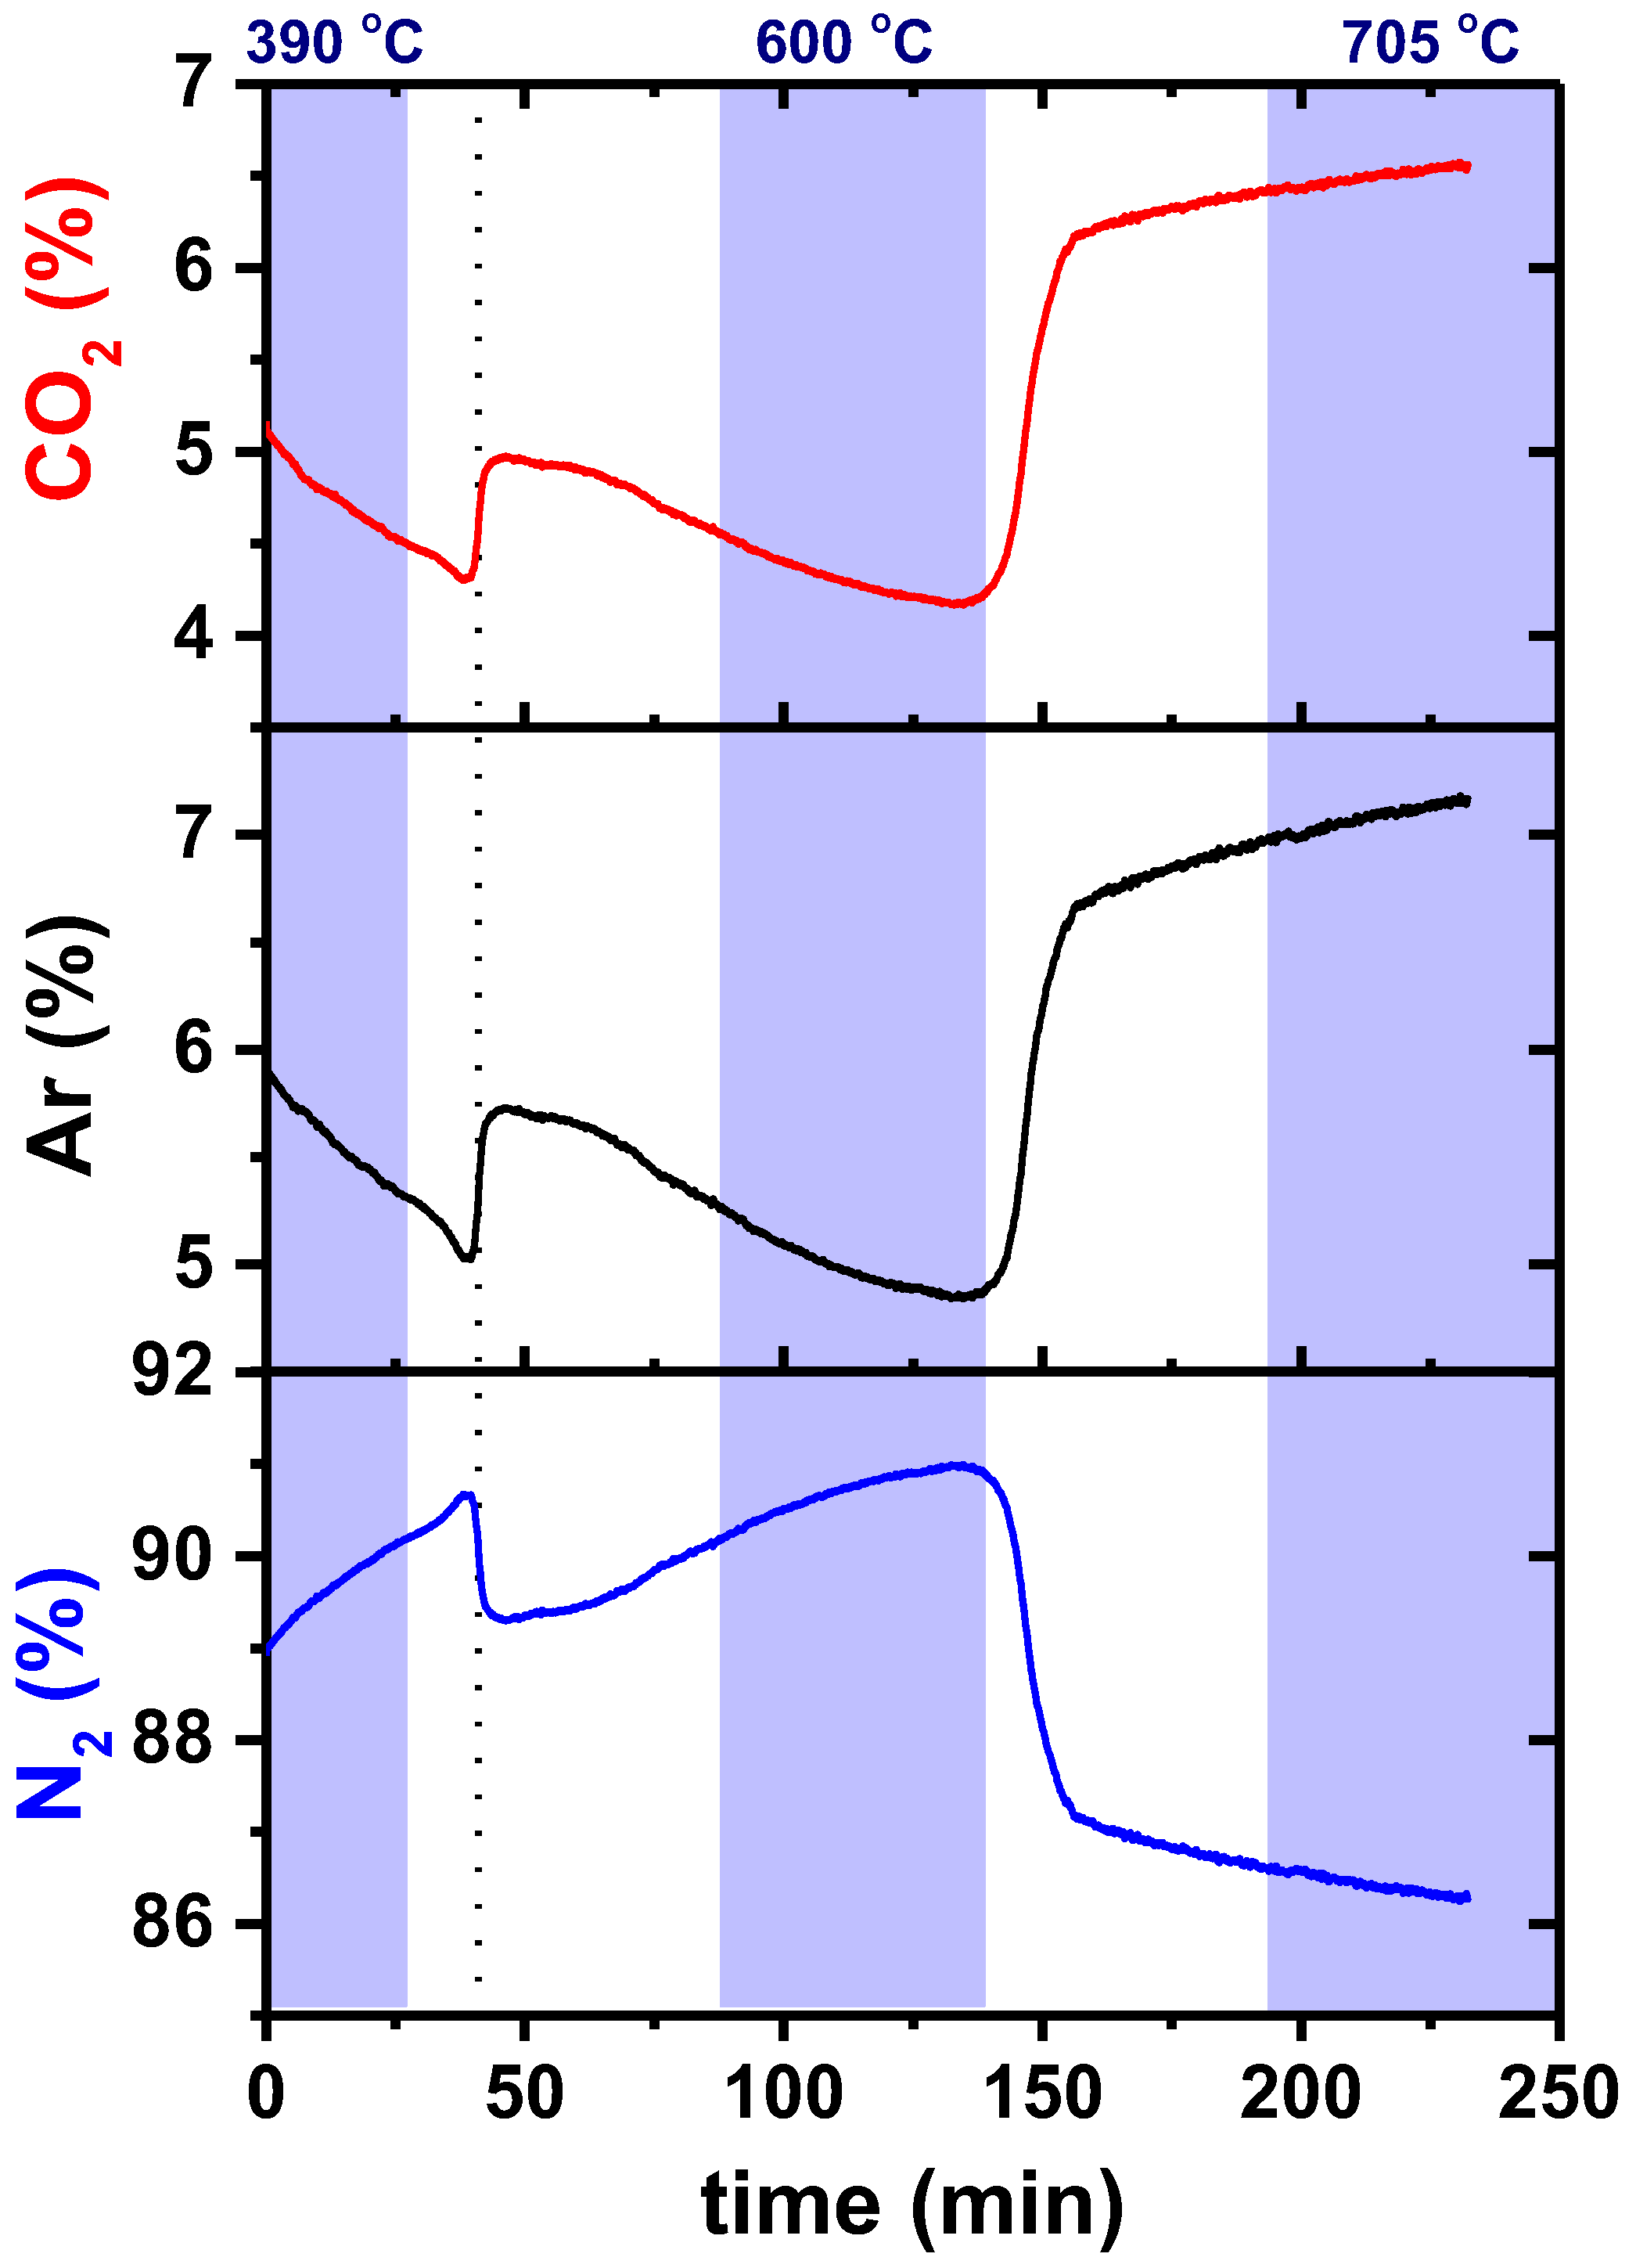
| Temperature (°C) | Gas Flux (mL min−1) | |
|---|---|---|
| CO2 | Ar | |
| 390 | 5.1 | 6.0 |
| 600 | 4.6 | 5.4 |
| 705 | 7.5 | 8.3 |
| Ceramic Matrix | Feed Gas | Temperature (°C) | Permeance (mol m−2 s−1 Pa−1) | Ref. |
|---|---|---|---|---|
| GDC | 20%CO2/15%H2O/62.4%Ar/2.6% H2 | 800 (heating) | 5.35 × 10⁻⁷ | [19] |
| 800 (cooling) | 3.44 × 10⁻⁷ | |||
| SDC | 5%H2/47.5%CO2/47.5%N2 | 700 | 8.56 × 10⁻⁷ | [28] |
| LSCF | 50%CO2/50%Ar | 900 | 5.36 × 10⁻⁸ | [15] |
| BYS | 50%CO2/50%Ar | 650 | 1.10 × 10⁻⁸ | [29] |
| SDC | 10%H2/45%CO2/45%N2 | 750 | 1.36 × 10⁻⁷ | [30] |
| SDC | 50%CO/35%CO2/10%H2/5%N2 | 900 | 1.68 × 10⁻⁷ | [23] |
| SDC-BYS | 49.5%CO/36%CO2/4.5%N2/10%H2 | 700 | 1.05 × 10⁻⁷ | [31] |
| GDC | 50%N2/50%CO2 | 650 | 4.40 × 10⁻⁸ | [16] |
| GDC | 50% Ar-50% CO2 | 705 | 8.58 × 10⁻⁸ | This work |
Disclaimer/Publisher’s Note: The statements, opinions and data contained in all publications are solely those of the individual author(s) and contributor(s) and not of MDPI and/or the editor(s). MDPI and/or the editor(s) disclaim responsibility for any injury to people or property resulting from any ideas, methods, instructions or products referred to in the content. |
© 2023 by the authors. Licensee MDPI, Basel, Switzerland. This article is an open access article distributed under the terms and conditions of the Creative Commons Attribution (CC BY) license (https://creativecommons.org/licenses/by/4.0/).
Share and Cite
Carvalho, S.G.M.; Muccillo, E.N.S.; Muccillo, R. Design and Validation of an Experimental Setup for Evaluation of Gas Permeation in Ceramic Membranes. Membranes 2023, 13, 246. https://doi.org/10.3390/membranes13020246
Carvalho SGM, Muccillo ENS, Muccillo R. Design and Validation of an Experimental Setup for Evaluation of Gas Permeation in Ceramic Membranes. Membranes. 2023; 13(2):246. https://doi.org/10.3390/membranes13020246
Chicago/Turabian StyleCarvalho, Sabrina G. M., Eliana N. S. Muccillo, and Reginaldo Muccillo. 2023. "Design and Validation of an Experimental Setup for Evaluation of Gas Permeation in Ceramic Membranes" Membranes 13, no. 2: 246. https://doi.org/10.3390/membranes13020246
APA StyleCarvalho, S. G. M., Muccillo, E. N. S., & Muccillo, R. (2023). Design and Validation of an Experimental Setup for Evaluation of Gas Permeation in Ceramic Membranes. Membranes, 13(2), 246. https://doi.org/10.3390/membranes13020246