Article

High-Density Microarray Analysis of Microbial Community Structures in Membrane Bioreactor at Short Sludge Retention Time

1
State Key Laboratory of Environmental Criteria and Risk Assessment, Chinese Research Academy of Environmental Sciences, Beijing 100012, China
2
Department of Civil and Environmental Engineering, University of California, Berkeley, CA 94720-1710, USA
*
Author to whom correspondence should be addressed.
Membranes 2023, 13(2), 146; https://doi.org/10.3390/membranes13020146
Submission received: 27 December 2022 / Revised: 14 January 2023 / Accepted: 20 January 2023 / Published: 23 January 2023
(This article belongs to the Section Membrane Applications for Water Treatment)

Abstract

:
Membrane bioreactors (MBR) have become prevalent in wastewater treatment because of their high effluent quality and low sludge generation. Sludge retention time (SRT) is an important parameter in the operation of MBR, and it has a direct effect on the microbial community. In this study, microarrays were used to analyze the microbial communities of three different MBRs at short SRTs. The results showed that MBR at SRT 5 days (CS5) has the highest operational taxonomic units (OTUs) richness, but the lowest diversity and uniformity compared to SRT 3 days at continuous CS3 and the sequencing batch (SS3). Proteobacteria were the dominant phylum of three reactors. Bacteroidetes were the second dominant phylum in MBRs at the continuous model, instead of Actinobacteria at the sequencing model. At the class level, the dominant group of Proteobacteria exhibited a remarkable difference between the three MBRs. γ-Proteobacteria was the dominant group in CS5 and CS3, while α-Proteobacteria was the main group in SS3. The samples from the three MBRs had similar compositions of α-, β- and δ-Proteobacteria. However, γ-Proteobacteria showed different community compositions at the order level between the three MBRs. Enterobacteriales were the dominant group in CS5 and CS3, while Pseudomonadales were the dominant group in SS3. The bacterial community concentration of SRT 5 days was generally higher than that of the other two MBRs. The community composition of CS5 was significantly different from that of CS3 and SS3, and the phylogenetic relationships of the three MBRs were relatively different.

1. Introduction

In the field of water treatment, more and more new reactors composed of membranes and bioreactors have been applied [1,2,3,4]. Membrane bioreactor (MBR), which combines membrane separation and the activated sludge process, has become prevalent in wastewater treatment [5,6,7,8]. Due to the introduction of membranes, compared with the traditional activated sludge process, the effluent quality of MBR has been greatly improved, and sludge production has been reduced [9,10], thus, attracting widespread interest. Sludge retention time (SRT) is an important parameter in the operation of MBR, and it is widely assumed that a longer SRT is conducive to the growth of nitrifying bacteria and the improvement of nitrification ability [11]. MBR with short SRT, on the other hand, can also achieve better nitrogen removal [12], which is closely related to the growth of various micro-organisms. Therefore, it is very important to investigate the microbial community structure of MBR at short SRTs.
Microarray technology is a new genomics research method and can be used as a high-throughput method for microbial community analysis [13]. The use of high-density microarrays to analyze the composition and structure of the microbial community in the MBR has unique advantages. Unlike other taxonomic nucleic acid-based analysis methods, which are limited by the speed of sequence analysis, microarrays can simultaneously provide a high-throughput tool for the detection, identification, characterization, and quantification of micro-organisms in natural environments. Microarray technology can enable the quantitative analysis of the microbial community based on fluorescence intensity. OTU abundance can be obtained by measuring fluorescence intensity, and the relative OTU abundance x (0 < x < 1) can be obtained by the normalization of the fluorescence maximum value [13]. In addition, high-density microarrays have the advantage of classifying and identifying a mass of microbial communities without the need for subsequent DNA isolation and sequencing. In recent years, it has been reported that high-density microarray technology has been used to carry out some research related to environmental systems [12,14,15].
In this study, two MBRs and a membrane-sequencing batch reactor (MSBR) with short SRTs were operated. In order to reveal the differences of microbial community structures in different short SRT MBRs and the MSBR, we used a high-density microarray containing 297,851 probes targeting 8935 clusters of 16S rRNA genes (PhyloChips) to investigate the composition of microbial communities.

2. Materials and Methods

2.1. Bench-Scale Submerged Membrane Bioreactors (MBR)

Three lab-scale aerobic submerged membrane bioreactors were operated in parallel at SRT 3 days (CS3), 5 days (CS5) and the sequencing batch at SRT 3 days (SS3) to treat synthetic municipal wastewater. Hollow-fiber membranes (Sterapore LHEM03334, Mitsubishi Rayon, Tokyo, Japan), with a total area of 0.03 m2, were installed in a 4 L aerobic-activated sludge tank. The material of the membranes was polyethylene, and the separation particle size was 0.4 µm. Continuous aeration was provided underneath the membranes to supply the dissolved oxygen concentration of approximately 9 mg/L and prevent membrane fouling. All MBRs were operated in constant flux mode at the same hydraulic retention time of 6 h. The MSBR (SS3) was operated under the following strategy: filling time (10 min), reaction time (290 min) and draw time (60 min). The target SRTs were maintained through the direct removal of sludge from the bioreactor on a daily basis. Synthetic wastewater, mainly composed of acetate and corn starch as carbon sources, was used to provide a consistent influent feed composition.

2.2. Analytical Methods for Water Quality Parameters

The influent and permeate quality as well as the membrane suction pressure were monitored routinely. Total chemical oxygen demand (COD), total nitrogen and ammonia-nitrogen were measured according to the manufacturer’s instructions using Hach Methods 8000, 8039 and 8008, respectively.

2.3. Microarray

In this study, we used G2 microarray chips, designed by Lawrence Berkeley National Laboratory and synthesized by Affymetrix Inc. (Santa Clara, CA, USA), to identify the bacterial species. The chips had an approximate density of 10,000 molecules/μm2 and included 297,851 probes targeted to 8935 clusters (operational taxonomic units, OTUs) in 16S rRNA gene sequences. The average number of replicated probes chosen for each cluster was 24 to ensure precision.
PhyloChips were scanned and recorded as a pixel image, and individual signal values and intensities were completed using standard Affymetrix software (GeneChip microarray analysis suite, version 5.1). The positive fraction (Pf value) was calculated as the number of positive probe pairs divided by the total number of probe pairs in each probe set. An OTU was considered “present” when its Pf value was greater than 0.9. PhyloChip results are output as lists of detected OTUs and their hybridization scores, along with associated taxonomic information and references to represented sequences in public 16S rRNA gene repositories (greengenes.lbl.gov).

3. Results and Discussion

3.1. The Process Performance

The three MBR reactors demonstrated excellent performance in removing organic matter and nitrogen. The COD removal rate of the three reactors can reach more than 94%, among which the NH4+-N removal rate of SS3 can reach more than 85%, and the NH4+-N removal rate of CS3 and CS5 can reach more than 87%. The COD concentration in the effluent water of the three reactors was less than 40 mg/L, and the NH4+-N concentration was less than 10 mg/L. This indicates that the MBRs had a good effect on the removal of organic matter and ammonia nitrogen under the condition of short SRT.

3.2. The Diversity and Similarity of Microbial Communities

The richness of microbial communities in the three MBRs was examined by a microarray. A total of 1260 OTUs were detected in at least three samples, accounting for 14% of the OTUs on the PhyloChip. All detected OTUs were taxonomically derived from 36 bacterial phyla, 73 classes, 148 orders, 279 families and 351 subfamilies.
The microbial communities in the three reactors showed extremely high diversity, as reflected in the fact that 34 (CS5), 35 (CS3) and 33 (SS3) identified bacterial phyla were detected. As shown in Table 1, the total numbers of OTUs detected by microarrays were 1031 (CS5), 954 (CS3) and 869 (SS3) in the three MBRs, indicating that CS5 had the most richness. It is mainly attributed to the fact that a relatively longer SRT was adopted in CS5. Different operating conditions, such as aeration mode and dissolved oxygen, affect the distribution of microbial communities in bioreactors [16]. It has been reported that longer SRT could promote the development of slow-growing micro-organisms, such as Nitrospira and Comammox [17]. However, the Shannon–Wiener diversity, Simpson index and equitability index of CS5 were the lowest among the three samples, suggesting that the microbial community diversity of CS5 was lower than the other two MBRs. It could be inferred that the bacterial communities in CS5 were distributed less evenly than the other two MBRs. Therefore, with the increase in SRT from 3 days to 5 days, the species richness of microbial communities increased, but their uniformity decreased.
There were more shared microbial communities and fewer distinct communities in the three reactors (Figure 1). Each of the three reactors had a very small number of unique microbial communities. The numbers of unique microbial communities were 97 (CS5), 96 (CS3) and 82 (SS3), and the number of shared microbial communities in the three groups was 607. The similarities between pairwise reactors in the three reactors were very low and could only reach 46.5% (CS3-CS5), 44.4% (SS3-CS5) and 43.1% (CS3-SS3). Additionally, the similarities between MSBR and MBRs were lower than those between the two MBRs, which may be caused by different operation modes. The dominant community in parts A and B are γ-Proteobacteria, accounting for 23%, while the dominant microbe in part C is α-Proteobacteria (33%). γ-Proteobacteria can be involved in the degradation of nitrate and other contaminants in bioreactors [18,19], and α-Proteobacteria also play an important role in the denitrification reaction [20]. Moreover, the three micro-organisms with the highest proportion in D, E, F and G are γ-proteobacteria (15–25%), β-Proteobacteria (10–15%) and α-Proteobacteria (17–22%).

3.3. The Dominant Bacteria

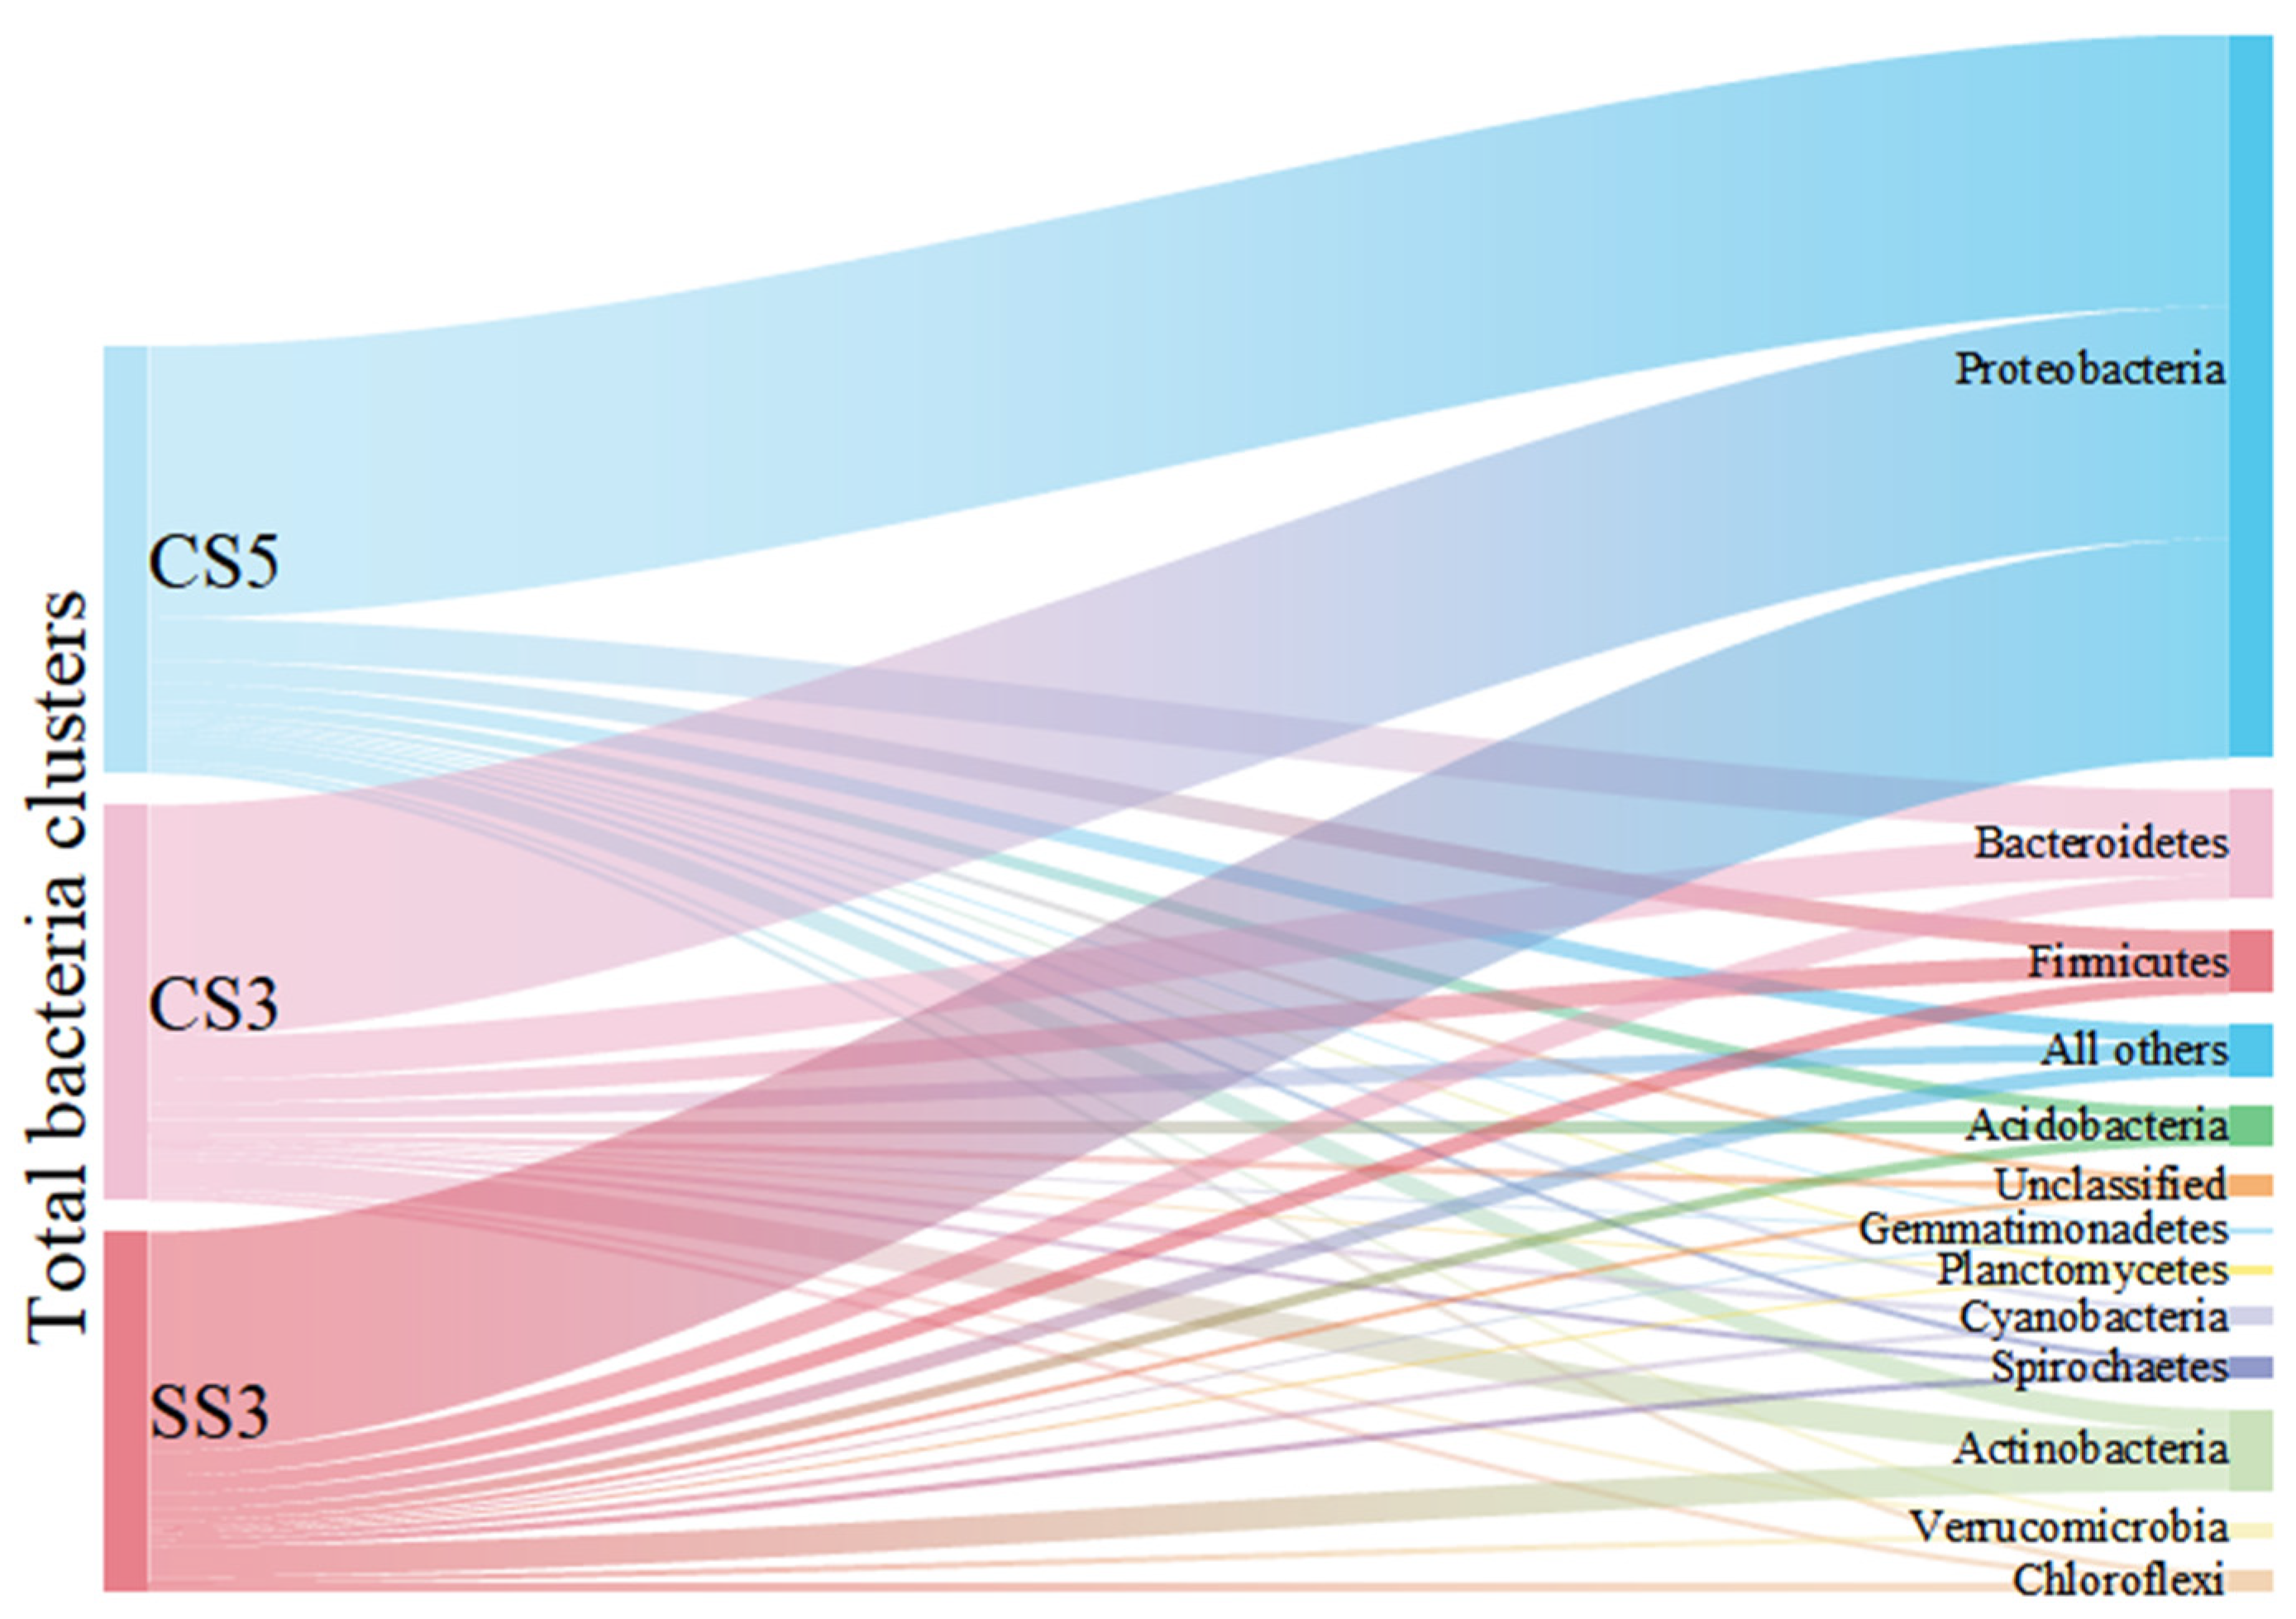
As shown in Figure 2, Proteobacteria was the dominant phylum and accounted for 59% to 64% of the total bacterial community. The result was consistent with previous studies on MBRs analyzed by conventional molecular biology methods [21]. This group of Proteobacteria has considerable morphological, physiological and metabolic diversity, which are of great importance to global carbon, nitrogen and sulfur cycling [22]. Bacteroidetes were detected as the second most prevalent phylum in CS5 (10%) and CS3 (11%). The members of Bacteroidetes are widely distributed in the environment and are closely related to the degradation of organic matter and the cycle of nitrogen [23]. Actinobacteria (5% for CS5, 8% for CS3) and Firmicutes (5% for CS5, 6% for CS3) were the third and fourth most prevalent groups of bacteria detected in this study. The reactor SS3 showed different characteristics of microbial community structure. Actinobacteria (9%) was the second dominant bacterial community instead of Bacteroidetes in CS5 and CS3. Moreover, it is worth pointing out that the species richness of Actinobacteria (74 OTUs) and Chloroflexi (23 OTUs) in SS3 was the highest in three MBRs, despite most of the phyla in SS3 were the lowest. It has been reported that MSBR has a higher COD removal rate than MBR [24]. This phenomenon can be explained by the higher proportion and species richness of Actinobacteria in MSBR found in this study. The members of the Actinobacteria phylum are a group of gram-positive bacteria that have an important role in organic matter turnover and carbon cycling [25]. Other phyla, including Acidobacteria, Chloroflexi, Cyanobacteria, Cyanobacteria, Spirochaetes, Verrucomicrobia, Planctomycetes, Gemmatimonadetes and unclassified only occupied no more than 3% of the total bacterial community in three MBRs. Therefore, this study provides a comprehensive survey of the richness and composition of MBR microbial communities at different operating conditions.
The class-level identification of the bacterial communities in three reactors is illustrated in Figure 3. At the class level, α-Proteobacteria, β-Proteobacteria and γ-Proteobacteria were the main community groups of Proteobacteria in three MBRs. However, the dominant group of Proteobacteria exhibited a remarkable difference between the three MBRs. γ-Proteobacteria was the dominant group in CS5 and CS3, while α-Proteobacteria was the main group in SS3. However, β-Proteobacteria was the dominant group reported in a study related to the MSBR [26]. Moreover, the relative abundance of γ-Proteobacteria in CS3 (41%) was higher than the other two MBRs. The previous publications have reported that specific phylogenetic groups belonging to γ-Proteobacteria are likely the pioneers of surface colonization on membranes, which could lead to severe irreversible membrane biofouling [27]. In addition, SRT is inversely proportional to membrane fouling [28], which explains why CS3 has the highest relative abundance of γ-Proteobacteria. For the Bacteroidetes phylum, Sphingobacteria and Flavobacteria were the most dominant classified subgroups, accounting for 31–40% and 29–38% of the total bacterial community in the three MBRs, respectively. Both are inseparable, and they are involved in the nitrogen cycle [29]. For the Firmicutes and Actinobacteria phylum, Clostridia and Actinomycetales were the dominant groups.
The order level of Proteobacteria was conducted to reveal more information on the microbial community evolution between the three bioreactors (Figure 4). It was obvious that the samples from the three MBRs had similar compositions of α-, β- and δ-Proteobacteria. Within the α-Proteobacteria, Rhizobiales, Rhodobacterales and Bradyrhizobiales were the dominant groups within a narrow range of 22–23%, 16–25% and 17–20%, respectively. Within the β-Proteobacteria, Burkholderiales was the dominant group and constituted 70–81% of the detected OTUs. Rhodocyclales was the second dominant group and constituted 8–13%. The seven other detected groups (Ellin6095/SC-I-39, Hydrogenophilales, Methylophilales, MND1 clone group, Neisseriales, Nitrosomonadales and unclassified) had many fewer detections (1–9 OTUs) in all samples and constituted approximately 11–17% of β-Proteobacteria. Within the δ-Proteobacteria, Desulfobacterales, Desulfovibrionales, Myxococcales and Syntrophobacterales were the dominant groups, constituting 21–31%, 14–19%, 17–18% and 17%, respectively. However, γ-Proteobacteria showed different community compositions at the order level between the three MBRs. Enterobacteriales were the dominant group of CS5 and CS3 (constituting 22% and 24% of the detected OTUs), while Enterobacteriales only constituted 5% of the detected γ-Proteobacteria in SS3. Pseudomonadales was the dominant group in SS3 and occupied 34%, and a few members, such as species of Pseudomonas, played a central role in denitrification [30,31]. Bacteria in the Enterobacteriaceae family are gram-negative bacteria that are shaped similar to rods and are usually 1–5 μm in length. They are facultative anaerobic bacteria that ferment sugars to produce lactic acid and other products. Most of them can also convert nitrate to nitrite. However, unlike most similar bacteria, some members of the Enterobacteriaceae typically lack cytochrome C oxidase. Although there are exceptions, such as Plesiomonas Shiga [32]. This indicates that the denitrification intensity of MBR was higher than that of MSBR. The reason for this difference was that the two systems were operated in different modes. It has been previously reported that the continuous system (MBR) had higher bacterial community diversity than the discontinuous system (MSBR) [33]. This result also corresponds to the removal efficiency of ammonia nitrogen in Section 3.1.

3.4. The Concentration and Phylogenetic Analysis of Microbial Communities

As shown in Figure 5, the average fluorescence intensity of micro-organisms at the phylum level in CS5 was higher than that of CS3 and SS3. This indicated that the microbial concentration in the reactor with an SRT of 5 days was higher than that in the reactor with an SRT of 3 days. Except for α-, β-, γ- and ε-Proteobacteria, the concentration of other microbial communities in CS3 was higher than that in SS3. In the three reactors, the micro-organisms with the highest fluorescence intensity were β-Proteobacteria (CS5), Unclassified-Proteobacteria (CS3) and ε-Proteobacteria (SS3), respectively.
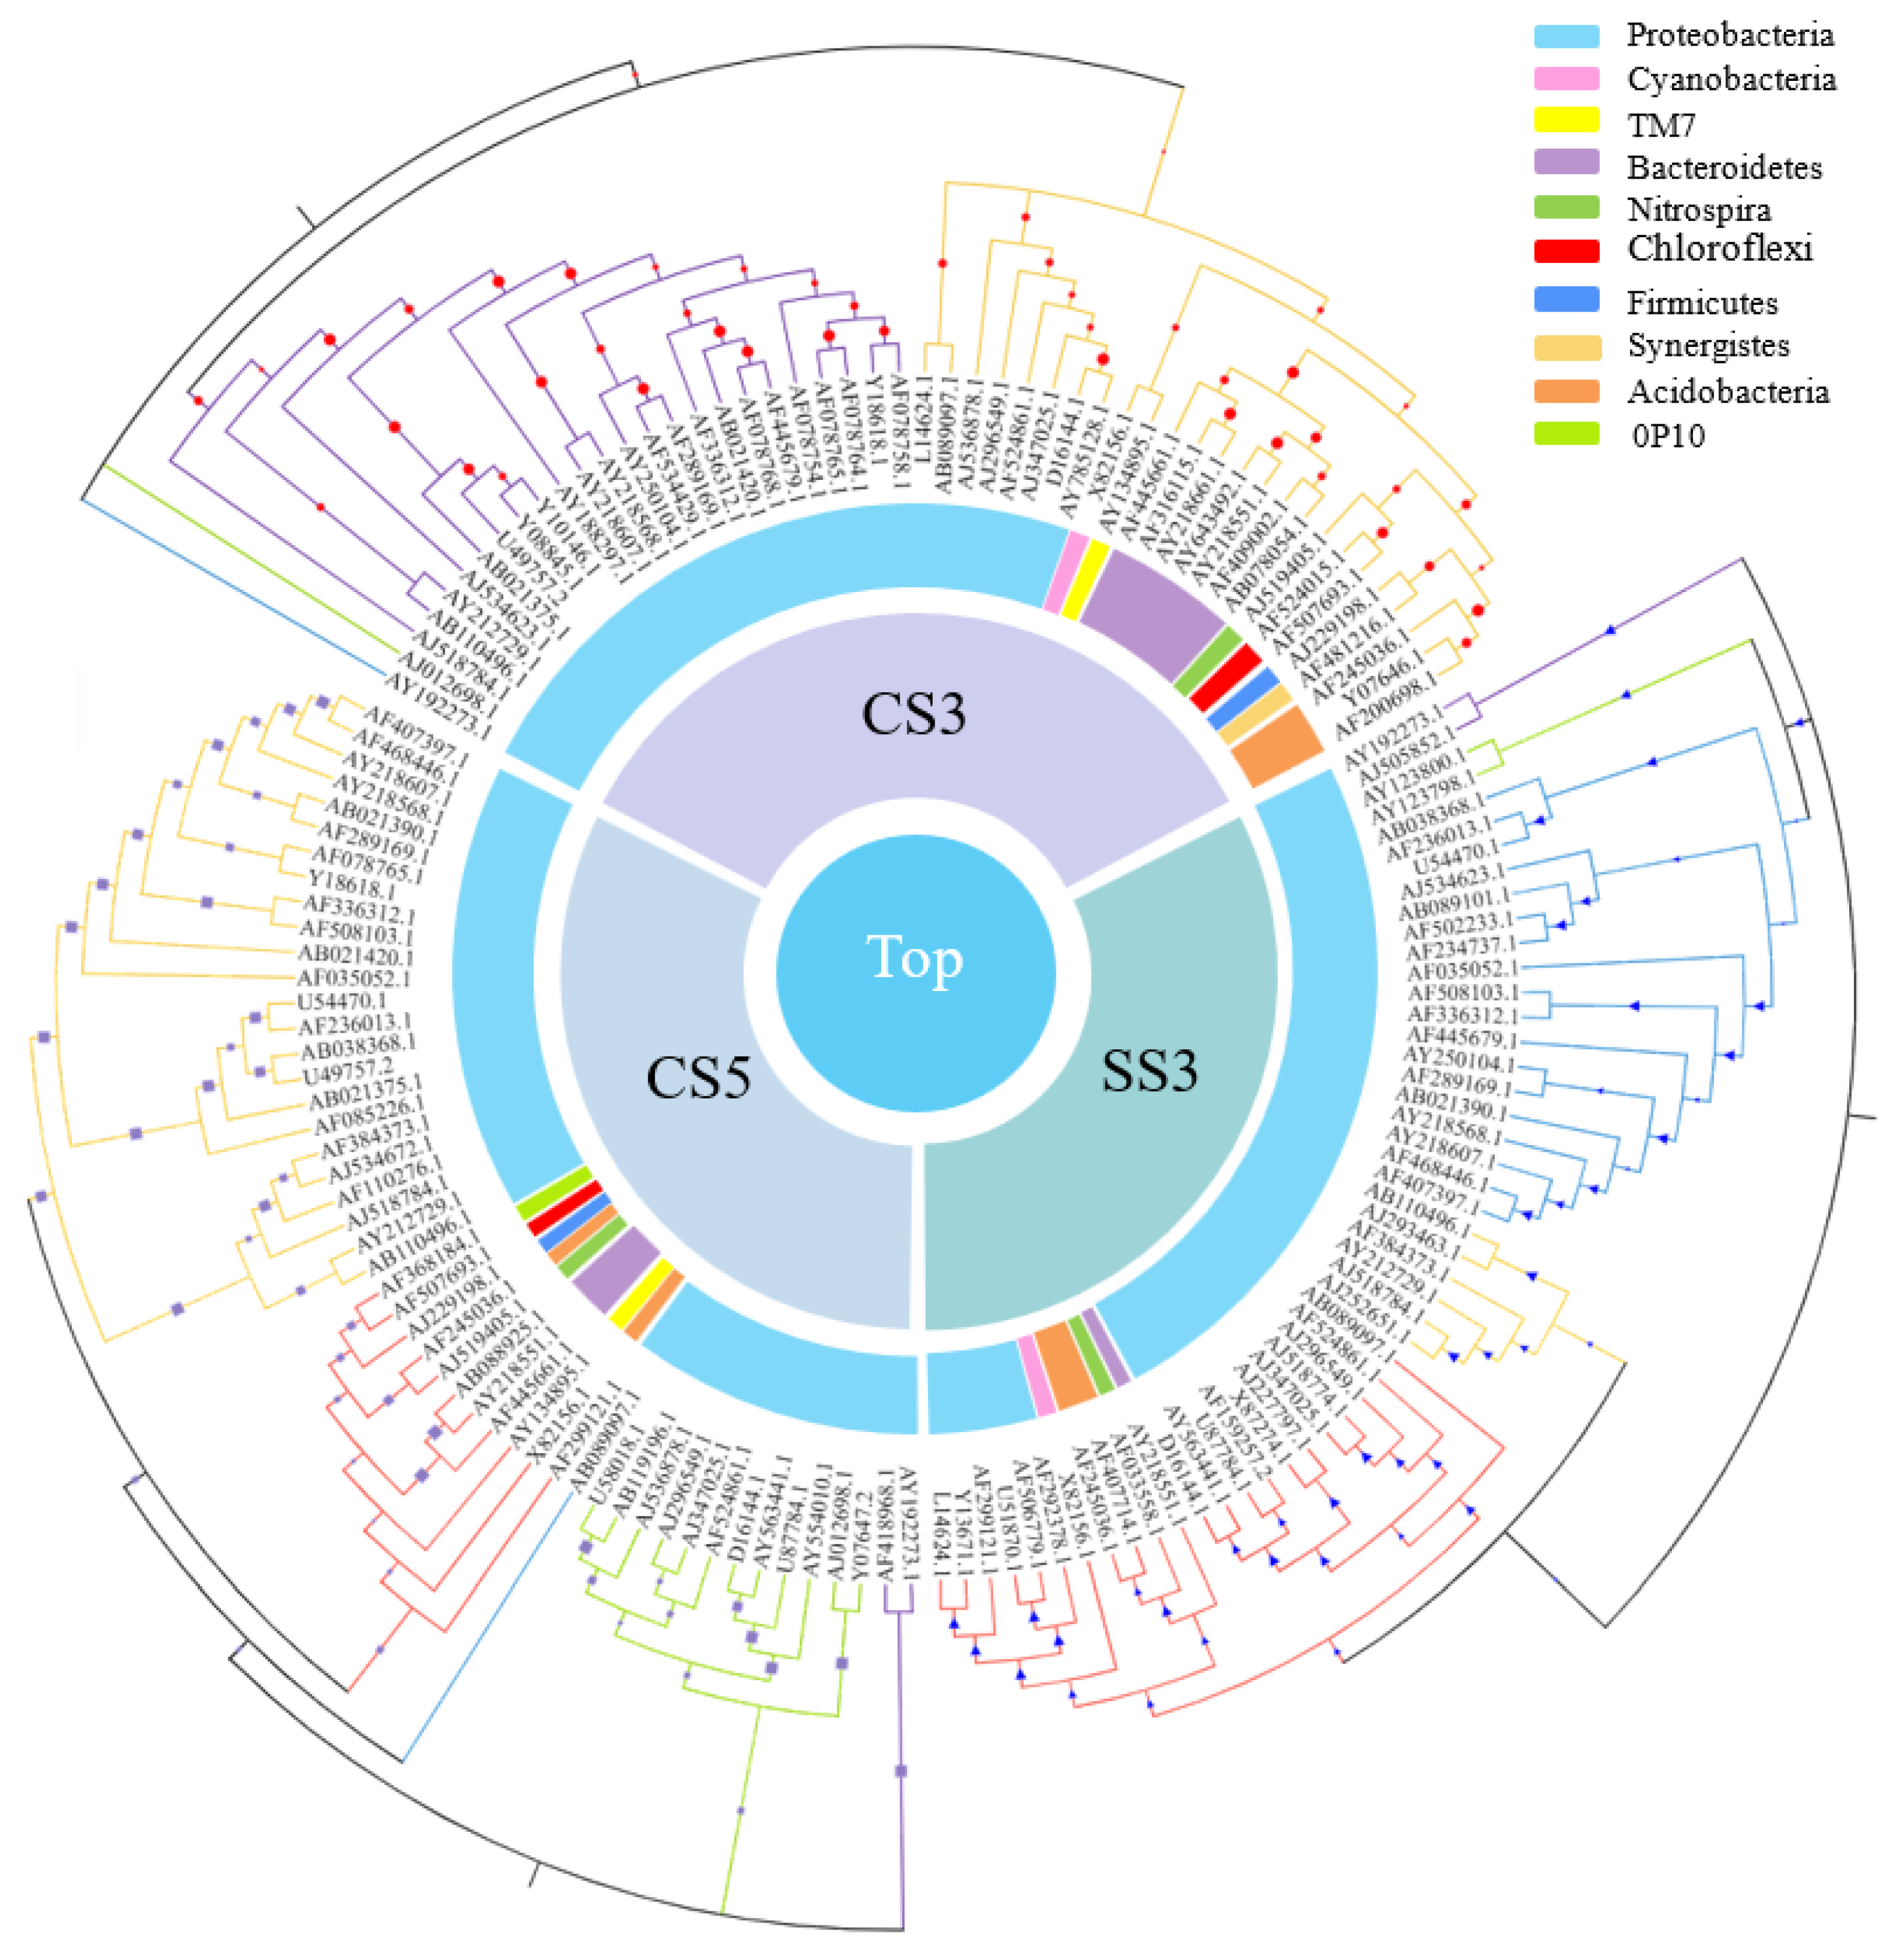
As shown in Figure 6, among the top 50 genera with the most abundant communities in the three reactors, green means less abundant, and red means more abundant. The community composition of CS5 was significantly different from that of CS3 and SS3, and the community distribution of CS3 and SS3 is similar at the genus level. This difference could be attributed in large part to the different SRTs (3 and 5 days). Most of the bacteria in CS5 were greatly abundant, and only a few had relatively low abundance, while the opposite was true for CS3 and SS3. Bacterias at the genus level with the highest concentrations belong mainly to Cyanobacteria, α-, β- and γ-Proteobacteria in CS3 and SS3. To further evaluate the differences in microbial community structure among the three MBRs, phylogenetic relationships of the top 50 most abundant genera of the bacterial community for each sample are shown in Figure 7. The phylogenetic tree showed that the microbial communities of the three samples could be divided into three categories, but the phylogenetic relationships of the three samples were relatively different. Among them, the bacteria with Genbank numbers AJ012698.1 (Acetobacteraceae) and AY192273.1 (Unclassified Alphaproteobacteria) in CS3 had obvious genetic differences from other members. For the top 50 most abundant genera, CS3 and CS5 were more similar in phylum level classification, while the classification of SS3 was significantly different from that of CS3 and CS5 at the phylum-level, indicating that different operation modes had a significant impact on the distribution of microbial communities.

4. Conclusions

The three short SRT MBRs all had satisfactory removal effects for organic matter and NH4+-N. The removal efficiencies can reach 94% and 85%, respectively. Three MBRs showed high microbial diversity, and CS5 had the highest OTU richness but the lowest diversity and uniformity compared to CS3 and SS3.
Proteobacteria was the dominant phylum of the three reactors. Bacteroidetes was the second dominant phylum in CS5 and CS3 instead of Actinobacteria in SS3. At the class level, γ-Proteobacteria was the dominant group in CS5 and CS3, while α-Proteobacteria was the main group in SS3. The samples from the three MBRs had similar compositions of α-, β- and δ-Proteobacteria. However, γ-Proteobacteria showed different community compositions at the order level between the three MBRs. Enterobacteriales were the dominant group of CS5 and CS3, while Pseudomonadales were the dominant group of SS3. This indicates that the denitrification intensity of MBR was higher than that of MSBR, which was caused by different operating modes.
The bacterial community concentration of CS5 was generally higher than that of CS3 and SS3. The community composition of CS5 was significantly different from that of CS3 and SS3, and the community distribution of CS3 and SS3 was similar at the genus level. The microbial communities of the top 50 most abundant genera for each sample could be divided into three categories, but the phylogenetic relationships of the three samples were relatively different.

Author Contributions

Conceptualization, L.D.; methodology, S.L. and L.D.; software, S.W.H.; validation, S.L., L.D. and Y.S.; formal analysis, S.W.H.; investigation, L.D. and S.W.H.; resources, L.D. and S.W.H.; data curation, L.D.; writing—original draft preparation, S.L.; writing—review and editing, S.L. and L.D.; visualization, S.L.; supervision, L.D.; project administration, L.D. and Y.S..; funding acquisition, L.D. All authors have read and agreed to the published version of the manuscript.

Funding

This work was financially supported by the Special Fund for Basic Scientific Research Business of Central Public Research Institutes (2022YSKY-14).

Institutional Review Board Statement

Not applicable.

Data Availability Statement

The data presented in this study are available upon request from the corresponding author.

Conflicts of Interest

The authors declare no conflict of interest. The authors declare that they have no known competing financial interests or personal relationships that could have appeared to influence the work reported in this paper.

References

  1. Zhao, Y.; Duan, L.; Liu, X.; Song, Y. Study on the Changes in the Microcosmic Environment in Forward Osmosis Membranes to Reduce Membrane Resistance. Membranes 2022, 12, 1203. [Google Scholar] [CrossRef]
  2. Zhao, Y.; Duan, L.; Liu, X.; Song, Y. Forward Osmosis Technology and Its Application on Microbial Fuel Cells: A Review. Membranes 2022, 12, 1254. [Google Scholar] [CrossRef] [PubMed]
  3. Zhao, Y.; Duan, L.; Liu, X.; Song, Y. Influence of Membrane Fouling and Reverse Salt Flux on Membrane Impedance of Forward Osmosis Microbial Fuel Cell. Membranes 2022, 12, 1165. [Google Scholar] [CrossRef] [PubMed]
  4. Salman, M.Y.; Taşkan, E.; Hasar, H. Comparative potentials of H2- and O2-MBfRs in removing multiple tetracycline antibiotics. Process Saf. Environ. Prot. 2022, 167, 184–191. [Google Scholar] [CrossRef]
  5. Pathak, N.; Tran, V.H.; Merenda, A.; Johir, M.A.H.; Phuntsho, S.; Shon, H. Removal of Organic Micro-Pollutants by Conventional Membrane Bioreactors and High-Retention Membrane Bioreactors. Appl. Sci. 2020, 10, 2969. [Google Scholar] [CrossRef]
  6. Lei, Z.; Yang, S.; Li, Y.-y.; Wen, W.; Wang, X.C.; Chen, R. Application of anaerobic membrane bioreactors to municipal wastewater treatment at ambient temperature: A review of achievements, challenges, and perspectives. Bioresour. Technol. 2018, 267, 756–768. [Google Scholar] [CrossRef]
  7. Hou, H.; Mengting, Z.; Duan, L.; Zhao, Y.; Zhang, Z.; Yao, M.; Zhou, B.; Zhang, H.; Hermanowicz, S.W. Removal performance and biodegradation mechanism of sulfonamides antibiotic contained wastewater by IFAS-MBR bioreactor. J. Mol. Liq. 2022, 367, 120572. [Google Scholar] [CrossRef]
  8. Yao, M.; Duan, L.; Song, Y.; Hermanowicz, S.W. Degradation mechanism of Ibuprofen via a forward osmosis membrane bioreactor. Bioresour. Technol. 2021, 321, 124448. [Google Scholar] [CrossRef]
  9. Le-Clech, P.; Chen, V.; Fane, T.A.G. Fouling in membrane bioreactors used in wastewater treatment. J. Membr. Sci. 2006, 284, 17–53. [Google Scholar] [CrossRef]
  10. Zhu, J.; Lin, C.F.; Kao, J.C.M.; Yang, P.Y. Evaluation of potential integration of entrapped mixed microbial cell and membrane bioreactor processes for biological wastewater treatment/reuse. Clean Technol. Environ. Policy 2011, 13, 153–160. [Google Scholar] [CrossRef]
  11. Sun, D.D.; Khor, S.L.; Hay, C.T.; Leckie, J.O. Impact of prolonged sludge retention time on the performance of a submerged membrane bioreactor. Desalination 2007, 208, 101–112. [Google Scholar]
  12. Duan, L.; Song, Y.; Xia, S.; Hermanowicz, S.W. Characterization of nitrifying microbial community in a submerged membrane bioreactor at short solids retention times. Bioresour. Technol. 2013, 149, 200–207. [Google Scholar] [CrossRef] [PubMed]
  13. Zhou, J.H. Microarrays for bacterial detection and microbial community analysis. Curr. Opin. Microbiol. 2003, 6, 288–294. [Google Scholar] [CrossRef] [PubMed]
  14. Huyghe, A.; Francois, P.; Charbonnier, Y.; Tangomo-Bento, M.; Bonetti, E.-J.; Paster, B.J.; Bolivar, I.; Baratti-Mayer, D.; Pittet, D.; Schrenzel, J.; et al. Novel Microarray design strategy to study complex bacterial communities. Appl. Environ. Microbiol. 2008, 74, 1876–1885. [Google Scholar] [CrossRef] [PubMed] [Green Version]
  15. Xia, S.; Duan, L.; Song, Y.; Li, J.; Piceno, Y.M.; Andersen, G.L.; Alvarez-Cohen, L.; Moreno-Andrade, I.; Huang, C.-L.; Hermanowicz, S.W. Bacterial Community Structure in Geographically Distributed Biological Wastewater Treatment Reactors. Environ. Sci. Technol. 2010, 44, 7391–7396. [Google Scholar] [CrossRef] [PubMed]
  16. Gao, J.; Wang, R.; Li, Y.; Huang, H.; Su, X.; An, Z.; Yin, W.; Yang, L.; Rong, L.; Sun, F. Effect of aeration modes on nitrogen removal and N2O emission in the partial nitrification and denitrification process for landfill leachate treatment. Sci. Total Environ. 2022, 853, 158424. [Google Scholar] [CrossRef] [PubMed]
  17. How, S.W.; Nittami, T.; Ngoh, G.C.; Curtis, T.P.; Chua, A.S.M. An efficient oxic-anoxic process for treating low COD/N tropical wastewater: Startup, optimization and nitrifying community structure. Chemosphere 2020, 259, 127444. [Google Scholar] [CrossRef] [PubMed]
  18. Lai, C.-Y.; Wen, L.-L.; Shi, L.-D.; Zhao, K.-K.; Wang, Y.-Q.; Yang, X.; Rittmann, B.E.; Zhou, C.; Tang, Y.; Zheng, P.; et al. Selenate and Nitrate Bioreductions Using Methane as the Electron Donor in a Membrane Biofilm Reactor. Environ. Sci. Technol. 2016, 50, 10179–10186. [Google Scholar] [CrossRef]
  19. Van Ginkel, S.W.; Lamendella, R.; Kovacik, W.P., Jr.; Domingo, J.W.S.; Rittmann, B.E. Microbial community structure during nitrate and perchlorate reduction in ion-exchange brine using the hydrogen-based membrane biofilm reactor (MBfR). Bioresour. Technol. 2010, 101, 3747–3750. [Google Scholar] [CrossRef]
  20. Wang, Q.; Han, Y.; Lan, S.; Hu, C. Metagenomic Insight Into Patterns and Mechanism of Nitrogen Cycle During Biocrust Succession. Front. Microbiol. 2021, 12, 633428. [Google Scholar] [CrossRef]
  21. Huan, L.; Zhiheng, L.; Bowen, S.; Zhepei, G. Microbial community response of the full-scale MBR system for mixed leachates treatment. Water Environ. Res. A Res. Publ. Water Environ. Fed. 2021, 94, e1677. [Google Scholar]
  22. Spain, A.M.; Krumholz, L.R.; Elshahed, M.S. Abundance, composition, diversity and novelty of soil Proteobacteria. Isme J. 2009, 3, 992–1000. [Google Scholar] [CrossRef] [PubMed]
  23. Luo, L.; Yao, J.; Liu, W.; Yang, L.; Li, H.; Liang, M.; Ma, H.; Liu, Z.; Chen, Y. Comparison of bacterial communities and antibiotic resistance genes in oxidation ditches and membrane bioreactors. Sci. Rep. 2021, 11, 8955. [Google Scholar] [CrossRef] [PubMed]
  24. Zhang, H.M.; Xiao, J.N.; Cheng, Y.J.; Liu, L.F.; Zhang, X.W.; Yang, F.L. Comparison between a sequencing batch membrane bioreactor and a conventional membrane bioreactor. Process Biochem. 2006, 41, 87–95. [Google Scholar] [CrossRef]
  25. Hazarika, S.N.; Thakur, D. Chapter 21—Actinobacteria. In Beneficial Microbes in Agro-Ecology; Amaresan, N., Senthil Kumar, M., Annapurna, K., Kumar, K., Sankaranarayanan, A., Eds.; Academic Press: Cambridge, MA, USA, 2020; pp. 443–476. [Google Scholar]
  26. Ma, B.C.; Lee, Y.N.; Park, J.S.; Lee, C.H.; Lee, S.H.; Chang, I.S.; Ahn, T.S. Correlation between dissolved oxygen concentration, microbial community and membrane permeability in a membrane bioreactor. Process Biochem. 2006, 41, 1165–1172. [Google Scholar] [CrossRef]
  27. Lim, S.; Kim, S.; Yeon, K.-M.; Sang, B.-I.; Chun, J.; Lee, C.-H. Correlation between microbial community structure and biofouling in a laboratory scale membrane bioreactor with synthetic wastewater. Desalination 2012, 287, 209–215. [Google Scholar] [CrossRef]
  28. Duan, L.; Song, Y.; Xia, S.; Li, J.; Hermanowicz, S.W. The Application of MBR for the Treatment of Municipal Wastewaters at Short SRT. In Proceedings of the 4th International Conference on Bioinformatics and Biomedical Engineering (iCBBE), Chengdu, China, 18–20 June 2010; IEEE: Piscataway Township, NJ, USA, 2010. [Google Scholar]
  29. Gerwick, W.H.; Sitachitta, N. Chapter 4 Nitrogen-Containing Metabolites from Marine Bacteria. In The Alkaloids: Chemistry and Biology; Academic Press: Cambridge, MA, USA, 1999; Volume 53. [Google Scholar]
  30. Li, J.; Du, Q.; Peng, H.; Zhang, Y.; Bi, Y.; Shi, Y.; Xu, Y.; Liu, T. Optimization of biochemical oxygen demand to total nitrogen ratio for treating landfill leachate in a single-stage partial nitrification-denitrification system. J. Clean. Prod. 2020, 266, 121809. [Google Scholar] [CrossRef]
  31. Chen, Z.; Wang, X.; Yang, Y.; Mirino, M.W.; Yuan, Y. Partial nitrification and denitrification of mature landfill leachate using a pilot-scale continuous activated sludge process at low dissolved oxygen. Bioresour. Technol. 2016, 218, 580–588. [Google Scholar] [CrossRef]
  32. Elikwu, C.J.; Shobowale, E.O.; Nwadike, V.U.; Tayo, B.; Okangba, C.C.; Shonekan, O.A.; Omeonu, A.C.; Faluyi, B.; Ile, P.; Adelodun, A.; et al. Antimicrobial Susceptibility Patterns of Enterobacteriaceae Isolated from Stool Samples at a Semi-urban Teaching Hospital. Am. J. Biomed. Life Sci. 2016, 3, 127–130. [Google Scholar] [CrossRef]
  33. Duan, L.; Song, Y.; Xia, S.; Hermanowicz, S.W. Detection of microbial communities in continuous and discontinuous membrane bioreactor using high-density oligonucleotide Microarray. In AIP Conference Proceedings; American Institute of Physics: College Park, MD, USA, 2010; Volume 1251. [Google Scholar]
Figure 1. Venn diagram of three MBRs communities overlapped.
Membranes 13 00146 g001
Figure 2. Sankey diagram of taxonomic breakdown (at the phylum level) of three MBRs.
Membranes 13 00146 g002
Figure 3. The taxonomic distribution of the Proteobacteria (A), Bacteroidetes (B), Firmicutes (C) and Actinobacteria (D) classes for the microarray.
Membranes 13 00146 g003
Figure 4. The taxonomic distribution of the α-Proteobacterial (A), β-Proteobacterial (B), δ-Proteobacterial (C) and γ-Proteobacterial (D) orders on the microarray.
Membranes 13 00146 g004
Figure 5. Average PhyloChip hybridization signal intensities for the three MBRs at the phylum level.
Membranes 13 00146 g005
Figure 6. Heatmap showing the top 50 most abundant genera of bacterial community for each sample.
Membranes 13 00146 g006
Figure 7. Phylogenetic relationships of the top 50 most abundant genera of the bacterial community for each sample.
Membranes 13 00146 g007
Table 1. Estimates of relative diversity based on the 16S rDNA PhyloChip analysis.
CS5CS3SS3
Species richness(S)1031954869
Shannon–Wiener Diversity (H’)1.571.691.68
Simpson index0.580.630.61
Equitability index (EI)0.230.250.25
Disclaimer/Publisher’s Note: The statements, opinions and data contained in all publications are solely those of the individual author(s) and contributor(s) and not of MDPI and/or the editor(s). MDPI and/or the editor(s) disclaim responsibility for any injury to people or property resulting from any ideas, methods, instructions or products referred to in the content.