


Oxyanion Removal from Impaired Water by Donnan Dialysis Plug Flow Contactors


 ,
,  and
and
Abstract
:1. Introduction
2. Theory
3. Materials and Methods
3.1. Materials
3.2. Analytical Methods
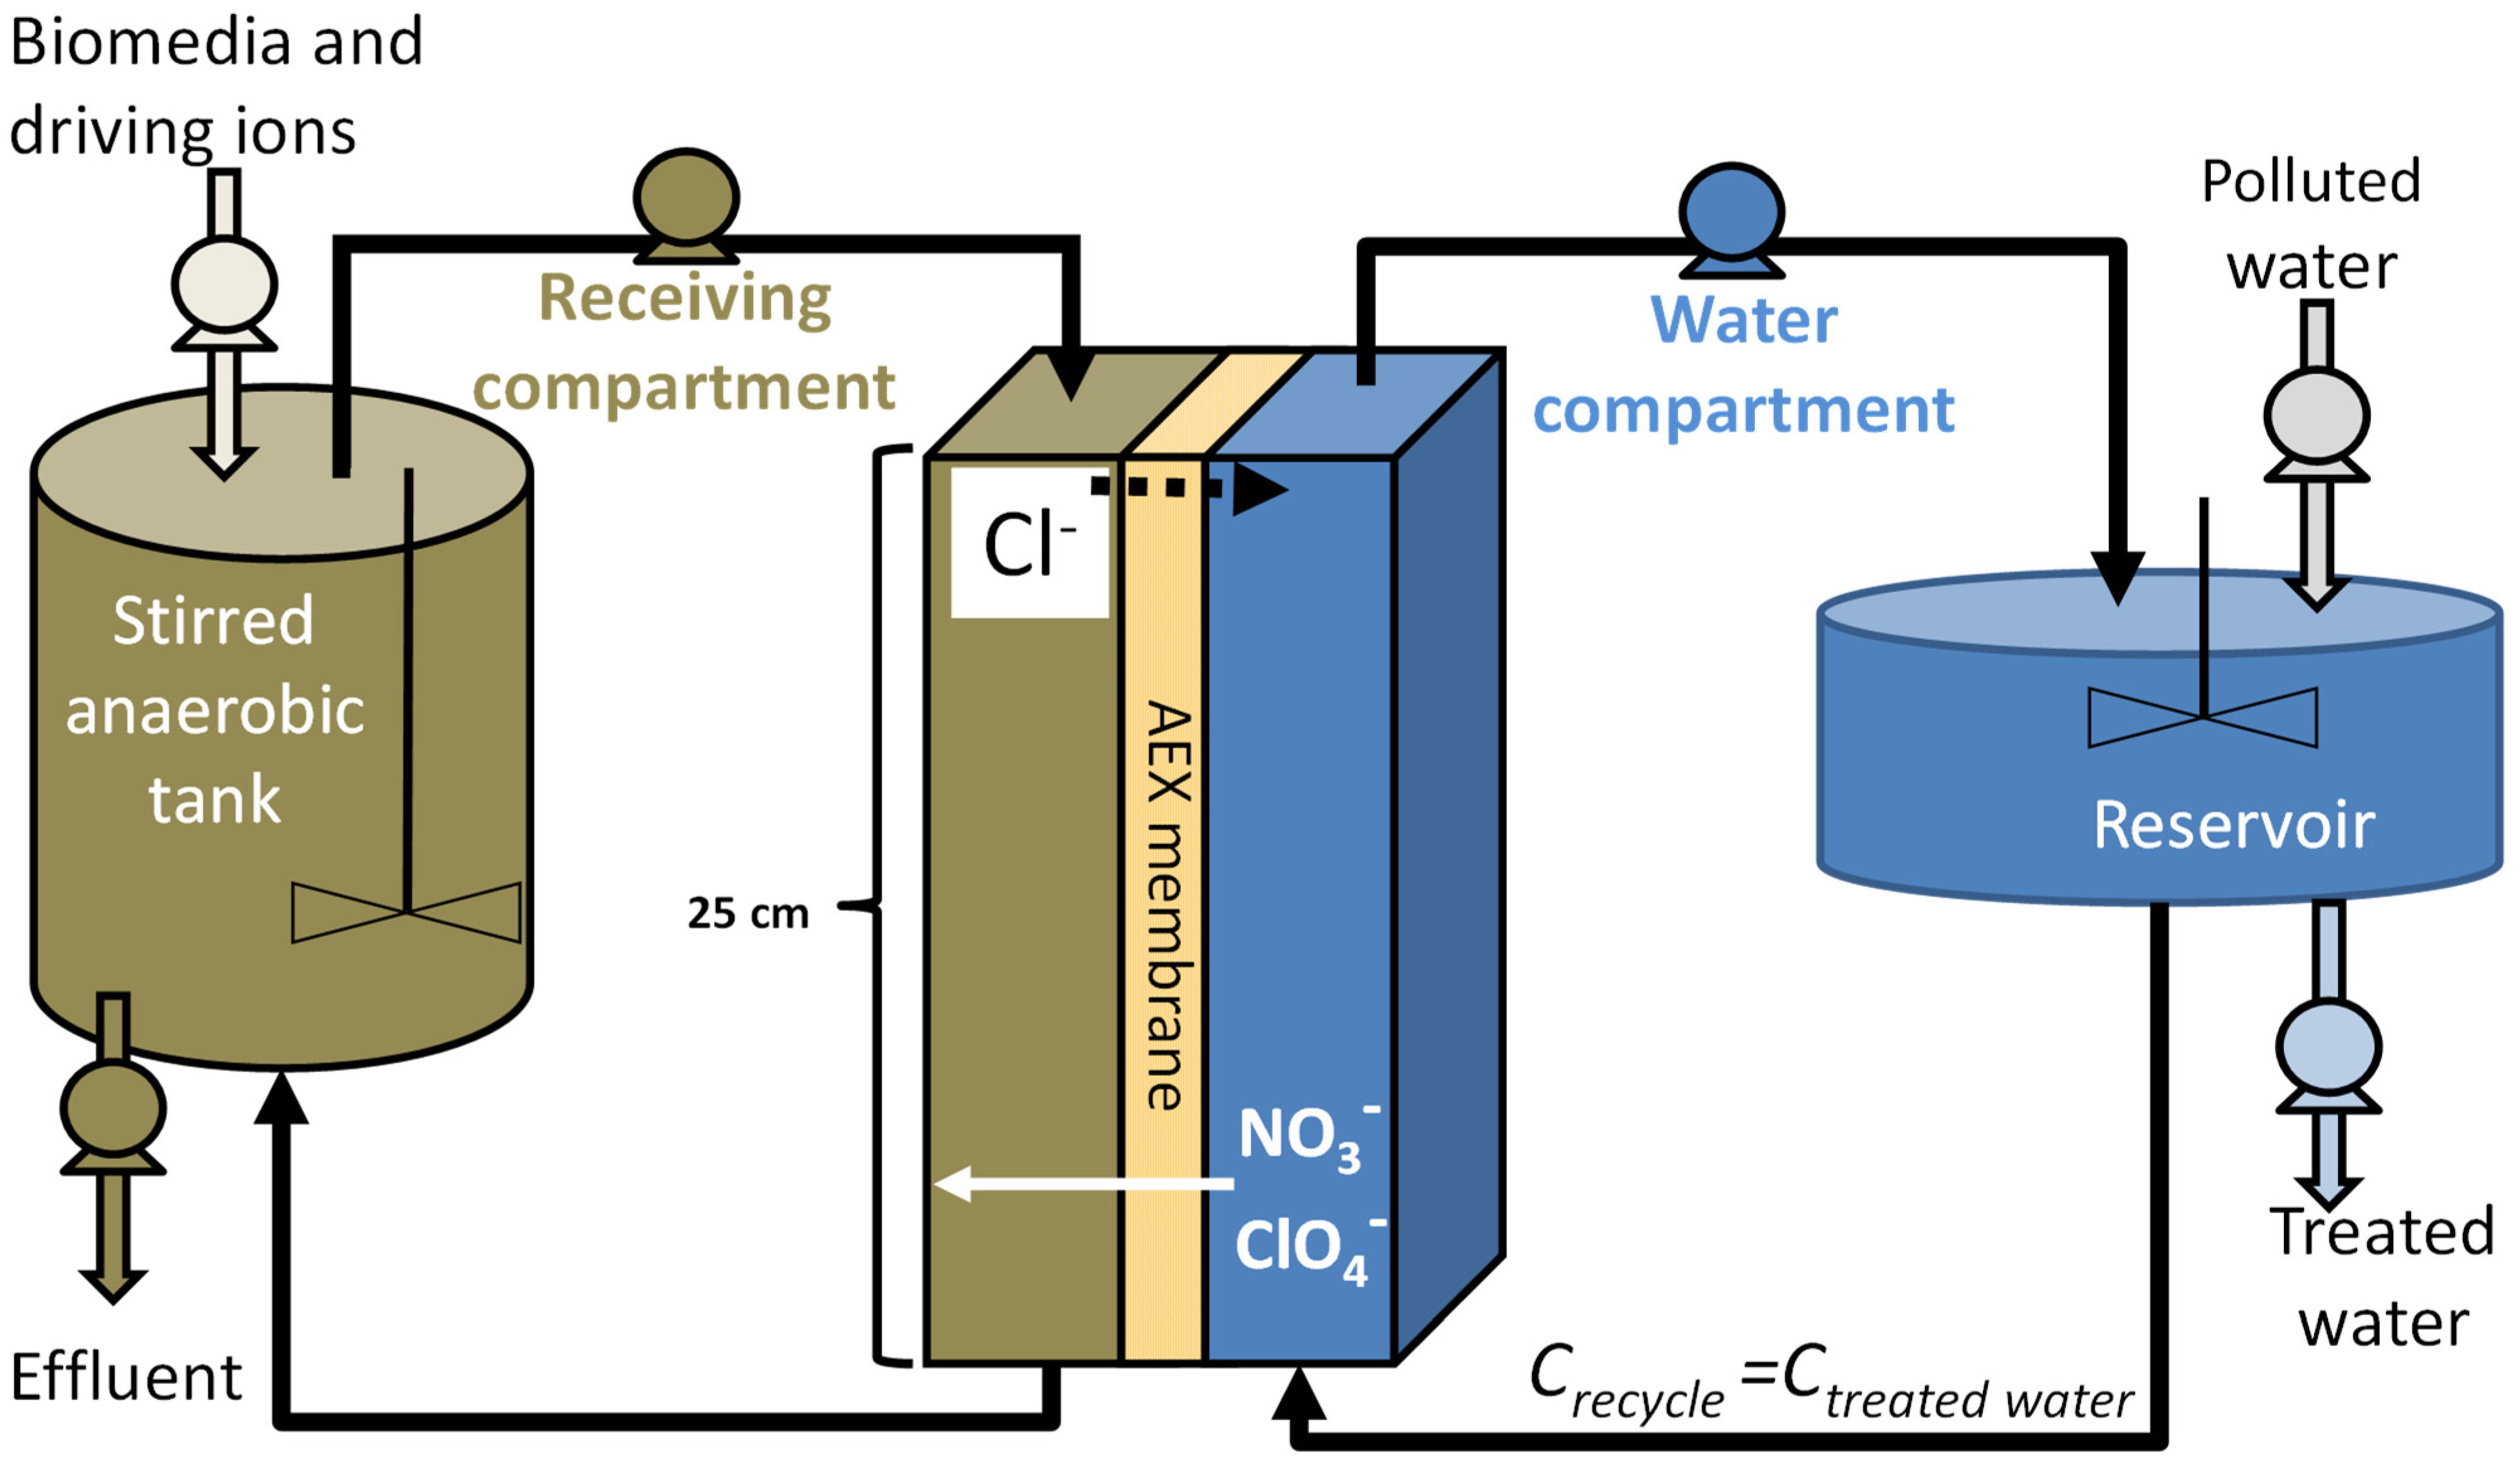
3.3. Experimental Setup
3.3.1. Feed and Bleed CSTR Donnan Dialysis Contactor
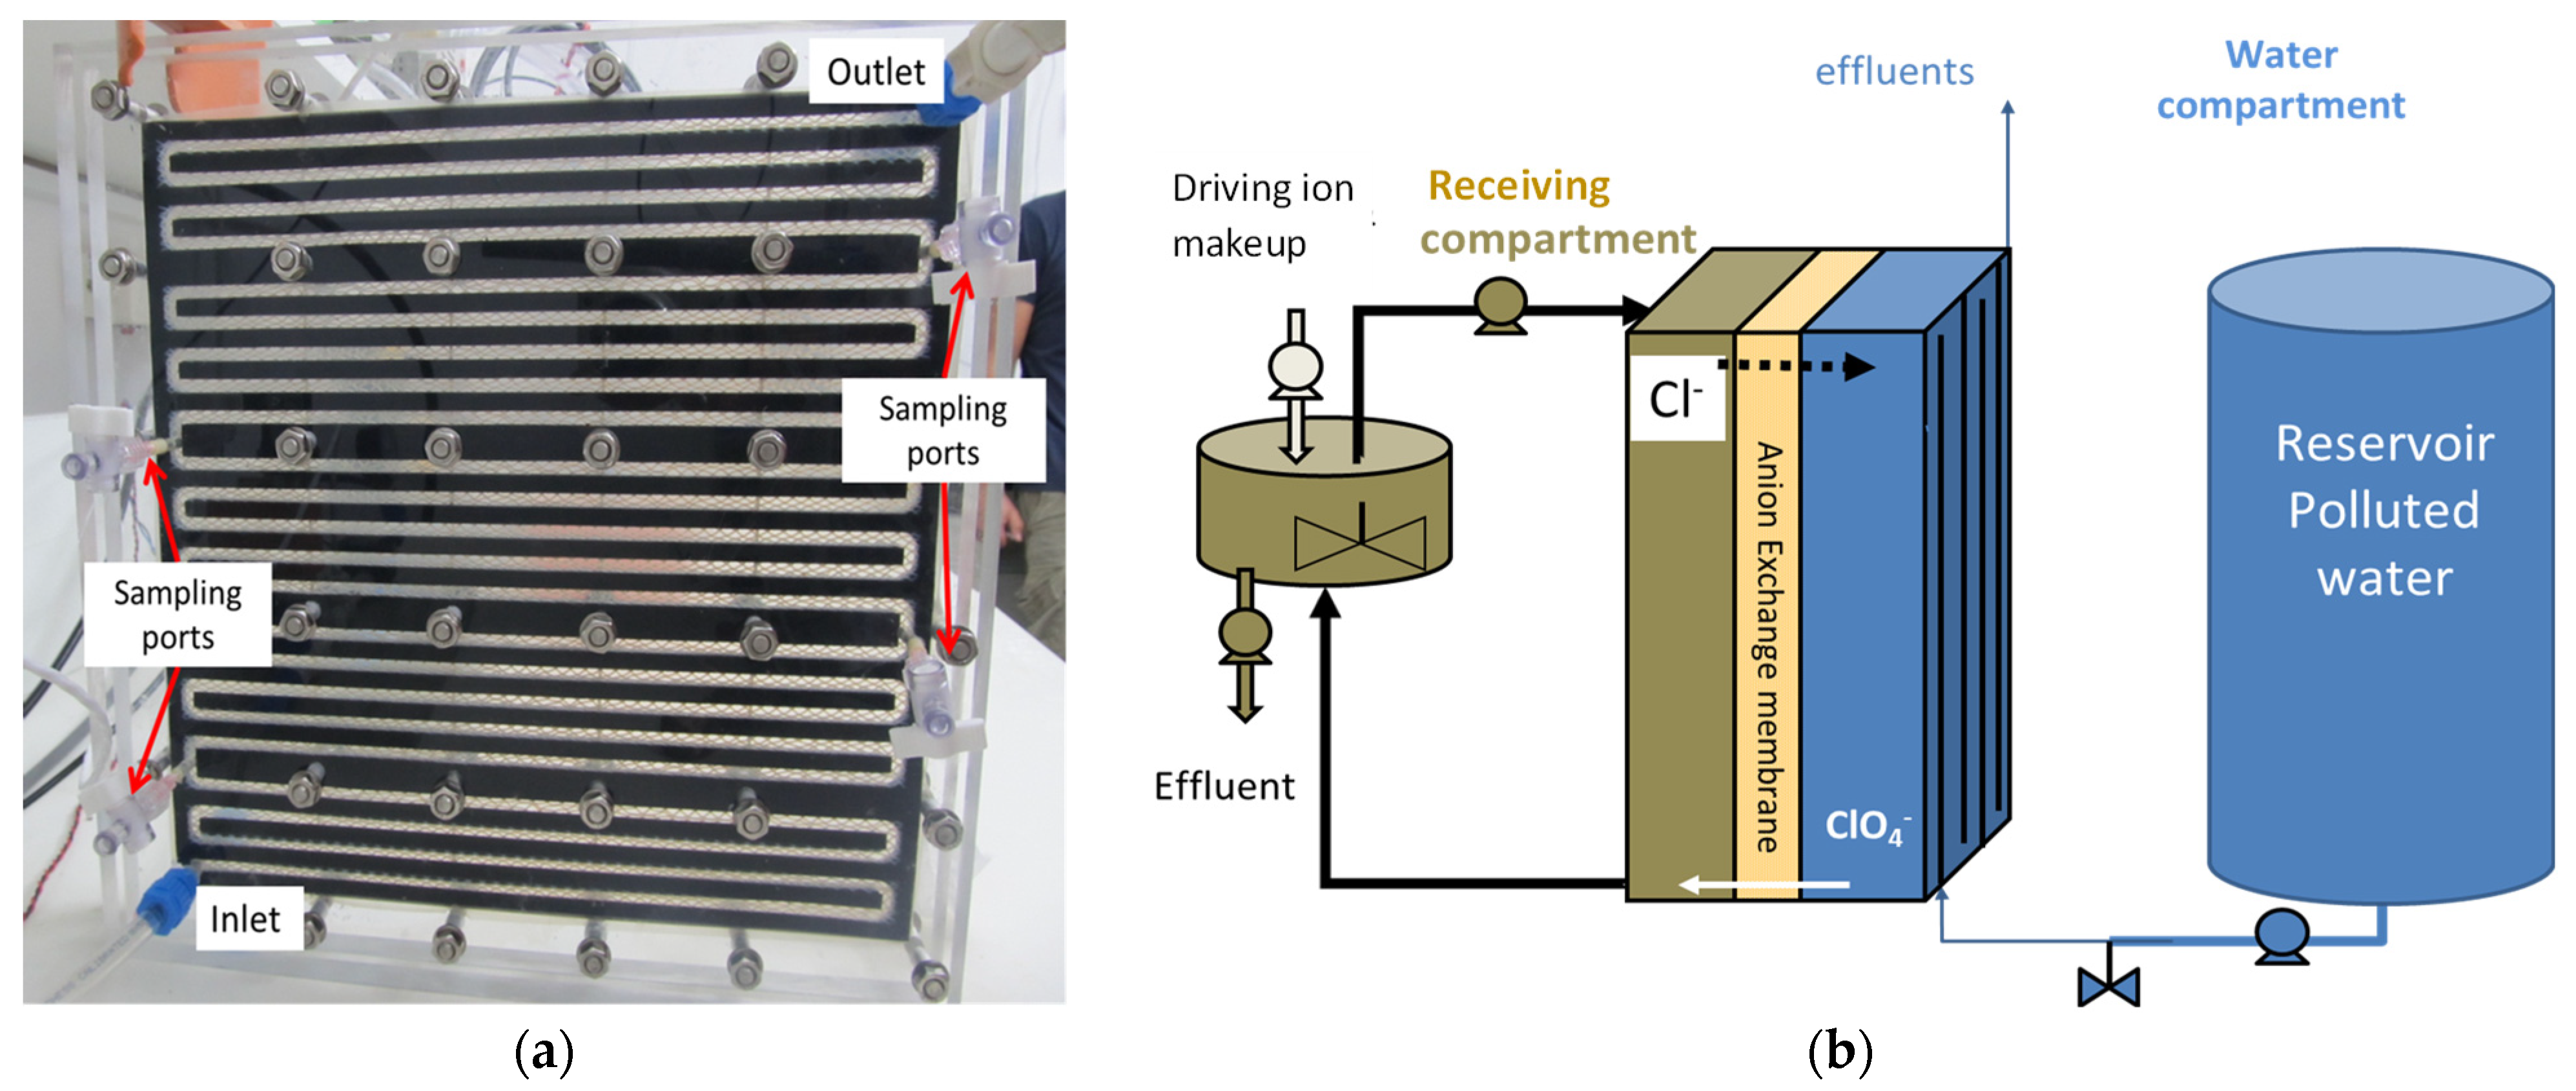
3.3.2. The Plug Flow Contactor
4. Results
4.1. CSTR Operation and Adsorption Isotherms
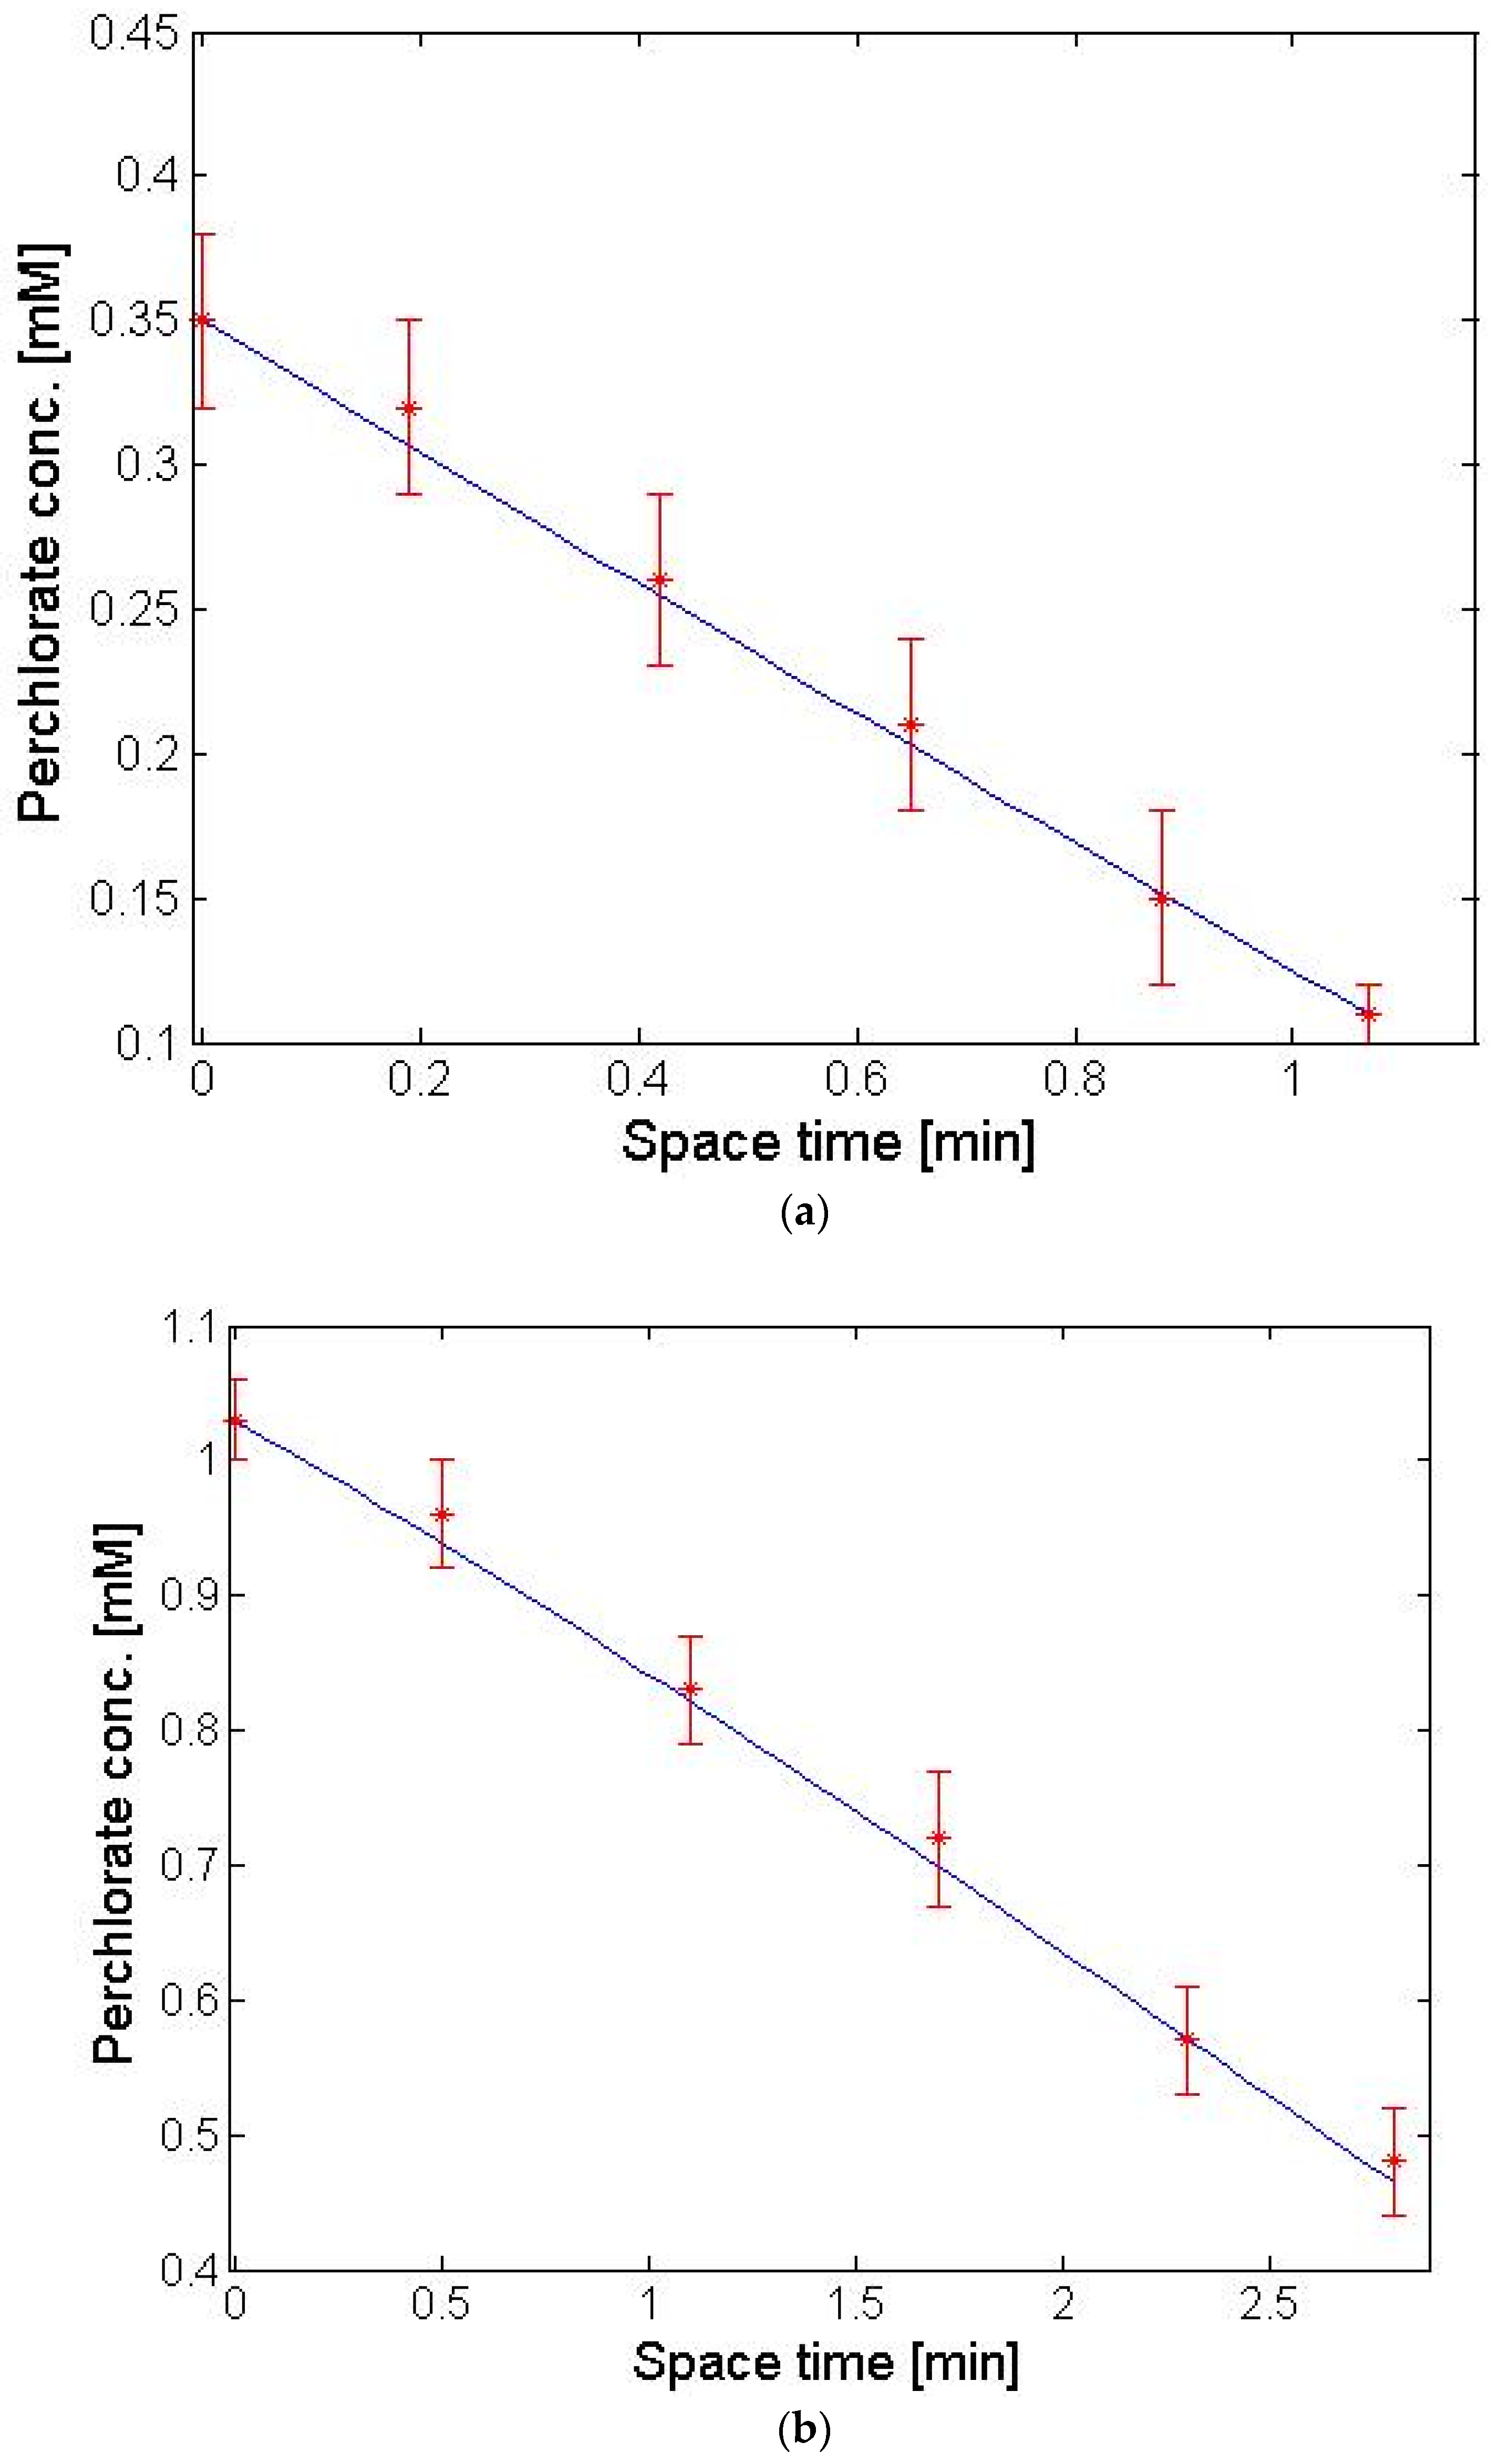
4.2. PFR Results for ACS Membrane
4.3. PFR Results for PCA-100 Membrane
5. Conclusions
Supplementary Materials
Author Contributions
Funding
Data Availability Statement
Conflicts of Interest
Nomenclature
| aTA | Overall target anion permeability, defined in Equation (5) |
| Am | Membrane area, m2 |
| 1/PSo | Membrane mass transfer resistance, h-m2/meq |
| Overall mass transfer coefficient, h-m2/meq | |
| C+ | Concentration of cations, meq/L |
| CCl,1 | Concentration of chloride in feed solution, meq/L |
| CCl,2 | Concentration of chloride in receiver solution, meq/L |
| Concentration in the membrane, meq/L | |
| dh | Hydraulic diameter, cm |
| Dc | Diffusivity coefficient of target ion, m2/s |
| Diffusivity coefficient of ion in the membrane, m2/s | |
| F | Target anion loading rate, mmol/h |
| h | Channel height, cm |
| Ion flux from water compartment to bio-compartment, meq/m2-h | |
| kd | Film-side mass transfer coefficient, m/h |
| Lm | Membrane thickness, cm |
| Pso | Membrane permeability for anion, meq/m2-h |
| Q | Flow rate, cm3/s |
| Re | Reynolds number |
| S | Effective membrane area, cm2 |
| Sc | Schmidt number |
| u | Flow velocity, cm/s |
| V1 | Feed volume, cm3 |
| V2 | Receiver volume, cm3 |
| x | Distance from feed channel entrance, cm |
| Xm | Fixed charge density in anion exchange membrane, meq/L |
| y | Equivalent fraction in solution |
| ym | Equivalent fraction in membrane |
| ω | Slit flow channel width, cm |
| α | Reynolds number exponent |
| τ | Space-time, s |
| Subscripts | |
| 1 | Feed-solution side |
| 2 | Receiving-solution side |
| A | Contaminant ion |
| B | Driving ion |
| f | Feed |
| m | Pertaining to anion exchange membrane |
| o | Initial value |
| TA | Target anion |
References
- Logan, B. A review of chlorate-and perchlorate-respiring microorganisms. Bioremediat. J. 1998, 2, 37–41. [Google Scholar] [CrossRef]
- Urbansky, E.T. Perchlorate as an environmental contaminant. Environ. Sci. Pollut. Res. Int. 2002, 9, 187–192. [Google Scholar] [CrossRef]
- Bardiya, N.; Bae, J.-H. Dissimilatory perchlorate reduction: A review. Microbiol. Res. 2011, 166, 237–254. [Google Scholar] [CrossRef]
- Ma, H.; Bonnie, N.A.; Yu, M.; Che, S.; Wang, Q. Biological treatment of ammonium perchlorate-contaminated wastewater: A review. J. Water Reuse. Desalin. 2015, 6, jwrd2015016. [Google Scholar] [CrossRef]
- Park, J.W.; Rinchard, J.; Liu, F.; Anderson, T.A.; Kendall, R.J.; Theodorakis, C.W. The thyroid endocrine disruptor perchlorate affects reproduction, growth, and survival of mosquitofish. Ecotoxicol. Environ. Saf. 2006, 63, 343–352. [Google Scholar] [CrossRef]
- Motzer, W.E. Perchlorate: Problems, detection, and solutions. Environ. Forensics 2001, 2, 301–311. [Google Scholar] [CrossRef]
- Tipton, D.D.K.; Rolston, D.E.; Scow, K.M. Transport and biodegradation of perchlorate in soils. J. Environ. Qual. 2003, 32, 40–46. [Google Scholar] [CrossRef]
- Xu, J.; Song, Y.; Min, B.; Steinberg, L.; Logan, B.E. Microbial degradation of perchlorate: Principles and applications. Environ. Eng. Sci. 2003, 20, 405–422. [Google Scholar] [CrossRef]
- Srinivasan, R.; Sorial, G.A. Treatment of perchlorate in drinking water: A critical review. Sep. Purif. Technol. 2009, 69, 7–21. [Google Scholar] [CrossRef]
- Urbansky, E.T. Perchlorate Chemistry: Implications for analysis and remediation. Bioremediat. J. 1998, 2, 81–95. [Google Scholar] [CrossRef]
- Seyfferth, A.L.; Parker, D.R. Determination of low levels of perchlorate in lettuce and spinach using ion chromatography-electrospray ionization mass spectrometry (IC-ESI-MS). J. Agric. Food Chem. 2006, 54, 2012–2017. [Google Scholar] [CrossRef]
- USEPA. Edition of the Drinking Water Standards and Health Advisories; USEPA: Washington, DC, USA, 2012.
- Brown, G.; Gu, B. The Chemistry of Perchlorate in the Environment. In Perchlorate: Environmental Occurrence, Interactions and Treatment; Gu, B., Coates, J., Eds.; Springer: Berlin/Heidelberg, Germany, 2006; pp. 17–47. ISBN 978-0-387-31114-2. [Google Scholar]
- Ye, L.; You, H.; Yao, J.; Su, H. Water treatment technologies for perchlorate: A review. Desalination 2012, 298, 1–12. [Google Scholar] [CrossRef]
- Gal, H.; Weisbrod, N.; Dahan, O.; Ronen, Z.; Nativ, R. Perchlorate accumulation and migration in the deep vadose zone in a semiarid region. J. Hydrol. 2009, 378, 142–149. [Google Scholar] [CrossRef]
- Adar, E.; Nativ, R. Soil and Groundwater Contamination in the Ramat Hasharon Area; Annual Scientific Report Submitted to the Water Authority; Ministry of Infra Structure: Tel Aviv, Israel, 2008.
- World Health Organization. Nitrate and Nitrite in Drinking-Water: WHO Guidelines for Drinking-Water Quality; World Health Organization: Geneva, Switzerland, 2011.
- Archna; Sharma, S.K.; Sobti, R.C. Nitrate removal from ground water: A review. E-J. Chem. 2012, 9, 1667–1675. [Google Scholar] [CrossRef]
- Ahn, S.C.; Oh, S.-Y.; Cha, D.K. Enhanced reduction of nitrate by zero-valent iron at elevated temperatures. J. Hazard. Mater. 2008, 156, 17–22. [Google Scholar] [CrossRef] [PubMed]
- Hatzinger, P.B.; Greene, M.R.; Frisch, S.; Togna, A.P. Biological treatment of perchlorate-contaminated groundwater using fluidized bed reactors. In Proceedings of the 2nd International Conference on Remediation of Chlorinated and Recalcitrant Compounds, Denver, CO, USA, 2–6 June 2000; pp. 1–8. [Google Scholar]
- Webster, T.S.; Guarini, W.J.; Wong, H.S. Fluidized bed bioreactor treatment of perchlorate-laden groundwater to potable standards. J. Am. Water Work. Assoc. 2009, 101, 137–151. [Google Scholar] [CrossRef]
- Sahu, A.K.; Conneely, T.; Nüsslein, K.R.; Ergas, S.J. Biological Perchlorate Reduction in Packed Bed Reactors Using Elemental Sulfur. Environ. Sci. Technol. 2009, 43, 4466–4471. [Google Scholar] [CrossRef] [PubMed]
- Chung, J.; Nerenberg, R.; Rittmann, B.E. Evaluation for Biological Reduction of Nitrate and Perchlorate in Brine Water Using the Hydrogen-Based Membrane Biofilm Reactor. J. Environ. Eng. 2007, 133, 157–164. [Google Scholar] [CrossRef]
- Nerenberg, R. The membrane-biofilm reactor (MBfR) as a counter-diffusional biofilm process. Curr. Opin. Biotechnol. 2016, 38, 131–136. [Google Scholar] [CrossRef] [PubMed]
- Evans, P.; Berokoff, D.; Rittman, B.; Ontiveros-valencia, A.; Kim, B.; Krajmalnik-brown, R. Perchlorate Destruction and Potable Water Production Using Membrane Biofilm Reduction and Membrane Filtration; ESTCP Project ER-200541; ESTCP: Alexandria, VA, USA, 2013.
- Roy, H.; Rahman, T.U.; Tasnim, N.; Arju, J.; Rafid, M.M.; Islam, M.R.; Pervez, M.N.; Cai, Y.; Naddeo, V.; Islam, M.S. Microbial Fuel Cell Construction Features and Application for Sustainable Wastewater Treatment. Membranes 2023, 13, 490. [Google Scholar] [CrossRef] [PubMed]
- Thrash, J.C.; Van Trump, J.I.; Weber, K.A.; Miller, E.; Achenbach, L.A.; Coates, J.D. Electrochemical Stimulation of Microbial Perchlorate Reduction. Environ. Sci. Technol. 2007, 41, 1740–1746. [Google Scholar] [CrossRef] [PubMed]
- Velizarov, S.; Crespo, J.G.; Reis, M.A. Ion Exchange Membrane Bioreactor for Selective Removal of Nitrate from Drinking Water: Control of Ion Fluxes and Process Performance. Biotechnol. Prog. 2002, 18, 296–302. [Google Scholar] [CrossRef]
- Fox, S.; Oren, Y.; Ronen, Z.; Gilron, J. Ion exchange membrane bioreactor for treating groundwater contaminated with high perchlorate concentrations. J. Hazard. Mater. 2014, 264, 552–559. [Google Scholar] [CrossRef] [PubMed]
- Fox, S.; Bruner, T.; Oren, Y.; Gilron, J.; Ronen, Z. Concurrent microbial reduction of high concentrations of nitrate and perchlorate in an ion exchange membrane bioreactor. Biotechnol. Bioeng. 2016, 113, 1881–1891. [Google Scholar] [CrossRef] [PubMed]
- Verma, A.K.; Oren, Y.; Gilron, J.; Ronen, Z. An investigation on the ion exchange membrane bioreactor with a spiral wound contactor for nitrate removal from contaminated groundwater. Desalination 2022, 542, 116080. [Google Scholar] [CrossRef]
- Verma, A.K.; Akodwaa-Boadi, K.; Ronen, Z.; Oren, Y.; Gilron, J. Studies with spiral wound Donnan dialysis contactor for nitrate removal from contaminated water. J. Water Process Eng. 2023; in press. [Google Scholar] [CrossRef]
- Ricardo, A.R.; Carvalho, G.; Velizarov, S.; Crespo, J.G.; Reis, M.A.M. Kinetics of nitrate and perchlorate removal and biofilm stratification in an ion exchange membrane bioreactor. Water Res. 2012, 46, 4556–4568. [Google Scholar] [CrossRef]
- Matos, C.T.; Velizarov, S.; Crespo, J.G.; Reis, M.A.M. Simultaneous removal of perchlorate and nitrate from drinking water using the ion exchange membrane bioreactor concept. Water Res. 2006, 40, 231–240. [Google Scholar] [CrossRef]
- Velizarov, S.; Reis, M.A.; Crespo, J.G. Removal of trace mono-valent inorganic pollutants in an ion exchange membrane bioreactor: Analysis of transport rate in a denitrification process. J. Memb. Sci. 2003, 217, 269–284. [Google Scholar] [CrossRef]
- Fonseca, A.D.; Crespo, J.G.; Almeida, J.S.; Reis, M.A. Drinking water denitrification using a novel ion-exchange membrane bioreactor. Environ. Sci. Technol. 2000, 34, 1557–1562. [Google Scholar] [CrossRef]
- Matos, C.T.; Velizarov, S.; Reis, M.A.M.; Crespo, J.G. Removal of bromate from drinking water using the ion exchange membrane bioreactor concept. Environ. Sci. Technol. 2008, 42, 7702–7708. [Google Scholar] [CrossRef]
- Velizarov, S.; Rodrigues, C.M.; Reis, M.A.; Crespo, J.G. Mechanism of charged pollutants removal in an ion exchange membrane bioreactor: Drinking water denitrification. Biotechnol. Bioeng. 2000, 71, 245–254. [Google Scholar] [CrossRef]
- Ricardo, A.R.; Velizarov, S.; Crespo, J.G.; Reis, M.A.M. Multivariate analysis of the transport in an Ion Exchange Membrane Bioreactor for removal of anionic micropollutants from drinking water. Water Sci. Technol. 2011, 63, 2207. [Google Scholar] [CrossRef] [PubMed]
- Matos, C.T.; Fortunato, R.; Velizarov, S.; Reis, M.A.M.; Crespo, J.G. Removal of mono-valent oxyanions from water in an ion exchange membrane bioreactor: Influence of membrance permselectivity. Water Res. 2008, 42, 1785–1795. [Google Scholar] [CrossRef] [PubMed]
- Hasson, D.; Beck, A.; Fingerman, F.; Tachman, C.; Shemer, H.; Semiat, R. Simple Model for Characterizing a Donnan Dialysis Process. Ind. Eng. Chem. Res. 2014, 53, 6094–6102. [Google Scholar] [CrossRef]
- Ring, S.; Hasson, D.; Shemer, H.; Semiat, R. Simple modeling of Donnan separation processes. J. Memb. Sci. 2015, 476, 348–355. [Google Scholar] [CrossRef]
- Hasson, D.; Ring, S.; Semiat, R.; Shemer, H. Simple modeling of Donnan separation processes: Single and multicomponent feed solutions. Sep. Sci. Technol. 2020, 55, 1216–1226. [Google Scholar] [CrossRef]
- Miyoshi, H. Diffusion coefficients of ions through ion-exchange membranes for Donnan dialysis using ions of the same valence. Chem. Eng. Sci. 1997, 52, 1087–1096. [Google Scholar] [CrossRef]
- Nwal Amang, D.; Alexandrova, S.; Schaetzel, P. Mass transfer characterization of Donnan dialysis in a bi-ionic chloride-nitrate system. Chem. Eng. J. 2004, 99, 69–76. [Google Scholar] [CrossRef]
- Farkash, L. Characterization and Optimization of Biofilm Treating High Oxy-Anions Fluxes Using Ion Exchange Membrane Bioreactor (IEMB). Master’s Thesis, Ben-Gurion University of the Negev, Midreshet Ben-Gurion, Israel, 2017. [Google Scholar]
- Blaedel, W.J.; Haupert, T.J.; Evenson, M.A. Mechanism of Trace Counterion Transport through ion-Exchange Membranes. Anal. Chem. 1969, 41, 583–590. [Google Scholar] [CrossRef]
- Schock, G.; Miquel, A. Mass transfer and pressure loss in spiral wound modules. Desalination 1987, 64, 339–352. [Google Scholar] [CrossRef]


| Membrane | Water Uptake (WU) (%) | IEC (meq g−1), Dry Weight |
|---|---|---|
| ACS-Neosepta-sample 1 | 24.17 | 1.91 |
| ACS-Neosepta-sample 2 | 24.70 | 1.99 |
| PCA-100-sample 1 | 29.62 | 1.99 |
| PCA-100-sample 2 | 29.47 | 2.07 |
| Operating Parameter | Membrane Tested | |||
|---|---|---|---|---|
| ACS | PCA-100 | |||
| Feed side | Receiving side | Feed Side | Receiving side | |
| 1. Polluted feed flow rate, mL/h | 19.2–25.2 | 13.8–144 | 22–82 | 122–358 |
| 2. Recycle rate, mL/min | 1600 | 1200–1550 | 1500 | 1500 |
| 3. Reservoir HRT, h | 5.2–14 | 0.75–6.25 | 4.4–16.2 | 4.9–17 |
| 4. Contactor residence time, min | 0.007 | 0.007–0.009 | 0.0075 | 0.0075 |
| 5. Perchlorate experiments, | ||||
| [Cl−]in, meq/L | 3.52 | 109.4 | 5 | 100 |
| [ClO4−]in, meq/L | 0.2–2.5 | 0 | 1.2–16.8 | 0 |
| 6. Nitrate experiments, | ||||
| [Cl−]in, meq/L | 3.52 | 109.4 | 5 | 100 |
| [NO3−]in, meq/L | 0.01–0.92 | 0 | 0.73–10.9 | 0 |
| 7. Perchlorate/Nitrate, | ||||
| [Cl−]in, meq/L | 3.52 | 109.4 | 7–7.5 | 100 |
| [NO3−]in, meq/L | 0.01–1.2 | 0 | 1.2–16.8 | 0.0 |
| [ClO4−]in, meq/L | 1 | 0 | 0.73–10.9 | 0.0 |
| Length [cm] | Width [cm] | Depth [cm] | Compartment Volume [cm3] | Sampling Ports | |
|---|---|---|---|---|---|
| Feed compartment | 588 | 0.5 | 6 | ||
| Version 1 ACS membrane | 0.13 | 38.2 | |||
| Version 2 PC-100 membrane | 0.35 | 103 | |||
| Receiver compartment | 588 | 0.5 | 0.5 | 3500 a | 2 |
| Operating Parameter | Membrane Used | |||
|---|---|---|---|---|
| PFR VS 1 | PFR VS 2 | |||
| ACS | PCA-100 | |||
| Feed side | Receiving side | Feed Side | Receiving side | |
| 1. Flow rate a, mL/min | 10–30 | 10–25 | 18–72 | 47–50 |
| 2. Recycle rate, mL/min | 0 | 850 | 0 | 850 |
| 3. Contactor residence time, min | 1.0–2.9 | 0.16 | 0.4–4.9 | 0.16 |
| 4. Perchlorate experiments, | ||||
| [Cl−]in, meq/L | 0.15–10 | 100 | 5 | 100 |
| [ClO4−]in, meq/L | 0.3, 1.0 | 0 | 1.0 | 0 |
| 5. Nitrate experiments, | ||||
| [Cl−]in, meq/L | 5 | 100 | ||
| [NO3−]in, meq/L | 3.2 | 0 | ||
| 6. Perchlorate/Nitrate, meq/L | ||||
| [Cl−]in, meq/L | 7–7.5 | 100 | ||
| [NO3−]in, meq/L | 3.2 | 0.0 | ||
| [ClO4−]in, meq/L | 1.0 | 0.0 | ||
| Same Loading and Different Inlet Concentrations | Same Inlet Concentrations and Different Loading | |||
|---|---|---|---|---|
| CONFIGURATION | PFR | CSTR | PFR | CSTR |
| Inlet conc (mM) | 0.31 | 0.99 | 1.03 | 0.99 |
| Outlet conc (mM) (=average conc for CSTR) | 0.018 | 0.136 | 0.480 | 0.136 |
| Log mean [mM] | 0.102 | 0.136 | 0.719 | 0.136 |
| F/Am [mM m−2 h−1] normalized loading | 6.7 | 6.4 | 21.9 | 6.4 |
| Avg channel J specific flux [mM m−2 h−1] | 6.4 | 5.5 | 11.8 | 5.5 |
| Removal efficiency for water comp (load in–load out)/load in | 94.4% | 86.2% | 53.2% | 86.2% |
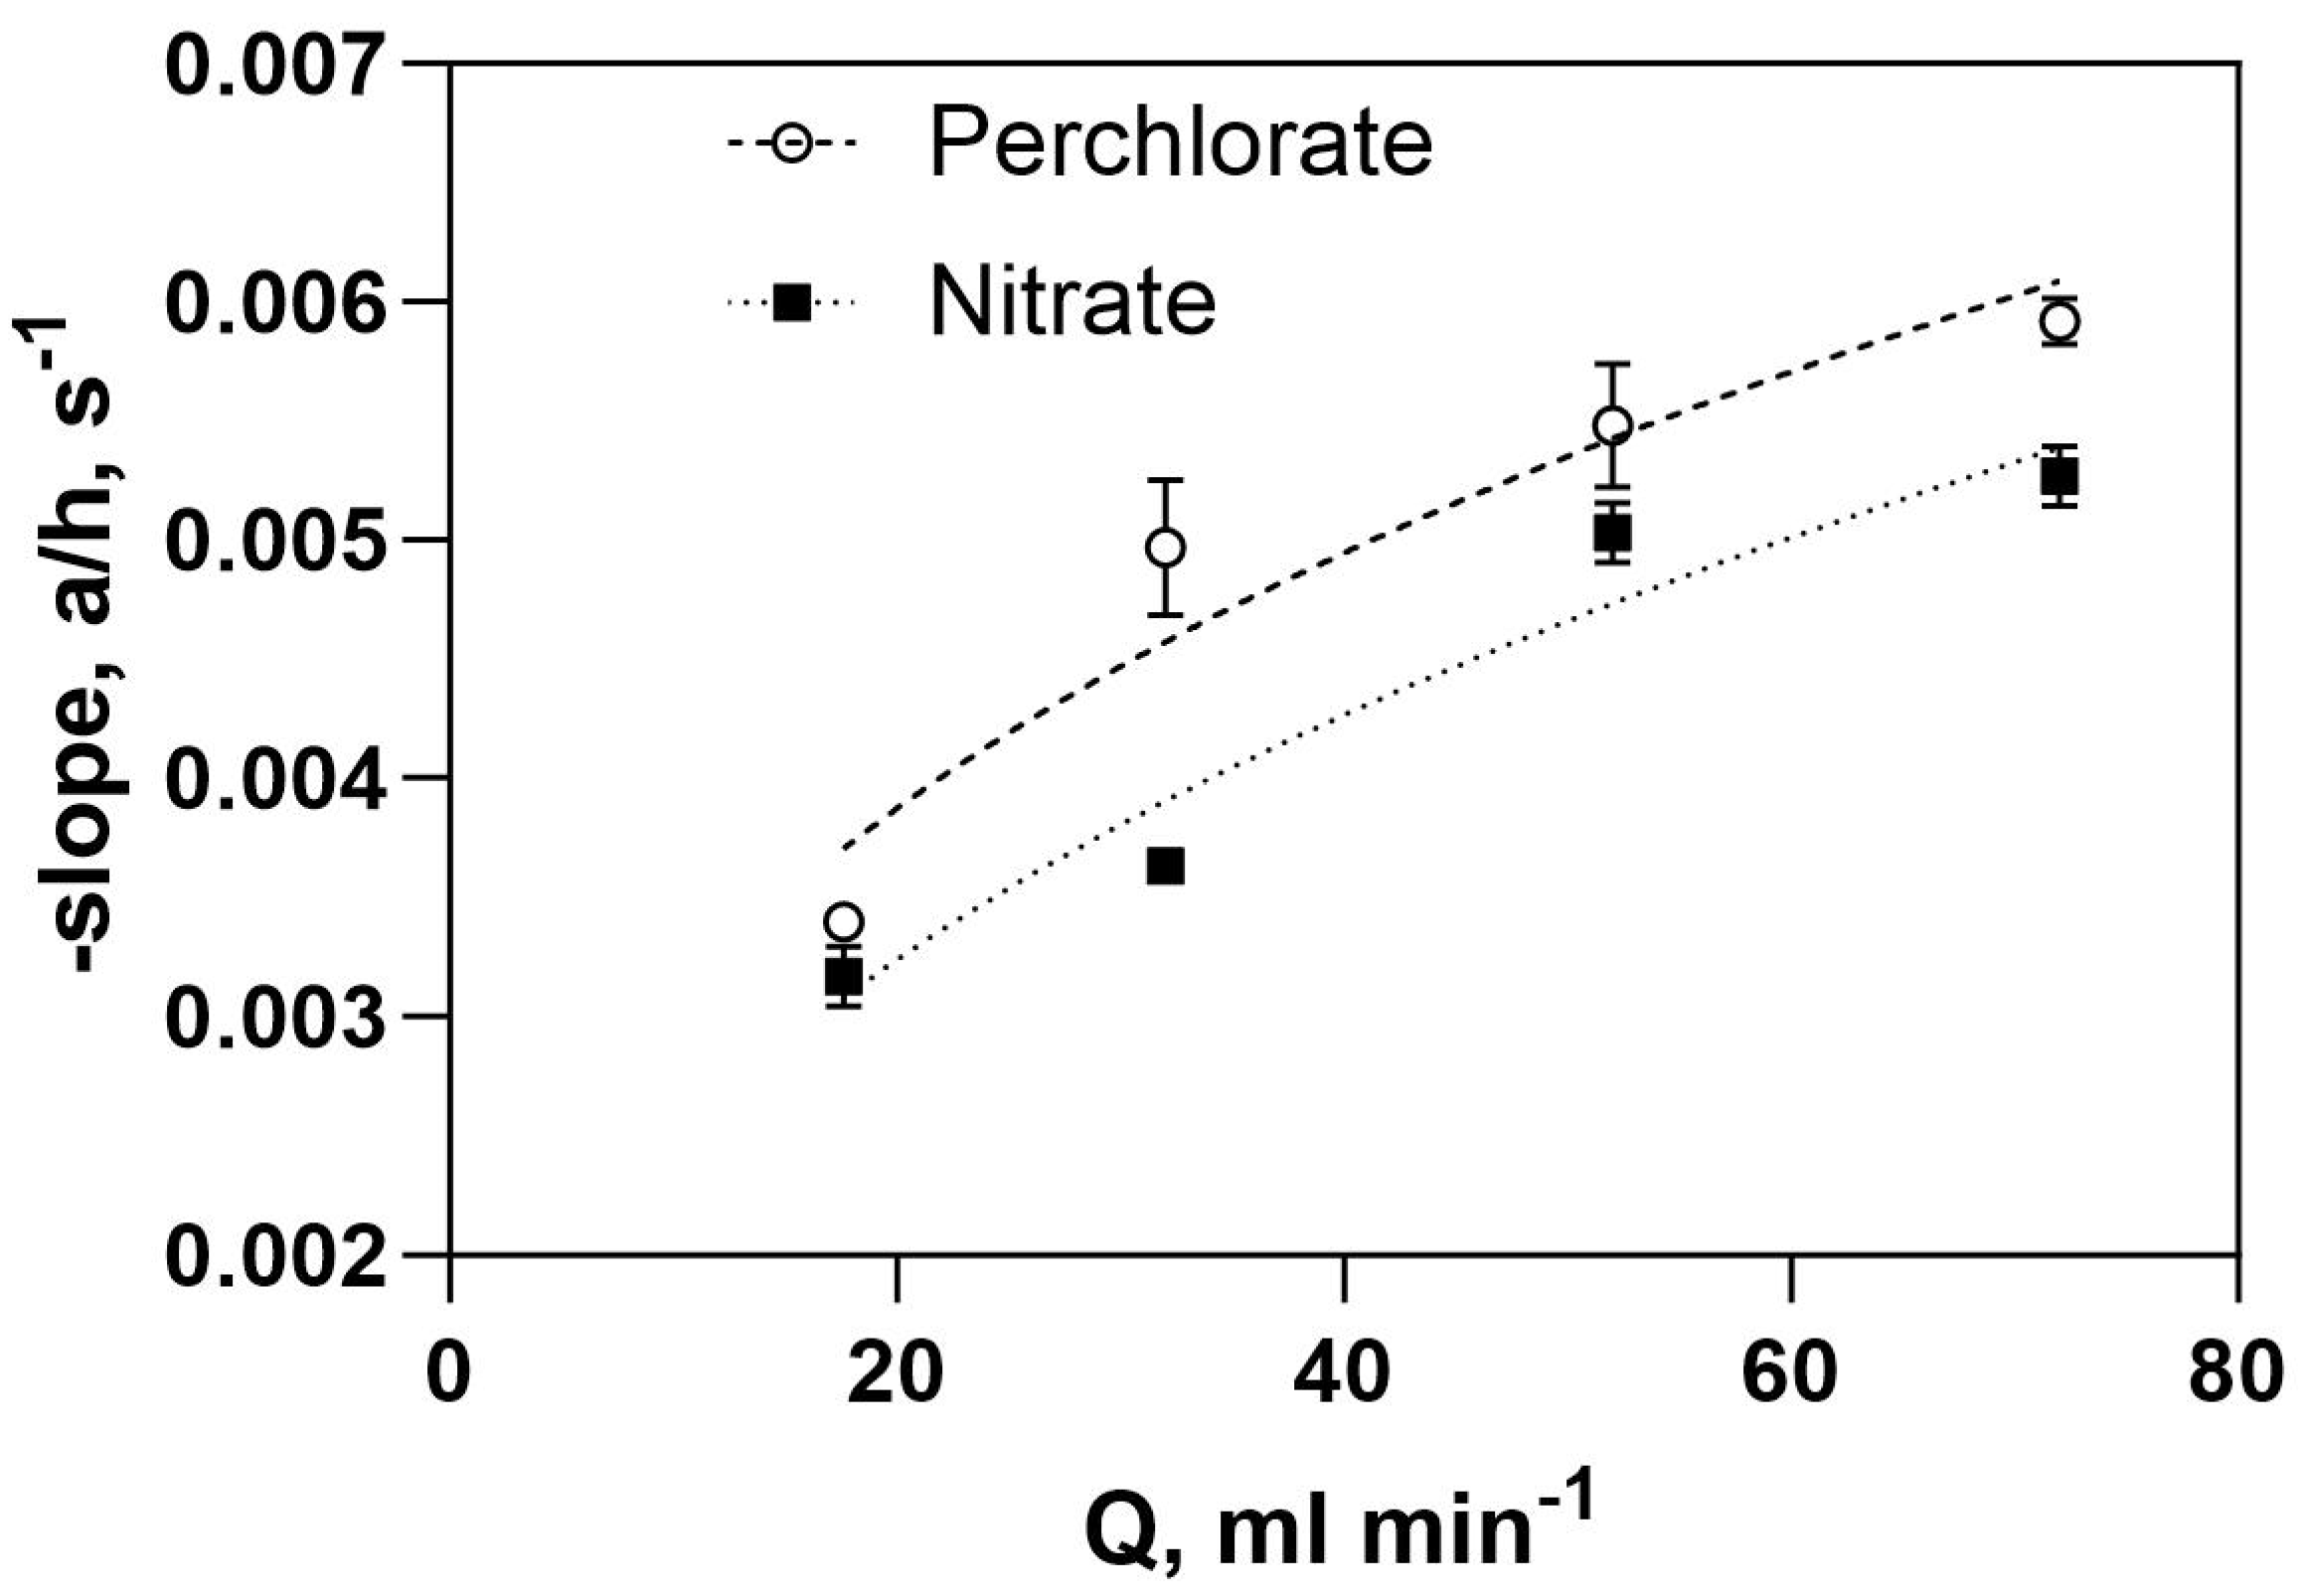
| 1000 × -mTA. s−1 | ||
|---|---|---|
| Q (mL/min) | NO3− | ClO4− |
| 17.6 | 3.10 | 3.40 |
| 32 | 3.63 | 4.97 |
| 52 | 4.78 | 5.48 |
| 72 | 5.07 | 5.82 |
Disclaimer/Publisher’s Note: The statements, opinions and data contained in all publications are solely those of the individual author(s) and contributor(s) and not of MDPI and/or the editor(s). MDPI and/or the editor(s) disclaim responsibility for any injury to people or property resulting from any ideas, methods, instructions or products referred to in the content. |
© 2023 by the authors. Licensee MDPI, Basel, Switzerland. This article is an open access article distributed under the terms and conditions of the Creative Commons Attribution (CC BY) license (https://creativecommons.org/licenses/by/4.0/).
Share and Cite
Fox, S.; Stadnik, K.; Thakur, A.K.; Farkash, L.; Ronen, Z.; Oren, Y.; Gilron, J. Oxyanion Removal from Impaired Water by Donnan Dialysis Plug Flow Contactors. Membranes 2023, 13, 856. https://doi.org/10.3390/membranes13110856
Fox S, Stadnik K, Thakur AK, Farkash L, Ronen Z, Oren Y, Gilron J. Oxyanion Removal from Impaired Water by Donnan Dialysis Plug Flow Contactors. Membranes. 2023; 13(11):856. https://doi.org/10.3390/membranes13110856
Chicago/Turabian StyleFox, Shalom, Kristina Stadnik, Amit K. Thakur, Lior Farkash, Zeev Ronen, Yoram Oren, and Jack Gilron. 2023. "Oxyanion Removal from Impaired Water by Donnan Dialysis Plug Flow Contactors" Membranes 13, no. 11: 856. https://doi.org/10.3390/membranes13110856
APA StyleFox, S., Stadnik, K., Thakur, A. K., Farkash, L., Ronen, Z., Oren, Y., & Gilron, J. (2023). Oxyanion Removal from Impaired Water by Donnan Dialysis Plug Flow Contactors. Membranes, 13(11), 856. https://doi.org/10.3390/membranes13110856