Abstract
Genome replication of coronaviruses takes place in specific cellular compartments, in so-called double-membrane vesicles (DMVs), formed from the endoplasmic reticulum (ER). An intensive production of DMVs is induced by non-structural viral proteins. Here, we proposed a possible mechanism of the DMV formation from ER-derived spherical vesicles where liquid-ordered and liquid-disordered lipid phases coexist. These vesicles are supposed to divide into two homogeneous liquid-ordered and liquid-disordered vesicles. The formation of two spherical vesicles constituting DMV requires a mechanical work to be performed. We considered the excess energy of the boundary between the coexisting lipid phases as the main driving force behind the division of the initial vesicle. Explicitly accounting for the energy of elastic deformations and the interphase boundary energy, we analyzed a range of physical parameters where the DMV formation is possible. We concluded that this process can principally take place in a very narrow range of system parameters. The most probable diameter of DMVs formed according to the proposed mechanism appeared to be approximately 220 nm, in an agreement with the average diameter of DMVs observed in vivo. Our consideration predicts the DMV size to be strongly limited from above. The developed analysis can be utilized for the production of DMVs in model systems.
1. Introduction
Enveloped viruses possess a bilayer lipid membrane shell, along with a protein capsid defending the genetic material of the virion. The genetic material of intact virions is separated from a cell cytoplasm by two membranes: the cellular and viral membranes. In order to infect the cell, these membranes have to fuse. In the course of the membrane fusion, a continuous pathway from the viral interior to the cytoplasm is formed [1], and viral genetic material can follow this pathway. A newly formed viral particle inherits its membrane envelope from the membranes of the infected host cell [2]. An intensive replication of the enveloped viruses is accompanied by an impressive rearrangement of the cellular membranes [3,4,5].
Coronaviruses are enveloped, positive single-strand RNA (+RNA) viruses. They remodel host cell membranes by inducing the specific replication organelles, the so-called double-membrane vesicles (DMVs) [3,6,7]. DMVs allow the isolation of the replication machinery and viral genome from the innate immunity system [6,7]. The formation of DMVs is also a stage in the natural cellular process of autophagy [8]. However, in cells infected by coronaviruses, this process is substantially intensified [3,6,7]. In particular, for severe acute respiratory syndrome coronavirus type 2 (SARS-CoV-2), three non-structural viral proteins nsp-3, nsp-4, and nsp-6 are required and sufficient for the intensive production of DMVs [3,6]. In experiments on cryo-electron tomography, it is established that the average diameter of DMVs is approximately 225 ± 39 nm [3], i.e., the distribution of vesicle sizes is rather narrow. DMVs are observed to bud intensively from endoplasmic reticulum (ER) membranes, further forming a reticulovesicular network (RVN) [3]. Late in infection, DMVs are trafficked to lysosomes for degradation [3], as naturally happens in the process of autophagy.
The exact mechanism of the coronavirus-induced formation of DMVs is not well understood. In the theoretical work [9], it is assumed that DMVs are formed from planar double-membrane sheets by bending and self-closure. In this approach, the bending energy of a spherical symmetric membrane is independent on the radius of the sphere and is equal to 16πKc, where Kc is the bending modulus of the lipid monolayer. The bending energy stored in the rim of the double-membrane sheet is proportional to its radius. Thus, at a certain radius of the double-membrane sheet, its elastic energy becomes high enough to transform into two spherical vesicles [9]. The bending of the rim of the double-membrane sheet is supposed to be maintained by specific scaffold proteins. In the course of the sheet-to-DMV transformation, the proteins should adsorb/desorb [9] in a tricky manner, as stationary adsorbed proteins would not allow the release of the elastic energy stored in the rim of the double-membrane sheet. According to this mechanism, the sizes of DMVs should be widely distributed, as there is only a lower critical size that determines the transformation of the double-membrane sheet into the DMV, and there is no upper critical size of this process; indeed, larger double-membrane sheets would yield larger DMVs. The size of double-membrane sheets is determined by the number of recruited scaffolding proteins maintaining the rim of the sheet. This means that, in the absence of a specific protein regulating DMV size, the DMV diameter should be virtually unlimited, in contradiction to the relatively narrow DMV size distribution [3].
The elastic contribution to energy barriers separating distinct stages of the DMV formation should depend on the ordering and phase state of the rearranging membranes; in turn, they are determined by the lipid composition. In the plasma membrane of the mammalian cells and in the ER, specific lipid-protein domains are thought to exist. Domains rich in sphingomyelin and cholesterol are referred to as rafts [10]. In model membranes, raft-like domains are in a liquid-ordered (Lo) state, as opposed to the liquid-disordered (Ld) state of the surrounding membrane [11,12]. The lipid bilayer of rafts is characterized by a moduli of elasticity several times larger than those of the surrounding membrane [13,14]. Lo and Ld phases are bilayers in most cases, i.e., if locally one lipid monolayer is in the Lo state, then the opposing monolayer would also be in the Lo state [11,15,16]. The composition of the inner vesicles of DMVs can be characterized based on the composition of the viral membrane. According to the data of the work [17], the lipid envelope of the coronavirus virions is enriched by cholesterol, phospholipids, sphingomyelin, and phosphatidylinositol. However, elastic rigidities or moduli of elasticity of membranes are mainly determined by lipid tails (fatty acids) rather than lipid polar heads. There is almost no information on the fatty acid composition or ordering state of lipid membranes of coronavirus. However, for another type of enveloped viruses—influenza A virus—it is shown that its membrane is mostly in the Lo state [18]. This observation is in line with the data on the composition of the polar lipid heads of coronavirus membranes, as the Lo state is typical for membranes rich in sphingomyelin, cholesterol and phosphatidylcholines, having at least one saturated tail, e.g., palmitoyl-oleoyl-phosphatidyl-choline (POPC) [12]. The infectivity of coronavirus is shown to decrease several times upon extraction of the cholesterol from the viral membrane by methyl-β-cyclodextrin [19]; the extraction is known to lead to a disruption of Lo domains [20]. This observation in the work [19] may point out that the Lo state of viral membranes is functionally relevant.
Here, we theoretically consider a possible mechanism of DMV formation, starting from the single spherical vesicle. The membrane of the vesicle is assumed to be phase-separated into Lo and Ld lipid phases. Such vesicles can be formed from the membrane of the ER, where the synthesis of lipids and proteins (in particular, raft proteins) takes place. The excess energy of the interphase boundary is considered the main driving force of the vesicle-to-DMV transformation. This energy, related to the unit length of the interphase boundary, is referred to as the line tension, γ. In the phase-separated spherical vesicle of radius R (Figure 1a), a possible way to decrease the energy of the circular interphase boundary of the radius r0, is to buckle a domain of one of the two coexisting phases out from the vesicle sphere, either outward (Figure 1b) or inward (Figure 1d) to the vesicle. In the limiting case of large line tensions, the vesicle can be completely divided into two vesicles, each being in a single homogeneous phase state (Figure 1c,e) [15,21]. This division, in the case of the inward-invaginated domain, results in the formation of DMVs (Figure 1e).
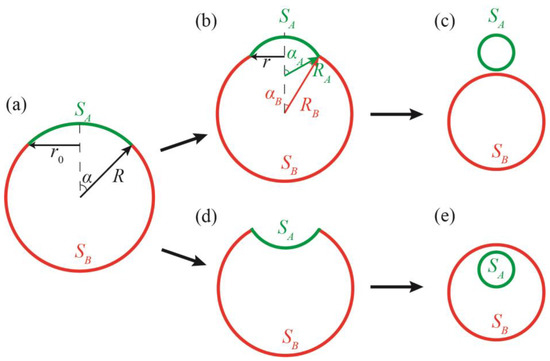
Figure 1.
Possible states of a phase-separated vesicle. (a)—Initial state of the vesicle immediately after the phase separation. (b)—Intermediate state of dividing vesicle consisting of two convex domains. (c)—The phase-separated vesicle divided into two separate vesicles. (d)—Intermediate state of dividing vesicle, consisting of one convex and one concave domain. (e)—The phase-separated vesicle divided into two vesicles forming the DMV. In panels (b,d), the length of the interphase boundary, 2πr, is smaller than the boundary length in the initial state, 2πr0 (panel (a)) due to buckling of the domain.
The decrease in the boundary energy is accompanied by an additional bending of both coexisting domains; this requires performing a mechanical work. Thus, the trajectories and final states of the vesicle shape transformations are determined by a precise interplay between the energy of the interphase boundary and energy of the elastic deformations of coexisting Lo/Ld domains. In addition, the transformations require the passing of large amounts of water through the membrane. The permeability of membranes with respect to water is thus an important parameter determining the kinetics of the shape transformations. Here, we analyzed a range of physical parameters, where the division of the phase-separated vesicle into two homogeneous vesicles is possible. We especially considered the cases of inward-invaginating domains, as they may lead to the formation of DMVs. We conclude that even in the presence of proteins facilitating the water flow through the membrane and providing the initial inward invagination of a domain, the DMV formation can principally take place in a very narrow range of parameters in the system. Interestingly, we found that the most probable diameter of DMVs formed, according to the proposed mechanism, is approximately 220 nm; this is very close to the average diameter of DMVs formed in vivo [3].
2. Materials and Methods
Let us consider a spherical vesicle of the radius R and surface area S. The membrane of the vesicle can phase-separate into two lipid phases, A and B. The corresponding areas of the phases obey the relation: SA/S = y ≤ 0.5 (Figure 1a). The monolayers in the phases are assumed to have different moduli of elasticity, in particular, the moduli of splay, Kc, and moduli of the Gaussian splay, KG. The interphase boundary is characterized by the specific energy γ (per unit length). In the framework of the Helfrich’s approach [22], the elastic energy of a spherical homogeneous vesicle can be written as:
where the factor 2 accounts for the fact that the bilayer comprises two lipid monolayers. The elastic energy of the vesicle is independent on its size, while the interphase energy is proportional to the interphase boundary length, i.e., proportional to the vesicle radius at a fixed value of y. This means that the vesicle has a critical radius; when this is exceeded, it becomes energetically favorable to divide the A/B phase-separated vesicle into two homogeneous vesicles: one vesicle is the A phase, and the other vesicle is the B phase. The division may result in two separate vesicles (Figure 1c) or a DMV (Figure 1e).
Due to a large content of cholesterol, the moduli of the lateral stretching of the lipid bilayers of both the Lo and Ld phases are very high [23]. Thus, we further assume that the areas of the phases A and B are constant, meaning that the membrane is virtually unstretchable. A deviation in the membrane shape from the spherical one requires some amount of water to flow out of the vesicle, as a sphere of a fixed area encloses a maximal volume. We assume that the water flow does not kinetically limit the membrane remodeling, i.e., that the membrane permeability is high enough due to, e.g., incorporated water channels or protein pores.
In the course of deformations, the domains of A and B phases become spherical segments of radii RA and RB, characterized by apex angles αA and αB, respectively (Figure 1b). The following relations are fulfilled:
The total energy of the deformed vesicle can be written as (see Equation (1)):
where the first and the second terms correspond to the bending energies of the domains of A and B phases, respectively; the last term accounts for the energy of the interphase boundary; the indexes “A” and “B” denote the respective phases. We consider weakly deformed macroscopic systems only, for which (1) the Helfrich’s approach is applicable, and (2) the line tension γ is constant, i.e., independent of the domain size. The latter condition is fulfilled for domains larger than approximately 20 nm in diameter [24]. It is convenient to rewrite the expression (3) for the total energy in the following form:
where
Wfinal is the energy of two separate vesicles (Figure 1c) or the DMV (Figure 1e); Weff is the total energy counted from Wfinal.
The line tension of the boundary between the Lo and Ld phases is determined by the difference between lipid component concentrations (“chemical” line tension) and by deformations arising at the boundary, in order to smooth the so-called thickness mismatch (“elastic” line tension), i.e., the difference in bilayer thickness of the more ordered and thicker Lo phase, and disordered and thinner Ld phase [24]. The chemical line tension is independent on the particular geometry of the interphase boundary, while the elastic line tension should depend on the apex angles αA and αB, as the “mechanical” structure of the interphase boundary in the initial (Figure 1a) and intermediate (Figure 1b,d) configurations is different. It is shown that, in a tensionless membrane, the elastic part of the line tension is minimal in the initial configuration of the vesicle (Figure 1a) [24]. Under the assumption of small deformations (Hooke’s law), the dependence of the total line tension on the angles αA and αB can be generally expressed as follows:
where γ0 is the line tension of the interphase boundary in the initial configuration illustrated in (Figure 1a); γ1 is the coefficient accounting for dependence of the elastic line tension on the difference of the angles αA and αB. The value of γ1 in (6) is mainly determined by the moduli of the elasticity of the less rigid disordered Ld phase.
The coefficient γ1 standing in the Equation (6) can be derived based on the Helfrich’s approach. Let us consider the region of the vesicle where the two phases meet (Figure 1b). Macroscopically, in this region there is a contact angle α = αA − αB between the two tangent planes to the bilayers of meeting A and B phases. However, the Helfrich’s formalism does not allow sharp angles in a membrane, as the angles have an infinite energy of bending. Thus, there should be some smooth transition zone between the two meeting bilayers. Without a loss of generality, one can assume that the transition zone lies entirely in the less rigid B phase. This assumption works well if the A phase is much more rigid than the B phase. In addition, if the phases A and B have similar moduli of elasticity, the energy of deformations in the transition zone does not depend on its actual location, as the phases are similar. The membrane surface in the transition zone has the approximate shape of a part of a toroidal surface. However, as the radius r of the spherical segment is large in practically relevant cases (of the order of approximately 100 nanometers, see below), one can locally neglect the equatorial curvature of the interphase boundary. In such assumptions, the transition zone can be modeled as a smooth membrane patch between a locally planar bilayer that meets another planar bilayer at a contact angle α = αA − αB (Figure 2); the system is translationally symmetric along the direction of the intersection line of two tangent planes. Thus, we can consider the energy per unit length along the direction of the translational symmetry, i.e., the line tension of the contact line. In order to stay within the linear theory of elasticity (Hooke’s law), we assume that the contact angle α is small; further, we extrapolate the results obtained in such an approximation to large contact angles. We introduce a Cartesian coordinate system in the way illustrated in Figure 2; the origin of the coordinate system lies at the point of intersection of the tangent planes of two meeting bilayer regions; one tangent plane (the left one in Figure 2) is parallel to the Ox axis.
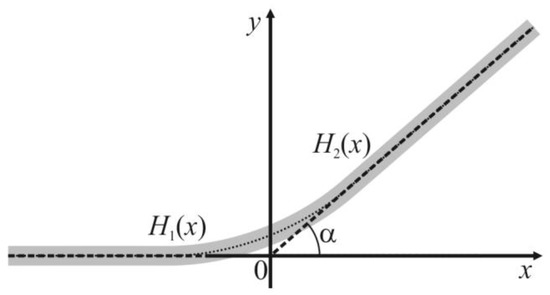
Figure 2.
The structure of the transition zone at the point of the meeting between bilayers of the phases A and B. The membrane is shown as a gray stripe. The angle between the tangent planes of two meeting bilayers is α = αA − αB. The tangent planes meet at the origin of the Cartesian coordinate system. The shape of the membrane in the half-space x < 0 is described by y-coordinates of points of the membrane surface, function H1(x); at x > 0—by the function H2(x). The functions H1(x), H2(x) are conjugated at x = 0 based on the continuity of the membrane surface, as well as continuity of its first and second derivatives with respect to x.
We describe the shape of the membrane surface (y-coordinates of its points) in the half-space x < 0 by the function H1(x), and in the half-space x > 0—by the function H2(x) (Figure 2). For small deformations, the curvature of the membrane surface in the considered system is given by the second derivative of H1,2(x) with respect to x. We formally introduce some lateral tension σ acting on the membrane. This is a somewhat artificial trick, as at zero lateral tension, the optimal width of the transition zone would be infinite. The lateral tension does not influence the calculated energy landscape of the DMV or separate the vesicles’ formation, as we require the areas of the phases A and B to be constant. The lateral tension, even up to approximately 0.1 mN/m, may arise from thermal undulations in the vesicle membrane shape [25]. In addition, σ may transiently arise in this system depending on the relative speeds of the membrane deformations (deviation of the membrane shape from a spherical one), and the water passes through the membrane. Experimentally, σ may be induced in the vesicle membrane under slightly hypoosmotic conditions, or can be applied directly by partial suction of the vesicle membrane into a micropipette [25]. For small deformations, the contribution of the lateral tension to the surface density of the elastic energy (per unit length of the contact line) is given by , where the prime in the superscript denotes the derivative with respect to x. Thus, for the membrane region x ≤ 0, we can write the following elastic energy functional:
However, one should take into account that the surface of the membrane region lying in x > 0 has a slope α at an equilibrium. The elastic energy functional for this region changes accordingly:
Formally, the area element in Equation (8) should be written as rather than as dx; however, this would lead to terms of the order of α4 in the energy, i.e., to the exceedance of the accuracy of the linear theory of elasticity. Variation in both functionals, W1 and W2, yields the same Euler–Lagrange equation:
The general solution of this equation can be written as:
where c1,…, c4, d1, …, d4 are some constant coefficients that should be determined from boundary conditions. As the boundary conditions, we require the deformations (deviations of H1(x), H2(x) from the tangent planes) to be limited at −∞ < x < 0 and 0 < x < +∞, respectively. This results in the requirements: c1 = c2 = c4 = d3 = 0, d2 = α. In addition, we require the membrane surfaces at x = 0 to be continuous, smooth and to have a continuous curvature:
These conditions yield:
By substituting H1(x), H2(x) into the elastic energy functionals Equations (7) and (8), and integrating them, one obtains the elastic energy of the transition zone:
Thus, Equation (13) justifies the structure of the line tension, Equation (6), and provides an estimate for γ1:
The second relation in (11) means that we conjugate the x-projections of normal unit vectors to two meeting bilayers at x = 0. Due to the symmetry, the projection at the boundary (x = 0) is equal to Nx = sin[(αA − αB)/2]. For this reason, we explicitly constructed this term in Equation (13).
For a vesicle with a fixed area fraction of the phase A (SA/S = y), it is convenient to analyze the energy landscape of separate vesicles or the DMV formation in terms of dimensionless parameters q and v, defined as follows:
where
In such notations, taking Equation (6) into account, Weff in (5) can be expressed as:
For typical values of KcB = 10 kBT (kBT ≈ 4 × 10⁻²¹ J) [25], KGB = −KcB/2 = −5 kBT [26], KcA = 20 kBT [13], KGA = −KcA/2 = −10 kBT, the variation in y from 0.1 to 0.5 results in the variation in W0 in the range of 460 to 1130 kBT. The values of q and v are of the order of 1 for the vesicle radius R = 250 nm and γ0, γ1 = 0.5 kBT/nm.
3. Results
In the case of v = 0 (i.e., γ1 = 0), the minimum of the energy Weff in (17) can be found analytically. If q < 1, the ground state of the system is determined by the condition αA = 0. This corresponds to the planar lipid bilayer of the phase A. Of note, in this state of minimal energy, the membrane shape is not spherical, but the vesicle shape is a combination of a spherical segment of the phase B and a planar disk of the phase A. If 1 < q < 2, the states of minimal energy are determined by the conditions αA = ±π, corresponding to two separate vesicles (αA = +π) or a DMV (αA = −π) (Figure 1c,e). In this case, the state of αA = 0 becomes metastable. The metastable state αA = 0 and two ground states αA = ±π are separated by energy barriers of equal heights. If q > 2, the energy barriers vanish, the local minimum at αA = 0 transforms into the local maximum, and the energy function Weff(αA) becomes monotonic between the states αA = 0 and αA = ±π.
When v ≠ 0, the energy function Weff(αA) is asymmetric: the minimum of the energy shifts from αA = 0 to positive values of αA, and the energy barriers separating the new local minimum at small positive αA and the states αA = ±π become different, with a lower energy barrier on the way to the formation of the separated vesicles (Figure 1c), and a higher energy barrier on the way to the DMV formation (Figure 1e). Characteristic dependences Weff(αA) are illustrated in Figure 3 for the case of v = 1. Similar to the case of v = 0, at small values of q (approximately, smaller than 1, the exact value depends on the value of v), the ground state of the system is at angles αA ≈ 0 (Figure 3, green curve). When q is intermediate (approximately, between 1 and 2), the state at αA ≈ 0 becomes metastable, and the ground states appear at the configurations αA = ±π (Figure 3, blue curve). At a large q (approximately, larger than 2 for small values of v) (Figure 3, red curve), the local minimum of the energy at a small αA vanishes, and the energy function Weff(αA) decreases monotonically on the interval from αA ≈ 0 to αA = π (formation of two separate vesicles, Figure 1c), while the formation of the DMV (Figure 1e), i.e., the transition from αA ≈ 0 to αA = −π, requires overcoming an energy barrier. Of note, the value of W0 is in the order of hundreds to a thousand kBTs; thus, all energy barriers illustrated in Figure 3 are significant.
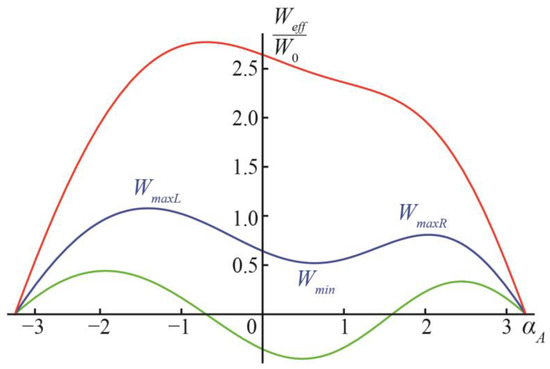
Figure 3.
Dependences of Weff on αA at v = 1, y = 0.1 and: q = 0.5 (green curve); q = 1.5 (blue curve); q = 3.5 (red curve).
Let us denote the location of the local minimum of Weff at small values of αA ≈ 0 (if exist) as αmin, and the corresponding value of the energy Wmin = Weff(αmin); we can denote the location of the local maximum of Weff at αA > 0 as αmaxR, the location of the local maximum at αA < 0 as αmaxL, the energy values in these maxima as WmaxR = Weff(αmaxR) and WmaxL = Weff(αmaxL), respectively (Figure 3). The energy barrier of the formation of separate vesicles is, thus, ∆Wsep = WmaxR − Wmin; the energy barrier of the DMV formation is ∆WDMV = WmaxL − Wmin. Let us denote the difference in the energy barriers of the DMV formation and the formation of the two separate vesicles as ∆W = WmaxL − WmaxR.
The energy landscape of the DMV or two separate vesicles’ formation is presented in Figure 4. Figure 4a–c illustrate the energy barrier of the formation of two separate vesicles, ∆Wsep = WmaxR − Wmin, for the area fraction of the phase A y = 0.1, 0.3, 0.5, respectively. At the green curves starting at points q = 1, v = 0 the energy in the local minimum αA = αmin is equal to zero, Wmin = 0. For the parameter ranges between the vertical axes q = 0 and green curves, Wmin < 0, meaning that the local minimum at αA = αmin is actually the global minimum of the energy, i.e., Weff(αmin) < Weff(αA = ±π) = 0 (see the green curve in Figure 3).
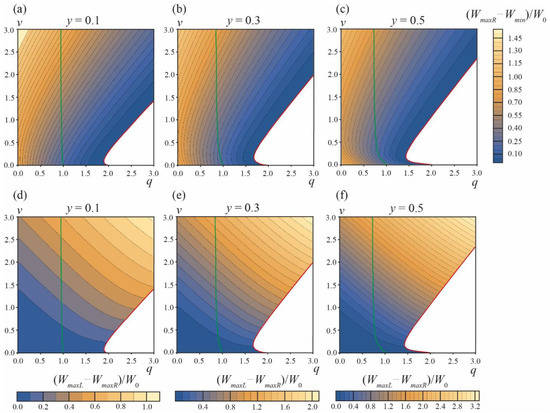
Figure 4.
Energy landscape of the formation of two separate vesicles and the formation of the DMV. (a–c)—The values of energy barrier ∆Wsep = WmaxR − Wmin of the formation of two separate vesicles for area fractions of the A phase y = 0.1 (a), y = 0.3 (b), y = 0.5 (c). (d–f)—The difference in the energy barriers ∆W = WmaxL − WmaxR of the DMV formation and the formation of two separate vesicles for area fractions of the A phase y = 0.1 (d), y = 0.3 (e), y = 0.5 (f). Green curves are right boundaries of the q, v parameter regions, where Wmin = Weff(αmin) ≤ 0. Red curves are the left boundaries of the q, v parameter regions, where the formation of two separate vesicles is barrier-free (white zones in right bottom corners of the plots).
At the red curves, the local minimum at αA = αmin and the right energy barrier at αA = αmaxR vanish, i.e., at the curve αmin = αmaxR and Wmin = WmaxR. Below the red curves (white zones in plots in Figure 4a–c), the dependences Weff(αA) in the interval of αA from 0 to π are monotonic (see the red curve in Figure 3), meaning that the process of formation of two separate vesicles is spontaneous and barrier-free. For typical values of elastic parameters, W0 >> 1 kBT, and thus the formation of two separate vesicles is possible only in the region of barrier-free division (white zones in plots in Figure 4a–c) and in a narrow stripe along the red curves, where ∆Wsep = WmaxR − Wmin ≤ 0.1W0 (the darkest blue regions in the plots in Figure 4a–c).
The relative probability of the DMV formation is determined by the difference in the energy barriers ∆W = ∆WDMV − ∆Wsep = WmaxL − WmaxR of the DMV formation and the formation of two separate vesicles. This difference is plotted in Figure 4d–f for the area fractions of the A phase y = 0.1, 0.3, 0.5, respectively. ∆W < 0.1W0 ≈ 50–100 kBT only in the vicinity of the horizontal axes v = 0. ∆W is always positive, i.e., the energy barrier of the DMV formation is always higher than the energy barrier of the formation of two separate vesicles. As the latter barrier, ∆Wsep, is reasonably low only in the vicinity of red curves, and when ∆WDMV > ∆Wsep, the formation of DMVs is possible only in the same (or even smaller) region of the q, v plane in the immediate vicinity of red curves. Combining these two criteria, we can conclude that the spontaneous DMV formation can principally take place only in the q, v plane region near the beginning of the red curves, i.e., at q ≤ 2 and v ≈ 0. As ∆W > 0, a large fraction of initial phase-separated vesicles should spontaneously divide into two separate vesicles (Figure 1c); only a minor fraction of vesicles can spontaneously yield DMVs (Figure 1e).
We performed a similar analysis for the area fractions of the A phase y = 0.2 and y = 0.4; the calculations were performed in the range of the parameters 0 ≤ q ≤ 20, 0 ≤ v ≤ 20. At large values of q, v no new features in the energy landscape appeared. At large values of q, v > 2.5, the red curves in plots of Figure 4 become straight lines, with the slope k = 1.041, 1.211, 1.249 for y = 0.1, 0.3, 0.5, respectively.
We assumed that, immediately after the phase separation, the system relaxes to the state of minimal energy corresponding to the angle αmin; after that, the system attempts to surmount the energy barriers of the formation of two separate vesicles, ∆Wsep, or the formation of the DMV, ∆WDMV. However, if the shape transformations of the vesicle are much slower than the process of phase separation, then immediately after the phase separation the vesicle would have a spherical shape (Figure 1a) with the angle αA = α, defined as follows:
If the value of this initial angle α > αmaxR, then the system energy will decrease for increasing angles αA and the system should undergo a spontaneous barrier-free division into two separate vesicles. Figure 5 illustrates the dependence of the critical angle αmaxR on the parameters q and v. From the figure, it follows that, in addition to the white zone bounded by the red curve (Figure 4), there is a region of the parameters q, v where the division of the vesicle into two separate vesicles is barrier-free (Figure 5, black triangles near the point q ≈ 2, v ≈ 0). In this q, v region, the formation of DMVs is impossible. This means that the difference in the energy barriers of the DMV formation and the formation of two separate vesicles, ∆W = WmaxL − WmaxR, has a lower estimate, and cannot be made zero; the system cannot be made close enough to the red curve and to the horizontal axis v = 0 simultaneously, as in this case, the barrier-free division into two separate vesicles would immediately occur (black triangles in Figure 5). By the order of magnitude, min[WmaxL − WmaxR] ≈ 0.05W0 for y = 0.1–0.5. This yields the estimate for the fraction of spontaneously formed DMVs: exp{−min[WmaxL − Wmax]/(kBT)}/(1 + exp{−min[WmaxL − Wmax]/(kBT)}) ≈ 10−10. Thus, practically, DMVs should not form spontaneously.
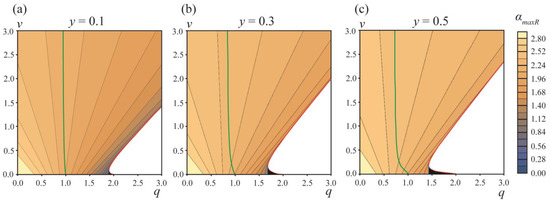
Figure 5.
The dependence of the angle corresponding to the top of the energy barrier of two separate vesicles formation, αmaxR, on the parameters q, v for area fractions of the A phase (a)—y = 0.1; (b)—y = 0.3; (c)—y = 0.5. Green curves are right boundaries of the q, v parameter regions where Wmin = Weff(αmin) ≤ 0. Red curves are the left boundaries of the q, v parameter regions where the formation of two separate vesicles is barrier-free (white zones in right bottom corners of the plots). Blue line is the left boundary of the q, v parameter region, where α > αmaxR (black triangles near the point q ≈ 2, v ≈ 0).
However, there is still a possibility of the forced (non-spontaneous) formation of DMVs. When the relaxation of the vesicle shape in the course of the phase separation is slow enough (in comparison to the rate of the phase separation), the vesicle could divide spontaneously into two separate vesicles if α > αmaxR. Analogously, under similar conditions, the vesicle may transform into a DMV under external force factors, if the starting angle αA = αstart is made smaller than the angle αmaxL corresponding to the top of the energy barrier of the DMV formation, αstart < αmaxL (Figure 6). In this case, the process of the DMV formation would be barrier-free. In principle, the system can be experimentally brought to the state αstart < αmaxL at the expense of an appropriate external force impact; however, the system should be maintained far from the regions of the barrier-free formation of the two separate vesicles.
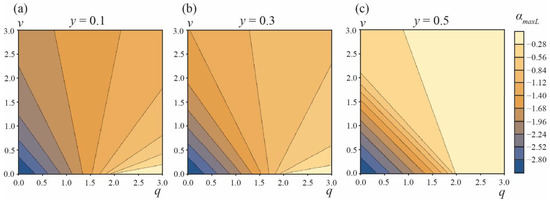
Figure 6.
The dependence of the angle corresponding to the top of the energy barrier of the DMV formation, αmaxL, on the parameters q, v for area fractions of the A phase (a)—y = 0.1; (b)—y = 0.3; (c)—y = 0.5.
4. Discussion
The intensive production of DMVs is a characteristic feature of the coronavirus infection [3]. DMVs are thought to be involved in the replication of viral RNA, and simultaneously provide protection from the inner cellular immunity [6,7]. In the case of SARS-CoV-2, three non-structural proteins (nsp-3, nsp-4, nsp-6) are shown to be crucial for the formation of DMVs [3,6]. DMVs are majorly derived from ER membranes [3]. The formation of two spherical membranes in the DMV from the ER membrane requires performing a significant amount of mechanical work to cover the change in the elastic energy of the membrane in this process. Here, we analyzed the energy landscape of the DMV formation, starting from a spherical vesicle that has undergone the Lo/Ld phase separation.
The landscape was analyzed in terms of parameters q and v; they were constructed from the geometric and energetic parameters of the system, in accordance with Equation (15). The parameters q and v include the common factor , meaning that q and v depend on the area fraction of the phase A (y), the total area of the vesicle (S), and on the elastic moduli of the lipid bilayers of the phase A and B (W0), in a similar way. However, q depends on the constant part of the interphase line tension (γ0), while v depends on the “rigidity” of the interphase boundary, with respect to a change in the contact angle (γ1), see Equations (6) and (15). The parameter γ1 was shown to be determined by the moduli of elasticity of the less rigid phase B and by the lateral tension of the vesicle membrane (Equation (14)). The constant part of the line tension, γ0, depends very weakly on the lateral tension σ [24]. Thus, one can regulate the parameter v almost independently of the parameter q, by a change in the lateral tension σ. Experimentally, σ may be induced in the vesicle membrane under slightly hypoosmotic conditions [27], or can be applied directly by the partial suction of the vesicle into a micropipette [25,28].
The excess energy of the interphase boundary was considered the main source of the mechanical work necessary for the DMV formation. Any deviations in the membrane shape from the spherical one requires some amount of water to pass through the membrane, as a sphere of a fixed area has a maximal inner volume. In experiments on purely lipidic giant unilamellar vesicles (GUVs), a low membrane permeability, with respect to water, allows kinetically stabilizing budding Lo domains for time periods of approximately, or larger than, 1 h [15]. Such a delay in the relaxation of the membrane shape, due to a slow water flux, may lead to the generation of some transient lateral tension σ in the vesicle membrane. The tension influences the value of γ1 (see Equation (14)), on which, in turn, the parameter v depends (Equation (15)). Thus, the formation of DMVs on physiologically relevant timescales implies the presence of some proteins that can form pores or water-permeable channels in the membrane. For SARS-CoV-2, nsp-3 is shown to be a major constituent of the large pores connecting and spanning both membranes of DMVs [6]; the pores should be permeable for water.
In the absence of kinetic restrictions, a spherical phase-separated vesicle (Figure 1a) has several scenarios of evolution: (1) it can remain stable and spherical if the line tension and the total length of the interphase boundary are low enough; (2) divide into two separate vesicles (Figure 1c); (3) divide and form DMVs (Figure 1e). The value of the line tension is a critical parameter that determines the evolution of the system. For coexisting Lo/Ld phases, the line tension depends on the temperature and lipid composition of the membrane; a lower temperature, saturated lipids with longer tails (that is equivalent to a higher melting temperature), and a smaller concentration of cholesterol, generally, yield higher line tensions [29,30]. To some extent, the line tension can be regulated by so-called lineactants, i.e., amphiphilic membrane components able to substantially change the line tension being applied in low concentrations (e.g., fractions of mole percent) [31,32]. In particular, monosialoganglioside GM1, lyso-oleoyl-phosphatidyl-choline, and lyso-palmitoyl-phosphatidyl-choline have been recently shown to manifest the line activity in membranes with coexisting Lo/Ld phases [32,33]. Generally, all membrane components with a non-zero spontaneous curvature are predicted to be line active [33].
The constant part of the line tension γ0 determines the parameter q, but not v (see Equation (15)). Thus, the parameter q can be regulated independently of v by tuning γ0. The constant part of the line tension, γ0, is determined by the difference in the properties of the coexisting phases A and B, e.g., by the difference in their elastic moduli, lipid composition, etc. At the same time, the “rigidity” of the line tension, with respect to the contact angle, γ1, is determined by the bending modulus of the less rigid phase B (see Equation (14)), and it is almost independent of the elastic parameters of the more rigid phase A. Thus, a variation in the elastic properties of the phase A at the fixed elastic parameters of the phase B would change the parameter q, but not v. The elastic properties of the more ordered phase A can be changed by, e.g., the use of saturated lipids with different lengths of tail or with different cholesterol concentrations.
High line tension favors both a formation of DMVs and a division of the initial vesicle into two separate vesicles. According to our calculations, the formation of two separate vesicles is always a less energy-demanding process in comparison to the DMV formation. This is due to the fact that the initial spherical vesicle already consists of two convex domains (Figure 1a). In the course of the division into two separate vesicles, two convex domains become only more convex (Figure 1b), while in the course of the DMV formation, one domain becomes concave (Figure 1d). Thus, only a negligible fraction of the spontaneously dividing vesicles would form DMVs. However, the yield of DMVs can be enhanced by external force factors. These factors can modify the bending moduli of the coexisting phases, induce the asymmetric spontaneous curvature in the membrane, or directly apply mechanical forces in a way that favors a concave shape of one of two coexisting domains. In the range of optimal conditions, the differences in the energy barriers of the formation of two separate vesicles and the formation of the DMV is of the order of 50 kBT; this energy can be supplied by only several molecules of ATP.
One can estimate the diameter of DMVs formed in the range of the near-optimal conditions. For the estimate, we assume that the initial vesicle separates into Lo and Ld phases of approximately equal areas (i.e., y = 0.5). We set v ≈ 0, as in the vicinity of the horizontal axis v = 0, the energy barriers are the lowest. For reasonable values of elastic parameters, W0 ≈ 500 kBT (see Equation (16)). The experimentally reported range of the line tensions includes γ0 ≈ 2 pN ≈ 0.5 kBT/nm [34]. In order to prevent the barrier-free division of the vesicle into two separate vesicles, one should restrict q ≤ 1.4 (see Figure 5c). In this case, the radius of the initial vesicle should be R ≤ 158 nm. Such vesicles can form DMVs with a diameter of d ≈ 21/2R ≈ 223 nm. This estimate agrees well with the average diameter of the DMVs of 225 ± 39 nm, observed experimentally [3]. Our consideration predicts that the DMV size should be strongly limited from above.
The analysis developed here can also be utilized for the production of DMVs in model systems.
Author Contributions
Conceptualization, O.V.K., and S.A.A.; methodology, O.V.K.; soft-ware, O.V.K.; validation, O.V.K. and S.A.A.; formal analysis, O.V.K.; investigation, O.V.K. and S.A.A.; resources, O.V.K., and S.A.A.; data curation, O.V.K. and S.A.A.; writing—original draft preparation, O.V.K. and S.A.A.; visualization, O.V.K.; supervision, S.A.A. All authors have read and agreed to the published version of the manuscript.
Funding
The work was supported by the Russian Science Foundation (grant # 22-13-00435).
Institutional Review Board Statement
Not applicable.
Data Availability Statement
Not applicable.
Acknowledgments
The authors are grateful to Oleg Batishchev for a careful reading of the manuscript, fruitful discussions and editorial assistance.
Conflicts of Interest
The authors declare no conflict of interest. The funders had no role in the design of the study; in the collection, analyses, or interpretation of data; in the writing of the manuscript, or in the decision to publish the results.
References
- Chlanda, P.; Mekhedov, E.; Waters, H.; Schwartz, C.L.; Fischer, E.R.; Ryham, R.J.; Cohen, F.S.; Blank, P.S.; Zimmerberg, J. The hemifusion structure induced by influenza virus haemagglutinin is determined by physical properties of the target membranes. Nat. Microbiol. 2016, 1, 16050. [Google Scholar] [CrossRef] [PubMed]
- Chlanda, P.; Zimmerberg, J. Protein–lipid interactions critical to replication of the influenza A virus. FEBS Lett. 2016, 590, 1940–1954. [Google Scholar] [CrossRef]
- Mihelc, E.M.; Baker, S.C.; Lanman, J.K. Coronavirus infection induces progressive restructuring of the endoplasmic reticulum involving the formation and degradation of double membrane vesicles. Virology 2021, 556, 9–22. [Google Scholar] [CrossRef]
- Chlanda, P.; Schraidt, O.; Kummer, S.; Riches, J.; Oberwinkler, H.; Prinz, S.; Kräusslich, H.G.; Briggs, J.A. Structural analysis of the roles of influenza A virus membrane-associated proteins in assembly and morphology. J. Virol. 2015, 89, 8957–8966. [Google Scholar] [CrossRef] [PubMed]
- Ulasli, M.; Verheije, M.H.; De Haan, C.A.; Reggiori, F. Qualitative and quantitative ultrastructural analysis of the membrane rearrangements induced by coronavirus. Cell. Microbiol. 2010, 12, 844–861. [Google Scholar] [CrossRef] [PubMed]
- Roingeard, P.; Eymieux, S.; Burlaud-Gaillard, J.; Hourioux, C.; Patient, R.; Blanchard, E. The double-membrane vesicle (DMV): A virus-induced organelle dedicated to the replication of SARS-CoV-2 and other positive-sense single-stranded RNA viruses. Cell. Mol. Life Sci. 2022, 79, 425. [Google Scholar] [CrossRef]
- Wolff, G.; Melia, C.E.; Snijder, E.J.; Bárcena, M. Double-membrane vesicles as platforms for viral replication. Trends Microbiol. 2020, 28, 1022–1033. [Google Scholar] [CrossRef]
- Yu, L.; Chen, Y.; Tooze, S.A. Autophagy pathway: Cellular and molecular mechanisms. Autophagy 2018, 14, 207–215. [Google Scholar] [CrossRef]
- Knorr, R.L.; Dimova, R.; Lipowsky, R. Curvature of double-membrane organelles generated by changes in membrane size and composition. PLoS ONE 2012, 7, e32753. [Google Scholar] [CrossRef]
- Pike, L.J. Rafts defined: A report on the Keystone Symposium on Lipid Rafts and Cell Function. J. Lipid Res. 2006, 47, 1597–1598. [Google Scholar] [CrossRef]
- Saitov, A.; Akimov, S.A.; Galimzyanov, T.R.; Glasnov, T.; Pohl, P. Ordered lipid domains assemble via concerted recruitment of constituents from both membrane leaflets. Phys. Rev. Lett. 2020, 124, 108102. [Google Scholar] [CrossRef] [PubMed]
- Petruzielo, R.S.; Heberle, F.A.; Drazba, P.; Katsaras, J.; Feigenson, G.W. Phase behavior and domain size in sphingomyelin-containing lipid bilayers. Biochim. Biophys. Acta 2013, 1828, 1302–1313. [Google Scholar] [CrossRef] [PubMed]
- Baumgart, T.; Das, S.; Webb, W.W.; Jenkins, J.T. Membrane elasticity in giant vesicles with fluid phase coexistence. Biophys. J. 2005, 89, 1067–1080. [Google Scholar] [CrossRef] [PubMed]
- Pan, J.; Tristram-Nagle, S.; Nagle, J.F. Effect of cholesterol on structural and mechanical properties of membranes depends on lipid chain saturation. Phys. Rev. E 2009, 80, 021931. [Google Scholar] [CrossRef] [PubMed]
- Baumgart, T.; Hess, S.T.; Webb, W.W. Imaging coexisting fluid domains in biomembrane models coupling curvature and line tension. Nature 2003, 425, 821–824. [Google Scholar] [CrossRef] [PubMed]
- Vinklárek, I.S.; Vel’as, L.; Riegerová, P.; Skála, K.; Mikhalyov, I.; Gretskaya, N.; Hof, M.; Šachl, R. Experimental evidence of the existence of interleaflet coupled nanodomains: An MC-FRET study. J. Phys. Chem. Lett. 2019, 10, 2024–2030. [Google Scholar] [CrossRef]
- Saud, Z.; Tyrrell, V.J.; Zaragkoulias, A.; Protty, M.B.; Statkute, E.; Rubina, A.; Bentley, K.; White, D.A.; Rodrigues, P.D.S.; Murphy, R.C.; et al. The SARS-CoV2 envelope differs from host cells, exposes pro-coagulant lipids, and is disrupted in vivo by oral rinses. J. Lipid Res. 2022, 63, 100208. [Google Scholar] [CrossRef]
- Polozov, I.V.; Bezrukov, L.; Gawrisch, K.; Zimmerberg, J. Progressive ordering with decreasing temperature of the phospholipids of influenza virus. Nat. Chem. Biol. 2008, 4, 248–255. [Google Scholar] [CrossRef]
- Pratelli, A.; Colao, V. Role of the lipid rafts in the life cycle of canine coronavirus. J. Gen. Virol. 2015, 96, 331–337. [Google Scholar] [CrossRef]
- Pralle, A.; Keller, P.; Florin, E.L.; Simons, K.; Hörber, J.H. Sphingolipid–cholesterol rafts diffuse as small entities in the plasma membrane of mammalian cells. J. Cell Biol. 2000, 148, 997–1008. [Google Scholar] [CrossRef]
- Akimov, S.A.; Hlaponin, E.A.; Bashkirov, P.V.; Boldyrev, I.A.; Mikhalyov, I.I.; Telford, W.G.; Molotkovskaya, I.M. Ganglioside GM1 increases line tension at raft boundary in model membranes. Biol. Membr. 2009, 26, 234–239. [Google Scholar] [CrossRef]
- Helfrich, W. Elastic properties of lipid bilayers: Theory and possible experiments. Z. Naturforsch. C 1973, 28, 693–703. [Google Scholar] [CrossRef] [PubMed]
- Evans, E.; Rawicz, W. Entropy-driven tension and bending elasticity in condensed-fluid membranes. Phys. Rev. Lett. 1990, 64, 2094. [Google Scholar] [CrossRef] [PubMed]
- Galimzyanov, T.R.; Molotkovsky, R.J.; Bozdaganyan, M.E.; Cohen, F.S.; Pohl, P.; Akimov, S.A. Elastic membrane deformations govern interleaflet coupling of lipid-ordered domains. Phys. Rev. Lett. 2015, 115, 088101. [Google Scholar] [CrossRef]
- Rawicz, W.; Olbrich, K.C.; McIntosh, T.; Needham, D.; Evans, E. Effect of chain length and unsaturation on elasticity of lipid bilayers. Biophys. J. 2000, 79, 328–339. [Google Scholar] [CrossRef]
- Hu, M.; de Jong, D.H.; Marrink, S.J.; Deserno, M. Gaussian curvature elasticity determined from global shape transformations and local stress distributions: A comparative study using the MARTINI model. Faraday Discuss. 2013, 161, 365–382. [Google Scholar] [CrossRef]
- Billah, M.M.; Saha, S.K.; Rashid, M.M.O.; Hossain, F.; Yamazaki, M. Effect of osmotic pressure on pore formation in lipid bilayers by the antimicrobial peptide magainin 2. Phys. Chem. Chem. Phys. 2022, 24, 6716–6731. [Google Scholar] [CrossRef]
- Hasan, M.; Karal, M.A.S.; Levadnyy, V.; Yamazaki, M. Mechanism of initial stage of pore formation induced by antimicrobial peptide magainin 2. Langmuir 2018, 34, 3349–3362. [Google Scholar] [CrossRef]
- Huang, J.; Hiraki, S.; Feigenson, G.W. Calculation of liquid-disordered/liquid-ordered line tension from pairwise lipid interactions. J. Phys. Chem. B 2020, 124, 4949–4959. [Google Scholar] [CrossRef]
- Staneva, G.; Osipenko, D.S.; Galimzyanov, T.R.; Pavlov, K.V.; Akimov, S.A. Metabolic precursor of cholesterol causes formation of chained aggregates of liquid-ordered domains. Langmuir 2016, 32, 1591–1600. [Google Scholar] [CrossRef]
- Brewster, R.; Safran, S.A. Line active hybrid lipids determine domain size in phase separation of saturated and unsaturated lipids. Biophys. J. 2010, 98, L21–L23. [Google Scholar] [CrossRef] [PubMed]
- Bao, R.; Li, L.; Qiu, F.; Yang, Y. Atomic force microscopy study of ganglioside GM1 concentration effect on lateral phase separation of sphingomyelin/dioleoylphosphatidylcholine/cholesterol bilayers. J. Phys. Chem. B 2011, 115, 5923–5929. [Google Scholar] [CrossRef] [PubMed]
- Krasnobaev, V.D.; Galimzyanov, T.R.; Akimov, S.A.; Batishchev, O.V. Lysolipids regulate raft size distribution. Front. Mol. Biosci. 2022, 9, 1021321. [Google Scholar] [CrossRef] [PubMed]
- Tian, A.; Johnson, C.; Wang, W.; Baumgart, T. Line tension at fluid membrane domain boundaries measured by micropipette aspiration. Phys. Rev. Lett. 2007, 98, 208102. [Google Scholar] [CrossRef] [PubMed]


Disclaimer/Publisher’s Note: The statements, opinions and data contained in all publications are solely those of the individual author(s) and contributor(s) and not of MDPI and/or the editor(s). MDPI and/or the editor(s) disclaim responsibility for any injury to people or property resulting from any ideas, methods, instructions or products referred to in the content. |
© 2022 by the authors. Licensee MDPI, Basel, Switzerland. This article is an open access article distributed under the terms and conditions of the Creative Commons Attribution (CC BY) license (https://creativecommons.org/licenses/by/4.0/).