Article

Effect of Operating Conditions and Fructans Size Distribution on Tight Ultrafiltration Process for Agave Fructans Fractionation: Optimization and Modeling

by
Noe Luiz-Santos
1,
Rogelio Prado-Ramírez
2,
Rosa María Camacho-Ruíz
2,
Guadalupe María Guatemala-Morales
2,
Enrique Arriola-Guevara
3 and
Lorena Moreno-Vilet
2,*
1
Centro de Investigación y Asistencia en Tecnología y Diseño del Estado de Jalisco A.C., Tecnología Alimentaria, Autopista Mty-Aeropuerto, Vía de la Innovación 404, Parque PIIT, Apodaca 66628, Mexico
2
Centro de Investigación y Asistencia en Tecnología y Diseño del Estado de Jalisco A.C., Tecnología Alimentaria and Biotecnología Industrial, Camino Arenero 1227, El Bajío, Zapopan 45019, Mexico
3
Departamento de Ingeniería Química, CUCEI-Universidad de Guadalajara, Blvd. M. García Barragán 1421, Guadalajara 44430, Mexico
*
Author to whom correspondence should be addressed.
Membranes 2022, 12(6), 575; https://doi.org/10.3390/membranes12060575
Submission received: 29 April 2022 / Revised: 25 May 2022 / Accepted: 27 May 2022 / Published: 31 May 2022
(This article belongs to the Special Issue Recent Advances in Membrane Technology for Food Processing)

Abstract

:
The objective of this work was to evaluate the effect of operating conditions and fructans size distribution on the tight Ultrafiltration process for agave fructans fractionation. A mathematical model of limiting mass flux transfer was used to represent the profile of concentrations over time at the outlet of a pilot scale ultrafiltration system. First, a Box-Behnken experimental design was performed for the optimization of the parameters that determine the operating conditions in their respective ranges: temperature, 30–60 °C; transmembrane pressure (TMP), 1–5 bar and feed concentration, 50–150 kg∙m−3, on the separation factor (SF) and permeate flux. Then, the validation of the model for different fructans size distribution was carried out. The results showed that for SF, the quadratic terms of temperature, TMP and feed concentration were the most significant factors. Statistical analysis revealed that the temperature-concentration interaction has a significant effect (p < 0.005) and that the optimal conditions were: 46.81 °C, 3.27 bar and 85.70 kg∙m−3. The optimized parameters were used to validate the hydrodynamic model; the adjustments conclude that the model, although simplified, is capable of correctly reproducing the experimental data of agave fructans fractionation by a tight ultrafiltration pilot unit. The fractionation process is favored at higher proportions of FOS:Fc in native agave fructans.

Graphical Abstract

1. Introduction

Currently, there is a growing demand for products and functional ingredients that positively impact health, including soluble fibers and prebiotics, due to their many reported beneficial effects [1,2,3]. In this context, Agave plants, endemic to the American continent, contain around 13–17% (ww fresh weight) of fructans as energy reserve carbohydrates in mature plants [4]. At the industrial level, these fructans are extracted from the grinding and crushing of Agave tequilana Weber var. Azul heads to obtain a natural juice. This juice is filtered, deionized and decolored with a press filter, ionic exchange and active charcoal columns to finally obtain agave fructans in powder or syrup, commercially known as native fructans. Despite being a standardized process, it is essential to mention that the composition in terms of fructans size distribution or degree of polymerization (DP) can change, as they are natural polysaccharides of plant origin. It has been documented that the DP of agave fructans ranges from 3 to 42 [5] and can fluctuate according to plant species [6], region, soil, state of physical ripeness or plant age [7].
Native fructans have been studied for their beneficial effects on health, such as their prebiotic effect [8,9], effects on weight loss and body fat, their ability to decrease cholesterol and triglycerides, improve redox status [10,11] and favor calcium absorption, and their promotion of chemoprotective, immunomodulatory [12], and antioxidant effects. Their technological applications include improving sensory attributes [13] and acting as a fat replacer [14,15] and as a carrier in microencapsulation [16,17]. Some authors have shown that their properties depend on the chain size or DP. For example, concerning their prebiotic effects, the short chains, known as fructooligosaccharides (FOS), with a DP between 3–10, are more rapidly fermented by the probiotic bacteria of the microflora [18], favoring their growth in the transversal colon; this triggers a series of mechanisms involving the lipid [19] and glucose pathway [20]. On the other hand, long chains with DP ˃ 10 (Fc) are not hydrolyzed as easily by bacteria, which have been reported to produce different effects in tests with obese mice [20]. In terms of technological properties, it is also believed that larger chains are ideal for encapsulation and protection of antioxidants [16]. Therefore, obtaining fractions of agave fructans according to their DP would represent a broad market opportunity by favoring specific applications.
Several separation techniques are currently used to fractionate agave fructans at the laboratory level, based on limited acid hydrolysis [4], size exclusion [5], and precipitation with organic solvents [21]. However, these require long process times, strict control of operational parameters, many processing stages, and the use of solvents that need subsequent steps for their removal. The above means that it is expensive, difficult to scale, and unfriendly to the environment. In contrast, membrane technology is a physical process that does not use chemical agents, does not require heat, and separates the compounds of interest through a driving force.
Membrane processes are a fundamental part of industrial processes since they allow the clarification and purification of compounds of industrial interest. The pore size or nominal molecular weight cut-off (NMWCO) enables membrane processes to be classified into microfiltration, ultrafiltration (UF), nanofiltration, and reverse osmosis. The choice will depend on the type of separation required; both upstream and downstream can be recovered. In the case of fructans separation, very small solutes that fall into the range of a fine UF are considered, where tight membranes with an NMWCO of 1 to 3 kDa are required.
Currently, polymeric membranes are more widely applied in the industry due to their low cost; however, ceramic membranes have excellent thermal and chemical stability, resisting pressure differences, compared to polymeric membranes [22,23]. Therefore, ceramic membranes can be used in processes where more aggressive cleaning processes are required; the reasons why more and more are being used in the food industry might include for protein recovery [24], the concentration of juice [25], dairy products [26], microfiltration of soy sauce [27], corn syrup clarification [28] and the sugar industry [29].
Several studies on the UF applications process have been reported to obtain FOS and inulins from various sources such as rice [30], chicory root [31], artichoke extract [32] and synthesized galactooligosaccharides [33]. For agave plants, NF studies at the laboratory level have been reported to enhance the purity of fructans by removing the low molecular weight sugars [34,35]; Flores Montaño et al. [36] and Pérez Martínez et al. [37] proposed the fractionation process by UF. In a previous study, Luiz et al. [38] showed the feasibility of obtaining fractionated fructans by Tight UF systems using a ceramic membrane on a pilot scale. However, as the processes are scaled, it is vitally important to optimize the operating conditions that allow for more efficient operations and lower costs.
Mathematical modeling is an essential engineering tool that helps us study and understand the process phenomenon. In this case, the mass transfer models in the UF process have been suggested to predict the purification results under different operational conditions for industrial design, including FOS purity [39], yield and the decrease in permeate flux and operation time process [40]. However, scarce information exists on modeling the apparent rejection and concentration profiles of permeate and retentate streams over time, and none have been proven for the agave fructans process. The concentration profiles are considered an important challenge for agave fructans fractionation due to the observed variation in the size distribution of native agave fructans, which could affect the final ultrafiltered product.
Thus, the present work aims to optimize and evaluate the effect of temperature, TMP and feed concentration on the separation factor and flux of agave fructans fractions by a tight UF process at a pilot scale. In addition, a mass transfer mathematical model is proposed to analyze the effect of the native fructans size distribution (FOS:Fc proportions) on the apparent rejection and concentration profile, predicting the final product composition.

2. Materials and Methods

2.1. Feed Solution

For the experimental design, the feed solutions were prepared with Agave tequilana fructans (Olifructine®) kindly provided by Nutriagaves de Mexico. This mixture was a homogeneous batch of syrup with a concentration of 70 °Bx, composed of native fructans with 64.90% DP ˃ 10 (Fc), 23.77% FOS with DP between 3–10, and 11.33% mono-disaccharides (MD) DP 1–2 as glucose, fructose, and sucrose with an average DP of 16.3. Commercial native fructans from different batches and compositions were used for experimental validation. Total soluble solids concentration was adjusted using a digital refractometer (Pal-α,ATAGO, Tokyo, Japon) in °Bx, according to the experimental design level and expressed as kg∙m−3.

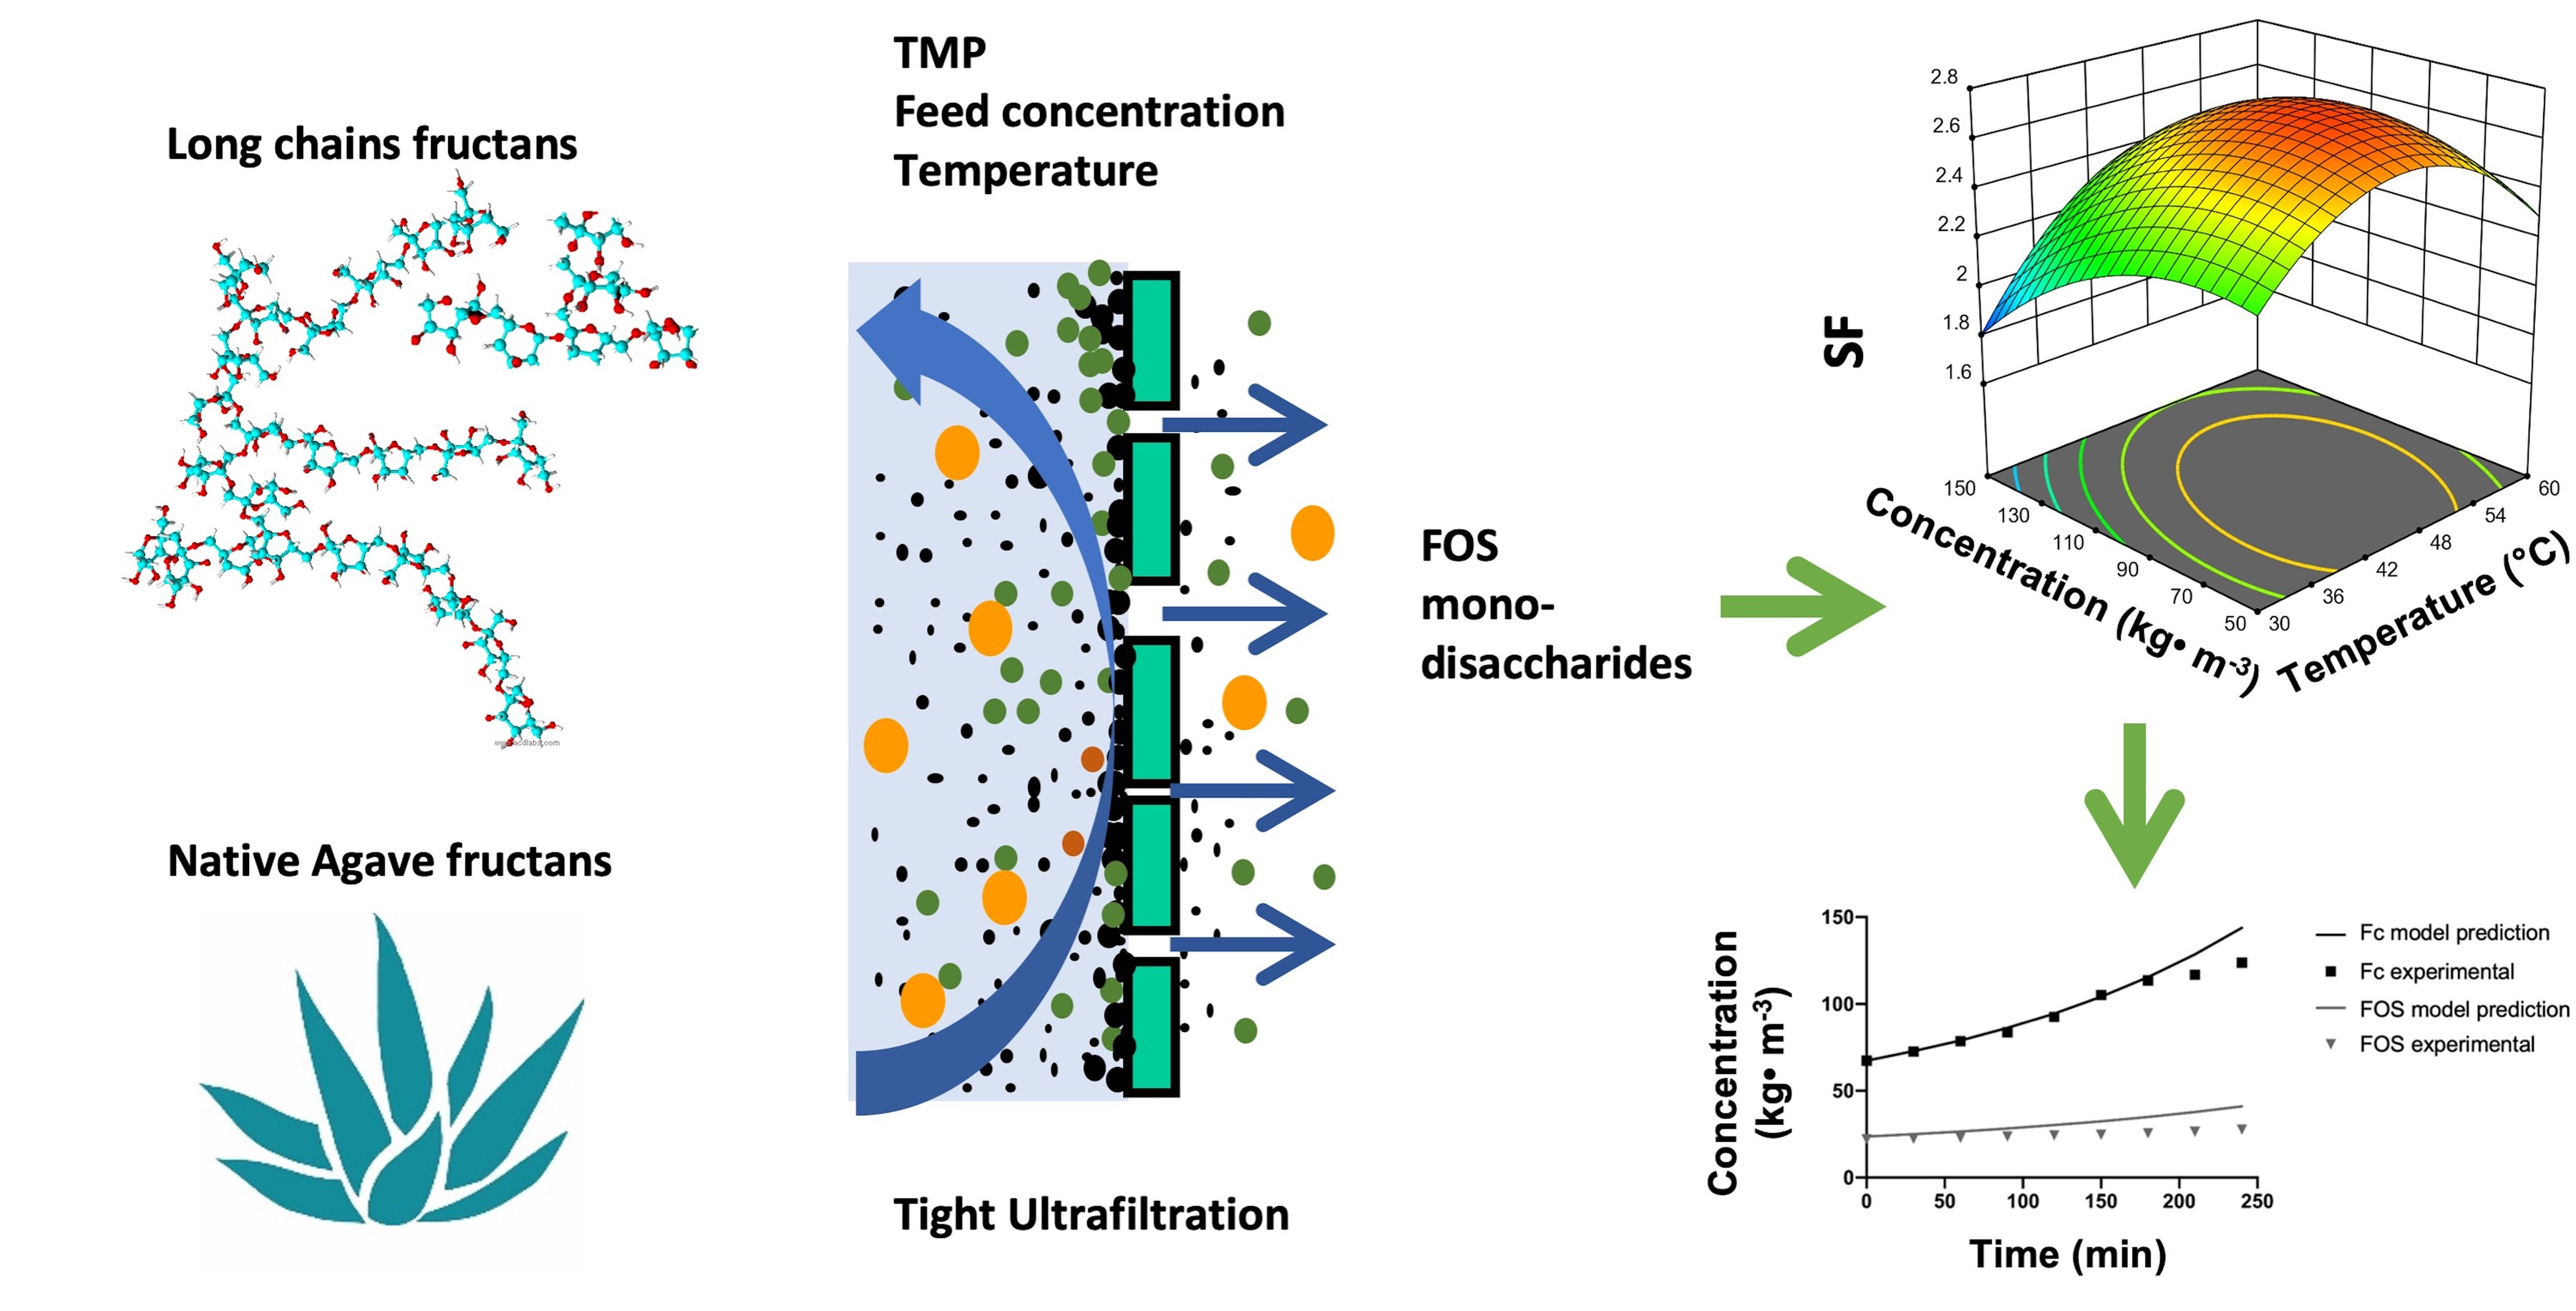
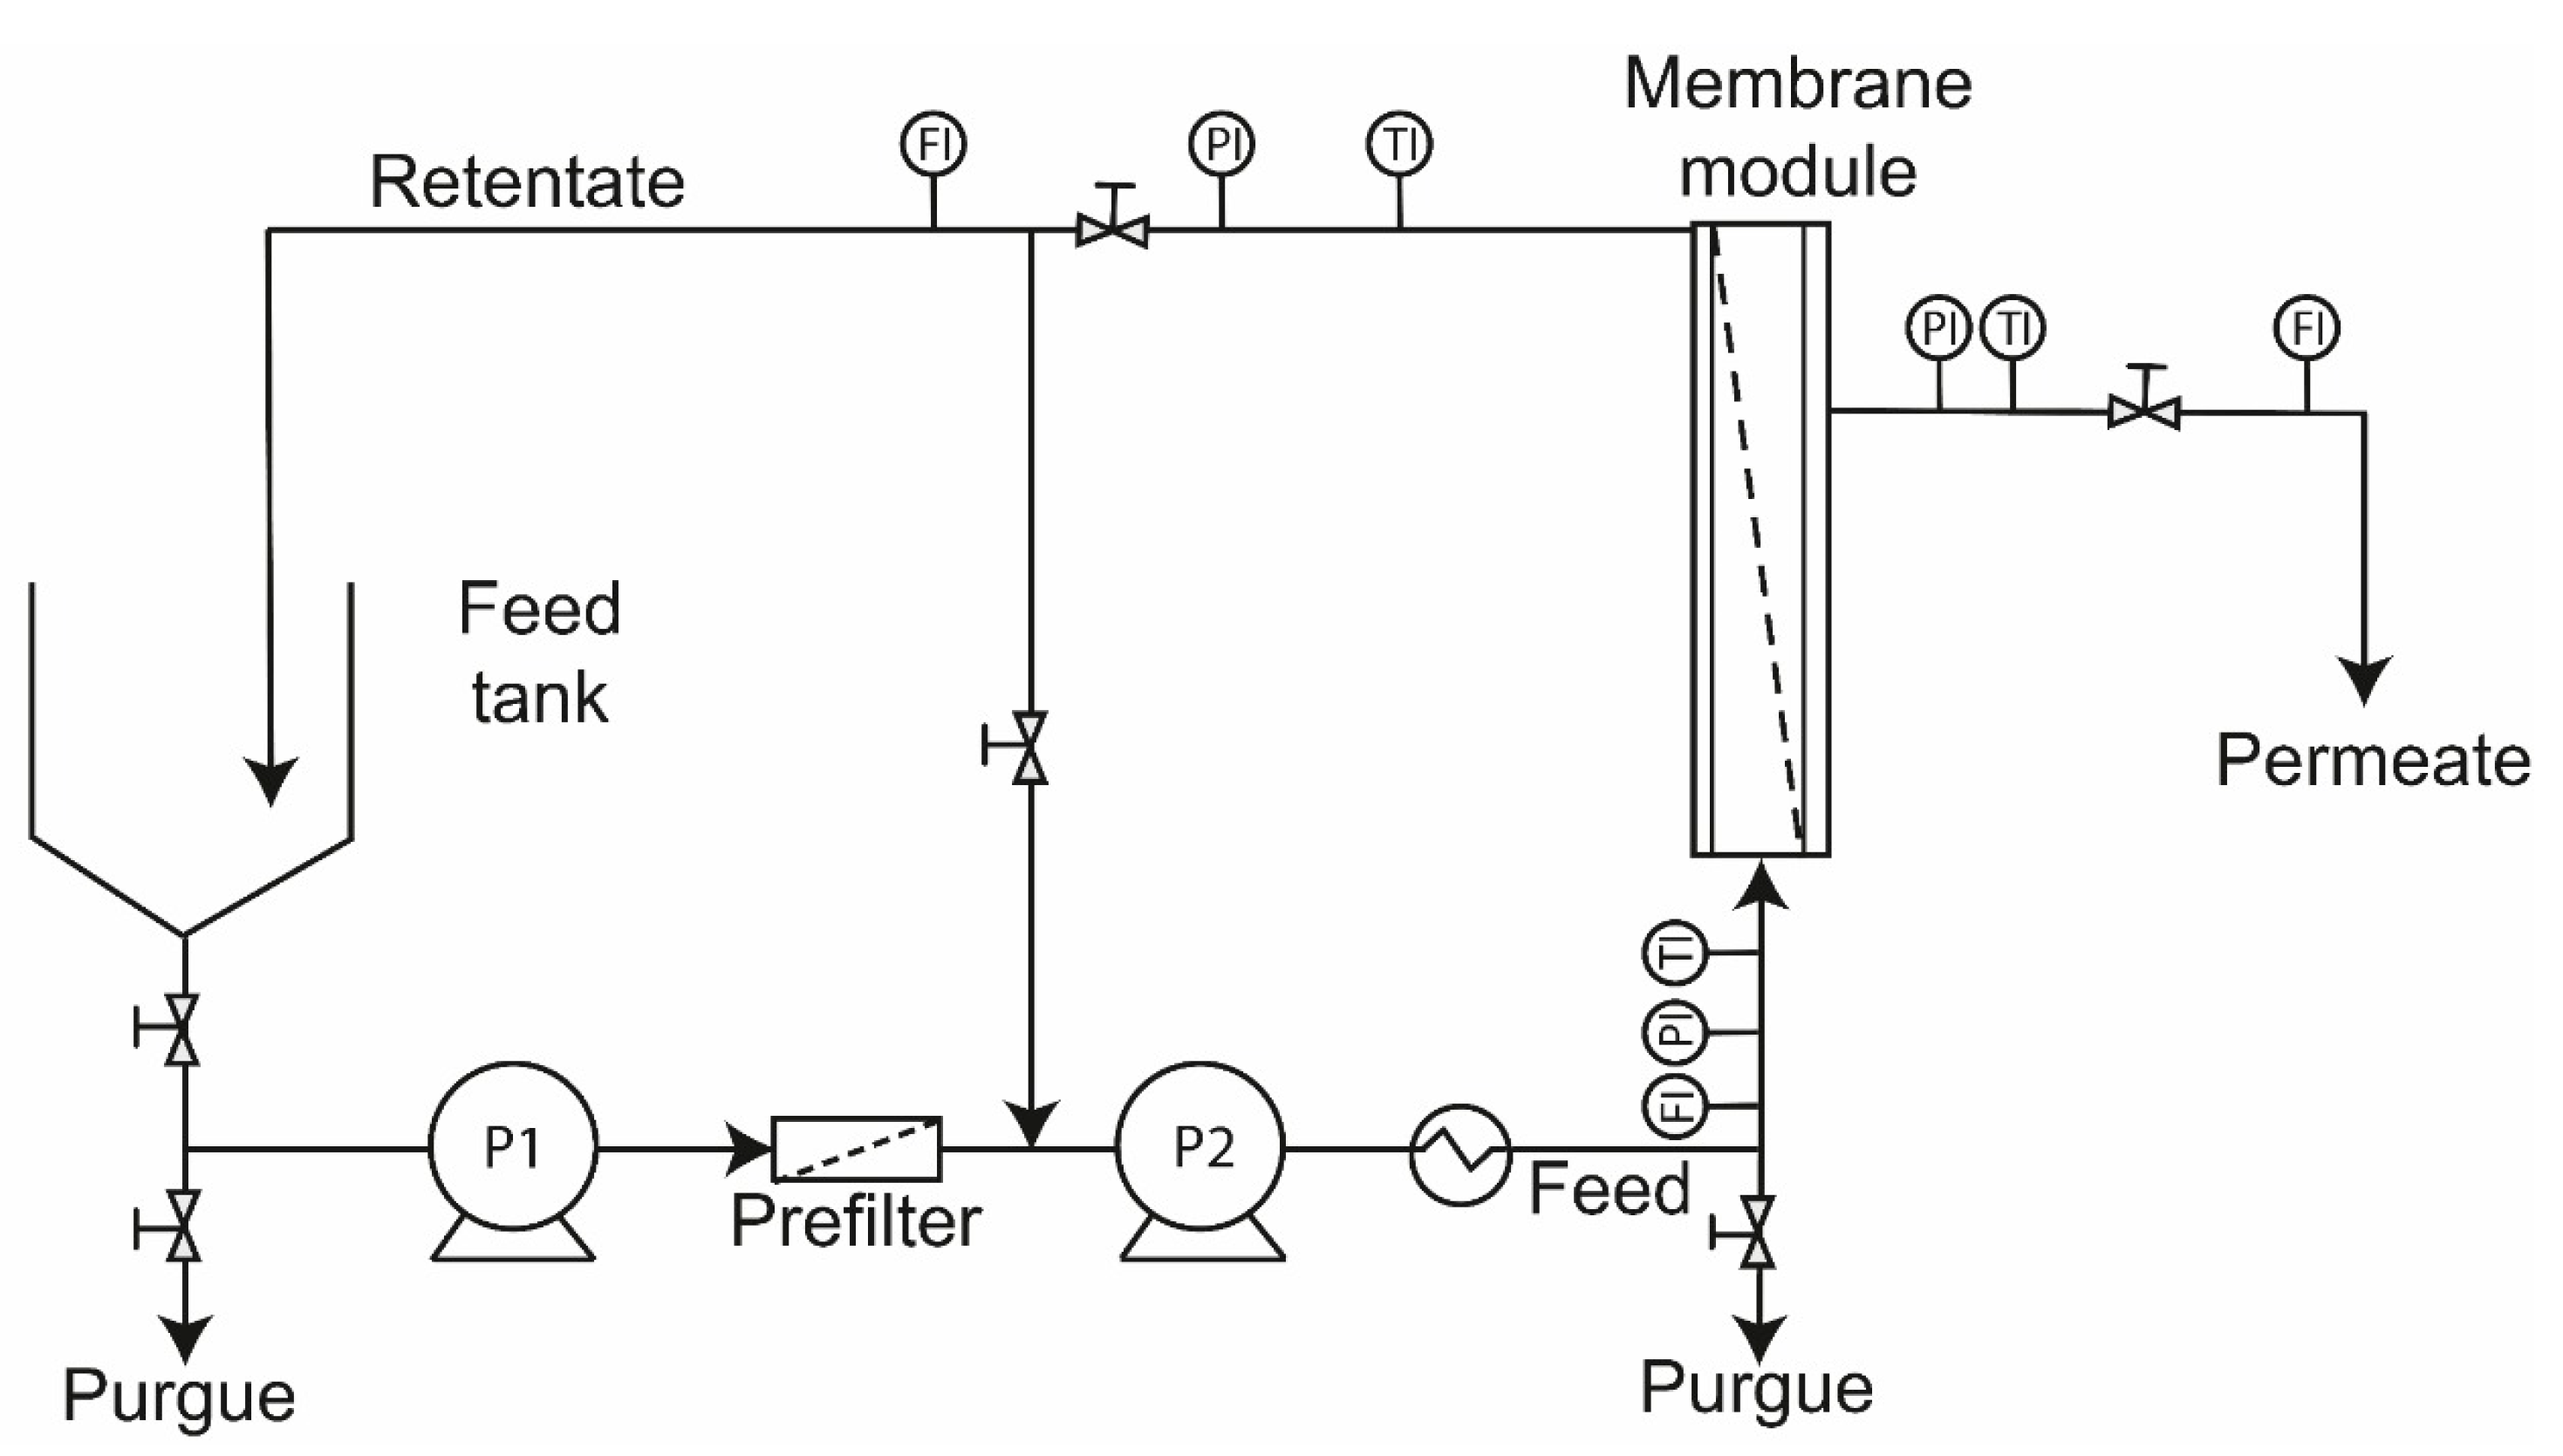
2.2. Membrane System and Procedures

The experiments were performed in a crossflow pilot scale filtration unit (CIATEJ design) equipped with a 150 L tank. The feed flow to the membrane was driven by a positive displacement pump and a rotary piston pump connected in series (APP 1.8, Danfoss, Seoul, Korea). The system has flow, pressure and temperature sensors connected to a PLC (programmable logic controller) with a digital panel display to monitor and control the operational parameters. A heat exchanger was placed before the membrane module to reach the operating temperature. A TiO2 ultrafiltration membrane (inside-Céram, TAMI Industries, Nyons, France) with 1 kDa MWCO was used, tubular configuration with 39 channels with dimensions of 25 mm in diameter and 1178 mm in length, with a filtration area of 0.5 m2 (Figure 1). The experiments were performed in full recirculation mode; the permeate and retentate streams were returned to the feed tank. The TMP was controlled with the retentate and permeate valves, and until the system reached stable conditions (permeate flow remained constant), a sample of the permeate and feed was taken.
After each run, the membrane was cleaned with 0.4 N of NaOH at 80 °C for 30 min. After rinsing with demineralized water for 30–35 min, the membrane was washed with HNO3 (5 mL∙L−1) at 50 °C for 15 min. Subsequently, a rinse with demineralized water was performed for about 30–35 min. The permeability was measured at 1–5 bar of TMP, the tangential velocity of 3 m∙s−1, and a temperature of 25 °C. This permeability was compared with the initial value (35 kg∙h−1∙m−2), finding a hydraulic recovery above 95% for all the experiments.

2.3. Experimental Box-Behnken Design

The operating conditions: temperature, TMP, and concentration were evaluated using the Box-Behnken design, which allows for assessing several factors with a reduced number of experiments, so it is considered a robust model [41,42].
It was considered that the UF process aims to be incorporated into the current production of agave fructans. Therefore, the level of 150 kg∙m−3 was chosen since it is the maximum concentration obtained in industrial processes. At the same time, the temperature at which fructans are obtained is around 60 °C [43], which favors the bacterial growth restriction. Regarding the TMP used, it has been reported that low pressures favor fractionation. The previous study reported by Luiz et al. [38] showed that in the range of 1 to 5 bar of TMP, better separation is obtained, for which these values were considered in this studio. Thus, the range of operating conditions was temperature (30–60 °C), TMP (1–5 bar) and feed concentration (50–150 kg∙m−3). The factors, code, and variation of levels are given in Table 1.
The relationship between the factors temperature (X1), TMP (X2), feed concentration (X3), and the response variables were adjusted to linear (Equation (1)) or quadratic (Equation (2)) models using the statistical software Design Expert with an analysis of variance (ANOVA) at a confidence level of 95% (p < 0.005). The model with a better fit was chosen.
    Y = β 0 + β 1 X 1 + β 2 X 2 + β 3 X 3 + β 12 X 1 X 2 + β 13 X 1 X 3 + β 23 X 2 X 3
Y = β 0 + β 1 X 1 + β 2 X 2 + β 3 X 3 + β 11 X 1 2 + β 22 X 2 2 + β 33 X 3 2 + β 12 X 1 X 2 + β 13 X 1 X 3 + β 23 X 2 X 3
where Y is the response variable, either separation factor or permeate flux, β0 is a constant obtained from response mean values, β1, β2, and β3 are the coefficients for the linear effect, β11, β22, and β33 are coefficients for quadratic effect and β12, β13, and β23 are the coefficients for the interaction effect.
The separation factor (SF) was defined by Equation (3) to evaluate the fractionation of fructans [44]
S F = ( FOS : F C ) P ( FOS : F C ) F
where the index P and F refer to the proportion of FOS and Fc in the permeate and the feed, respectively. Thus, higher SF values would indicate the best separation.
The solute flux (Ji) through the membrane was estimated using Equation (4).
J i = F P · C P A
where Fp is the mass flow in the permeate (m3⋅s−1), C P   is the permeate concentration (kg fructans∙m−3) and A is the membrane area (m2).

2.4. Mathematical Modeling

The effect of the native fructans size distribution (FOS:Fc proportions) on the apparent rejection and concentration profile was analyzed using a mass transfer model, solved by simultaneous equations. The polarization concentration model in terms of limiting flux is one of the most used models in ultrafiltration, which describes a concentration gradient where the molecules are deposited on the surface of the membrane, forming a layer that some authors have called gel concentration or limit concentration [45,46]. The study is based on this model under the following assumptions:
Unsteady state.
The transport of solutes is carried out in a single direction (flat plate).
Osmotic pressures of macromolecular solutions are negligible
The apparent rejection is constant throughout the process.
The process is in limited flow conditions.
Figure 1 illustrates the ultrafiltration process of this study, for which batch-type system balance equations were used, which are widely used in concentration batch mode of ultrafiltration studies [40,47]. This system has a key consideration in the process modeling, which assumes that the solute concentration is the same throughout the system; that is, in the feed tank and feed and retentate streams.
Where:
V F = Feed volume (m3), F P = is the permeate flow (m3⋅s−1),   F F = is the feed flow (m3⋅s−1), F R = is the retentate flow (m3⋅s−1) and V P = permeate volume (m3).
The change in volume of the system is due to the permeate flow collected, given by the following expression.
d V d t = F P
Equation (5) can be rewritten by considering the permeate flux and the membrane area.
d V d t = J l i m · A ,                                   V   ( 0 ) = V 0
The change in concentration in the system is given by Equation (7). Rewriting Equation (7) in terms of the rejection coefficient [28] (Equation (8))
  d C i d t = J l i m · A ·   C P , i
R o = ( 1 C P , i C i   )
The material balance for solute i can be expressed as Equation (9). The change in concentration of solute i in the feed tank with respect to time is due to the solute concentration in the permeate expressed in terms of the apparent rejection coefficient.
  d C i d t = C i V · J l i m · A   · R o , i ,   C i ( 0 ) = C i , 0 ,                           i = Fc ,   FOS
where C i is the concentration of solute i,  V is the volume of retentate at any time (t), J l i m is the permeate limit flux, A is the membrane area, R o is the apparent rejection of solute i (Equation (8)), C P , i is the permeate concentration and C i is the retentate concentration.
The J l i m (Equation (10)), obtained from the model proposed by Foley et al. [45,46], is related to the polarization concentration model in terms of the rejection coefficient and limit concentration.
J l i m = k · l n ( C l i m R o , i · C F c     1 R o , i R o , i )
C P , i = C r , i ( 1 R o , i )
where k is the mass transfer coefficient, C l i m is the limit concentration at the membrane boundary layer. The value of k and C l i m were obtained experimentally by plotting the natural logarithm of the concentration of the fructan mixture in a range of 50–250 kg∙m−3 on the abscissa axis versus the permeate flux with a TMP = 3 bar, 45 °C and a tangential speed of 3 m⋅s−1. The slope obtained corresponds to the mass transfer coefficient and C l i m corresponds to the value at which the permeate flux is equal to zero.
A correlation was introduced that would allow knowing a priori the rejection coefficient as a function of the FOS:Fc ratio in the initial sample. This correlation was obtained from the characterization of 15 batches of agave fructans based on the initial FOS:Fc ratio. Subsequently, three lots were selected and ultrafiltered with a TMP = 3 bar, 45 °C and 100 kg∙m−3 of concentration using the FOS:Fc proportions: 0.39, 0.35 and 0.23. The results obtained from R o were plotted as a function of the FOS:Fc ratio.
Finally, the estimated data of the concentration versus time obtained with the model were compared with the experimental data to validate the model. Thus, the permeate concentration values of each fraction of agave fructans were calculated from Equation (11). Equations (5)–(11) were resolved simultaneously using Matlab (Matlab software, Mathworks, Inc., Natick, MA, USA). The theoretical values obtained from fructans concentration were contrasted with the experimental data obtained through the sum of quadratic errors (SSE) using Equation (12).
SSE = i = 1 N ( F r u c t a n s   m o d e l   p r e d i c t e d i F r u c t a n s   e x p e r i m e n t a l i ) 2

2.5. Determination of Size Distribution of Agave Fructans

The size distribution of fructans at each stream for experimental design was analyzed by size exclusion chromatography HPLC-SEC, using a 1220 Infinity LC System for HPLC coupled with a refractive index detector (Agilent, Alpharetta, GA, USA) and an Ultrahydrogel DP column and guard column (7.8 mm d.i. × 300 mm, Waters, Milford, MA, USA) in the stationary phase, according to the methodology proposed by Moreno-Vilet et al. [5]. This technique allows obtaining a relative abundance of Fc, FOS and MD with DP 1–2 as glucose, fructose and sucrose.

3. Results

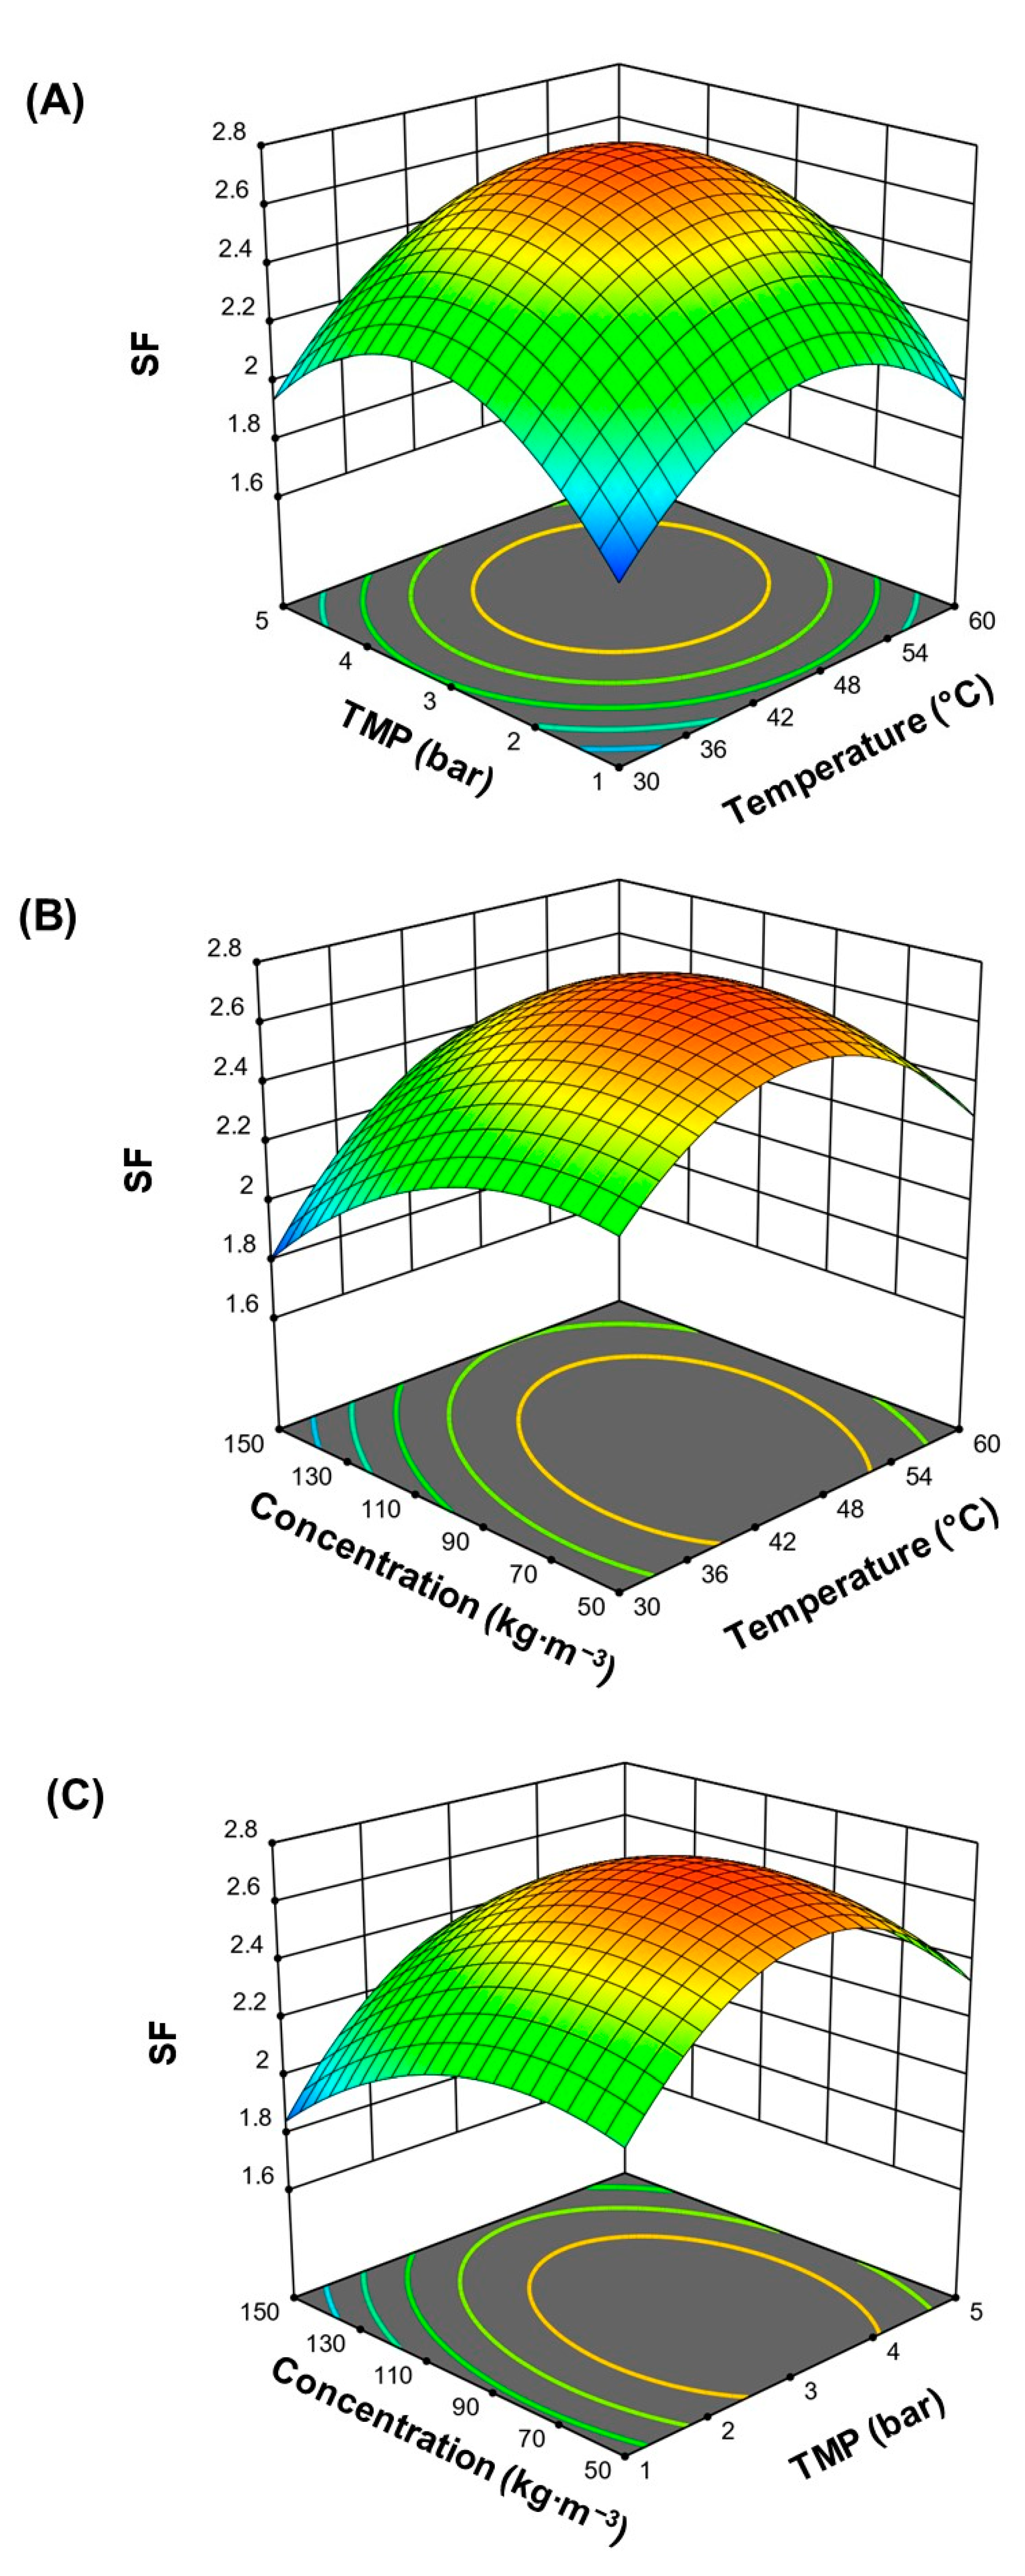
3.1. Experimental Box-Behnken Design: Effect of Operating Conditions on the Separation Factor

A total of 16 experiments were performed according to a Box-Behnken design with four center points. Table 2 shows the experimental matrix, runs, and results of the operating conditions on the fractionation of agave fructans measured by SF. The SF presented a range between 1.75 and 2.80 and the solute flux between 0.27 and 2.6 kg∙h−1∙m−2.
In order to know which factors were statistically significant, an analysis of variance was performed. All the factors and their interactions with the evaluation factors were significant except X1 X2 and X2 X3; the interactions X22 and X11 are the most important, indicating a significant model curvature. Table 3 summarizes the sum of squares, mean square, F-value, and p-value. For a 95% confidence level, the p-value should be less than or equal to 0.05 for an effect to be statistically significant.
After eliminating statistically insignificant parameters (X1 X2 and X2 X3), the model that presented the best fit was the quadratic with R2 and R2 adjusted over 94% (See Table 3). Equation (12) represents the second-order model with actual values for SF.
S F = 1.53 + 0.129117 · X 1 + 0.630625 · X 2 + 0.005425 · X 3 + 0.0001633 · X 1 · X 3 0.001533 · X 1 2 0.095625 · X 2 2 0.000077 · X 3 2
The positive values in Equation (13) mean that temperature, TMP and feed concentration: X1, X2, X3, as well as interaction X1, X3, produce an increase in SF, which is desirable in this process, while the negative coefficients in quadratic terms ( X 1 2 ,   X 2 2 ,   X 3 2 ) produces a decrease in SF.
Figure 2 shows the response surface of the major effects of operating conditions studied and their interactions on SF. The response surface was plotted by varying two operating factors, and the third factor was kept constant at center point conditions (Level 0 in Table 1) using Equation (13). It was observed that mean values of TMP and temperature, colored red on the graph, favored the SF (Figure 2A,B), which agrees with results previously reported by Luiz et al. [38], where an increase in the apparent rejection coefficient for the Fc and FOS at 3 bar was observed. However, by increasing the TMP to 5 bar, the SF decreases. The rise in TMP produces compaction of the boundary layer on the surface of the membrane that acts as an additional barrier [48], favoring its selectivity and increasing the apparent rejection coefficient. While increasing the temperature to 60 °C, a decrease in SF is observed, previously reported in 2 kDa membranes [49].
Better SF was obtained in concentrations of 50 to 100 kg∙m−3, which is attributed to the extended structure (higher molar volume) of fructans adopted at these concentrations [50]; therefore, it is more difficult for the Fc fractions to cross the membrane. While increasing the concentration to 150 kg∙m−3, the molar volume of agave fructans decreases so the Fc can be obtained in the permeate stream. Similar results were found by Moreno-Vilet et al. [51] to evaluate the effect of concentration on the purification of inulin.

3.2. Effect of Operating Conditions on the Permeate Flux

The solute permeates flux (Ji) was used to compare the productivity as a function of temperature, TMP, and initial feed concentration. The experimental results are shown in Table 2. Table 4 shows the results of the ANOVA analysis for Ji, which includes the sum of squares, mean square, F-value, and p-value. The results showed that the best fit is obtained using a linear model, with the three factors statistically significant (p < 0.005) and without significant interactions.
Equation (14) shows the regression model in actual values that describe the operating conditions evaluated with linear behavior for Ji.
J i = 1.16 + 0.3938 · X 1 + 0.5238 · X 2 + 0.3625 · X 3
The major productivity was shown at higher condition levels of 60 °C, 5 bar of TMP, and 150 kg∙m−3 of feed concentration (see Table 2). There was a positive effect of temperature on Ji, since it increases gradually with temperature, reaching the maximum value at 60 °C; that is, the opposite effect observed in SF, where it has a maximum at 45 °C but decreases at 60 °C. A common hypothesis is that increasing the temperature increases pore size, and, therefore, there is higher transit of solutes across the membrane when polymeric membranes are used [52,53]. Thus, in this case of ceramic membrane material, it is only attributed to the decrease in viscosity of the solution, which has been reported in a range of 0.048–0.051 dL∙g−1 for a temperature of 30 °C, which decrease as temperature increases to 60 °C [54], with a consequent rise in mass diffusion through the membrane [50,54].
There is a relationship between productivity and the initial concentration of fructans. According to the results, higher productivity could be obtained using a concentration of 150 kg∙m−3. This increase is attributed to a well-known phenomenon known as the concentration polarization, which is due to the accumulation of solute molecules on the membrane surface, forming a concentration gradient that facilitates the diffusion of solutes through the membrane with the aid of convective transport derived from the applied pressure [32,48].
To observe the effect of pressure, the TMP was evaluated in 1 to 5 bars. The typical behavior on the flow assessing different TMP levels can be divided into three regions [55]. The first is the linear relationship between permeate flux as pressure increases; in the second region, there is an increase in molecules on the membrane, so the linear relationship between TMP and permeate flux is no longer maintained. This inflection point is called critical flux, defined as the flux of permeate in transition between concentration by polarization and formation of the gel layer. Subsequently, the molecules form a gel on the membrane, where the increase in pressure does not cause changes in the flux, and transport in that area occurs by diffusion. In this case, the characteristic flow of the first region was observed due to a linear increase between TMP and permeate flow, so the transport in this zone is mainly by convection.

3.3. Optimization of Responses

In order to find the conditions that will improve the UF process, a method known as the desire function was carried out to optimize one or multiple responses. This function transforms each response level (Y1) into the desired score on a scale from 0 to 1. Subsequently, the individual desires are added to obtain a global desire, where the value close to 1 is considered desirable and a value close to zero undesirable.
Thus, using operational parameters within the range, maximum values of Ji and SF were searched simultaneously. Table 5 shows the optimization results considering either one or two responses. With multiple responses, an SF of 2.57 and Ji of 1.82 kg∙h−1∙m−2 of fructans were obtained with the desirability of 0.72, which, according to Svetlana et al. [56], is considered an acceptable value. The optimal values obtained for the fractionation of agave fructans are higher than those reported by Luiz et al. [38], who only used different values of TMP at 45 °C; however, similar trends were obtained.
On the other hand, considering only one response (SF), better results were obtained, reaching a desirability of 0.94. There is scarce literature that analyzes the separation of fractions in quantitative terms; within these, Cordova et al. [33] obtained SF around 1.22 to 1.94 for the separation of galactooligosaccharides and lactose, which are lower than the data obtained in this study, where values up to 2 were reached. In other studies, Rizki et al. [57] studied oligosaccharide fractionation by nanofiltration cascades with three-outlet streams to separate DP1, DP3 and DP ≥ 5 from a FOS syrup, where the SF between DP 3 and DP 5 reached a value of 5 when four stages are used. In this case, the obtention of two fractions: one enriched of FOS and one enriched of Fc is needed; thus, these results can assume that FOS:Fc proportion is 2.74-times enriched in permeate stream concerning feed stream, using only one membrane stage.
The quadratic model validation was carried out by analyzing four experiments on different batches of native fructans, whose results are shown in Table 6. Predicted values were calculated with Equation (13) and represent the theoretical value of SF. The comparison between predicted and experimental SF values for different operational conditions (experiments 1 and 3) supports the validity of the model to predict, including an experiment replicating at optimal conditions obtained (experiment 4).
Notably, the higher differences in SF values found (samples 1, 2 and 4) can be attributed to the different compositions of feed material (shown in column 2), since only experiment 3 contained almost the same composition of the experimental design runs and presented the least deviation. It demonstrated that not only are the total solid concentrations of feed solution, TMP and temperature, the factors that could affect the separation efficiency, but the composition of the feed solution is also important. Therefore, a more in-depth study is required to know how the size distribution of native fructans affects the UF fractionation process.

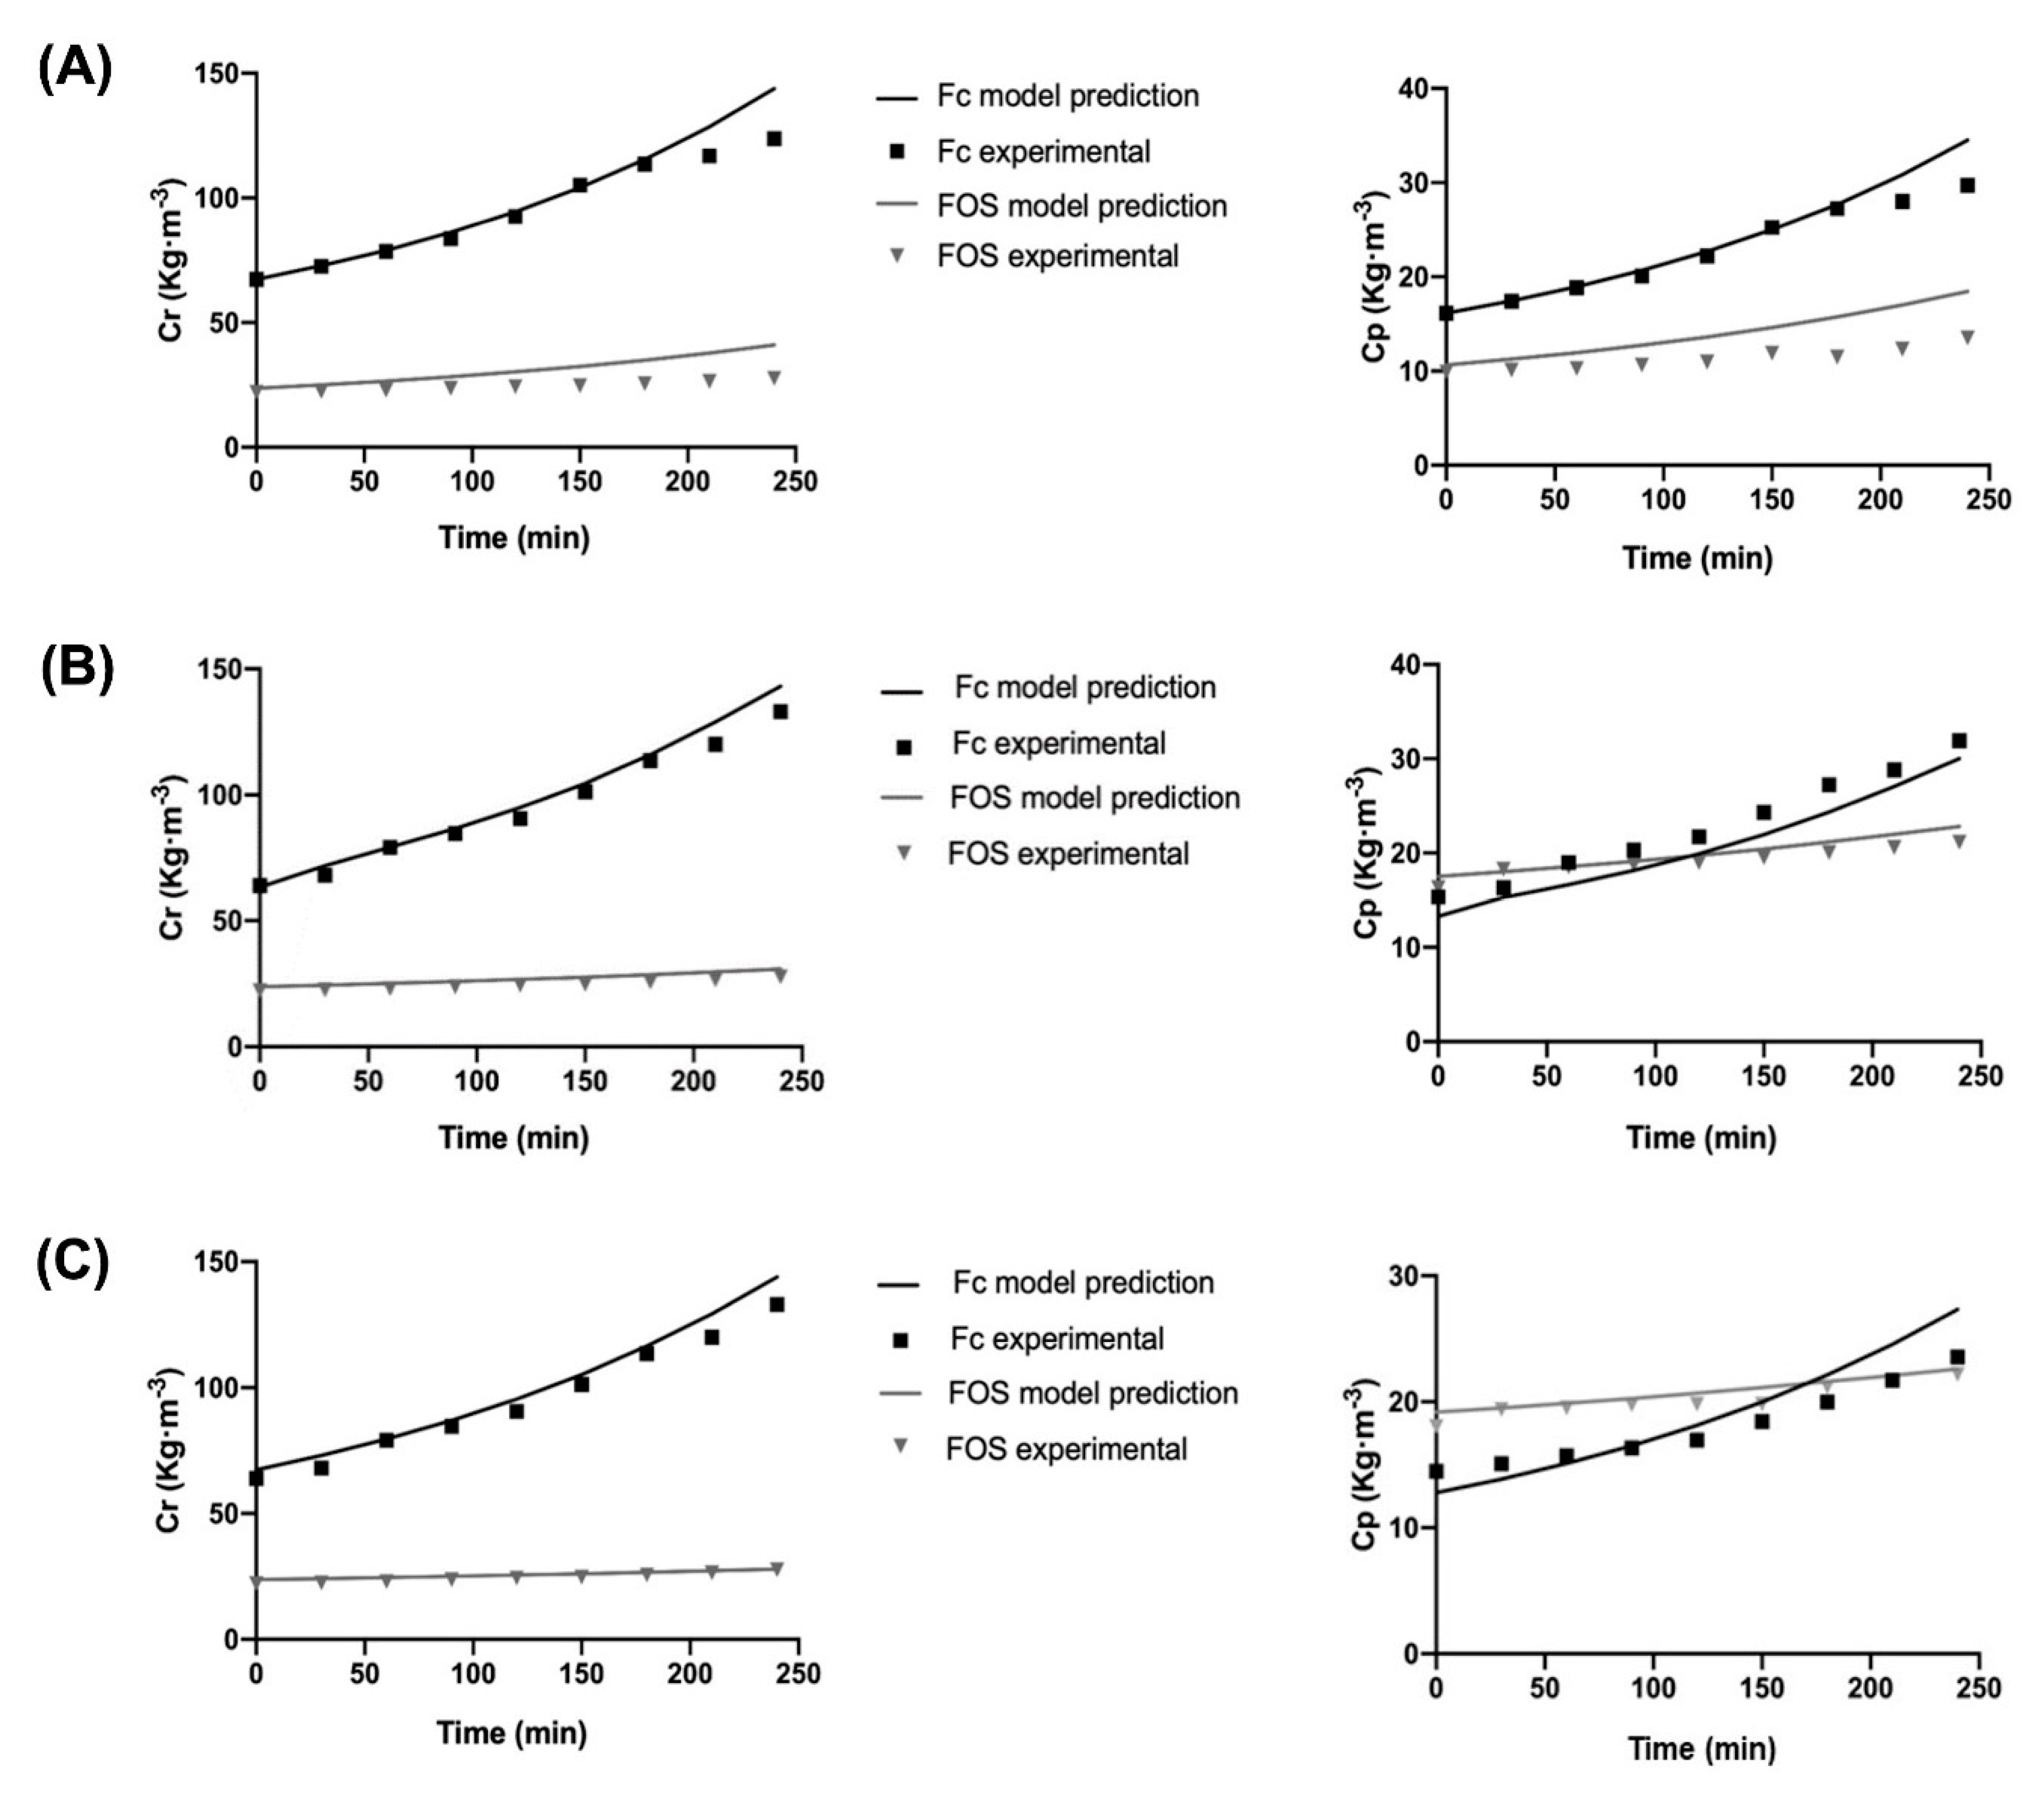
3.4. Mathematical Modeling for Different Native Fructans Size Distribution

In order to analyze the effect of the native fructans size distribution (FOS:Fc proportions) on the fractionation process, 15 batches of native agave fructans were characterized, the results of which are shown in Figure 3A. The total carbohydrate content based on 100% distributed in Fc, FOS and approximately 10% MD was considered. It is observed that there is a linear relationship between the percentage of FOS and Fc obtained from 15 batches.
Figure 3B shows the results of three ultrafiltered batches that represent the FOS:Fc portions within the range found in the 15 batches. As expected, the long chains Fc present higher apparent rejection than short chains or FOS; however, this behavior is modified depending on FOS:Fc proportions. As the proportion of short chains in the feed stream increases, the Ro FOS falls from 55% to 18.5%, and Ro Fc remains almost constant between 76 and 83%. It means that as the size of molecules decreases, convective transport has a greater effect on its retention, and more FOS molecules pass through the membrane; thus, the fractionation process is favored at higher proportions of FOS:Fc.
To predict the behavior of the concentrations profile over time at the outlet of the pilot scale, a mathematical model of limiting mass flux transfer was used, in which it is necessary to know the parameters of Equations (5)–(11). Figure 3C illustrates the permeate flux vs. logarithm of agave fructan concentration, where the calculated value of C l i m , obtained at permeate flux equal to zero, was 337.61 kg⋅m−3; this value is higher than the reported for commercial inulin LGI of 198 g⋅L−1 [51]. These differences are attributed to the solubility, which, in the case of native inulin (2 ≤ DP ≤ 60), has reported a value of 120 g⋅L−1 at 25 °C [58]; after that point, a gel is formed. At the same time, this phenomenon does not occur with agave fructans [54]. On the other hand, the mass transfer coefficient k = 6.31⋅10−6 m⋅s−1 (Figure 3C) is close to the values found by Kuhn et al. [39] for FOS (between k = 9.4⋅10−6 and 10.6⋅10−6 m⋅s−1).
Figure 4 shows the concentration profile against the time of the FOS:Fc ratios of 0.23, 0.35 and 0.39, which were obtained experimentally and predicted. As it can be seen, there is an agreement between the experimental and theoretical data obtained from the proposed model, which validates the model for the fractionation process of agave fructans.
The results show a relationship between the initial FOS:Fc ratio and the final composition. As there is a higher proportion of FOS:Fc in the initial fructans sample, FOS concentration in the permeate is higher concerning the Fc. On the other hand, there is an increase in the concentration in the retentate stream due to the decrease in volume.
The values of SSE (Equation (12)) for Fc in the retentate streams were: 551.78, 242.32 and 296.09 for proportions 0.23, 0.35 and 0.39, respectively. It means that a greater error between the experimental and predicted data was observed with a higher concentration of Fc in the initial sample; however, similar SSE values are obtained at 0.35 and 0.39 proportions. In contrast, the values obtained of SSE for FOS in the retentate stream were: 533.55, 58.76 and 15.28 for proportions of 0.23, 0.35 and 0.39, respectively, which indicates a good fit for 0.35 and 0.39. Regarding permeate concentration profiles, for Fc, SSE values are 31.78, 39.01 and 35.6 for proportions 0.23, 0.35 and 0.39, respectively, which are very close values. While for FOS concentration, SSE values are 88.32, 8.98 and 4.91 for proportions 0.23, 0.35 and 0.39, respectively, which are very low values due to the lowest concentrations obtained at permeate of around 10 kg∙m−3, but clearly show a tendency for higher error as the proportion of FOS:Fc decreases or if there is a higher concentration of Fc in the initial sample.
The above deviations in some experimental data could be attributed to membrane fouling, which is not considered in the model and has been reported to reach values of around 14% of the global resistance generated in the UF process of agave fructans using ceramic systems [38]. Another hypothesis is that depending on the proportion of FOS:Fc in the initial sample, the composition also changes in the limiting layer of the membrane; therefore, different osmotic pressure values could be generated, as occurs in solutions of dextran and polyethylene glycol, which has been reported to be greater than 10–15 psi (0.68–1.03 bar) [59]. The above suggests a complex process due to low molecular weight components, so future work considering the effect of fouling in the model is needed to understand the process better.

4. Conclusions

It was shown that tight ultrafiltration is a viable technology for the fractionation of native agave fructans at a pilot level. The Box-Behnken design allowed us to determine the significant parameters, investigate the interaction between them, and optimize operational conditions such as temperature, TMP, and feed concentration to maximize the separation factor using a tight UF membrane of 1 kDa. The optimization of the response function allowed us to establish the conditions to obtain the maximum performance of the separation factor, which resulted in operating conditions of 46.81 °C, 3.27 bar, and 85.70 kg∙m−3. The results show that the fractionation process is favored at higher proportions of FOS:Fc in native agave fructans.
The limiting flux model was validated for the fractionation of agave fructans application within the studied domain to predict the concentration profiles in the permeate and retentate streams from the initial composition of the feed material. Therefore, these results show areas of opportunity for understanding mass transfer phenomena. In turn, a mathematical model is a tool that facilitates decision making in the practical operation of fructan fractionation in the industry.

Author Contributions

Conceptualization, N.L.-S., R.P.-R. and L.M.-V.; methodology, N.L.-S. and R.M.C.-R.; software, N.L.-S.; validation, N.L.-S., R.P.-R. and R.M.C.-R.; formal analysis, N.L.-S., E.A.-G., G.M.G.-M. and L.M.-V.; investigation, R.P.-R., E.A.-G. and L.M.-V.; resources, L.M.-V.; data curation, N.L.-S. and L.M.-V.; writing—original draft preparation, N.L.-S. and L.M.-V.; writing—review and editing, R.P.-R., R.M.C.-R. and L.M.-V.; visualization, L.M.-V.; supervision, G.M.G.-M. and R.P.-R.; project administration, L.M.-V.; funding acquisition, R.P.-R., R.M.C.-R. and L.M.-V. All authors have read and agreed to the published version of the manuscript.

Funding

This research was funded by project SEP-CONACYT 287926, México.

Institutional Review Board Statement

Not applicable.

Informed Consent Statement

Not applicable.

Acknowledgments

The authors thank to Nutriagaves de Mexico for kindly supplying the raw material and the financial support of project SEP-CONACYT 287926, México.

Conflicts of Interest

The authors declare no conflict of interest.

References

  1. Praznik, W.; Loeppert, R.; Viernstein, H.; Haslberger, A.G.; Unger, F.M. Dietary Fiber and Prebiotics. In Polysaccharides: Bioactivity and Biotechnology; Ramawat, K., Mérillon, J.M., Eds.; Springer: Cham, Switzerland, 2015; pp. 891–925. [Google Scholar] [CrossRef]
  2. Sankarapandian, V.; Nitharsan, K.; Parangusadoss, K.; Gangadaran, P. Prebiotic Potential and Value-Added Products Derived from Spirulina Laxissima SV001—A Step towards Healthy Living. BioTech 2022, 11, 13. [Google Scholar] [CrossRef]
  3. Cunningham, M.; Azcarate-Peril, M.A.; Barnard, A.; Benoit, V.; Grimaldi, R.; Guyonnet, D.; Holscher, H.D.; Hunter, K.; Manurung, S.; Obis, D.; et al. Shaping the Future of Probiotics and Prebiotics. Trends Microbiol. 2021, 29, 667–685. [Google Scholar] [CrossRef] [PubMed]
  4. Ávila-Fernández, Á.; Galicia-Lagunas, N.; Rodríguez-Alegría, M.E.; Olvera, C.; López-Munguía, A. Production of Functional Oligosaccharides through Limited Acid Hydrolysis of Agave Fructans. Food Chem. 2011, 129, 380–386. [Google Scholar] [CrossRef] [PubMed]
  5. Moreno-Vilet, L.; Bostyn, S.; Flores-Montaño, J.L.; Camacho-Ruiz, R.M. Size-Exclusion Chromatography (HPLC-SEC) Technique Optimization by Simplex Method to Estimate Molecular Weight Distribution of Agave Fructans. Food Chem. 2017, 237, 833–840. [Google Scholar] [CrossRef] [PubMed]
  6. Godínez-Hernández, C.I.; Aguirre-Rivera, J.R.; Juárez-Flores, B.I.; Ortiz-Pérez, M.D.; Becerra-Jiménez, J. Extraction and Characterization of Agave Salmiana Otto Ex Salm-Dyck Fructans. Rev. Chapingo Ser. Ciencias For. Ambient. 2015, 22, 59–72. [Google Scholar] [CrossRef]
  7. Arrizon, J.; Morel, S.; Gschaedler, A.; Monsan, P. Comparison of the Water-Soluble Carbohydrate Composition and Fructan Structures of Agave Tequilana Plants of Different Ages. Food Chem. 2010, 122, 123–130. [Google Scholar] [CrossRef]
  8. Ramnani, P.; Costabile, A.; Bustillo, A.G.R.; Gibson, G.R. A Randomised, Double- Blind, Cross-over Study Investigating the Prebiotic Effect of Agave Fructans in Healthy Human Subjects. J. Nutr. Sci. 2015, 4, e10. [Google Scholar] [CrossRef] [Green Version]
  9. Urías-Silvas, J.E.; Cani, P.D.; Delmée, E.; Neyrinck, A.; López, M.G.; Delzenne, N.M. Physiological Effects of Dietary Fructans Extracted from Agave tequilana Gto. and Dasylirion Spp. Br. J. Nutr. 2008, 99, 254–261. [Google Scholar] [CrossRef] [Green Version]
  10. Sáyago-Ayerdi, S.G.; Mateos, R.; Ortiz-Basurto, R.I.; Largo, C.; Serrano, J.; Granado-Serrano, A.B.; Sarriá, B.; Bravo, L.; Tabernero, M. Effects of Consuming Diets Containing Agave Tequilana Dietary Fibre and Jamaica Calyces on Body Weight Gain and Redox Status in Hypercholesterolemic Rats. Food Chem. 2014, 148, 54–59. [Google Scholar] [CrossRef] [Green Version]
  11. Padilla-Camberos, E.; Barragán-Álvarez, C.P.; Diaz-Martinez, N.E.; Rathod, V.; Flores-Fernández, J.M. Effects of Agave Fructans (Agave Tequilana Weber Var. Azul) on Body Fat and Serum Lipids in Obesity. Plant Foods Hum. Nutr. 2018, 73, 34–39. [Google Scholar] [CrossRef]
  12. Espinosa-Andrews, H.; Urías-Silvas, J.E.; Morales-Hernández, N. The Role of Agave Fructans in Health and Food Applications: A Review. Trends Food Sci. Technol. 2021, 114, 585–598. [Google Scholar] [CrossRef]
  13. Crispín-Isidro, G.; Lobato-Calleros, C.; Espinosa-Andrews, H.; Alvarez-Ramirez, J.; Vernon-Carter, E.J. Effect of Inulin and Agave Fructans Addition on the Rheological, Microstructural and Sensory Properties of Reduced-Fat Stirred Yogurt. LWT-Food Sci. Technol. 2015, 62, 438–444. [Google Scholar] [CrossRef]
  14. Palatnik, D.R.; Aldrete Herrera, P.; Rinaldoni, A.N.; Ortiz Basurto, R.I.; Campderrós, M.E. Development of Reduced-Fat Cheeses with the Addition of Agave Fructans. Int. J. Dairy Technol. 2017, 70, 212–219. [Google Scholar] [CrossRef]
  15. Santiago-García, P.A.; Mellado-Mojica, E.; León-Martínez, F.M.; López, M.G. Evaluation of Agave Angustifolia Fructans as Fat Replacer in the Cookies Manufacture. LWT-Food Sci. Technol. 2017, 77, 100–109. [Google Scholar] [CrossRef]
  16. Ortiz-Basurto, R.I.; Rubio-Ibarra, M.E.; Ragazzo-Sanchez, J.A.; Beristain, C.I.; Jiménez-Fernández, M. Microencapsulation of Eugenia uniflora L. Juice by Spray Drying Using Fructans with Different Degrees of Polymerisation. Carbohydr. Polym. 2017, 175, 603–609. [Google Scholar] [CrossRef]
  17. Jimenez-Sánchez, D.E.; Calderón-Santoyo, M.; Ortiz-Basurto, R.I.; Bautista-Rosales, P.U.; Ragazzo-Sánchez, J.A. Effect of Maltodextrin Reduction and Native Agave Fructans Addition on the Physicochemical Properties of Spray-Dried Mango and Pineapple Juices. Food Sci. Technol. Int. 2018, 24, 519–532. [Google Scholar] [CrossRef] [PubMed]
  18. Mueller, M.; Reiner, J.; Fleischhacker, L.; Viernstein, H.; Loeppert, R.; Praznik, W. Growth of Selected Probiotic Strains with Fructans from Different Sources Relating to Degree of Polymerization and Structure. J. Funct. Foods 2016, 24, 264–275. [Google Scholar] [CrossRef]
  19. Márquez-Aguirre, A.L.; Camacho-Ruiz, R.M.; Arriaga-Alba, M.; Padilla-Camberos, E.; Kirchmayr, M.R.; Blasco, J.L.; González-Avila, M. Effects of Agave Tequilana Fructans with Different Degree of Polymerization Profiles on the Body Weight, Blood Lipids and Count of Fecal Lactobacilli/Bifidobacteria in Obese Mice. Food Funct. 2013, 4, 1237–1244. [Google Scholar] [CrossRef] [PubMed]
  20. Márquez-Aguirre, A.L.; Camacho-Ruíz, R.M.; Gutiérrez-Mercado, Y.K.; Padilla-Camberos, E.; González-Ávila, M.; Gálvez-Gastélum, F.J.; Díaz-Martínez, N.E.; Ortuño-Sahagún, D. Fructans from Agave Tequilana with a Lower Degree of Polymerization Prevent Weight Gain, Hyperglycemia and Liver Steatosis in High-Fat Diet-Induced Obese Mice. Plant Foods Hum. Nutr. 2016, 71, 416–421. [Google Scholar] [CrossRef] [Green Version]
  21. Castellanos-Pérez, N.; Rodríguez-Mendiola, M.A.; De Alba, P.L.L.; Martínez, L.L.; Gutiérrez-Miceli, F.A.; Arias-Castro, C. Optimización de Los Procesos de Extracción y Fraccionamiento Por Grado de Polimerización de Fructanos, Obtenidos a Partir de Agave Tequilana Weber Var. Azul, Para La Obtención de Prebióticos. Gayana Bot. 2012, 69 (Suppl. 1), 31–39. [Google Scholar]
  22. Singh, R. Introduction to Membrane Technology. In Membrane Technology and Engineering for Water Purification, 2nd ed.; Butterworth-Heinemann: Oxford, UK, 2015; pp. 1–80. [Google Scholar] [CrossRef]
  23. Hofs, B.; Ogier, J.; Vries, D.; Beerendonk, E.F.; Cornelissen, E.R. Comparison of Ceramic and Polymeric Membrane Permeability and Fouling Using Surface Water. Sep. Purif. Technol. 2011, 79, 365–374. [Google Scholar] [CrossRef]
  24. Diná Afonso, M.; Ferrer, J.; Bórquez, R. An Economic Assessment of Proteins Recovery from Fish Meal Effluents by Ultrafiltration. Trends Food Sci. Technol. 2004, 15, 506–512. [Google Scholar] [CrossRef]
  25. Walha, K.; Ben Amar, R.; Massé, A.; Bourseau, P.; Cardinal, M.; Cornet, J.; Prost, C.; Jaouen, P. Aromas Potentiality of Tuna Cooking Juice Concentrated by Nanofiltration. LWT-Food Sci. Technol. 2011, 44, 153–157. [Google Scholar] [CrossRef] [Green Version]
  26. Grangeon, A.; Lescoche, P. Flat Ceramic Membranes for the Treatment of Dairy Products: Comparison with Tubular Ceramic Membranes. Lait 2000, 80, 5–14. [Google Scholar] [CrossRef] [Green Version]
  27. Li, M.; Zhao, Y.; Zhou, S.; Xing, W.; Wong, F.S. Resistance Analysis for Ceramic Membrane Microfiltration of Raw Soy Sauce. J. Memb. Sci. 2007, 299, 122–129. [Google Scholar] [CrossRef]
  28. Almandoz, C.; Pagliero, C.; Ochoa, A.; Marchese, J. Corn Syrup Clarification by Microfiltration with Ceramic Membranes. J. Memb. Sci. 2010, 363, 87–95. [Google Scholar] [CrossRef]
  29. Hinkova, A.; Bubník, Z.; Kadlec, P.; Pridal, J. Potentials of Separation Membranes in the Sugar Industry. Sep. Purif. Technol. 2002, 26, 101–110. [Google Scholar] [CrossRef]
  30. Vegas, R.; Moure, A.; Domínguez, H.; Parajó, J.C.; Alvarez, J.R.; Luque, S. Evaluation of Ultra- and Nanofiltration for Refining Soluble Products from Rice Husk Xylan. Bioresour. Technol. 2008, 99, 5341–5351. [Google Scholar] [CrossRef]
  31. Aguirre Montesdeoca, V.; Janssen, A.E.M.; Boom, R.M.; Van der Padt, A. Fine Ultrafiltration of Concentrated Oligosaccharide Solutions—Hydration and Pore Size Distribution Effects. J. Memb. Sci. 2019, 580, 161–176. [Google Scholar] [CrossRef]
  32. Machado, M.T.C.; Trevisan, S.; Pimentel-Souza, J.D.R.; Pastore, G.M.; Hubinger, M.D. Clarification and Concentration of Oligosaccharides from Artichoke Extract by a Sequential Process with Microfiltration and Nanofiltration Membranes. J. Food Eng. 2016, 180, 120–128. [Google Scholar] [CrossRef]
  33. Córdova, A.; Astudillo, C.; Santibañez, L.; Cassano, A.; Ruby-Figueroa, R.; Illanes, A. Purification of Galacto-Oligosaccharides (GOS) by Three-Stage Serial Nanofiltration Units under Critical Transmembrane Pressure Conditions. Chem. Eng. Res. Des. 2017, 117, 488–499. [Google Scholar] [CrossRef]
  34. Reynoso-Ponce, H.; Grajales-Lagunes, A.; Castillo-Andrade, A.; González-García, R.; Ruiz-Cabrera, M.A. Integration of Nanofiltration and Spray Drying Processes for Enhancing the Purity of Powdered Fructans from Agave Salmiana Juice. Powder Technol. 2017, 322, 96–105. [Google Scholar] [CrossRef]
  35. Moreno-Vilet, L.; Moscosa-Santillán, M.; Grajales-Lagunes, A.; González-Chávez, M.; Bonnin-Paris, J.; Bostyn, S.; Ruiz-Cabrera, M. Sugars and Fructans Separation by Nanofiltration from Model Sugar Solution and Comparative Study with Natural Agave Juice. Sep. Sci. Technol. 2013, 48, 1768–1776. [Google Scholar] [CrossRef]
  36. Flores Montaño, J.L.; Camacho Ruiz, R.M.; Prado Ramírez, R.; Morena Vilet, L.; Luiz Santos, N.; Mendoza Rivera, M.; de los, Á.; Ballón Villagrá, A. Fructanos Fraccionados de Agave y Su Proceso de Obtención a Nivel Piloto e Industrial. MX Patent 375478 B, 15 October 2015. Available online: https://vidoc.impi.gob.mx/visor?usr=SIGA&texp=SI&tdoc=E&id=MX/a/2015/014523 (accessed on 28 April 2022).
  37. Pérez Martínez, F.J.; Gonzalez Avila, M.; Camacho Ruiz, R.M.; Márquez Aguirre, A.L.; Alonso Segura, D.; Gschaedler Mathis, A.C.; Prado Ramírez, R.; Flores Montaño, J.L.; Mateos Díaz, J.C.; Arrizón Gaviño, J.P. Fructanos Fraccionados de Agave, Proceso de Obtención y Uso de Los Mismos. MX Patent 367976 B, 30 April 2013. Available online: https://vidoc.impi.gob.mx/visor?usr=SIGA&texp=SI&tdoc=E&id=MX/a/2013/004903 (accessed on 28 April 2022).
  38. Luiz-Santos, N.; Prado-Ramírez, R.; Arriola-Guevara, E.; Camacho-Ruiz, R.M.; Moreno-Vilet, L. Performance Evaluation of Tight Ultrafiltration Membrane Systems at Pilot Scale for Agave Fructans Fractionation and Purification. Membranes 2020, 10, 261. [Google Scholar] [CrossRef]
  39. Kuhn, R.C.; Maugeri Filho, F.; Silva, V.; Palacio, L.; Hernández, A.; Prádanos, P. Mass Transfer and Transport during Purification of Fructooligosaccharides by Nanofiltration. J. Memb. Sci. 2010, 365, 356–365. [Google Scholar] [CrossRef]
  40. González-Muñoz, M.J.; Parajó, J.C. Diafiltration of Eucalyptus Wood Autohydrolysis Liquors: Mathematical Modeling. J. Memb. Sci. 2010, 346, 98–104. [Google Scholar] [CrossRef]
  41. Ferreira, S.L.C.; Bruns, R.E.; Ferreira, H.S.; Matos, G.D.; David, J.M.; Brand, G.C.; Silva, E.G.P.; Reis, P.S.; Souza, A.S.; Santos, W.N.L. Box-Behnken Design: An Alternative for the Optimization of Analytical Methods. Anal. Chim. Acta 2007, 597, 179–186. [Google Scholar] [CrossRef]
  42. Ruby-figueroa, R.; Cassano, A.; Drioli, E. Ultrafiltration of Orange Press Liquor: Optimization of Operating Conditions for the Recovery of Antioxidant Compounds by Response Surface Methodology. Sep. Purif. Technol. 2012, 98, 255–261. [Google Scholar] [CrossRef]
  43. Montañez, J.; Venegas, J.; Vivar, M.; Ramos, E. Los Fructanos Contenidos en la Cabeza y en las Hojas del Agave Tequilana Weber AZUL. Bioagro 2011, 23, 199–206. [Google Scholar]
  44. Datta, D.; Bhattacharjee, S.; Nath, A.; Das, R.; Bhattacharjee, C.; Datta, S. Separation of Ovalbumin from Chicken Egg White Using Two-Stage Ultrafiltration Technique. Sep. Purif. Technol. 2009, 66, 353–361. [Google Scholar] [CrossRef]
  45. Foley, G. Minimisation of Process Time in Ultrafiltration and Continuous Diafiltration: The Effect of Incomplete Macrosolute Rejection. J. Memb. Sci. 1999, 163, 349–355. [Google Scholar] [CrossRef]
  46. Foley, G. Water Usage in Variable Volume Diafiltration: Comparison with Ultrafiltration and Constant Volume Diafiltration. Desalination 2006, 196, 160–163. [Google Scholar] [CrossRef]
  47. Vizzi, M. Membrane separations in biorefinery. Development of a General Predictive Model. Master’s Thesis, Ing. Scuola di Ingegneria Industriale e dell’ informazione. Politecnico Di Milano, Milano, Italy, 2016. Available online: https://www.politesi.polimi.it/handle/10589/131635 (accessed on 28 April 2022).
  48. Goulas, A.K.; Kapasakalidis, P.G.; Sinclair, H.R.; Rastall, R.A.; Grandison, A.S. Purification of Oligosaccharides by Nanofiltration. J. Memb. Sci. 2002, 209, 321–335. [Google Scholar] [CrossRef]
  49. Tsuru, T.; Izumi, S.; Yoshioka, T.; Asaeda, M. Temperature Effect on Transport Performance by Inorganic Nanofiltration Membranes. AIChE J. 2000, 46, 565–574. [Google Scholar] [CrossRef]
  50. Ponce, J.A.; Macías, E.R.; Soltero, J.A.; Fernández, V.V.; Zúñiga, V.; Escalona, H.B. Physical-Chemical and Non-Linear Rheological Properties of Aqueous Solutions of Agave Fructans. e-Gnosis 2008, 6, 1–23. [Google Scholar]
  51. Moreno-Vilet, L.; Bonnin-Paris, J.; Bostyn, S.; Ruiz-Cabrera, M.A.; Moscosa-Santillán, M. Assessment of Sugars Separation from a Model Carbohydrates Solution by Nanofiltration Using a Design of Experiments (DoE) Methodology. Sep. Purif. Technol. 2014, 131, 84–93. [Google Scholar] [CrossRef]
  52. Ben Amar, N.; Saidani, H.; Palmeri, J.; Deratani, A. Effect of Temperature on the Rejection of Neutral and Charged Solutes by Desal 5 DK Nanofiltration Membrane. Desalination 2009, 246, 294–303. [Google Scholar] [CrossRef]
  53. Dang, H.Q.; Price, W.E.; Nghiem, L.D. The Effects of Feed Solution Temperature on Pore Size and Trace Organic Contaminant Rejection by the Nanofiltration Membrane NF270. Sep. Purif. Technol. 2014, 125, 43–51. [Google Scholar] [CrossRef] [Green Version]
  54. Rodríguez-González, F.; Parra-Montes de Oca, M.A.; Ávila-Reyes, S.V.; Camacho-Díaz, B.H.; Alamilla-Beltrán, L.; Jiménez-Aparicio, A.R.; Arenas-Ocampo, M.L. A Rheological Study of Chicory and Agave Tequilana Fructans for Use in Foods. LWT 2019, 115, 108137. [Google Scholar] [CrossRef]
  55. Bacchin, P.; Aimar, P.; Field, R.W. Critical and Sustainable Fluxes: Theory, Experiments and Applications. J. Memb. Sci. 2006, 281, 42–69. [Google Scholar] [CrossRef] [Green Version]
  56. Fernando, J.; Mario, C.; Heurística, E.; Usabilidad, D.E.L.A.; Para, D.E.S.; El, F.; Motriz, S.D.E.D.; Sánchez-Álvarez, J.F.; Zapata-Jaramillo, C.M.; Jiménez-Builes, J.A. Elección de la función de deseabilidad para diseños óptimos bajo restricciones. Rev. EIA 2017, 15, 171–187. [Google Scholar]
  57. Rizki, Z.; Janssen, A.E.M.; Boom, R.M.; van der Padt, A. Oligosaccharides Fractionation Cascades with 3 Outlet Streams. Sep. Purif. Technol. 2019, 221, 183–194. [Google Scholar] [CrossRef]
  58. Franck, A. Technological Functionality of Inulin and Oligofructose. Br. J. Nutr. 2002, 87, S287–S291. [Google Scholar] [CrossRef] [PubMed] [Green Version]
  59. Goldsmith, R.L. Macromolecular Ultrafiltration with Microporous Membranes. Ind. Eng. Chem. Fundam. 1971, 10, 113–120. [Google Scholar] [CrossRef]
Figure 1. Schematic diagram of the ultrafiltration pilot unit used. P1: centrifugal pump; P2: positive displacement pump; FI: Flow Rate Indicator; PI: Pressure Indicator; TI: Temperature Indicator.
Membranes 12 00575 g001
Figure 2. Response surface plot for SF as a function of (A) TMP, temperature and 100 kg∙m−3; (B) concentration, temperature and 3 bar of TMP; (C) concentration, TMP and 45 °C.
Membranes 12 00575 g002
Figure 3. (A) Composition of different commercial batches of agave fructans. (B) Experimental rejection coefficient for different FOS:Fc ratios: 0.23, 0.35 and 0.39. (C) Permeate flux vs. logarithm of agave fructan concentration.
Membranes 12 00575 g003
Figure 4. Fc and FOS concentration profile in the retentate and permeate during the UF process with an initial ratio (A) FOS:Fc = 0.23 (17.10%FOS:71.60% Fc), (B) FOS:Fc = 0.35 (23.68%FOS:67.33% Fc) and (C) FOS:Fc = 0.39 (24.9%FOS:63.67% Fc).
Membranes 12 00575 g004
Table 1. Experimental range and levels of the independent variables for Box-Behnken experimental design.
FactorsCodeVariation Levels
−101
Temperature (°C)X1304560
TMP (bar)X2135
Feed concentration (kg∙m−3)X350100150
Table 2. Box-Behnken experimental design matrix (coded values in parentheses) and results.
RunTemperature
(°C)
TMP
(bar)
Feed Concentration
(kg∙m−3)
SFJi
(kg∙h−1∙m−2)
X1X2X3Y1Y2
145 (0)3 (0)100 (0)2.801.350
230 (−1)1 (−1)100 (0)1.750.270
345 (0)3 (0)100 (0)2.741.660
460 (1)3 (0)50 (−1)2.301.010
530 (−1)3 (0)150 (1)1.801.130
660 (1)1 (−1)100 (0)1.910.630
760 (1)3 (0)150 (1)2.252.220
860 (1)5 (1)100 (0)2.302.600
930 (−1)5 (1)100 (0)1.971.350
1045 (0)5 (1)50 (−1)2.280.800
1145 (0)5 (1)150 (1)2.141.510
1245 (0)3 (0)100 (0)2.601.230
1345 (0)1 (−1)150 (1)1.900.790
1445 (0)1 (−1)50 (−1)2.220.380
1530 (−1)3 (0)50 (−1)2.340.560
1645 (0)3 (0)100 (0)2.701.110
Table 3. ANOVA analysis results of the Box-Behnken design for SF.
SourceSum of SquareDegree of FreedomMean SquareF-Valuep-Value
X10.101310.101316.820.0064 *
X20.103510.103517.190.0060 *
X30.137810.137822.890.0030 *
X1X20.007210.00721.200.3153
X1X30.060010.06009.970.0196 *
X2X30.008110.00811.350.2902
X120.476110.476179.080.0001 *
X220.585210.585297.200.0001 *
X320.148210.148224.620.0025 *
Residual0.036160.0060
Lack of Fit0.014930.00500.70400.6100
Pure error0.021230.0071
Total1.6615
* Significant at p < 0.05, R2 = 97.82%, R2 adjusted = 94.57%.
Table 4. ANOVA analysis results of the Box-Behnken design for solute flux.
SourceSum of SquareDegree of FreedomMean SquareF-Valuep-Value
X11.24 11.24 9.960.0083 *
X22.19 12.19 17.620.0012 *
X31.05 11.05 8.440.0132 *
Residual1.49 120.1245
Lack of Fit1.33 90.1474 2.64
Pure error0.1675 30.0558
Total5.98 15
* Significant at p < 0.05% level; R2 = 75.01%, R2 adjusted = 68.76%.
Table 5. Optimization results for agave fructans fractionation using a tight UF process for multiple responses and only one.
FactorsResponses
SF and JiSF
Optimized coded level of variablesX1: temperatura (°C)
X2: TMP (bar)
X3: Concentration (kg∙m−3)
53.55
4.12
120.16
46.81
3.27
85.70
Predicted responsesSeparation factor
The flux of solute (kg fructans∙h−1∙m−2)
2.57
1.82
2.74
Overall desirability 0.720.94
Table 6. Results of validation experiments at different conditions.
ExperimentFeed Sample Operational ConditionsPredicted SFExperimental
SF
Difference
DPavFOS:Fc
115.40.3545 °C, 3 bar, 100 kg∙m−32.713.500.79
214.60.3930 °C, 5 bar, 50 kg∙m−32.055.783.73
316.80.3660 °C, 5 bar, 50 kg∙m−31.531.630.1
413.50.4454 °C, 4 bar, 120 kg∙m−32.563.250.69
Publisher’s Note: MDPI stays neutral with regard to jurisdictional claims in published maps and institutional affiliations.

