
Variables and Mechanisms Affecting Electro-Membrane Extraction of Bio-Succinic Acid from Fermentation Broth

 ,
,  , , and
Abstract
:1. Introduction
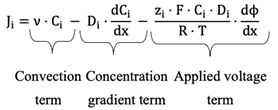
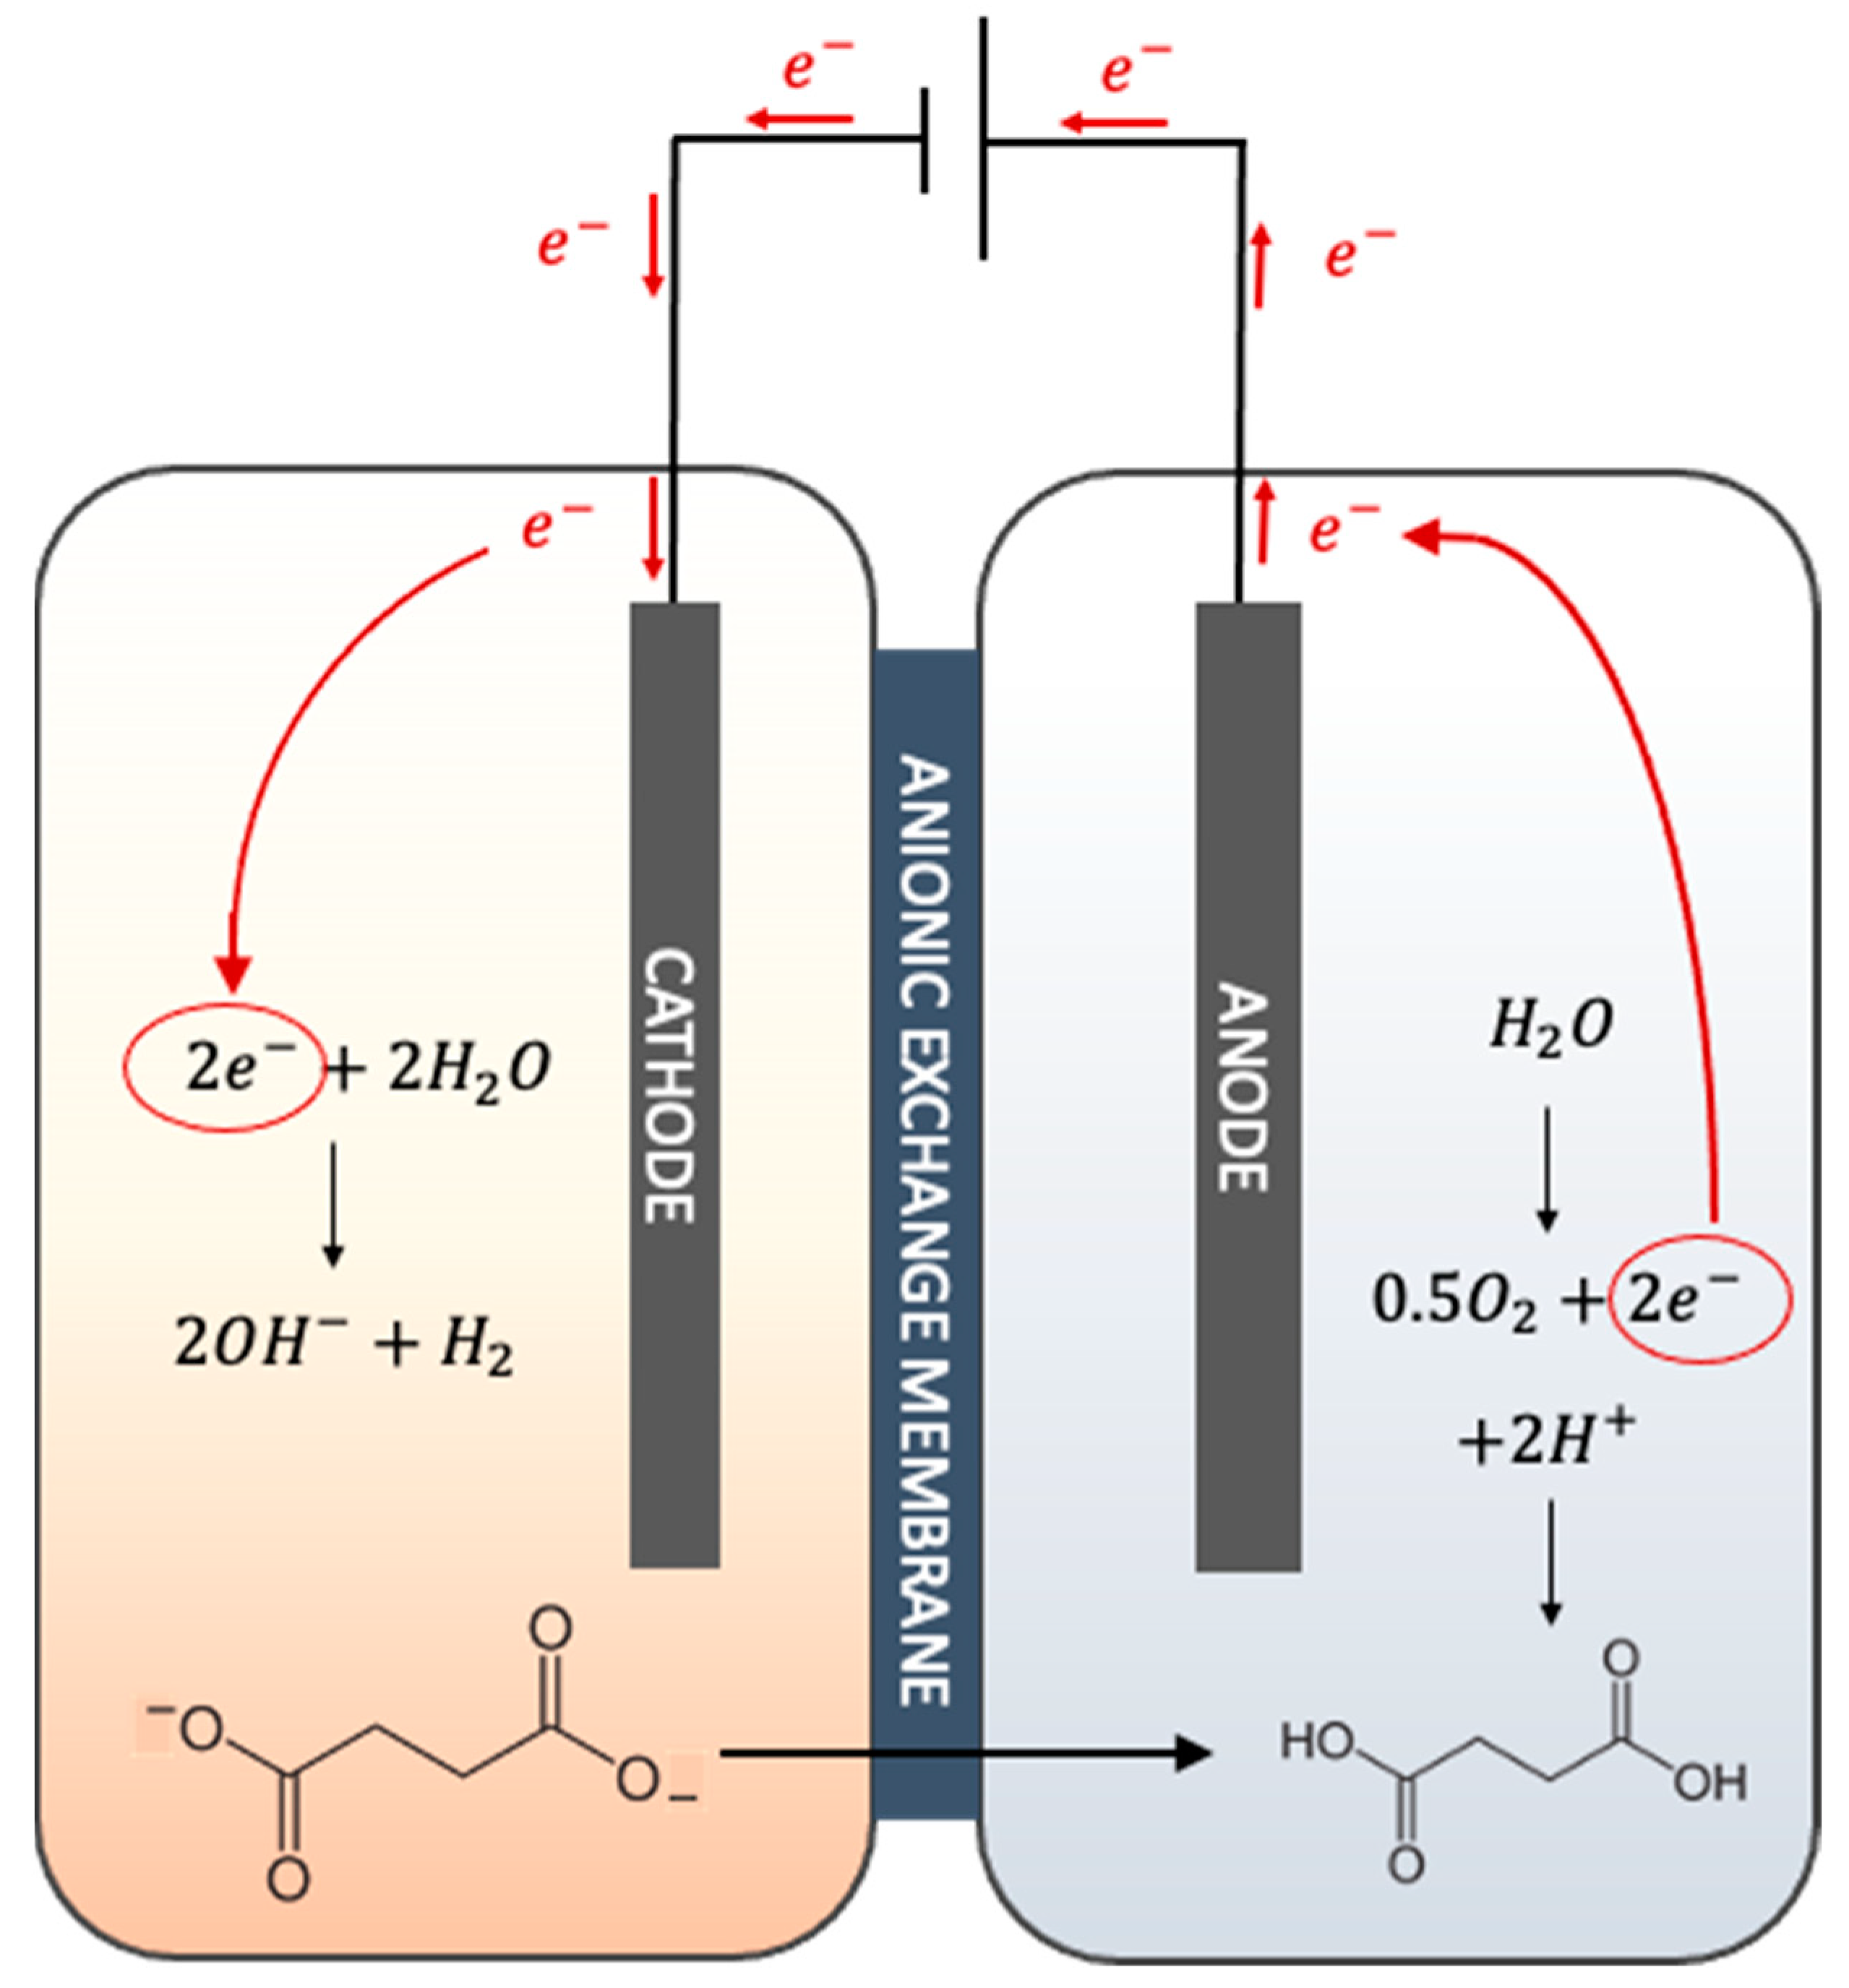
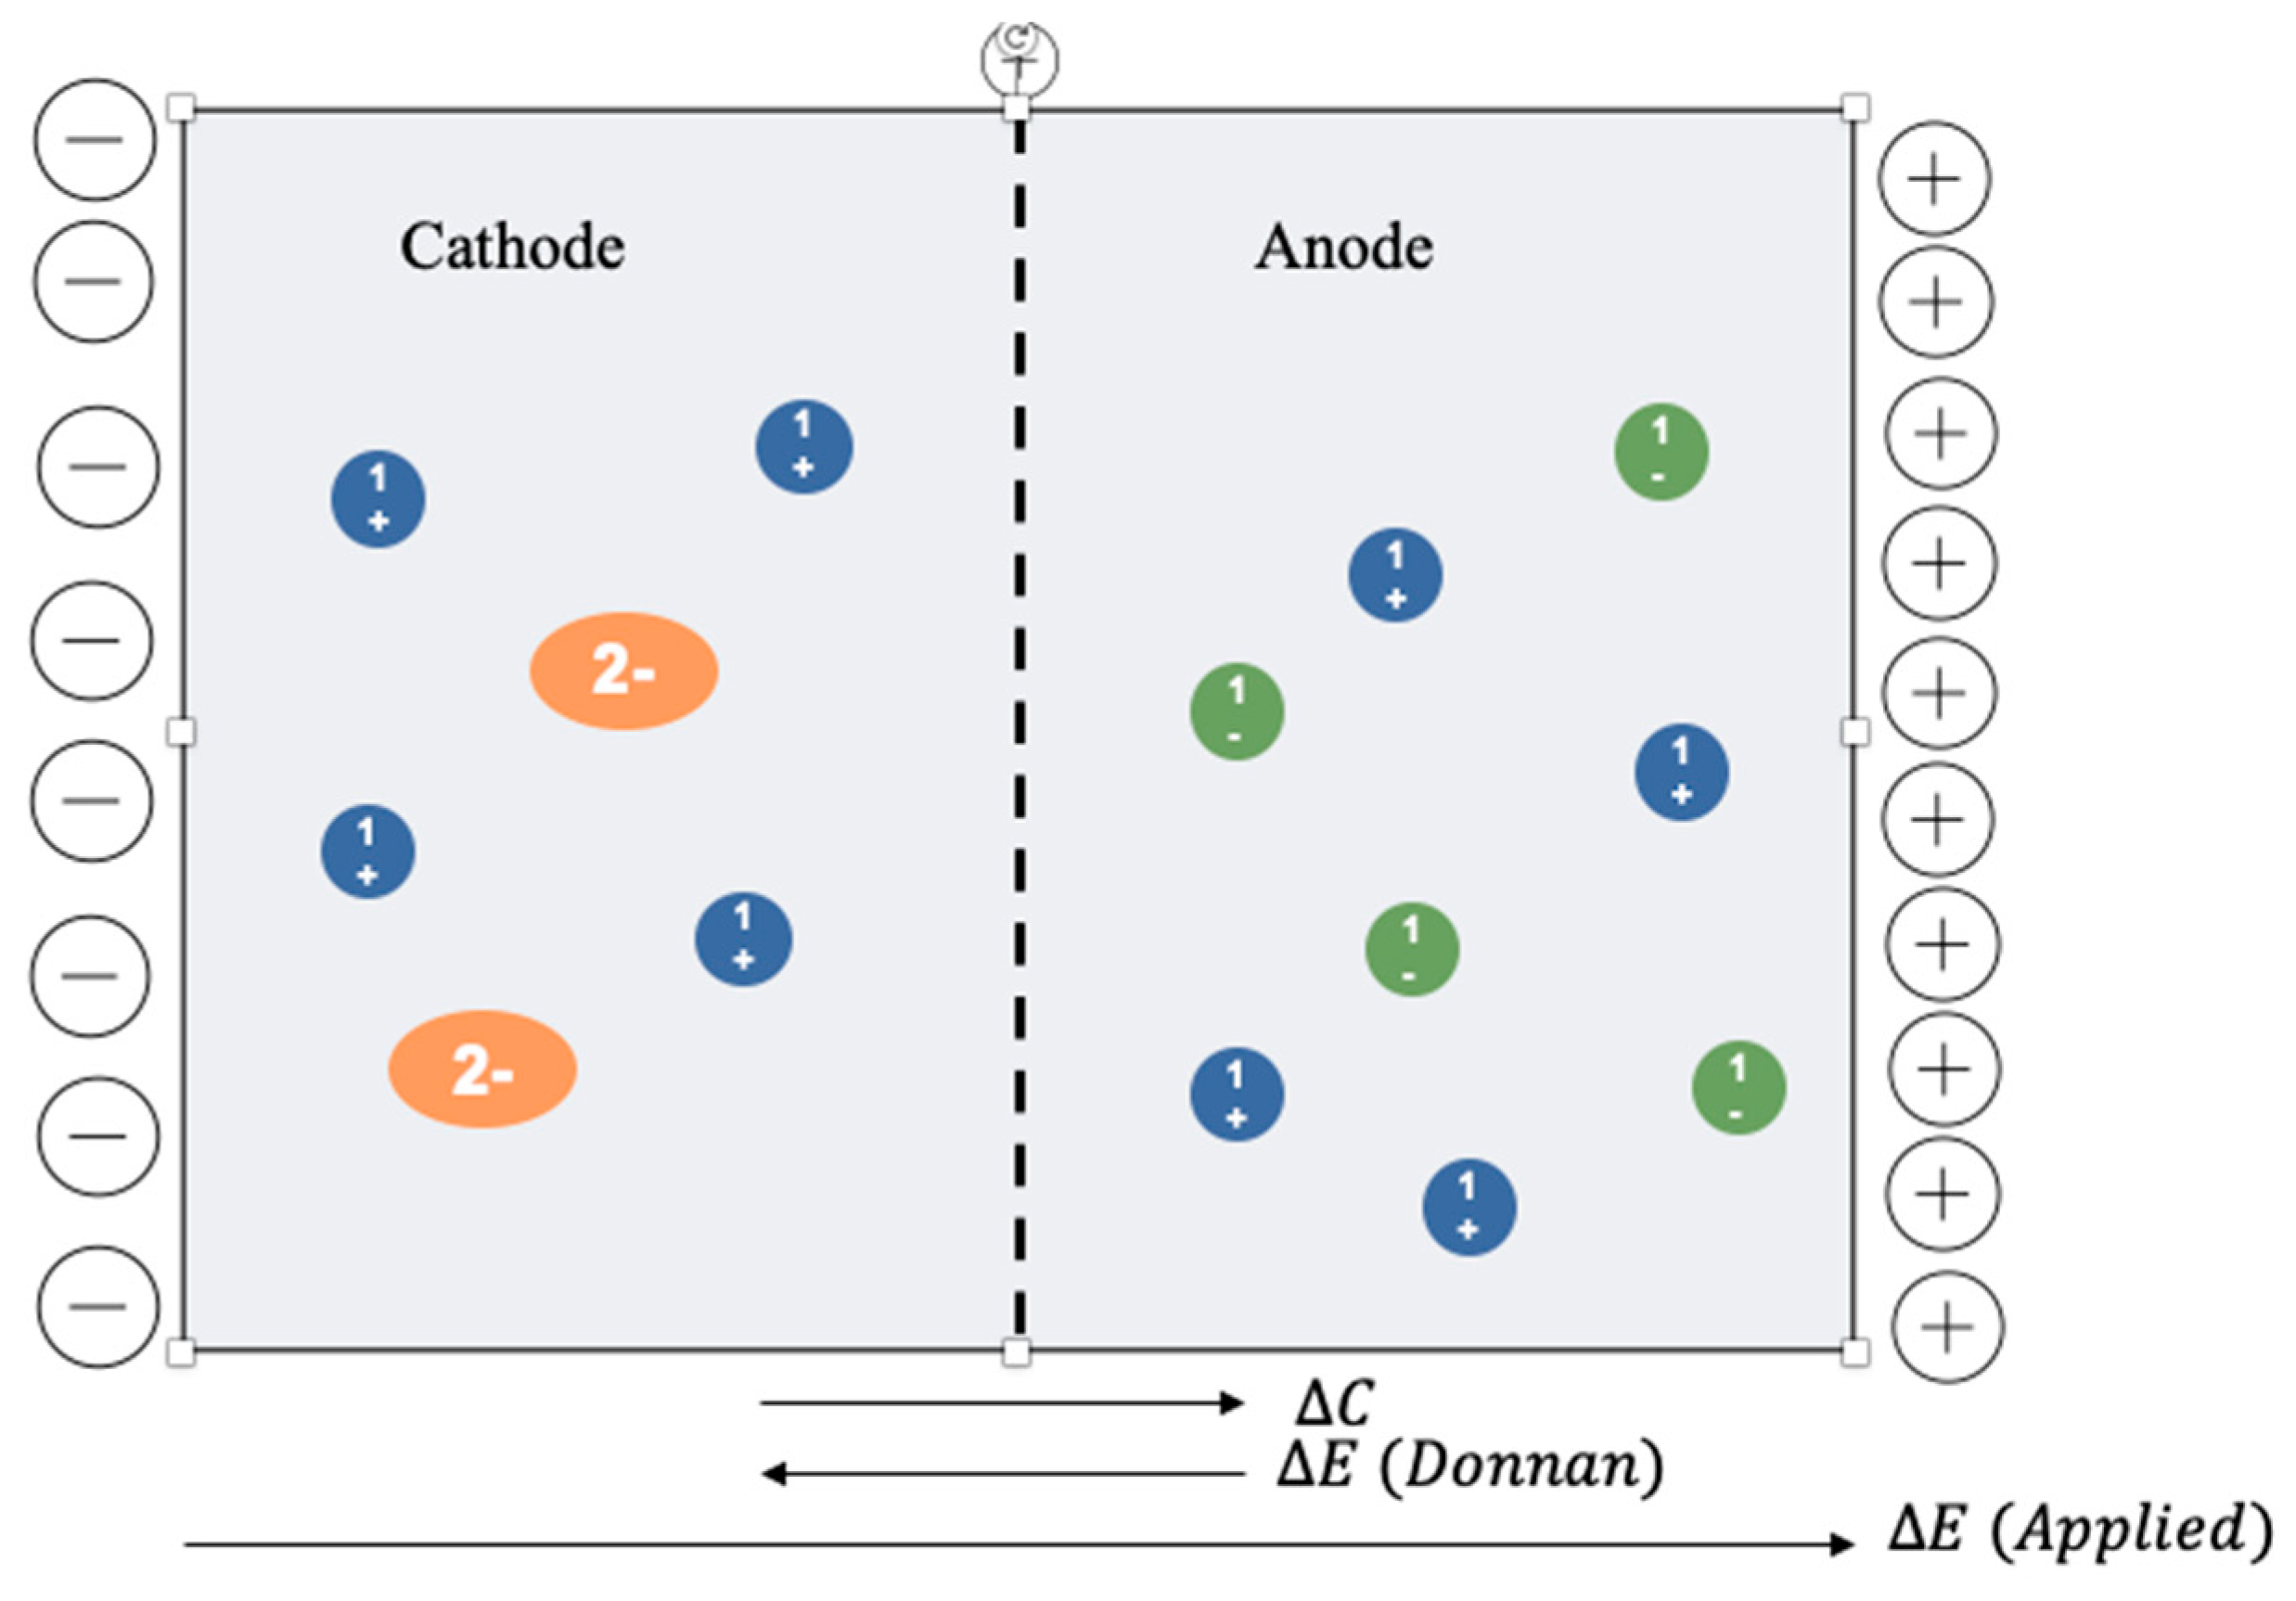
2. Theory
3. Materials
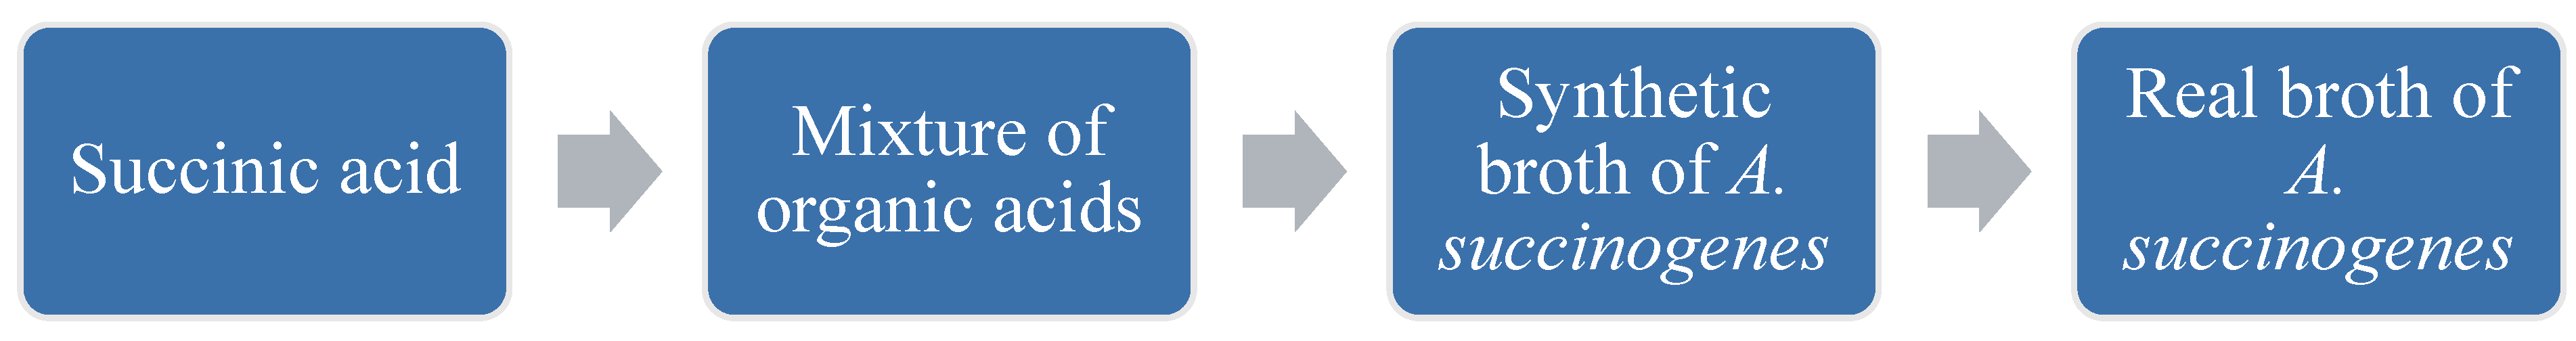
3.1. Experimental Organic Acid and Broth Solutions
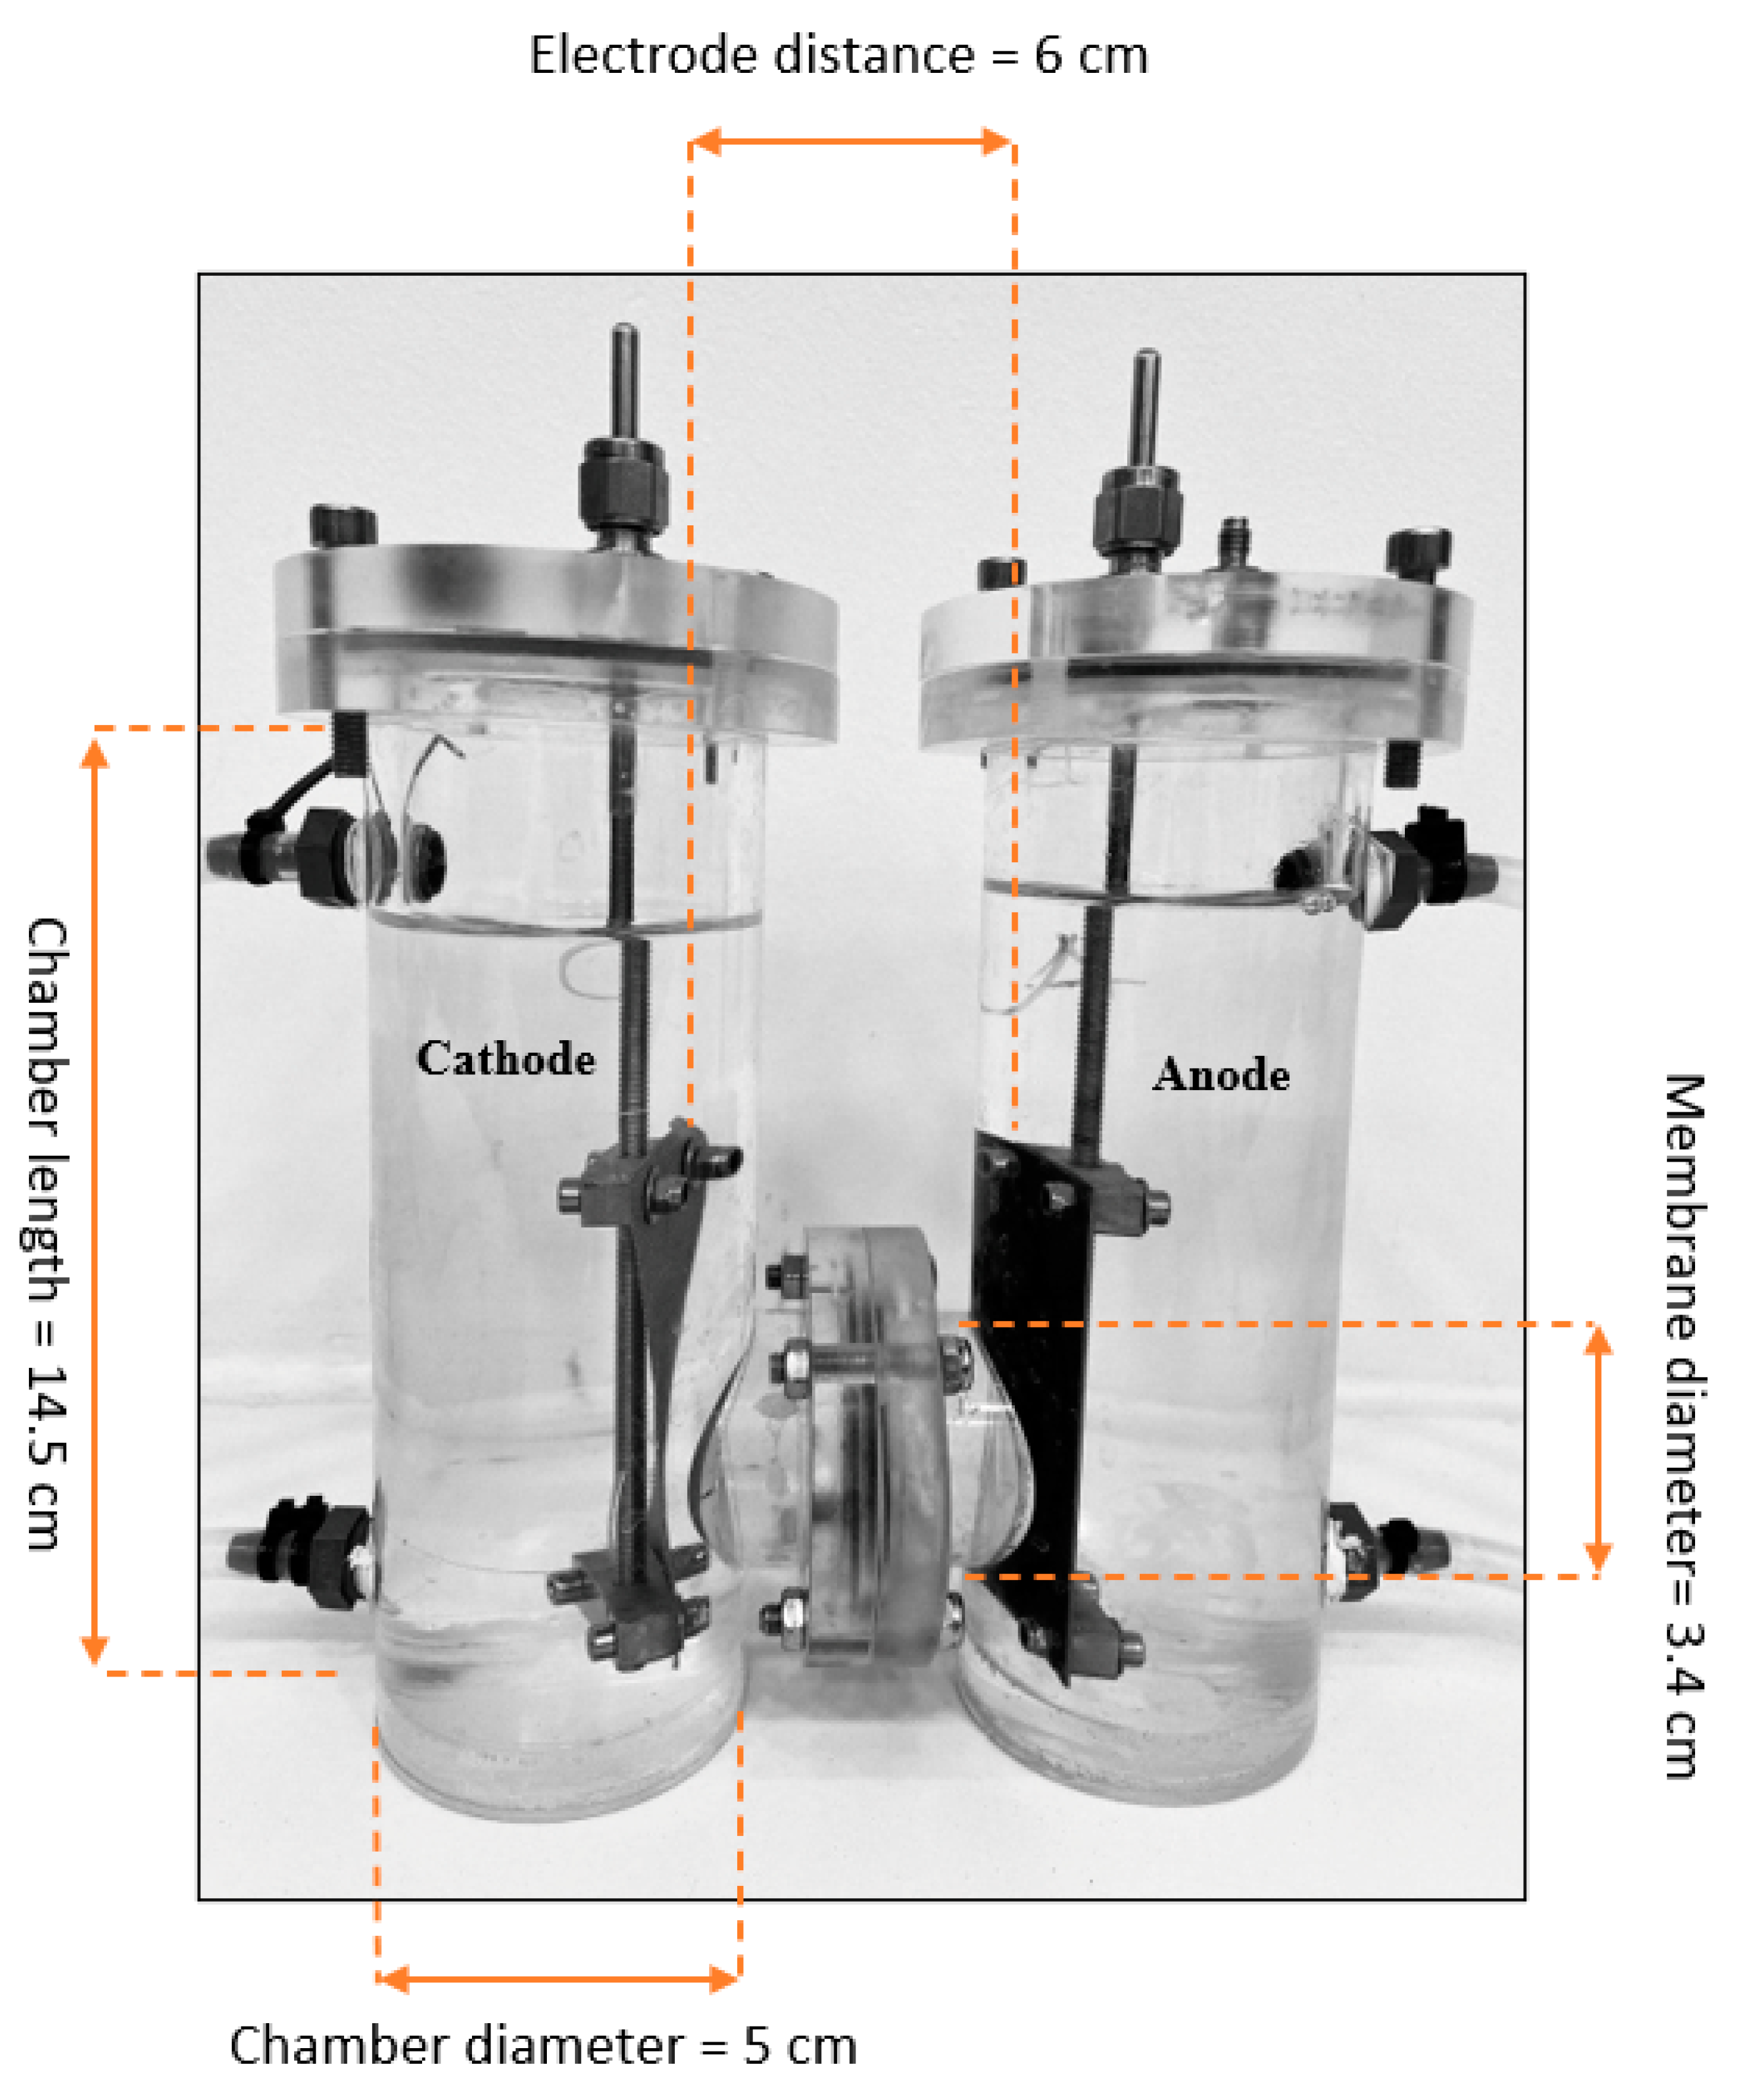
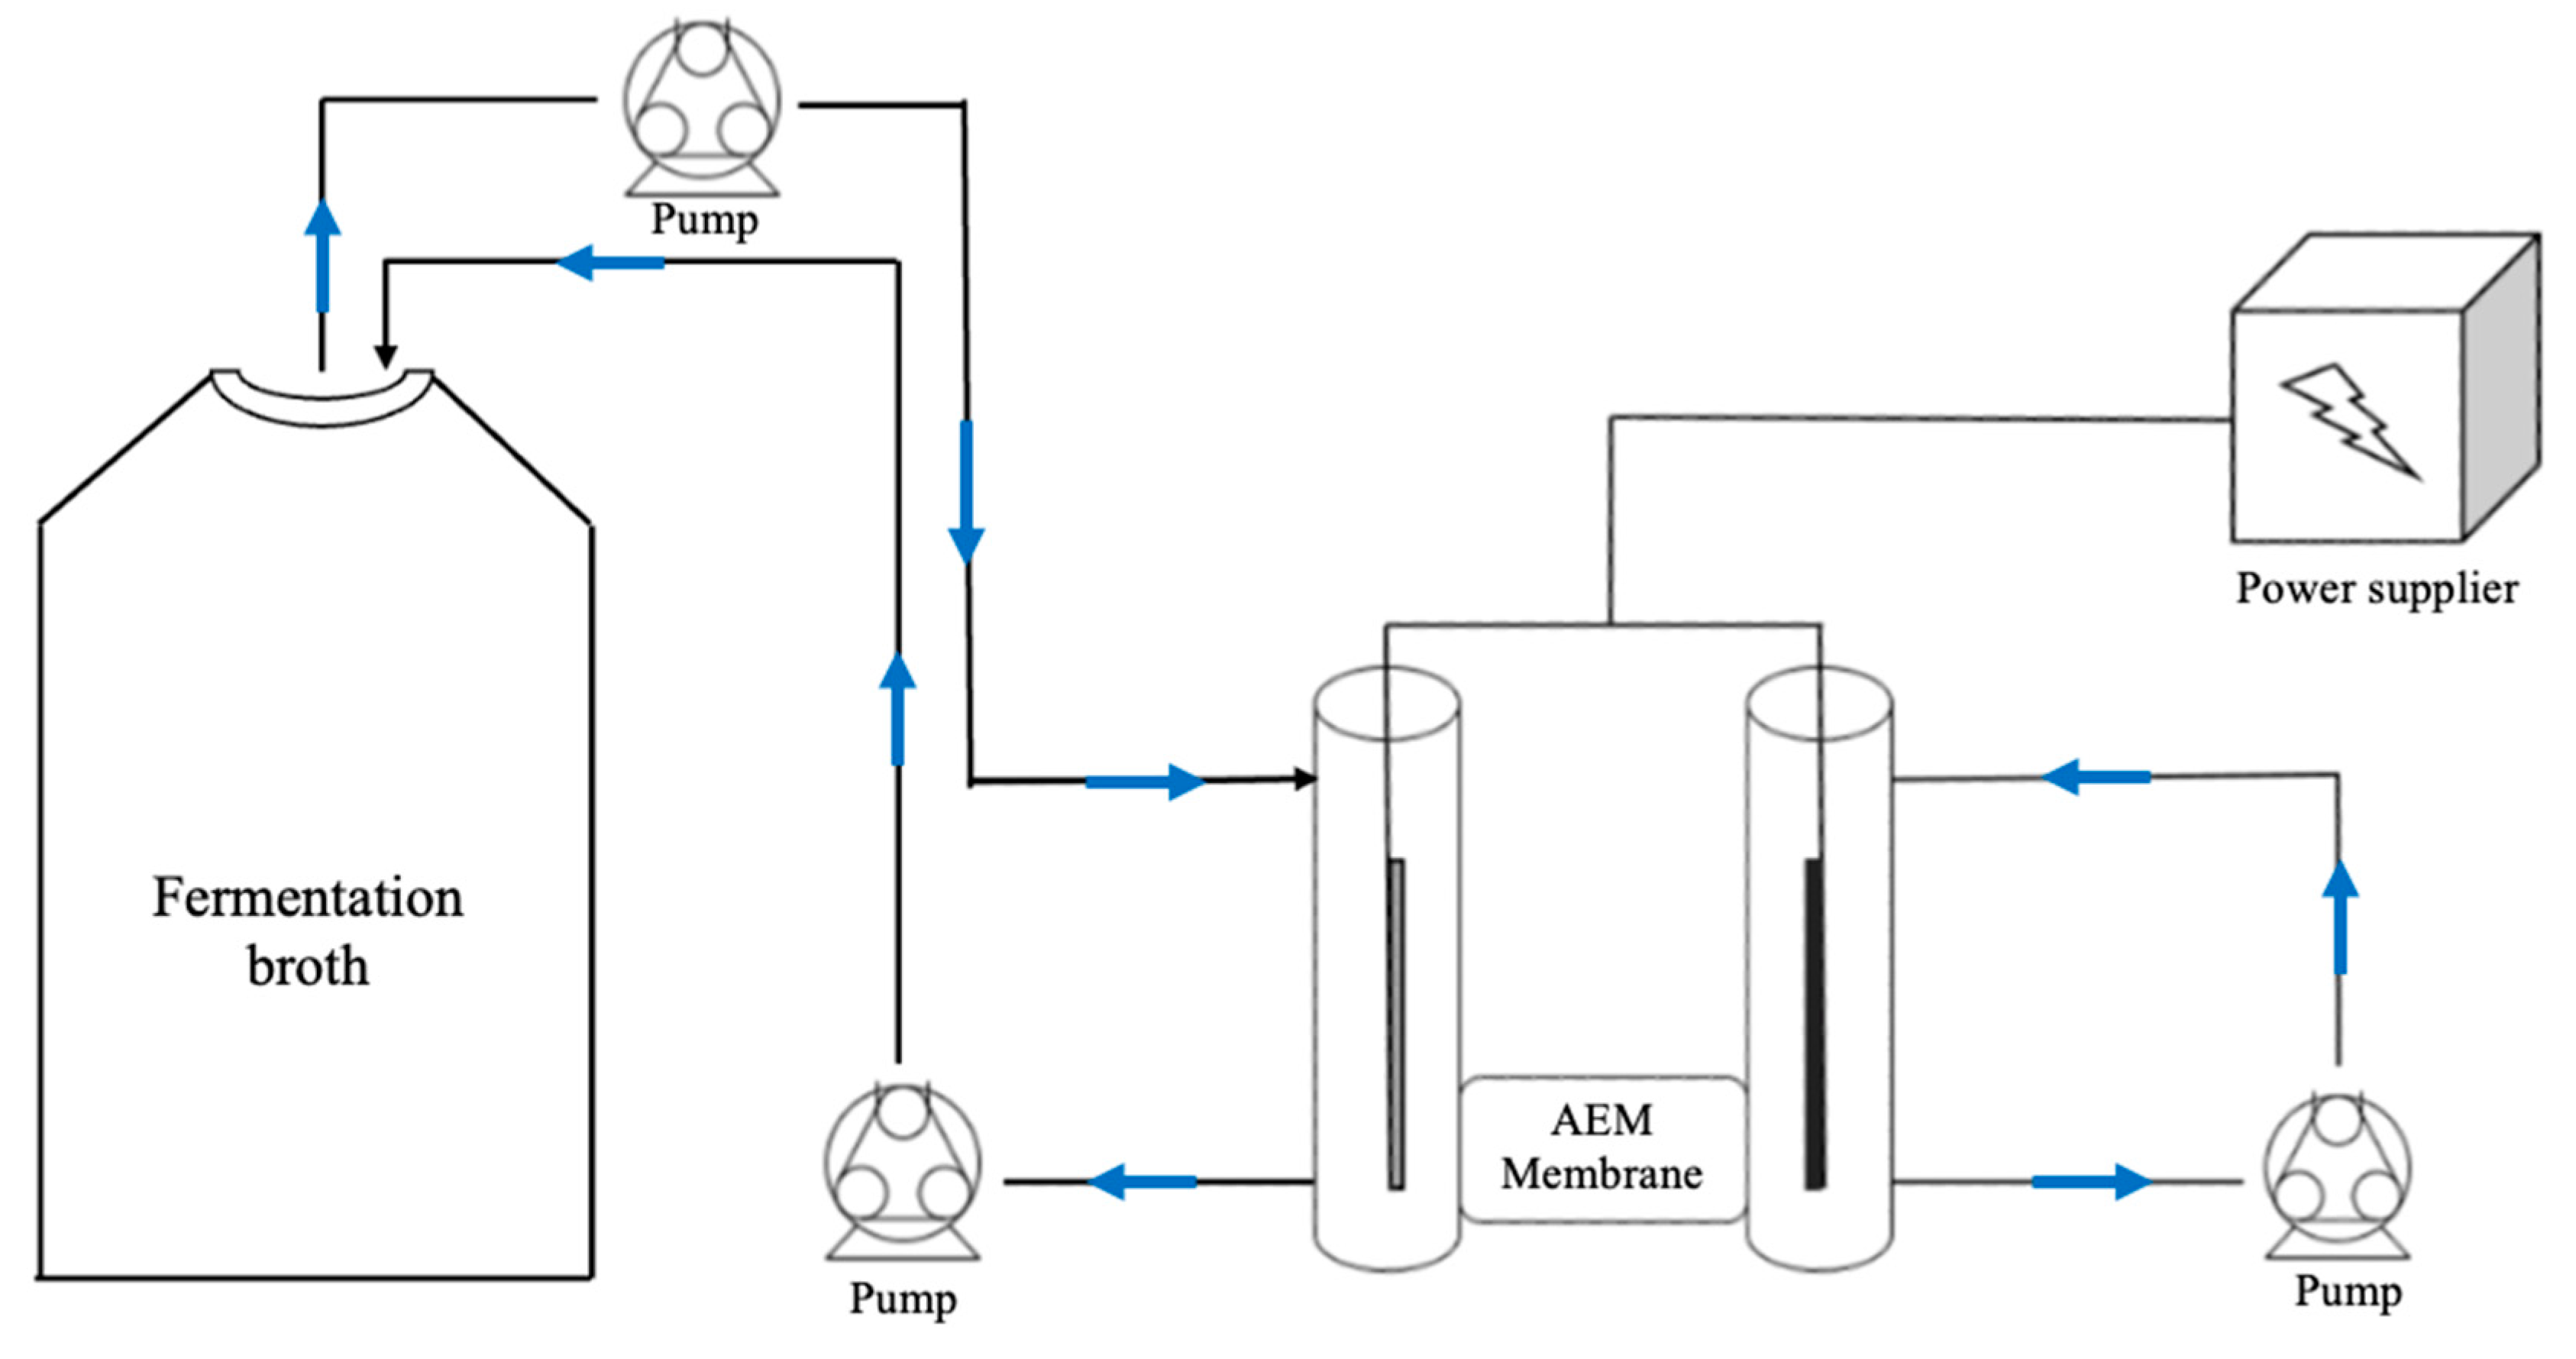
3.2. Electrolytic Cell and Experimental Setup
4. Methods
4.1. Succinic Acid Solutions
4.1.1. Effect of the Concentration in the Absence of Applied Voltage
4.1.2. Variation in the Distribution of Ions
4.1.3. Current Variation
4.1.4. Concentration Variation
4.2. Mixed Acids Solution
4.2.1. Organic Acids Variation
4.2.2. Variation of Membrane Area
4.3. Synthetic Broth of A. succinogenes
Ion and Composition Variation
4.4. Real Broth of A. succinogenes
5. Results and Discussion
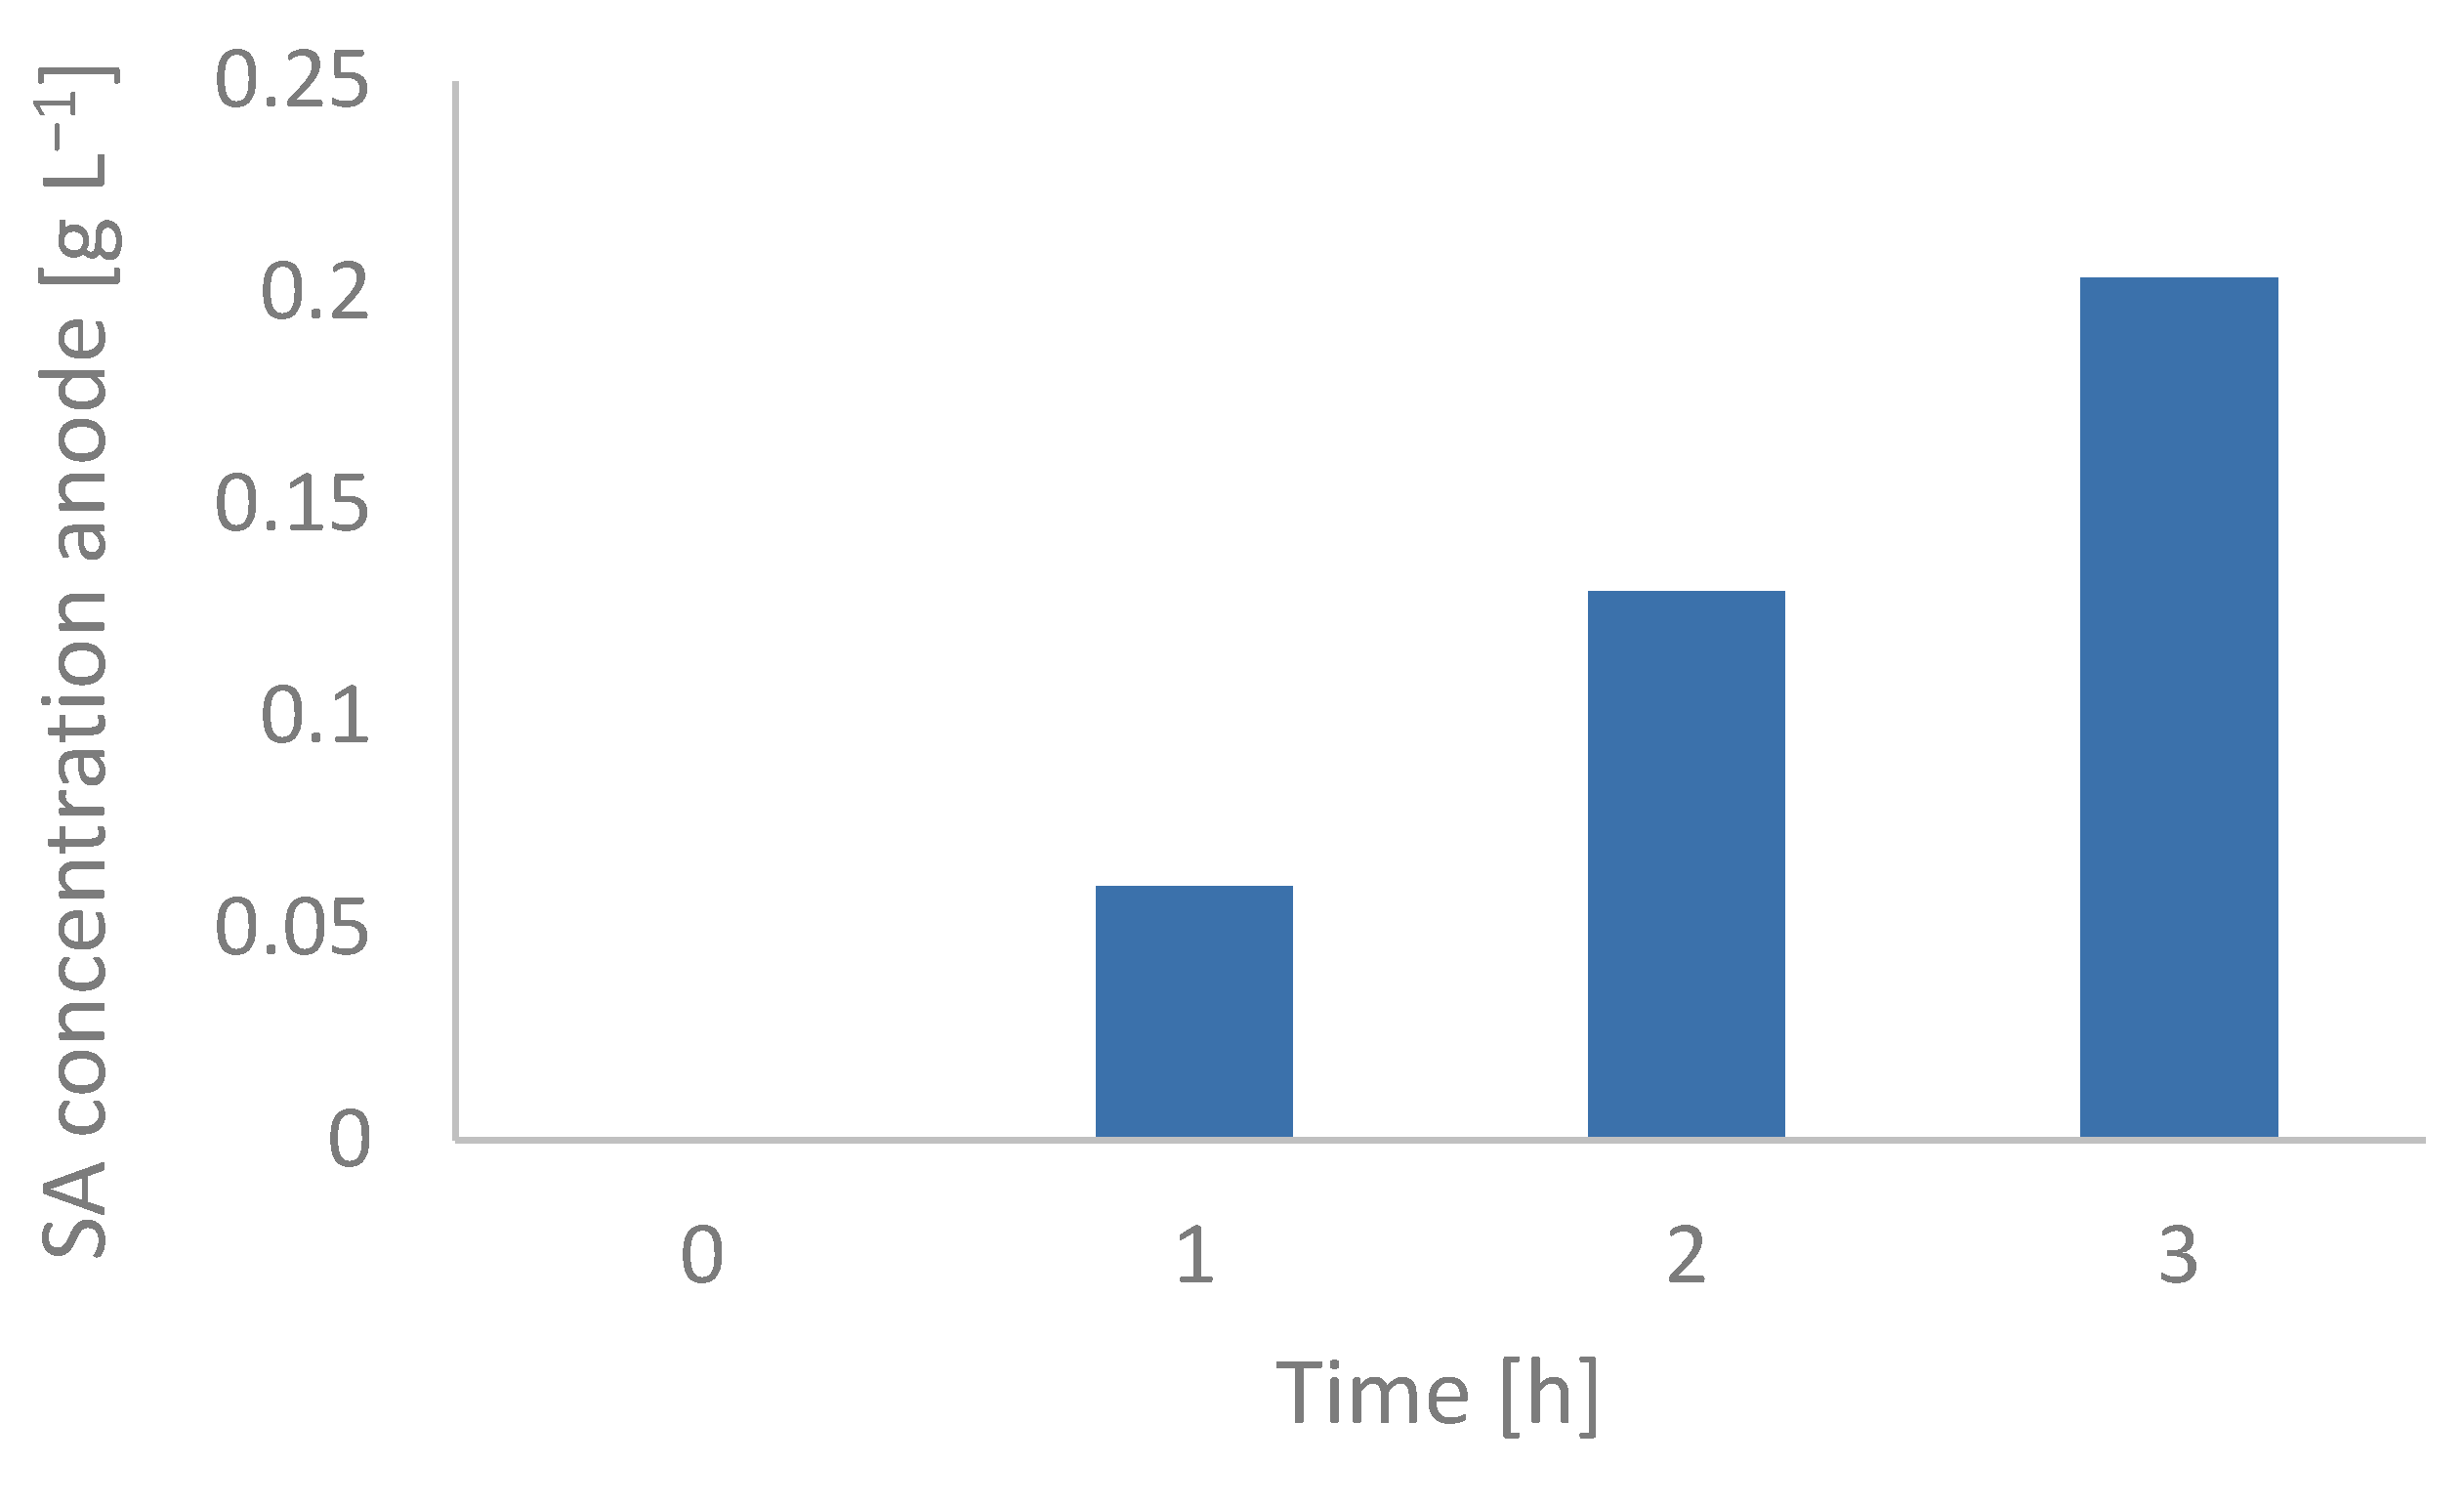
5.1. Effect of Concentration on Succinic Acid Extraction
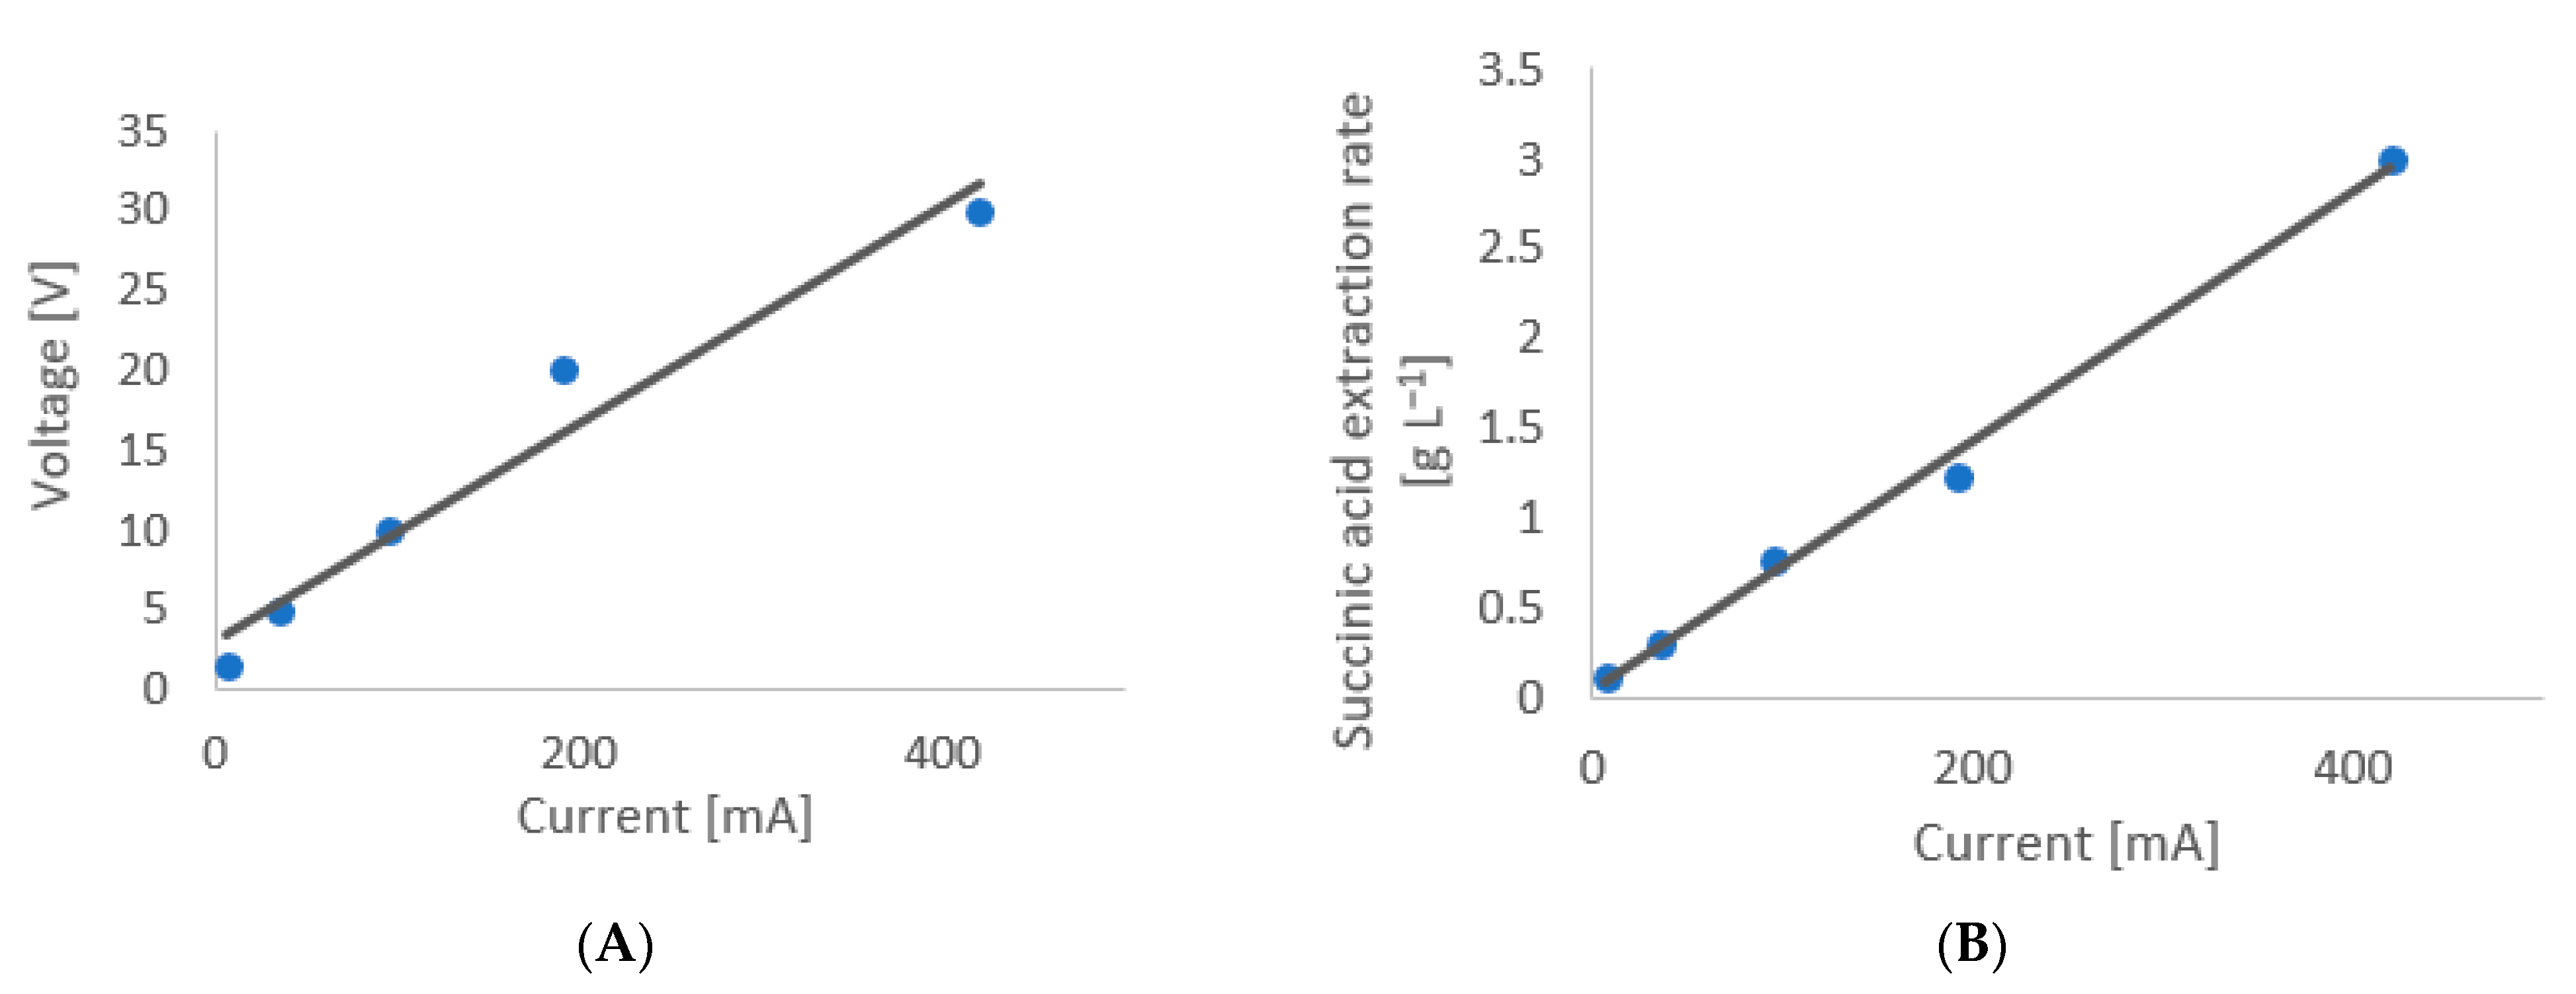
5.2. Extraction Rate of Succinic Acid as a Function of Current Variation
5.3. Mixed Organic Acid: Effect of Ion Valence on Acids Extraction Rate and the Pyruvic Acid Phenomenon

5.4. Comparison of the Extraction Rate and Energy Requirements of the Different Solutions
6. Conclusions
Author Contributions
Funding
Institutional Review Board Statement
Informed Consent Statement
Data Availability Statement
Acknowledgments
Conflicts of Interest
References
- Cherubini, F. The biorefinery concept: Using biomass instead of oil for producing energy and chemicals. Energy Convers. Manag. 2010, 51, 1412–1421. [Google Scholar] [CrossRef]
- Program, B.; Werpy, T.; Petersen, G. Top Value Added Chemicals from Biomass Volume I-Results of Screening for Potential Candidates from Sugars and Synthesis Gas Produced by the Staff at Pacific Northwest National Laboratory (PNNL) National Renewable Energy Laboratory (NREL) Office of Biomass Program (EERE) For the Office of the Energy Efficiency and Renewable Energy. Available online: https://www.nrel.gov/docs/fy04osti/35523.pdf (accessed on 6 April 2022).
- Hema, N.; Sreenath, K.P. Molecular Identification of Bacterial Strains Producing Succinic Acid from Indian Sources. J. Pure Appl. Microbiol. 2018, 12, 2313–2319. [Google Scholar] [CrossRef]
- Succinic Acid Market. Available online: https://www.marketsandmarkets.com/market-reports/succinic-acid-market-402.html (accessed on 6 April 2022).
- Mancini, E.; Mansouri, S.S.; Gernaey, K.V.; Luo, J.; Pinelo, M. From second generation feed-stocks to innovative fermentation and downstream techniques for succinic acid production. Crit. Rev. Environ. Sci. Technol. 2019, 50, 1829–1873. [Google Scholar] [CrossRef]
- Kuenz, A.; Hoffmann, L.; Goy, K.; Bromann, S.; Prüße, U. High-Level Production of Succinic Acid from Crude Glycerol by a Wild Type Organism. Catalysts 2020, 10, 470. [Google Scholar] [CrossRef]
- Patel, M.; Crank, M.; Dornburg, V.; Hermann, B.; Roes, L.; Huesing, B.; Overbeek, L.; Terragni, F.; Recchia, E. Medium and Long-Term Opportunities and Risks of the Biotechnological Production of Bulk Chemicals from Renewable Resources-The Potential of White Biotechnology The BREW Project Final Report. Available online: https://www.osti.gov/etdeweb/biblio/20963467 (accessed on 6 April 2022).
- Bechthold, I.; Bretz, K.; Kabasci, S.; Kopitzky, R.; Springer, A. Succinic Acid: A New Platform Chemical for Biobased Polymers from Renewable Resources. Chem. Eng. Technol. 2008, 31, 647–654. [Google Scholar] [CrossRef]
- Dickson, R.; Mancini, E.; Garg, N.; Woodley, J.M.; Gernaey, K.V.; Pinelo, M.; Liu, J.; Mansouri, S.S. Sustainable bio-succinic acid production: Superstructure optimization, techno-economic, and lifecycle assessment. Energy Environ. Sci. 2021, 14, 3542–3558. [Google Scholar] [CrossRef]
- Ullah, H.I.; Dickson, R.; Mancini, E.; Malanca, A.A.; Pinelo, M.; Mansouri, S.S. An integrated sustainable biorefinery concept towards achieving zero-waste production. J. Clean. Prod. 2022, 336, 130317. [Google Scholar] [CrossRef]
- Pateraki, C.; Andersen, S.J.; Ladakis, D.; Koutinas, A.; Rabaey, K. Direct electrochemical extraction increases microbial succinic acid production from spent sulphite liquor. Green Chem. 2019, 21, 2401–2411. [Google Scholar] [CrossRef]
- Cheng, K.-K.; Zhao, X.-B.; Zeng, J.; Zhang, J.-A. Biotechnological production of succinic acid: Current state and perspectives. Biofuels Bioprod. Biorefin. 2012, 6, 302–318. [Google Scholar] [CrossRef]
- Andersen, S.J.; Hennebel, T.; Gildemyn, S.; Coma, M.; Desloover, J.; Berton, J.; Tsukamoto, J.; Stevens, C.; Rabaey, K. Electrolytic Membrane Extraction Enables Production of Fine Chemicals from Biorefinery Sidestreams. Environ. Sci. Technol. 2014, 48, 7135–7142. [Google Scholar] [CrossRef]
- Andersen, S.J.; Candry, P.; Basadre, T.; Khor, W.C.; Roume, H.; Hernandez-Sanabria, E.; Coma, M.; Rabaey, K. Electrolytic extraction drives volatile fatty acid chain elongation through lactic acid and replaces chemical pH control in thin stillage fermentation. Biotechnol. Biofuels 2015, 8, 1–14. [Google Scholar] [CrossRef] [PubMed] [Green Version]
- Aliyev, A.S.; Guseynova, R.G.; Gurbanova, U.M.; Babanly, D.M.; Fateev, V.N.; Pushkareva, I.V.; Tagiyev, D.B. Electrocatalysts for water electrolysis. Chem. Probl. 2018, 16, 283–306. [Google Scholar] [CrossRef]
- Wang, Z.; Yuan, Z.; Liu, F. Extended Nernst–Planck Equation Incorporating Partial Dehydration Effect. Chin. Phys. Lett. 2020, 37, 094701. [Google Scholar] [CrossRef]
- Dobrynin, A.V. Solutions of Charged Polymers. In Polymer Science: A Comprehensive Reference, 10 Volume Set; Elsevier: Amsterdam, The Netherlands, 2012; Volume 1, pp. 81–132. ISBN 9780080878621. [Google Scholar]
- Su, L.; Liao, X.; Huang, Z. A theoretical study on resistance of electrolytic solution: Measurement of electrolytic conductivity. Results Phys. 2019, 13, 102274. [Google Scholar] [CrossRef]
- Petrowsky, M.; Frech, R. Temperature Dependence of Ion Transport: The Compensated Arrhenius Equation. J. Phys. Chem. B 2009, 113, 5996–6000. [Google Scholar] [CrossRef] [PubMed]
- Lin, S.K.C.; Du, C.; Blaga, A.C.; Camarut, M.; Webb, C.; Stevens, C.V.; Soetaert, W. Novel resin-based vacuum distillation-crystallisation method for recovery of succinic acid crystals from fermentation broths. Green Chem. 2010, 12, 666–671. [Google Scholar] [CrossRef]
- Ferone, M.; Raganati, F.; Ercole, A.; Olivieri, G.; Salatino, P.; Marzocchella, A. Continuous succinic acid fermentation by Actinobacillus succinogenes in a packed-bed biofilm reactor. Biotechnol. Biofuels 2018, 11, 1–11. [Google Scholar] [CrossRef] [Green Version]
- Thygesen, A.; Poulsen, F.W.; Min, B.; Angelidaki, I.; Thomsen, A.B. The effect of different substrates and humic acid on power generation in microbial fuel cell operation. Bioresour. Technol. 2009, 100, 1186–1191. [Google Scholar] [CrossRef]
- Moshtarikhah, S.; Oppers, N.A.W.; De Groot, M.T.; Keurentjes, J.T.F.; Schouten, J.C.; Van Der Schaaf, J. Nernst–Planck modeling of multicomponent ion transport in a Nafion membrane at high current density. J. Appl. Electrochem. 2016, 47, 51–62. [Google Scholar] [CrossRef] [Green Version]
- Jones, G.; Jenkins, S.J. Insight into the Reduction of Pyruvic Acid to Lactic Acid over Cu{110}: The Crucial Role of Intramolecular Tunneling in Direct Hydrogenation. J. Am. Chem. Soc. 2008, 130, 14483–14492. [Google Scholar] [CrossRef]
- Zhang, Z.; Jackson, J.; Miller, D.J. Aqueous-phase hydrogenation of lactic acid to propylene glycol. Appl. Catal. A Gen. 2001, 219, 89–98. [Google Scholar] [CrossRef]


| Succinic Acid Solution | Mixed Acids Solution | Synthetic Broth of A. succinogenes | Real Broth of A. succinogenes |
|---|---|---|---|
| Succinic acid | Succinic acid | Succinic acid | Real fermentation broth |
| Formic acid | Formic acid | ||
| Acetic acid | Acetic acid | ||
| Pyruvic acid | Pyruvic acid | ||
| NaCl | |||
| K2HPO4 | |||
| NaH2PO4 | |||
| MgCl2 × 6H2O | |||
| CaCl2 × 2H2O |
| Succinic Acid | Mixed Acids | Synthetic Broth of A. succinogenes | Real Broth of A. succinogenes |
|---|---|---|---|
| Osmosis study | Organic acids variation | Ion and composition variation | Batch versus continuous operation mode |
| Current variation | Membrane area variation | ||
| Ion’s distribution variation | |||
| Ion’s concentration variation |
| Chamber | Succinic Acid | Pyruvic Acid | Acetic Acid | Formic Acid |
|---|---|---|---|---|
| Cathode | 5 g L−1 | 1 g L−1 | 1 g L−1 | 0.5 g L−1 |
| Anode | 0.5 g L−1 | 0.1 g L−1 | 0.1 g L−1 | 0.05 g L−1 |
| Component | Cathode (g L−1) | Anode (g L−1) |
|---|---|---|
| Succinic acid | 5 | 2.5 |
| Formic acid | 1 | 0.5 |
| Acetic acid | 1 | 0.5 |
| Pyruvic acid | 0.5 | 0.25 |
| NaCl | 0.3 | 0.15 |
| K2HPO4 | 5 | 2.5 |
| NaH2PO4 | 2.62 | 1.31 |
| MgCl2 × 6H2O | 0.067 | 0.034 |
| CaCl2 × 2H2O | 0.077 | 0.039 |
| Glycerol | 10 | 5 |
| Solution | Current (mA) | Cathode SA (g L−1) | Anode SA (g L−1) | Extraction Rate (g L−1 h−1) | % Extraction Rate of Ions of SA/Total Initial Ions | Voltage (V) |
|---|---|---|---|---|---|---|
| Succinic acid | 36 | 5 | 2.5 | 0.25 ± 0.01 | 13.56% | 8.54 ± 0.19 |
| Mixed acids | 36 | 5 | 2.5 | 0.23 | 7.3% | 6.42 ± 0.21 |
| Synthetic broth | 36 | 5 | 2.5 | 0.15 | 2.62% | 4.93 ± 0.11 |
| Real broth (batch) | 36 | 5 | 2.5 | 0.20 ± 0.01 | 6.52 ± 0.04 | |
| Real broth (continuous) | 36 | 5 | 2.5 | 0.19 | 6.11 ± 0.01 |
Publisher’s Note: MDPI stays neutral with regard to jurisdictional claims in published maps and institutional affiliations. |
© 2022 by the authors. Licensee MDPI, Basel, Switzerland. This article is an open access article distributed under the terms and conditions of the Creative Commons Attribution (CC BY) license (https://creativecommons.org/licenses/by/4.0/).
Share and Cite
Malanca, A.A.; Mancini, E.; Yusuf, M.; Khensir, G.K.; Mansouri, S.S.; Skiadas, I.V.; Gavala, H.N.; Pinelo, M. Variables and Mechanisms Affecting Electro-Membrane Extraction of Bio-Succinic Acid from Fermentation Broth. Membranes 2022, 12, 542. https://doi.org/10.3390/membranes12050542
Malanca AA, Mancini E, Yusuf M, Khensir GK, Mansouri SS, Skiadas IV, Gavala HN, Pinelo M. Variables and Mechanisms Affecting Electro-Membrane Extraction of Bio-Succinic Acid from Fermentation Broth. Membranes. 2022; 12(5):542. https://doi.org/10.3390/membranes12050542
Chicago/Turabian StyleMalanca, Alina Anamaria, Enrico Mancini, Mohamed Yusuf, Gabriel Kjær Khensir, Seyed Soheil Mansouri, Ioannis V. Skiadas, Hariklia N. Gavala, and Manuel Pinelo. 2022. "Variables and Mechanisms Affecting Electro-Membrane Extraction of Bio-Succinic Acid from Fermentation Broth" Membranes 12, no. 5: 542. https://doi.org/10.3390/membranes12050542
APA StyleMalanca, A. A., Mancini, E., Yusuf, M., Khensir, G. K., Mansouri, S. S., Skiadas, I. V., Gavala, H. N., & Pinelo, M. (2022). Variables and Mechanisms Affecting Electro-Membrane Extraction of Bio-Succinic Acid from Fermentation Broth. Membranes, 12(5), 542. https://doi.org/10.3390/membranes12050542