
A Novel Ocean Thermal Energy Driven System for Sustainable Power and Fresh Water Supply

Abstract
:1. Introduction
- 1.
- In this paper, we proposed a novel ocean thermal energy driven system for sustainable power and fresh water supply. The integrated system consisting of organic Rankine cycle and DCMD desalination will be introduced in Section 2.
- 2.
- A detailed mathematical model of the proposed cycle is to be established from the perspectives of thermodynamics and transmembrane transmit in Section 3.
- 3.
- Thermodynamic analyses on the proposed system will be carried out and the output performance of the system will be discussed in Section 4.
- 4.
- The conclusions of this work will be given in Section 5.
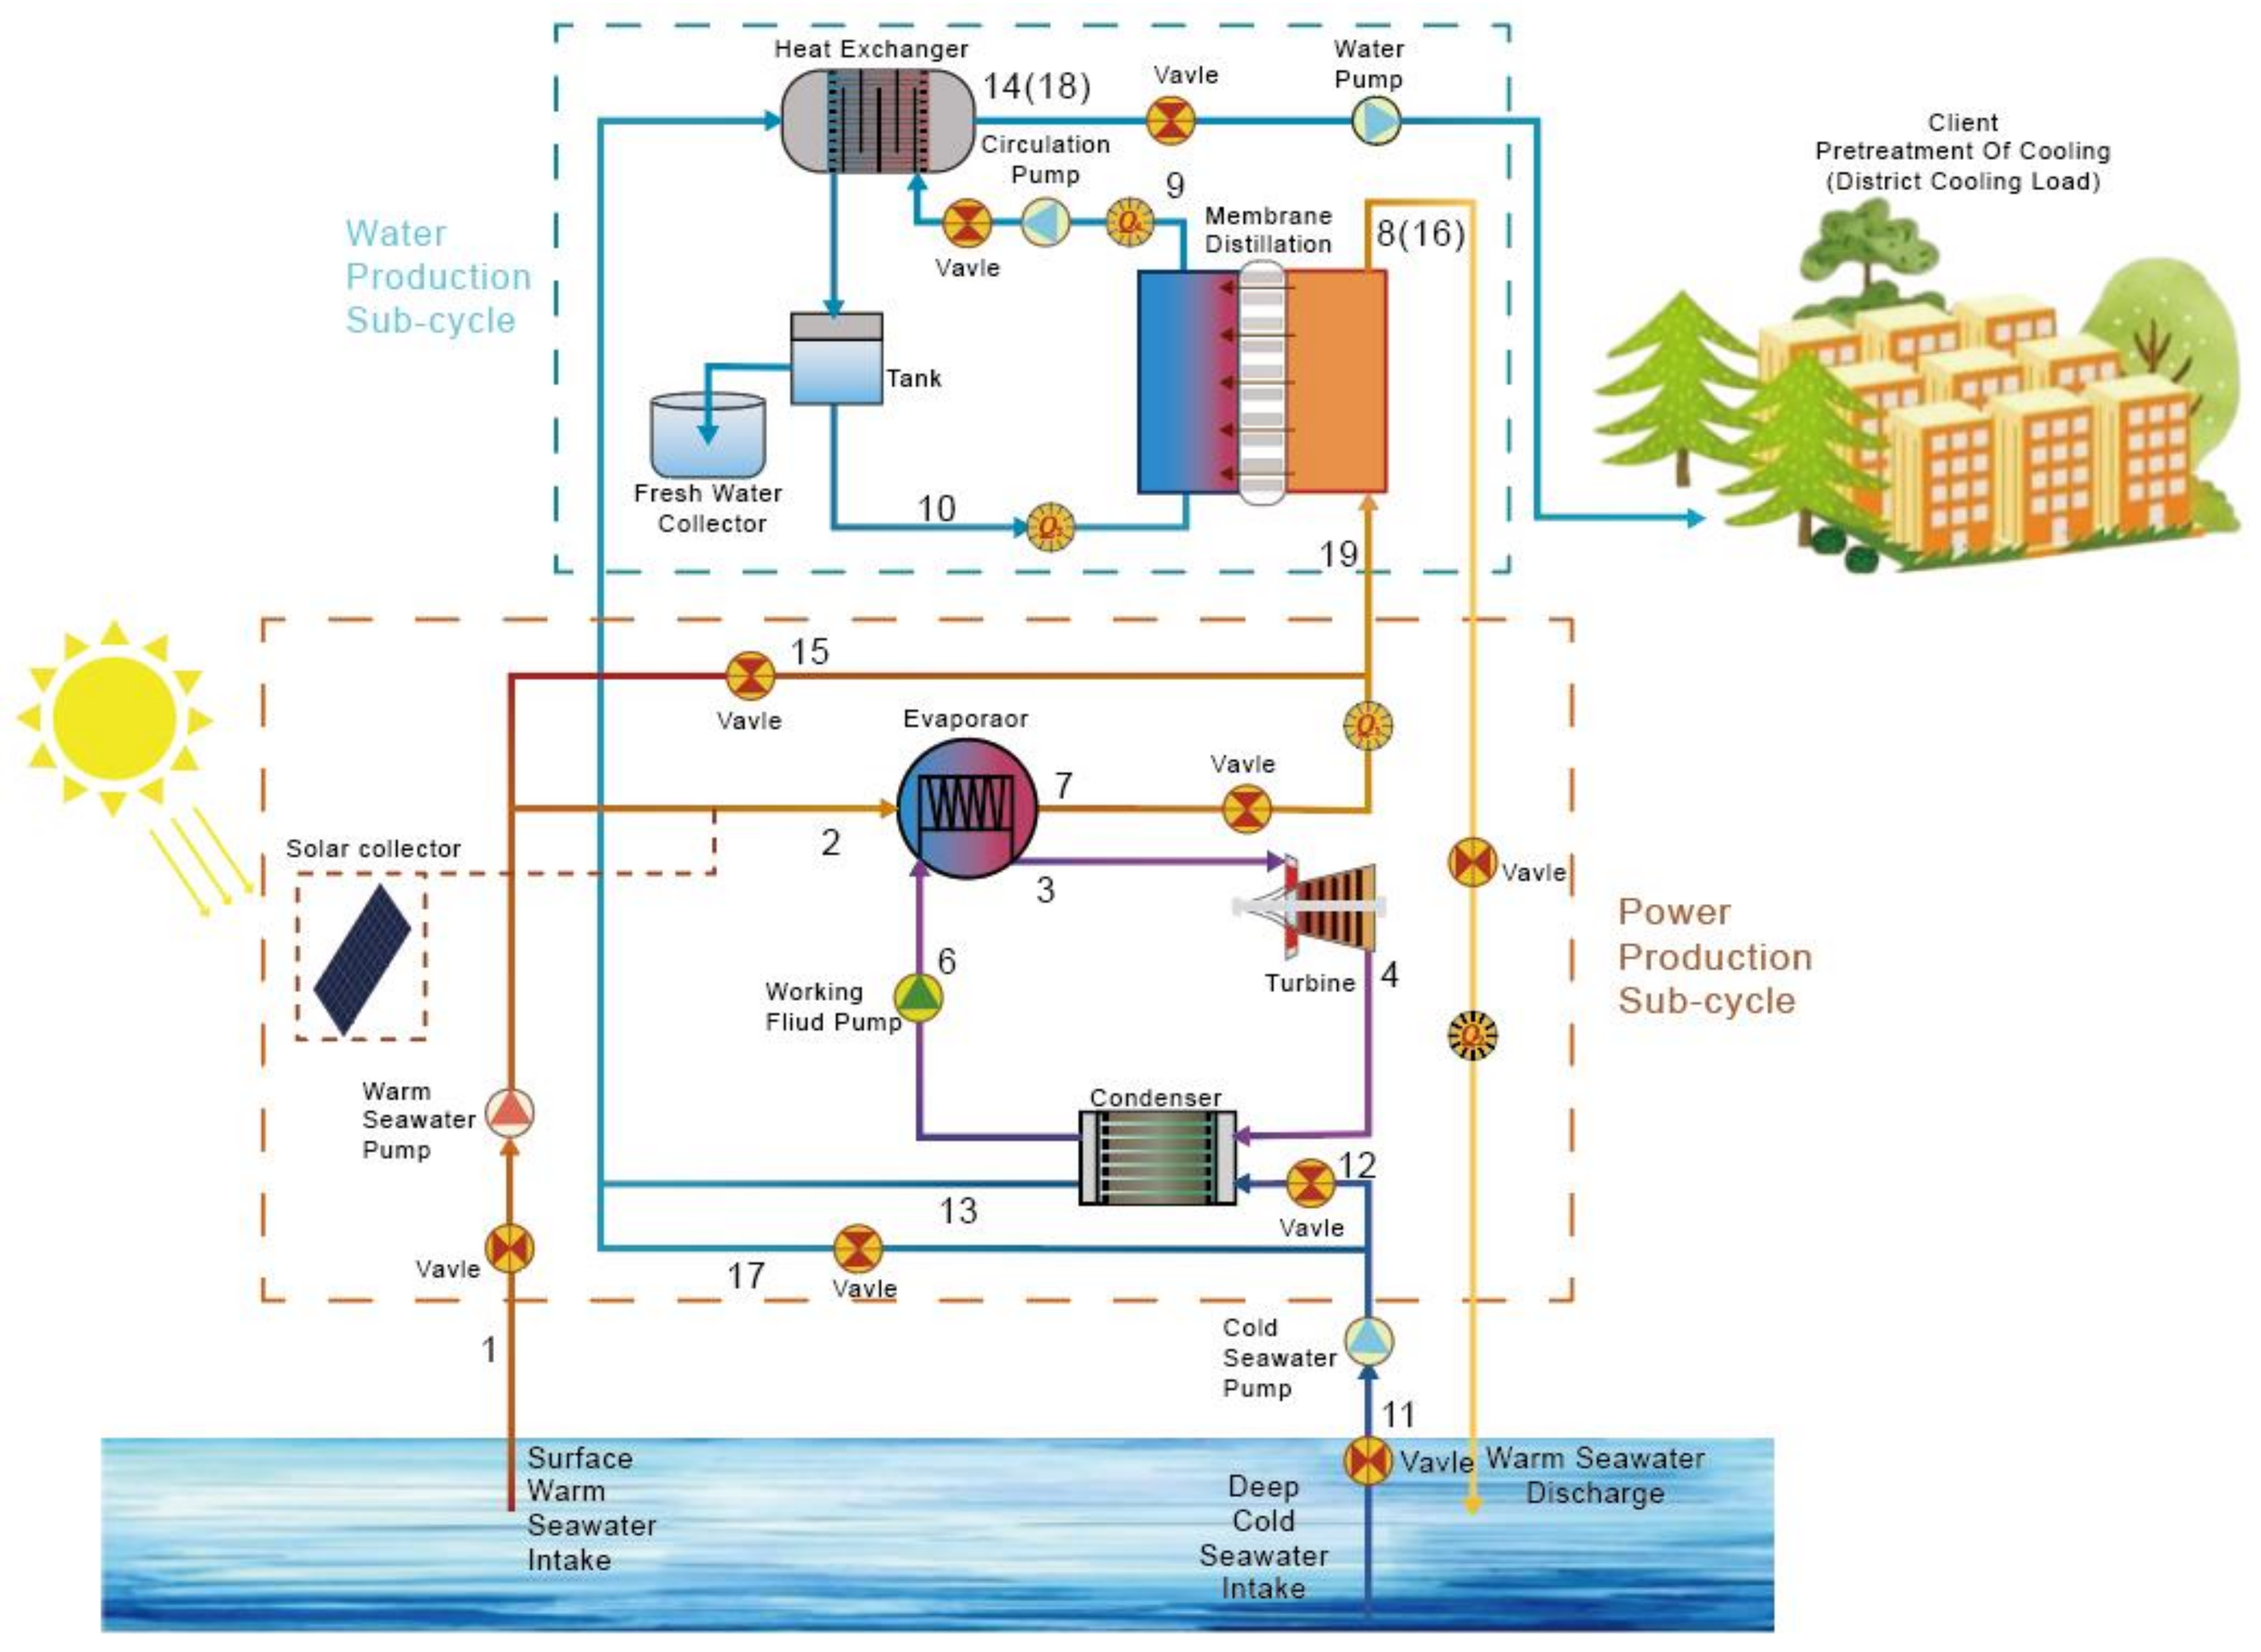
2. Description of the Integrated OTEC-DCMD System
2.1. Power Generation Sub-Cycle (PGS)
2.2. Water Production Sub-Cycle (WPC)
3. Mathematical Modelling of Mass, Energy and Exergy Balance
- 1.
- Ignore the heat loss in the system.
- 2.
- The system is in the steady-state operation.
- 3.
- All liquids are non-compressible and have uniform speed.
- 4.
- The membrane has good hydrophobic and air permeability, regardless of membrane wetting.
- 5.
- Ignore the kinetic and potential energy variation of fluid flowing between equipment.
3.1. Balance Equation of the Integrated System
3.2. Balance Equation of Power Generation Sub-Cycle
3.3. DCMD Water Production Sub-Cycle
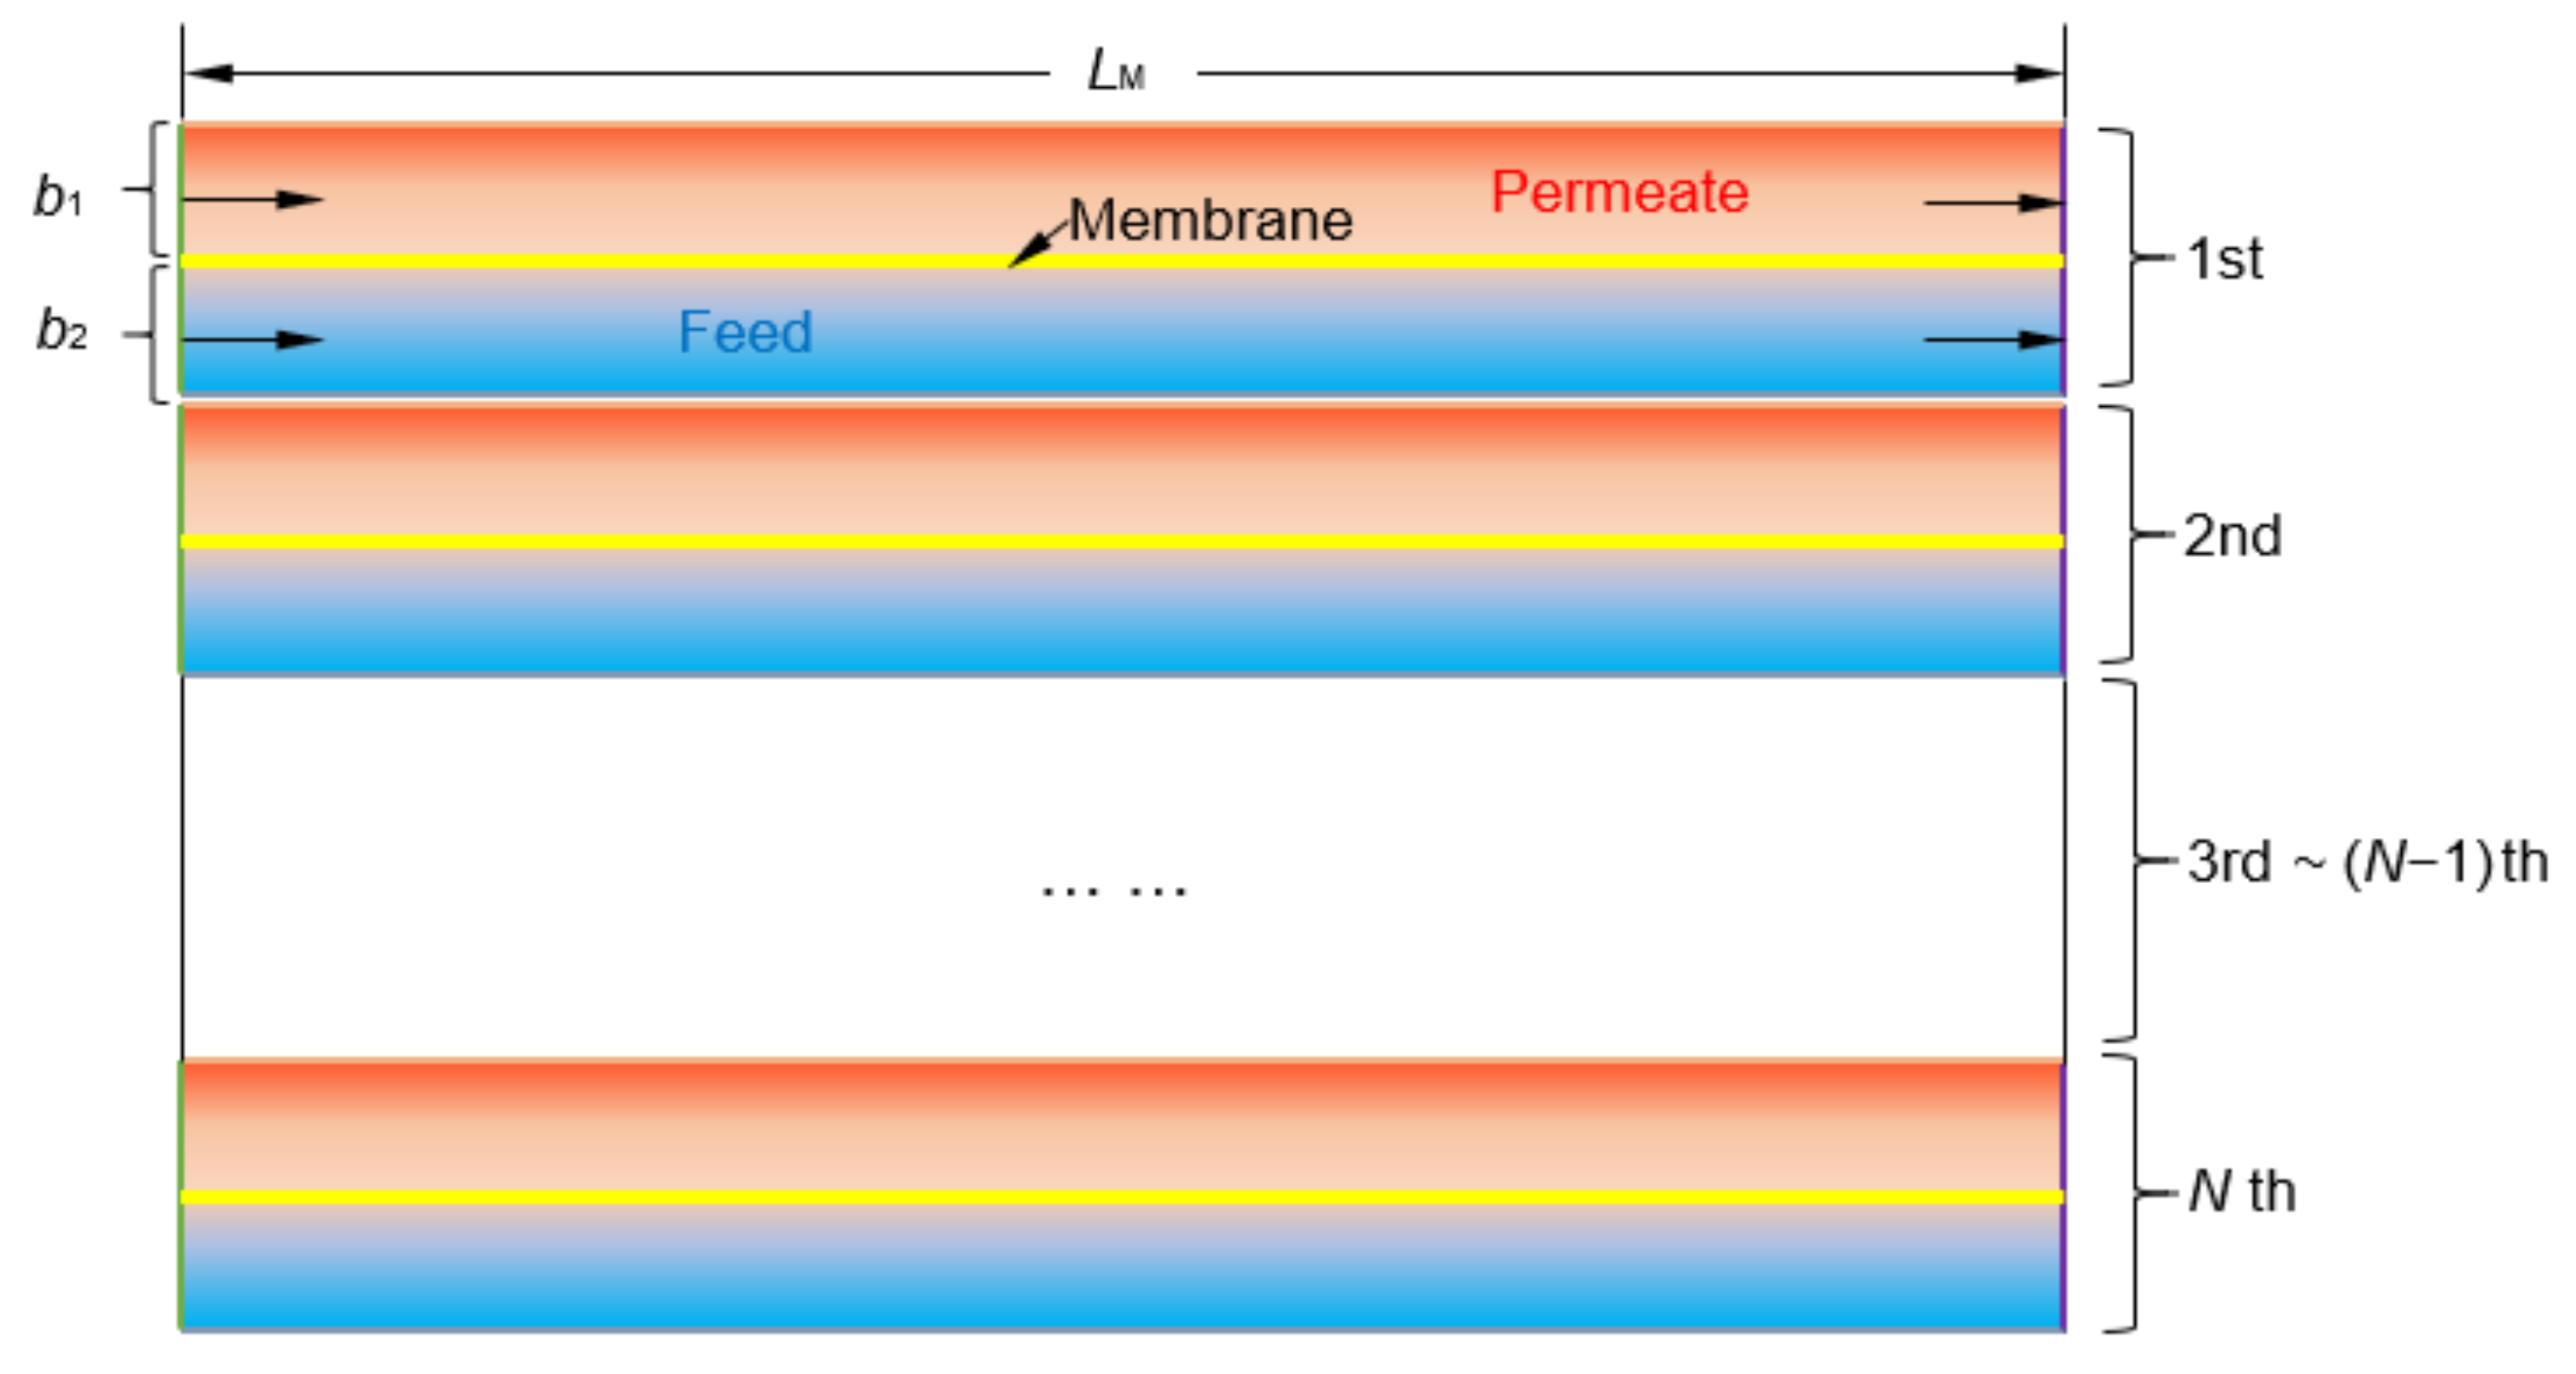
3.3.1. Mass and Heat Transfer Model
3.3.2. Balance Equations of DCMD Module
3.4. Thermodynamic Performance Evaluation
4. Results and Discussions
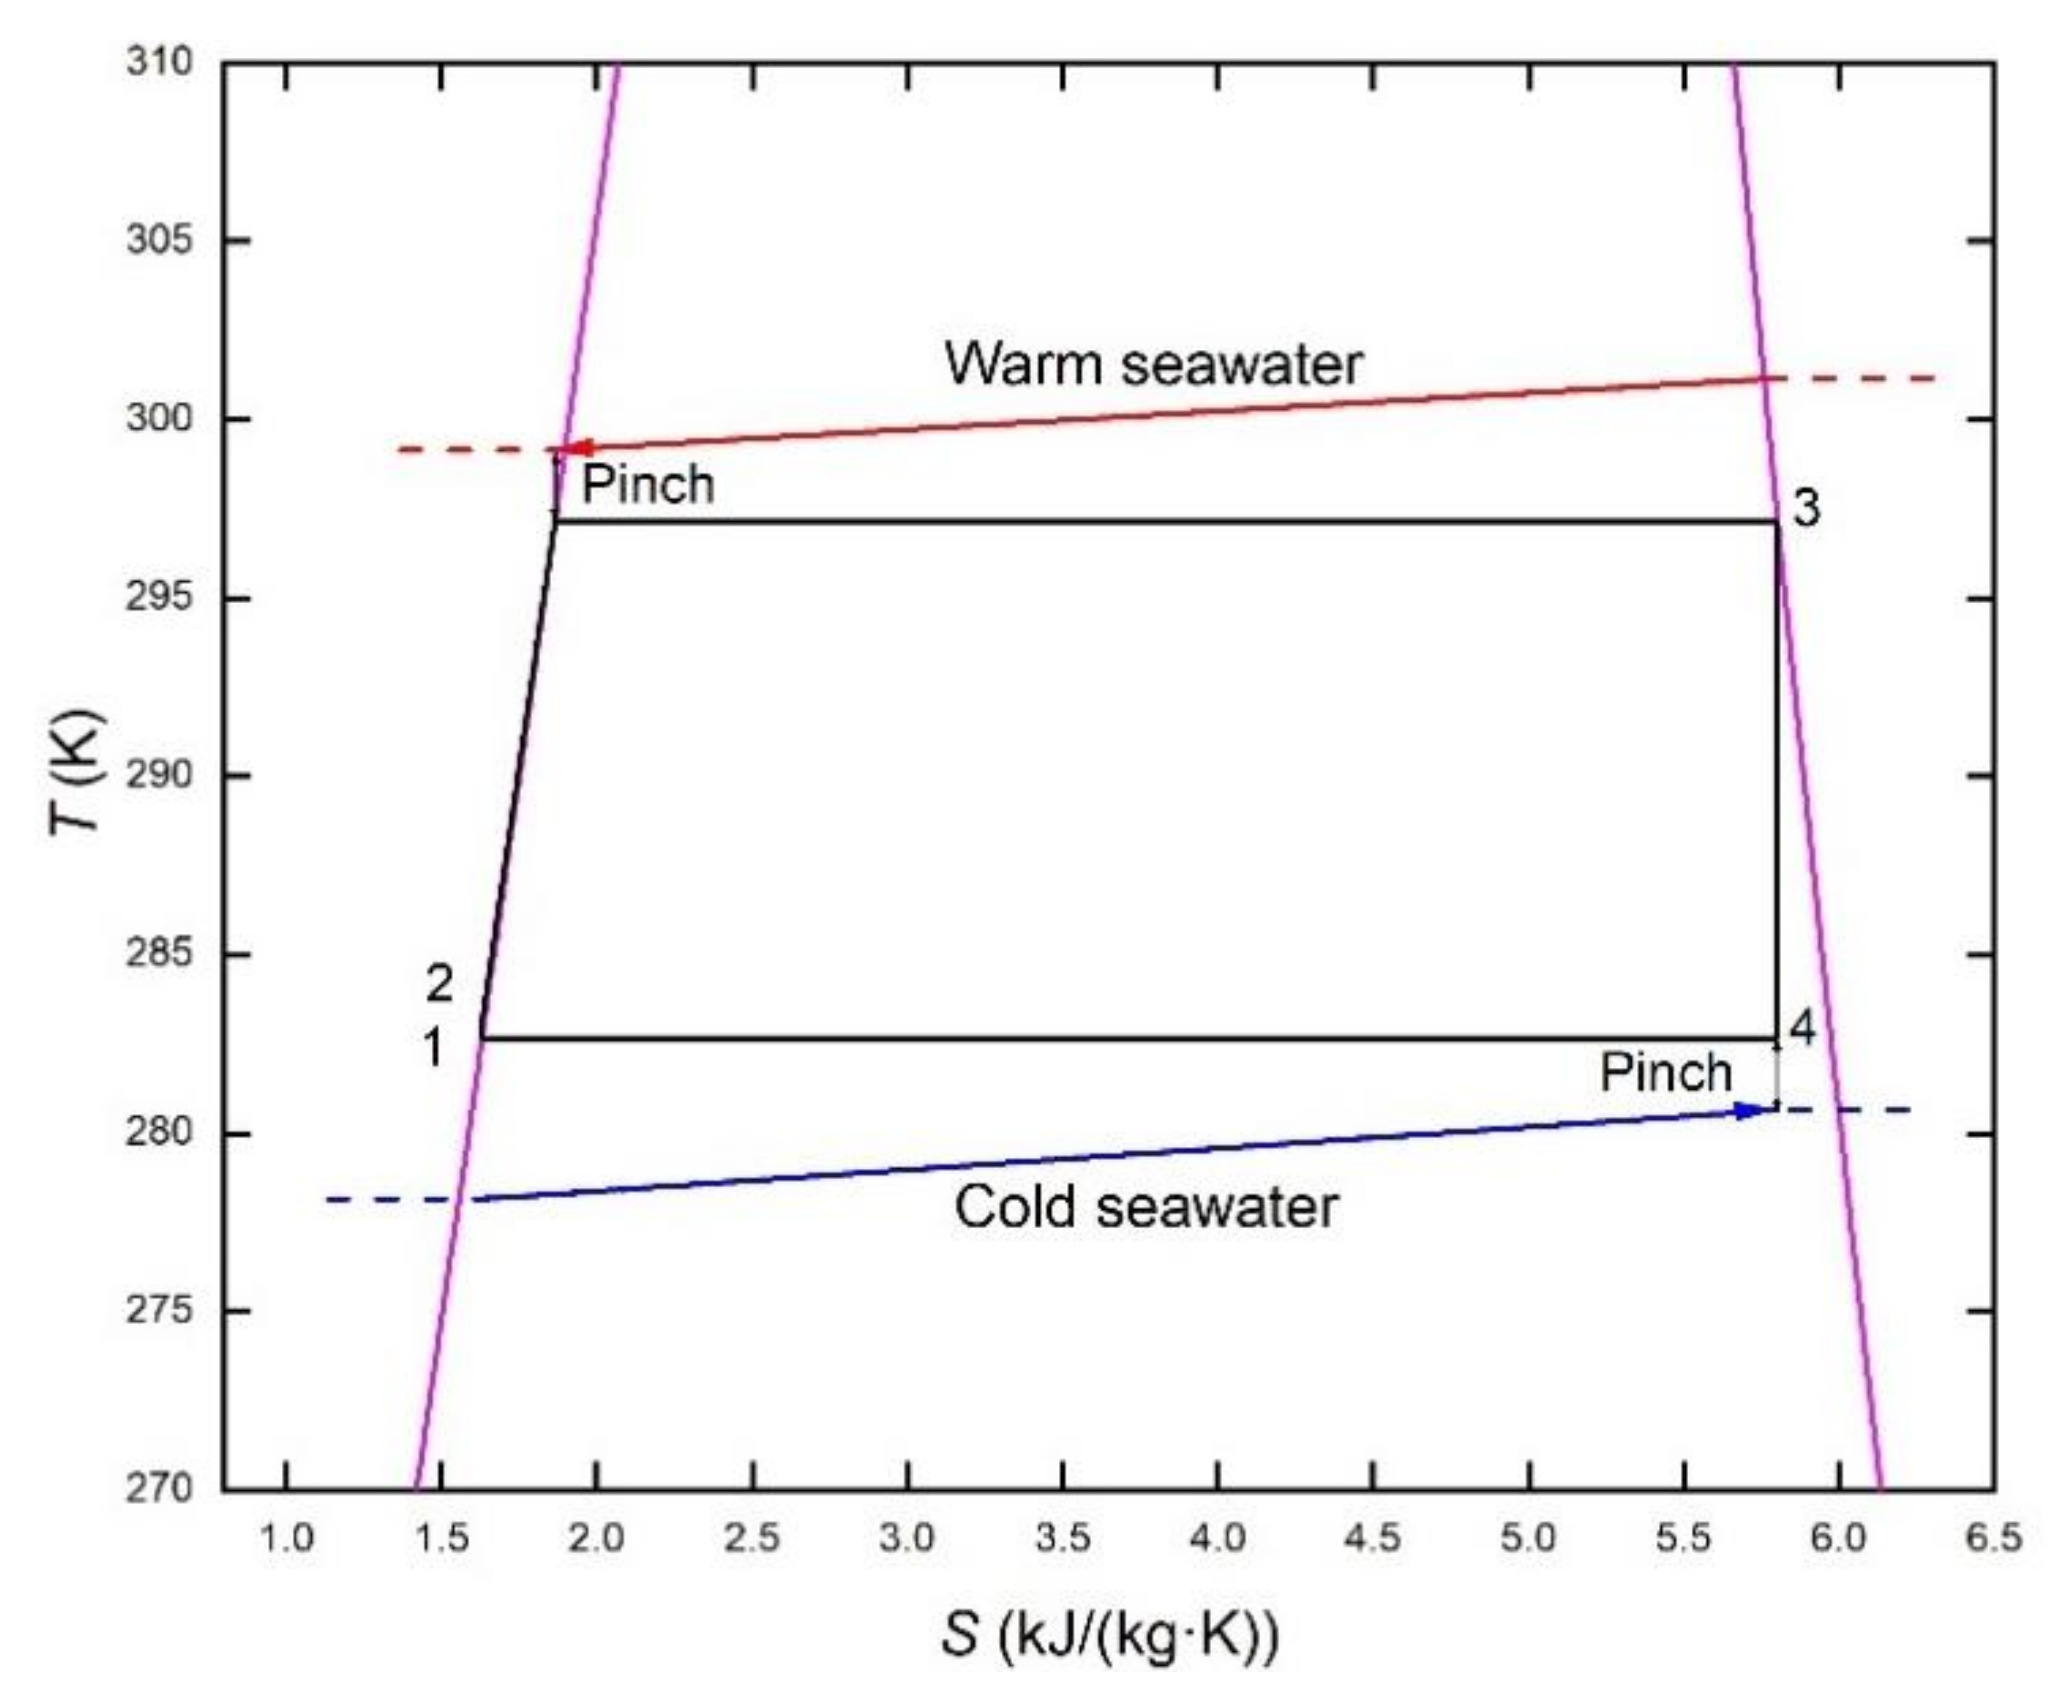
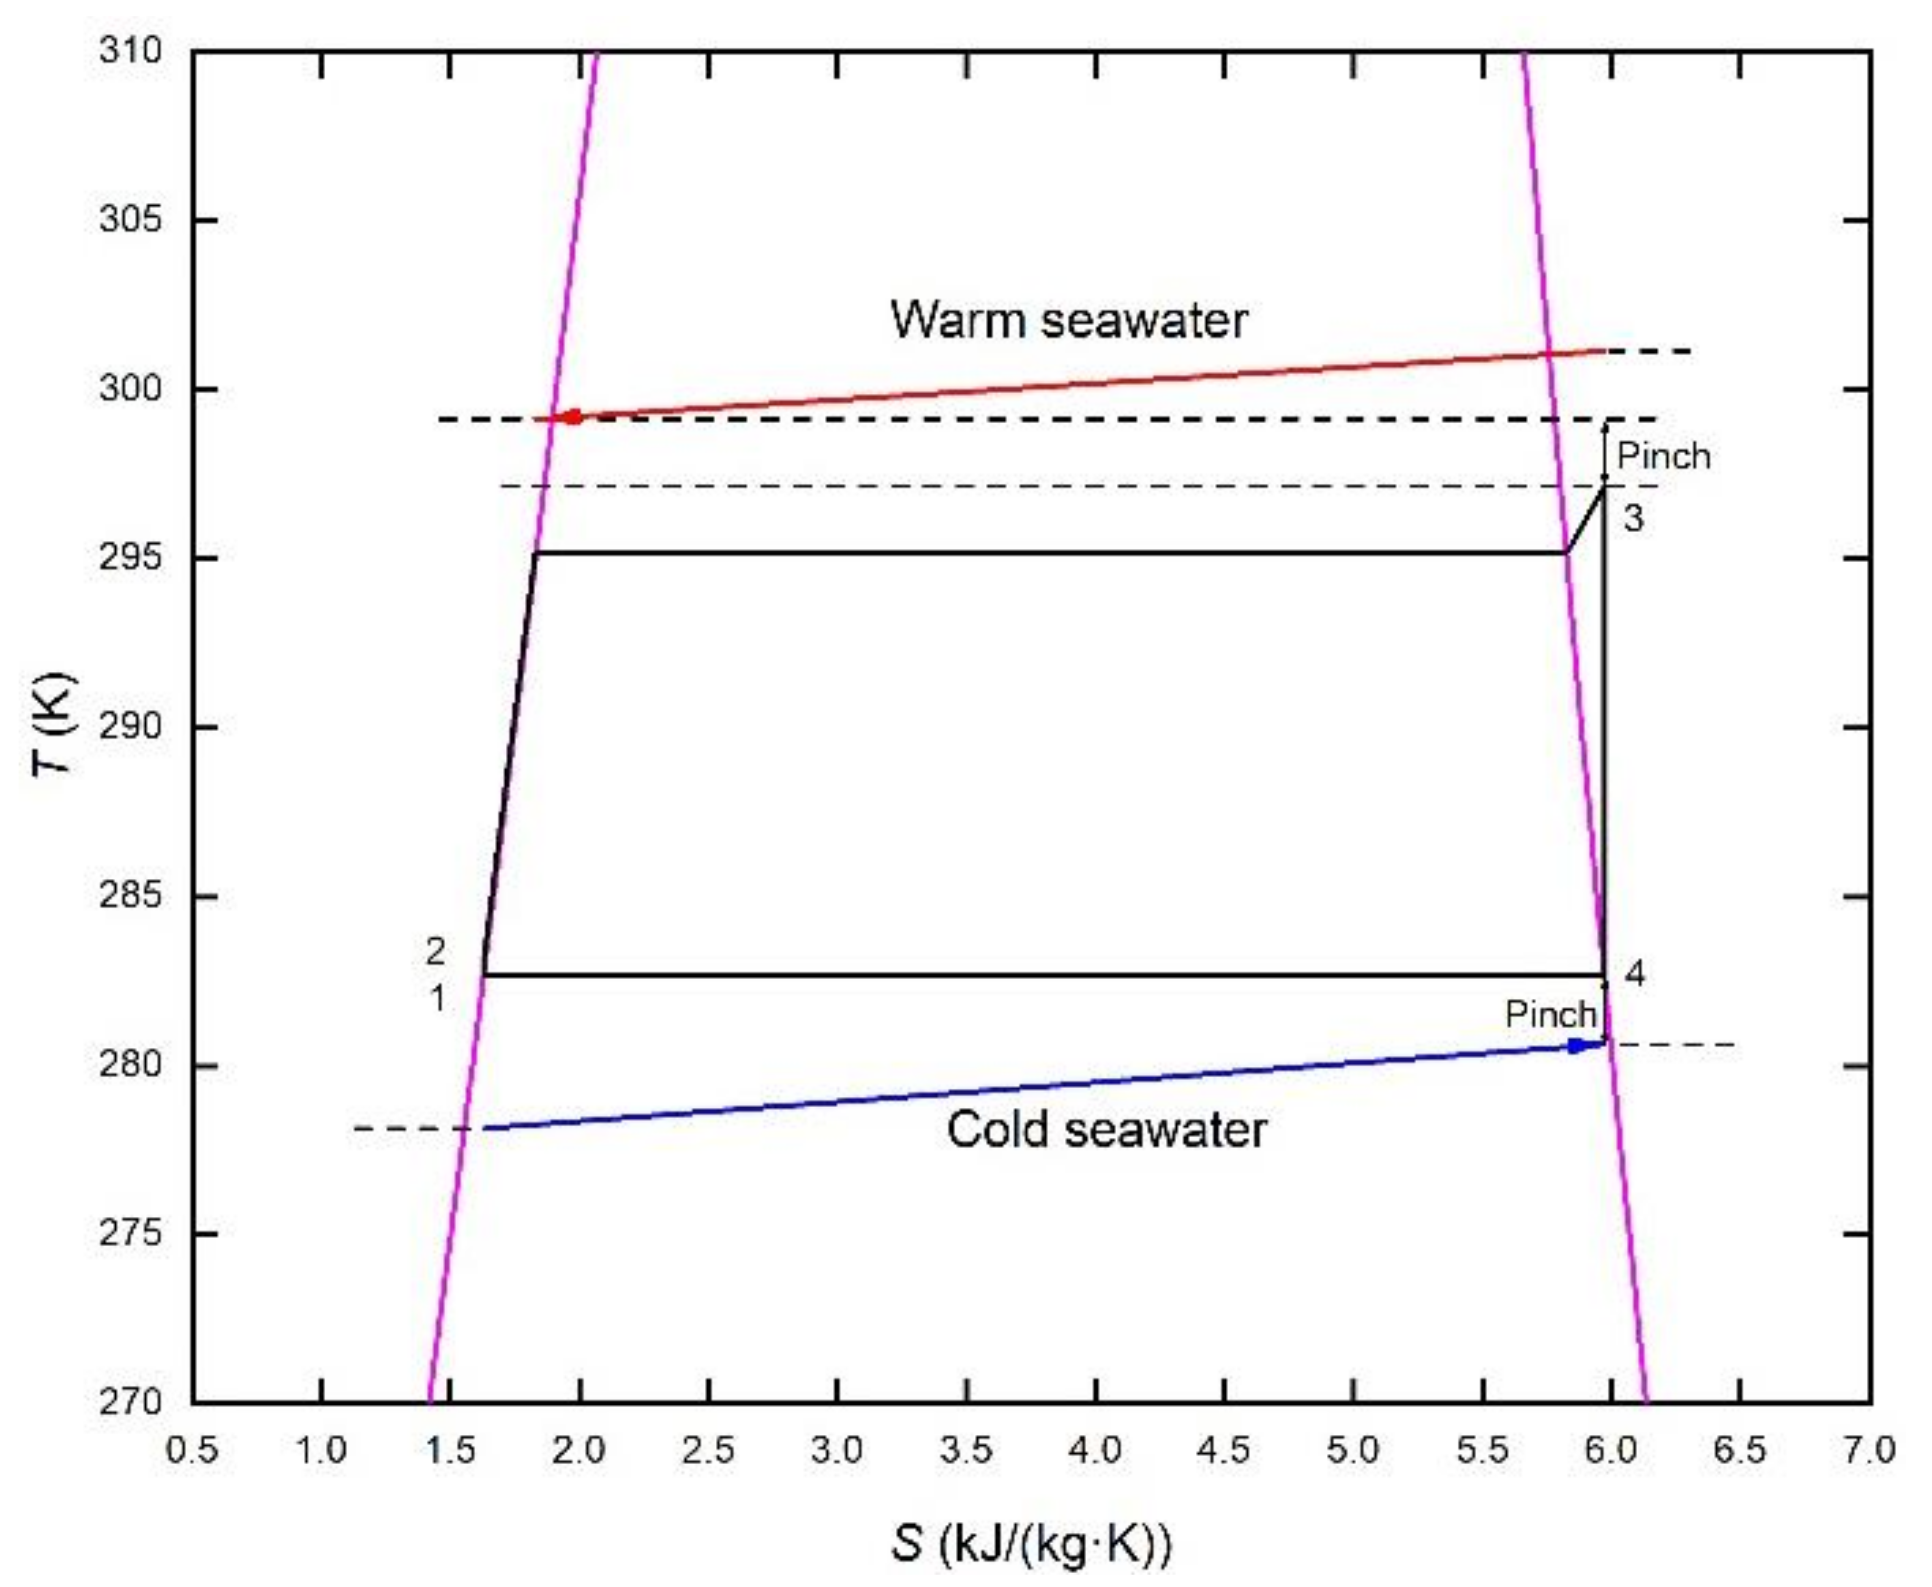
4.1. Power Generation Sub-Cycle and Exergy Analysis
4.2. Water Production Sub-Cycle and Fresh Water Production
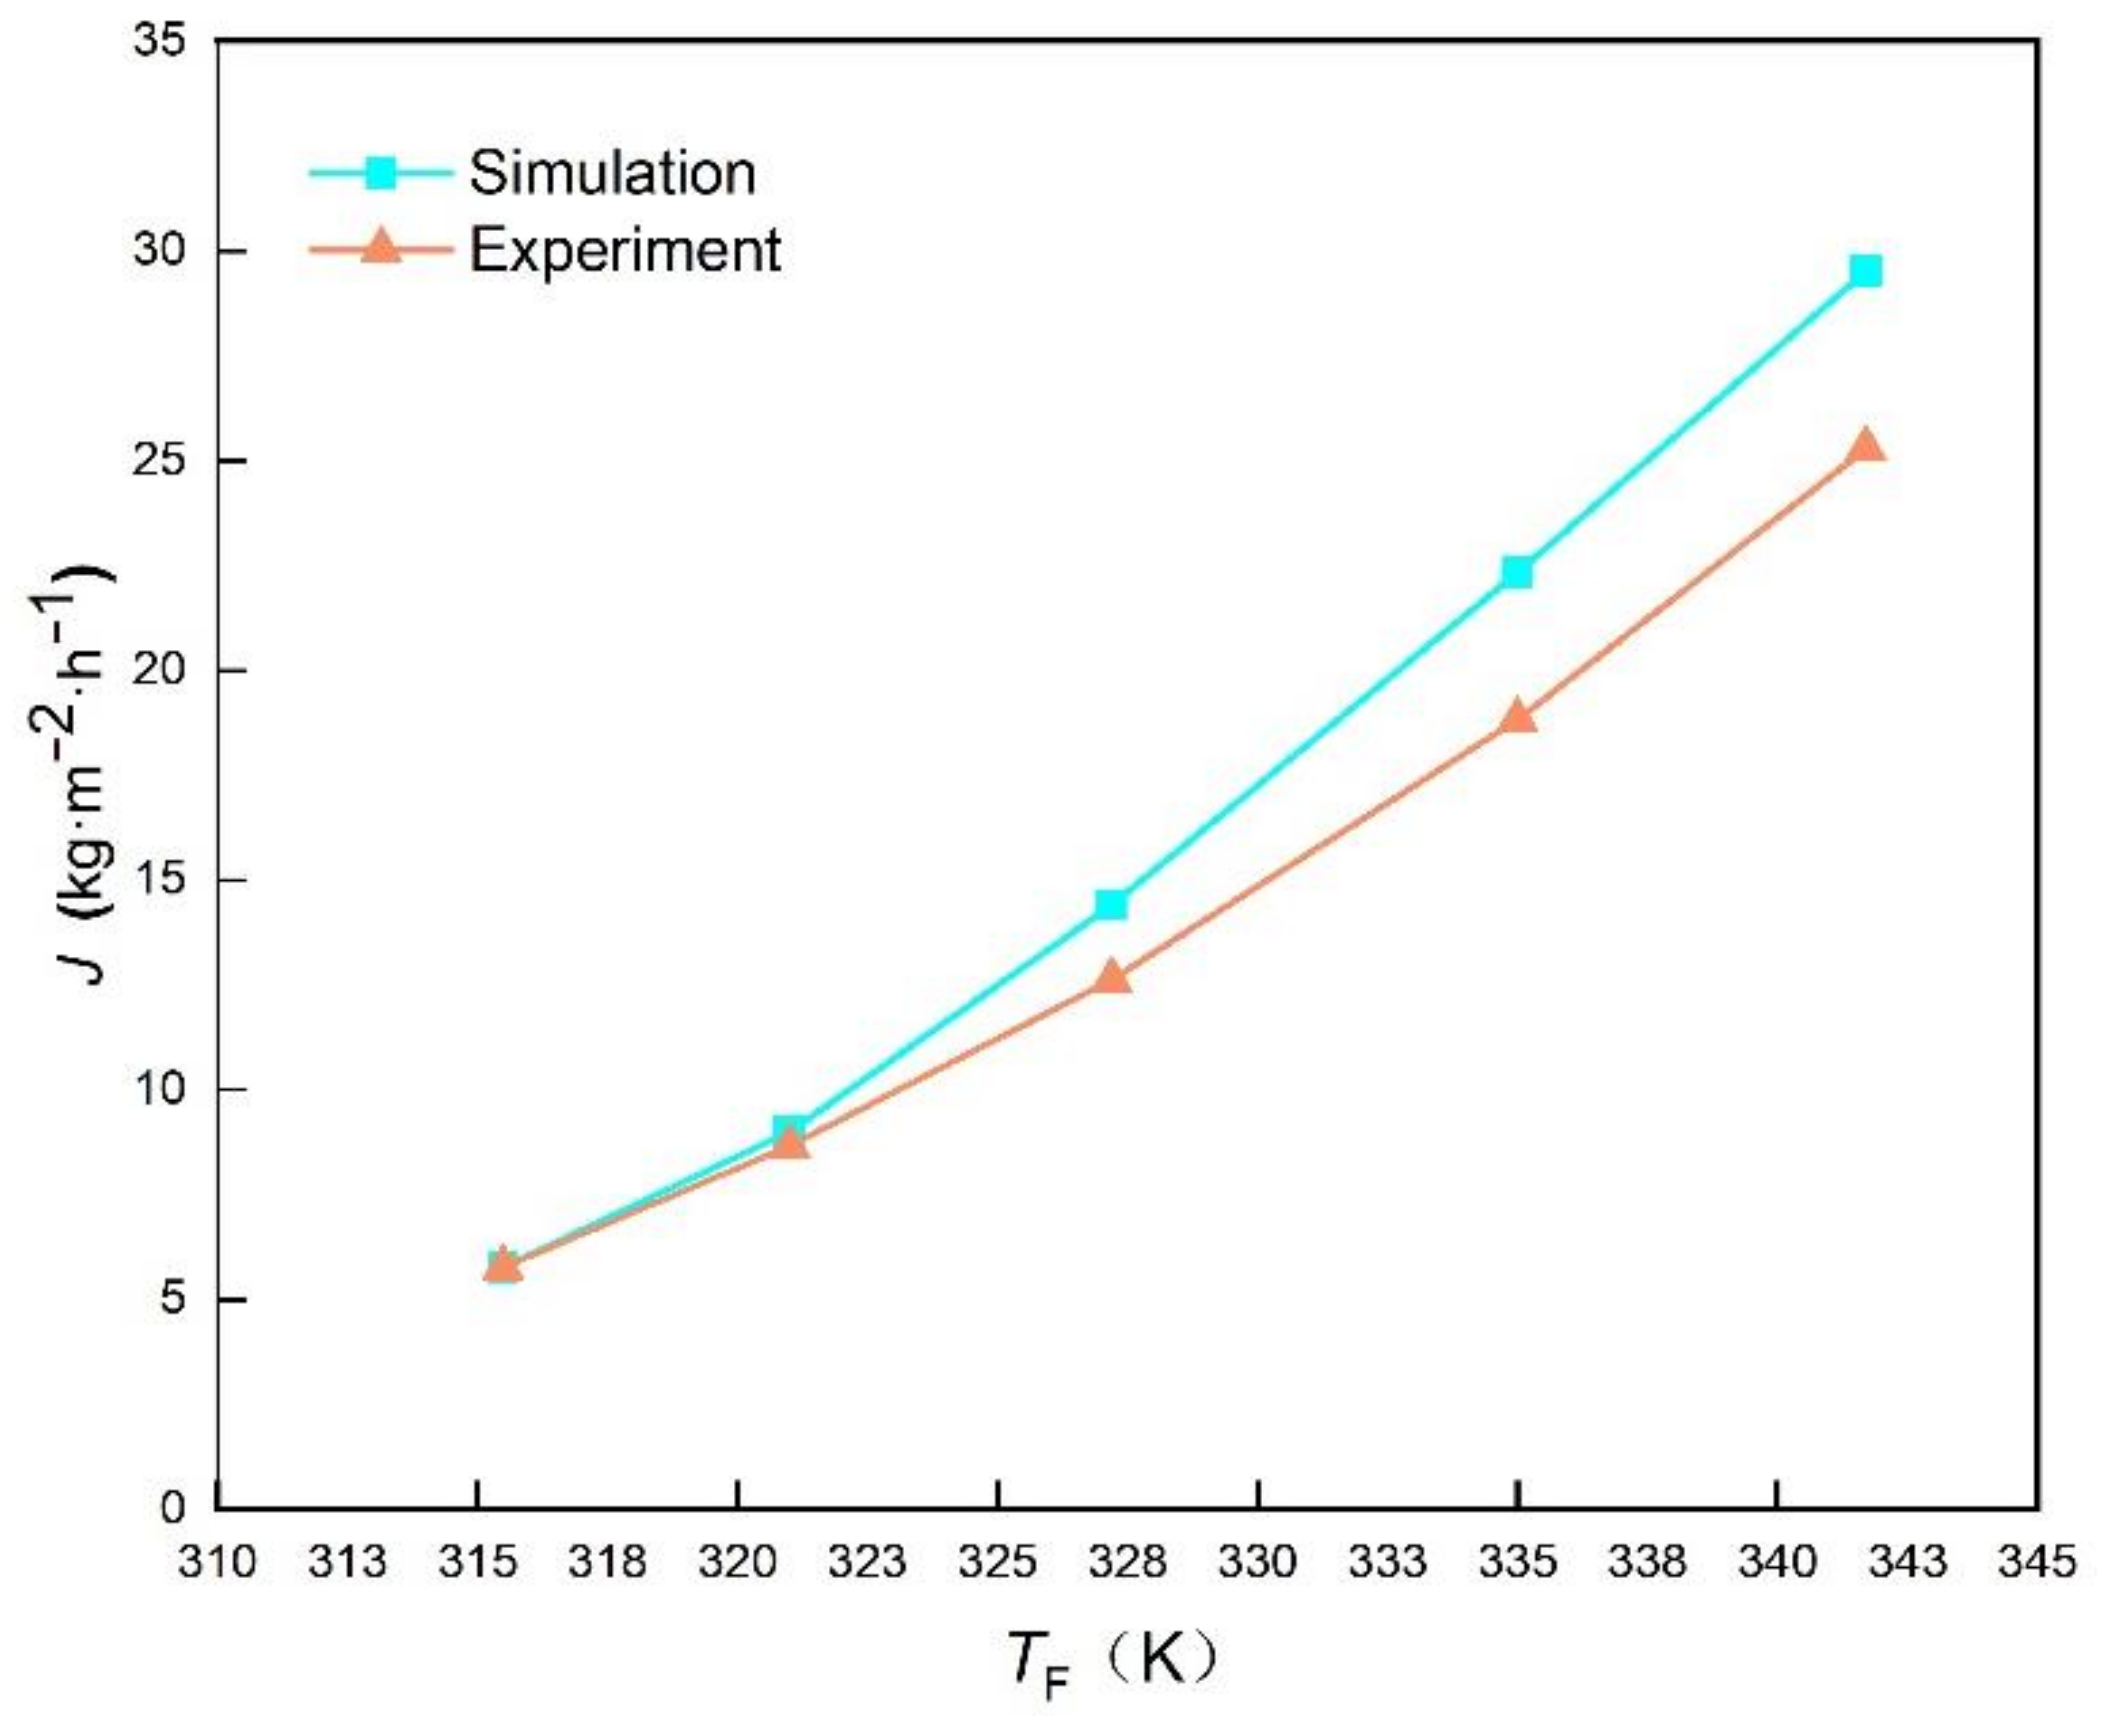
4.2.1. Model Verification
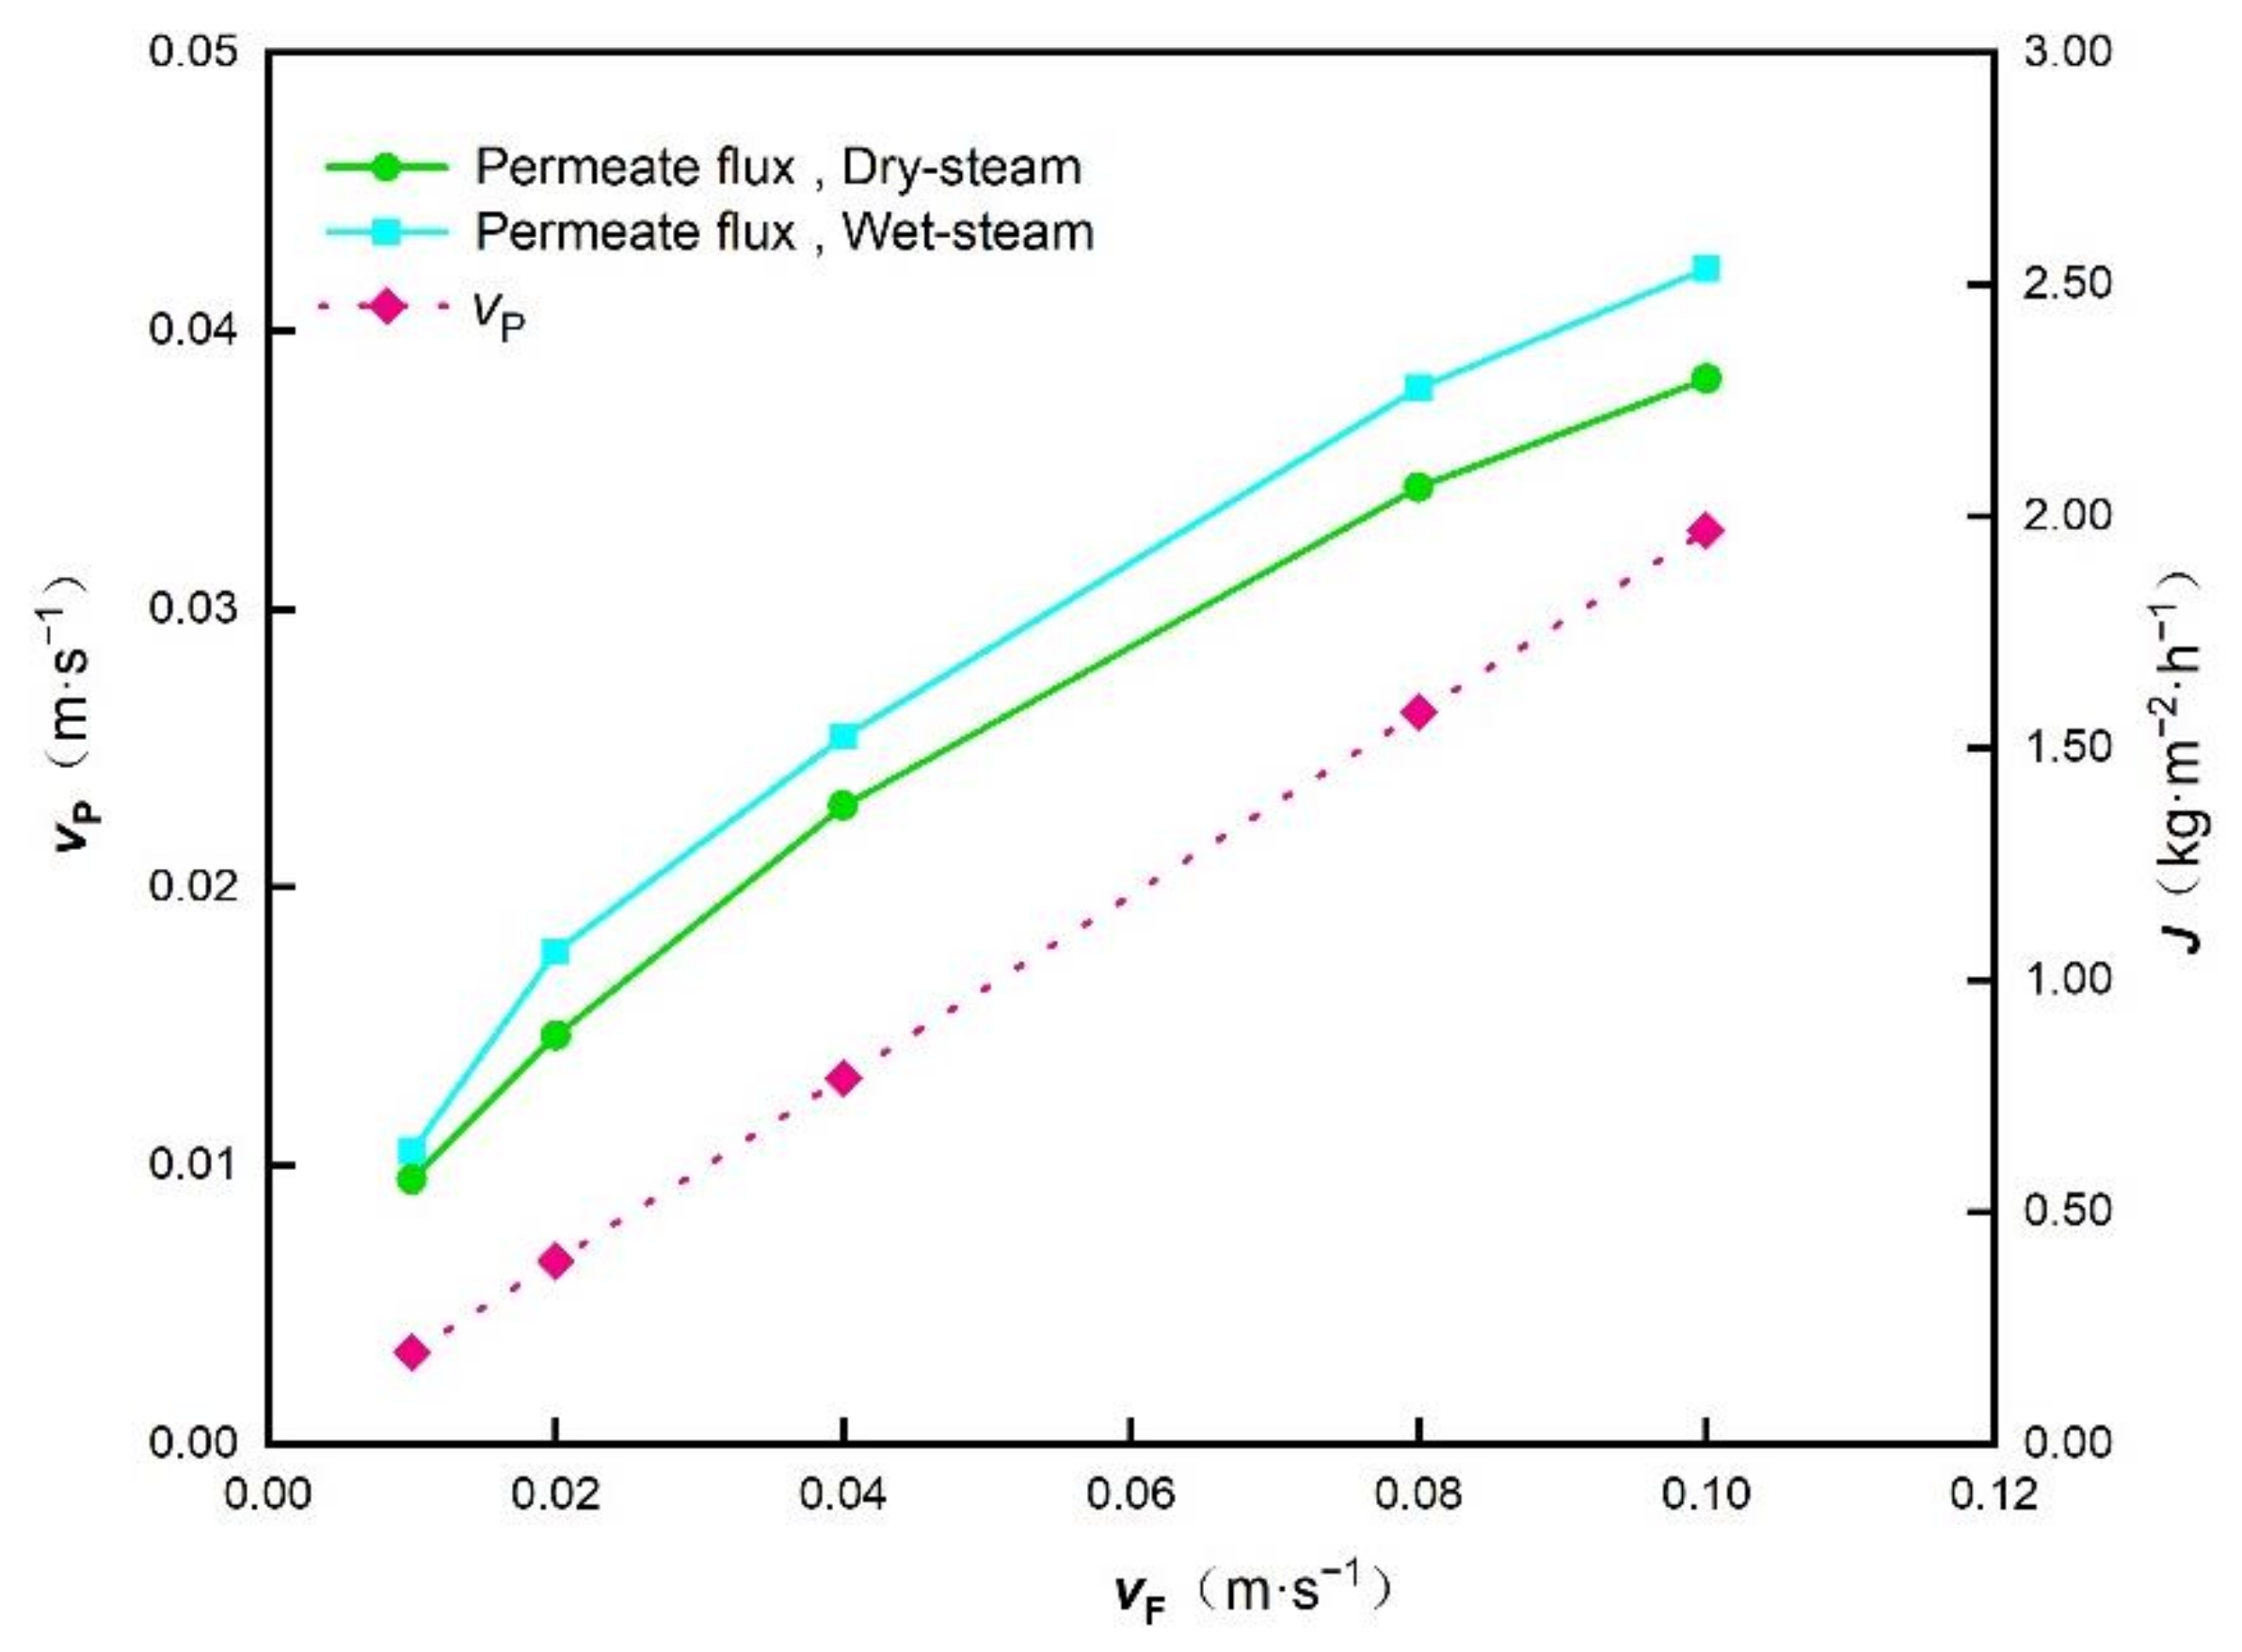
4.2.2. CFD Prediction of Water Production Performance
4.3. Analysis of the Integrated System
4.3.1. Energy and Exergy Efficiency
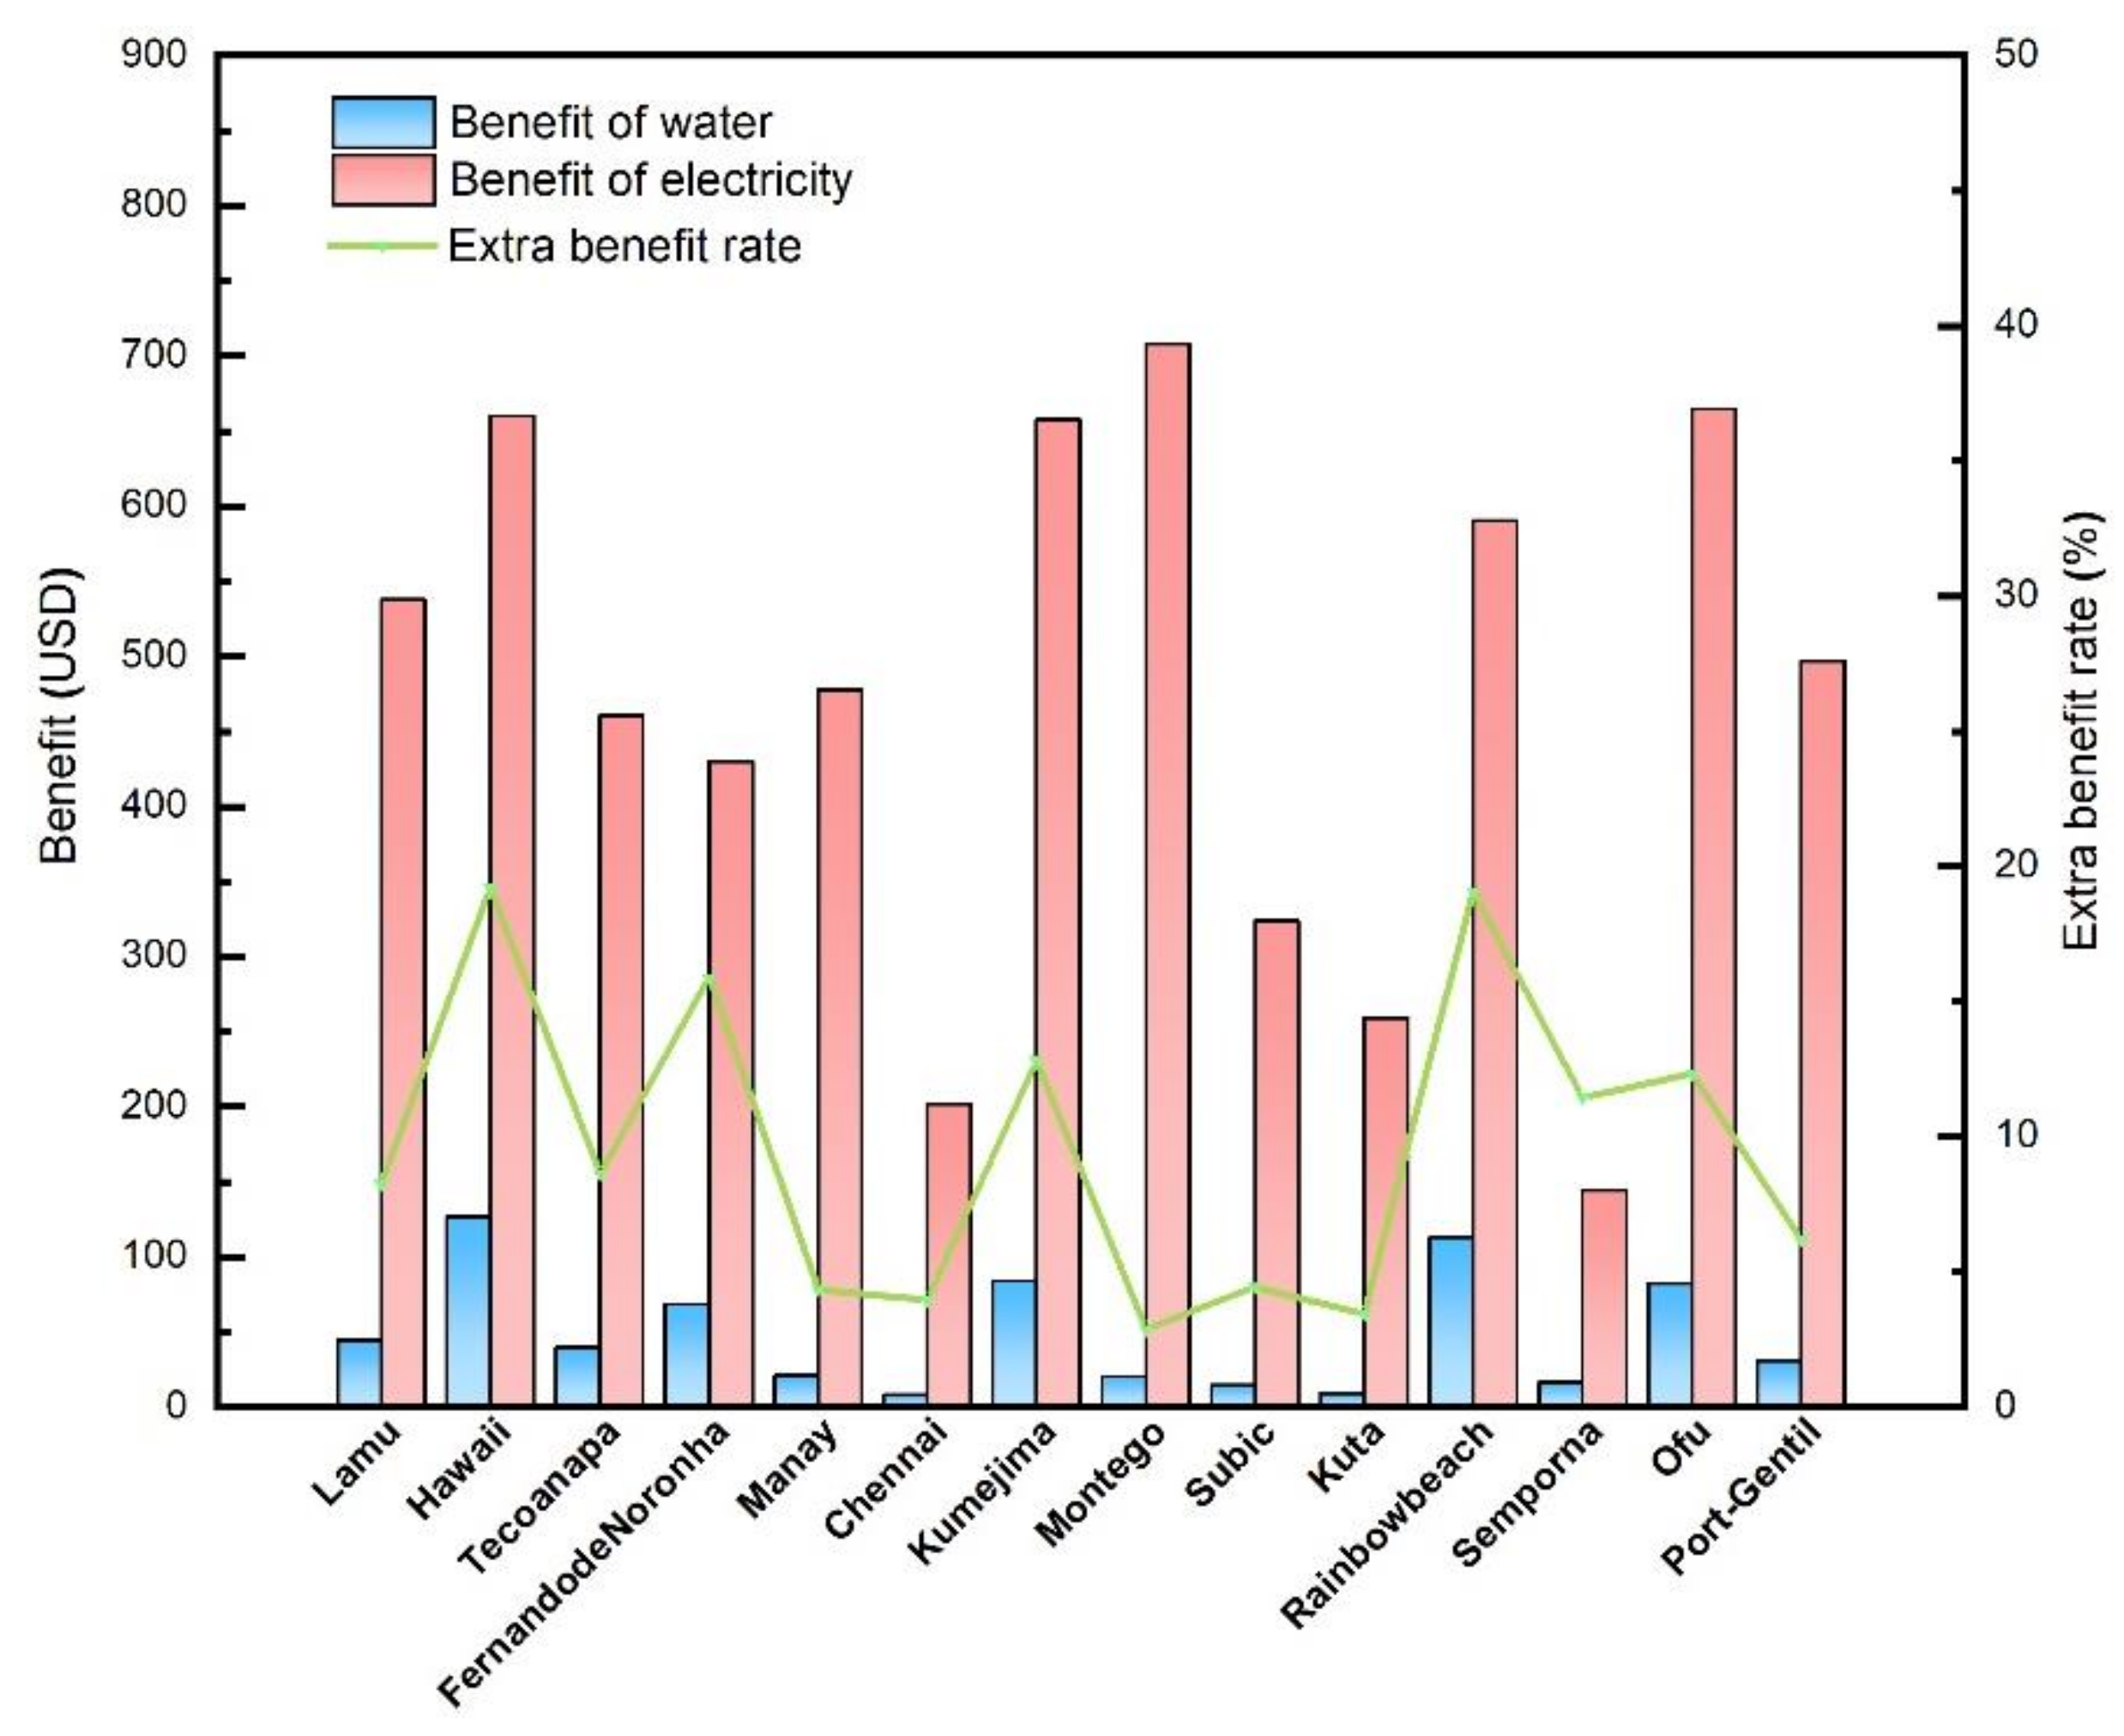
4.3.2. Economic Benefits
5. Conclusions
Author Contributions
Funding
Institutional Review Board Statement
Informed Consent Statement
Data Availability Statement
Conflicts of Interest
Nomenclature
| Q | Heat transfer rate (kW) |
| W | Work rate (kW) |
| S | Entropy (kW) |
| Ex | Exergy (kW) |
| m | Mass flow rate (kg·s−1) |
| h | Specific enthalpy (kJ·kg−1) |
| s | Specific entropy (kJ·kg−1·K−1) |
| J | Permeate flux (kg·m−2·h−1) |
| T | Temperature (℃,K) |
| V | Flow rate (m3·s−1) |
| A | Cross-section area (m2) |
| v | Velocity (m·s−1) |
| N | Number of modules |
| ΔE | The change of exergy (kW) |
| hr c | The latent heat of vaporization (kJ·kg−1) Specific heat capacity (kJ·kg−1·K−1) |
| Greek letters | |
| η | Thermal Efficiency (%) |
| φ | Exergy Efficiency (%) |
| α | Conversion rate (%) |
| τ | Efficiency of turbine (%) |
| θ | Efficiency of pump (%) |
| Subscripts | |
| Con | Condenser |
| Eva | Evaporator |
| WF | Work fluid |
| WCR | Daily water production |
| des | Destruction |
| gen | Generation |
| t | Turbine |
| in | Inlet |
| out | Output |
| ph | Physics |
| w | Work |
| F | Feed channel |
| P | Permeate channel |
| h | Hot |
| c | Cold |
| d | Desalination |
| b | Breadth of modules |
Appendix A

| Cycle | Energy Efficiency | Exergy Efficiency |
|---|---|---|
| Integrated OTEC System | ||
| WPC | ||
| PGC |
| System Components | Exergy Efficiency Equations |
|---|---|
| Evaporator Condenser | |
| Turbine | |
| WF pump |
References
- VanZwieten, J.H.; Rauchenstein, L.; Lee, L. An assessment of Florida’s ocean thermal energy conversion (OTEC) resource. Renew. Sustain. Energy Rev. 2017, 75, 683–691. [Google Scholar] [CrossRef] [Green Version]
- White, H.J. Mini-OTEC. Int. J. Ambient Energy 1980, 1, 75–88. [Google Scholar] [CrossRef]
- Otsuka, K.; Ouchi, K. An Application of Ocean Mining Technology: Deep Ocean Water Utilization. Deep-Sea Mining; Springer: Cham, Switzerland, 2017; pp. 345–362. [Google Scholar] [CrossRef]
- Liu, W.M.; Chen, F.Y.; Wang, Y.Q.; Jiang, W.J.; Zhang, J.G. Progress of Closed-Cycle OTEC and Study of a New Cycle of OTEC. Adv. Mater. Res. 2011, 354-355, 275–278. [Google Scholar] [CrossRef]
- Jia, Y.; Nihous, G.C.; Richards, K.J. Effects of ocean thermal energy conversion systems on near and far field seawater properties—A case study for Hawaii. J. Renew. Sustain. Energy 2012, 4, 063104. [Google Scholar] [CrossRef]
- Li, C.; Pan, L.; Wang, Y. Thermodynamic optimization of Rankine cycle using CO2-based binary zeotropic mixture for ocean thermal energy conversion. Appl. Therm. Eng. 2020, 178, 115617. [Google Scholar] [CrossRef]
- Khanmohammadi, S.; Baseri, M.M.; Ahmadi, P.; Al-Rashed, A.A.; Afrand, M. Proposal of a novel integrated ocean thermal energy conversion system with flat plate solar collectors and thermoelectric generators: Energy, exergy and environmental analyses. J. Clean. Prod. 2020, 256, 120600. [Google Scholar] [CrossRef]
- Wu, Z.; Feng, H.; Chen, L.; Ge, Y. Performance Optimization of a Condenser in Ocean Thermal Energy Conversion (OTEC) System Based on Constructal Theory and a Multi-Objective Genetic Algorithm. Entropy 2020, 22, 641. [Google Scholar] [CrossRef] [PubMed]
- Park, S.; Chun, W.; Kim, N. Simulated production of electric power and desalination using Solar-OTEC hybrid system. Int. J. Energy Res. 2016, 41, 637–649. [Google Scholar] [CrossRef]
- Ishaq, H.; Dincer, I. A comparative evaluation of OTEC, solar and wind energy based systems for clean hydrogen production. J. Clean. Prod. 2019, 246, 118736. [Google Scholar] [CrossRef]
- Hasan, A.; Dincer, I. An ocean thermal energy conversion based system for district cooling, ammonia and power production. Int. J. Hydrogen Energy 2020, 45, 15878–15887. [Google Scholar] [CrossRef]
- Magesh, R. OTEC Technology—A World of Clean Energy and Water. In Proceedings of the World Congress on Engineering (WCE 2010), London, UK, 30 June–2 July 2010; pp. 1618–1623. [Google Scholar]
- Kim, A.; Kim, H.-J.; Lee, H.-S.; Cha, S. Dual-use open cycle ocean thermal energy conversion (OC-OTEC) using multiple condensers for adjustable power generation and seawater desalination. Renew. Energy 2016, 85, 344–358. [Google Scholar] [CrossRef]
- Soto, R.; Vergara, J. Thermal power plant efficiency enhancement with Ocean Thermal Energy Conversion. Appl. Therm. Eng. 2014, 62, 105–112. [Google Scholar] [CrossRef]
- Zhou, S.; Liu, X.; Bian, Y.; Shen, S. Energy, exergy and exergoeconomic analysis of a combined cooling, desalination and power system. Energy Convers. Manag. 2020, 218, 113006. [Google Scholar] [CrossRef]
- Khalifa, A.; Ahmad, H.; Antar, M.; Laoui, T.; Khayet, M. Experimental and theoretical investigations on water desalination using direct contact membrane distillation. Desalination 2017, 404, 22–34. [Google Scholar] [CrossRef]
- Drioli, E.; Ali, A.; Macedonio, F. Membrane distillation: Recent developments and perspectives. Desalination 2015, 356, 56–84. [Google Scholar] [CrossRef]
- Wang, P.; Chung, T.S. Recent advances in membrane distillation processes: Membrane development, configuration design and application exploring. J. Membr. Sci. 2015, 474, 39–56. [Google Scholar] [CrossRef]
- Shirazi, M.M.A.; Kargari, A.; Tabatabaei, M.; Ismail, A.F.; Matsuura, T. Concentration of glycerol from dilute glycerol wastewater using sweeping gas membrane distillation. Chem. Eng. Process. Process Intensif. 2014, 78, 58–66. [Google Scholar] [CrossRef]
- Abu-Zeid, M.A.E.R.; Zhang, Y.; Dong, H.; Zhang, L.; Chen, H.L.; Hou, L. A comprehensive review of vacuum membrane distillation technique. Desalination 2015, 356, 1–14. [Google Scholar] [CrossRef]
- Dincer, I.; Rosen, M.A. Energy, environment and sustainable development. Appl. Energy 1999, 64, 427–440. [Google Scholar] [CrossRef] [Green Version]
- Yilmaz, F.; Ozturk, M.; Selbas, R. Thermodynamic performance assessment of ocean thermal energy conversion based hydrogen production and liquefaction process. Int. J. Hydrogen Energy 2018, 43, 10626–10636. [Google Scholar] [CrossRef]
- Yilmaz, F. Energy, exergy and economic analyses of a novel hybrid ocean thermal energy conversion system for clean power production. Energy Convers. Manag. 2019, 196, 557–566. [Google Scholar] [CrossRef]
- Ibrahim, S.S.; Alsalhy, Q.F. Modeling and simulation for direct contact membrane distillation in hollow fiber modules. AIChE J. 2012, 59, 589–603. [Google Scholar] [CrossRef]
- Bernardoni, C.; Binotti, M.; Giostri, A. Techno-economic analysis of closed OTEC cycles for power generation. Renew. Energy 2018, 132, 1018–1033. [Google Scholar] [CrossRef]
- Dorji, U.; Ghomashchi, R. Hydro turbine failure mechanisms: An overview. Eng. Fail. Anal. 2014, 44, 136–147. [Google Scholar] [CrossRef]
- Hwang, H.J.; He, K.; Gray, S.; Zhang, J.; Moon, I.S. Direct contact membrane distillation (DCMD): Experimental study on the commercial PTFE membrane and modeling. J. Membr. Sci. 2011, 371, 90–98. [Google Scholar] [CrossRef] [Green Version]
- Yun, Y.; Ma, R.; Zhang, W.; Fane, A.; Li, J. Direct contact membrane distillation mechanism for high concentration NaCl solutions. Desalination 2006, 188, 251–262. [Google Scholar] [CrossRef]
- Seungtaek, L.; Hosaeng, L.; Junghyun, M.; Hyeonju, K. Simulation Data of Regional Economic Analysis of OTEC for Applicable Area. Processes 2020, 8, 1107. [Google Scholar] [CrossRef]


| Working Fluid | Parameters | Dry Steam | Wet Steam |
|---|---|---|---|
| Ammonia | Evaporating temperature, °C | 22 | 24 |
| Evaporating pressure, bar | 7.3 | 8 | |
| Temperature of evaporator outlet, °C | 24 | 24 | |
| Condensing temperature, °C | 9.5 | 9.5 | |
| Condensing pressure, bar | 5.99 | 5.99 | |
| Temperature of condenser outlet, °C | 9.5 | 9.5 | |
| Mass flow rate of working fluid, kg/s | 5.131 | 3.544 | |
| Seawater | Temperature of warm seawater inlet, °C | 28 | 28 |
| Temperature of cold seawater inlet, °C | 5 | 5 | |
| Mass flow rate of warm seawater, kg/s | 658.263 | 658.263 | |
| Temperature drop of warm seawater, °C | 2.22 | 1.53 | |
| Mass flow rate of cold seawater, kg/s | 523.413 | 523.413 | |
| Temperature rise of cold seawater, °C | 2.75 | 1.88 | |
| Power generation of turbine, kW | 100 | 100 | |
| Working fluid pump power, kW | 1.361 | 1.344 |
| Parameters | Dry Steam | Wet Steam |
|---|---|---|
| The inlet temperature of permeate channel, °C | 9.7 | 8.8 |
| The outlet temperature of permeate channel, °C | 16.14 | 14.98 |
| The inlet temperature of feed channel, °C | 25.8 | 26.47 |
| The outlet temperature of feed channel, °C | 24.99 | 25.58 |
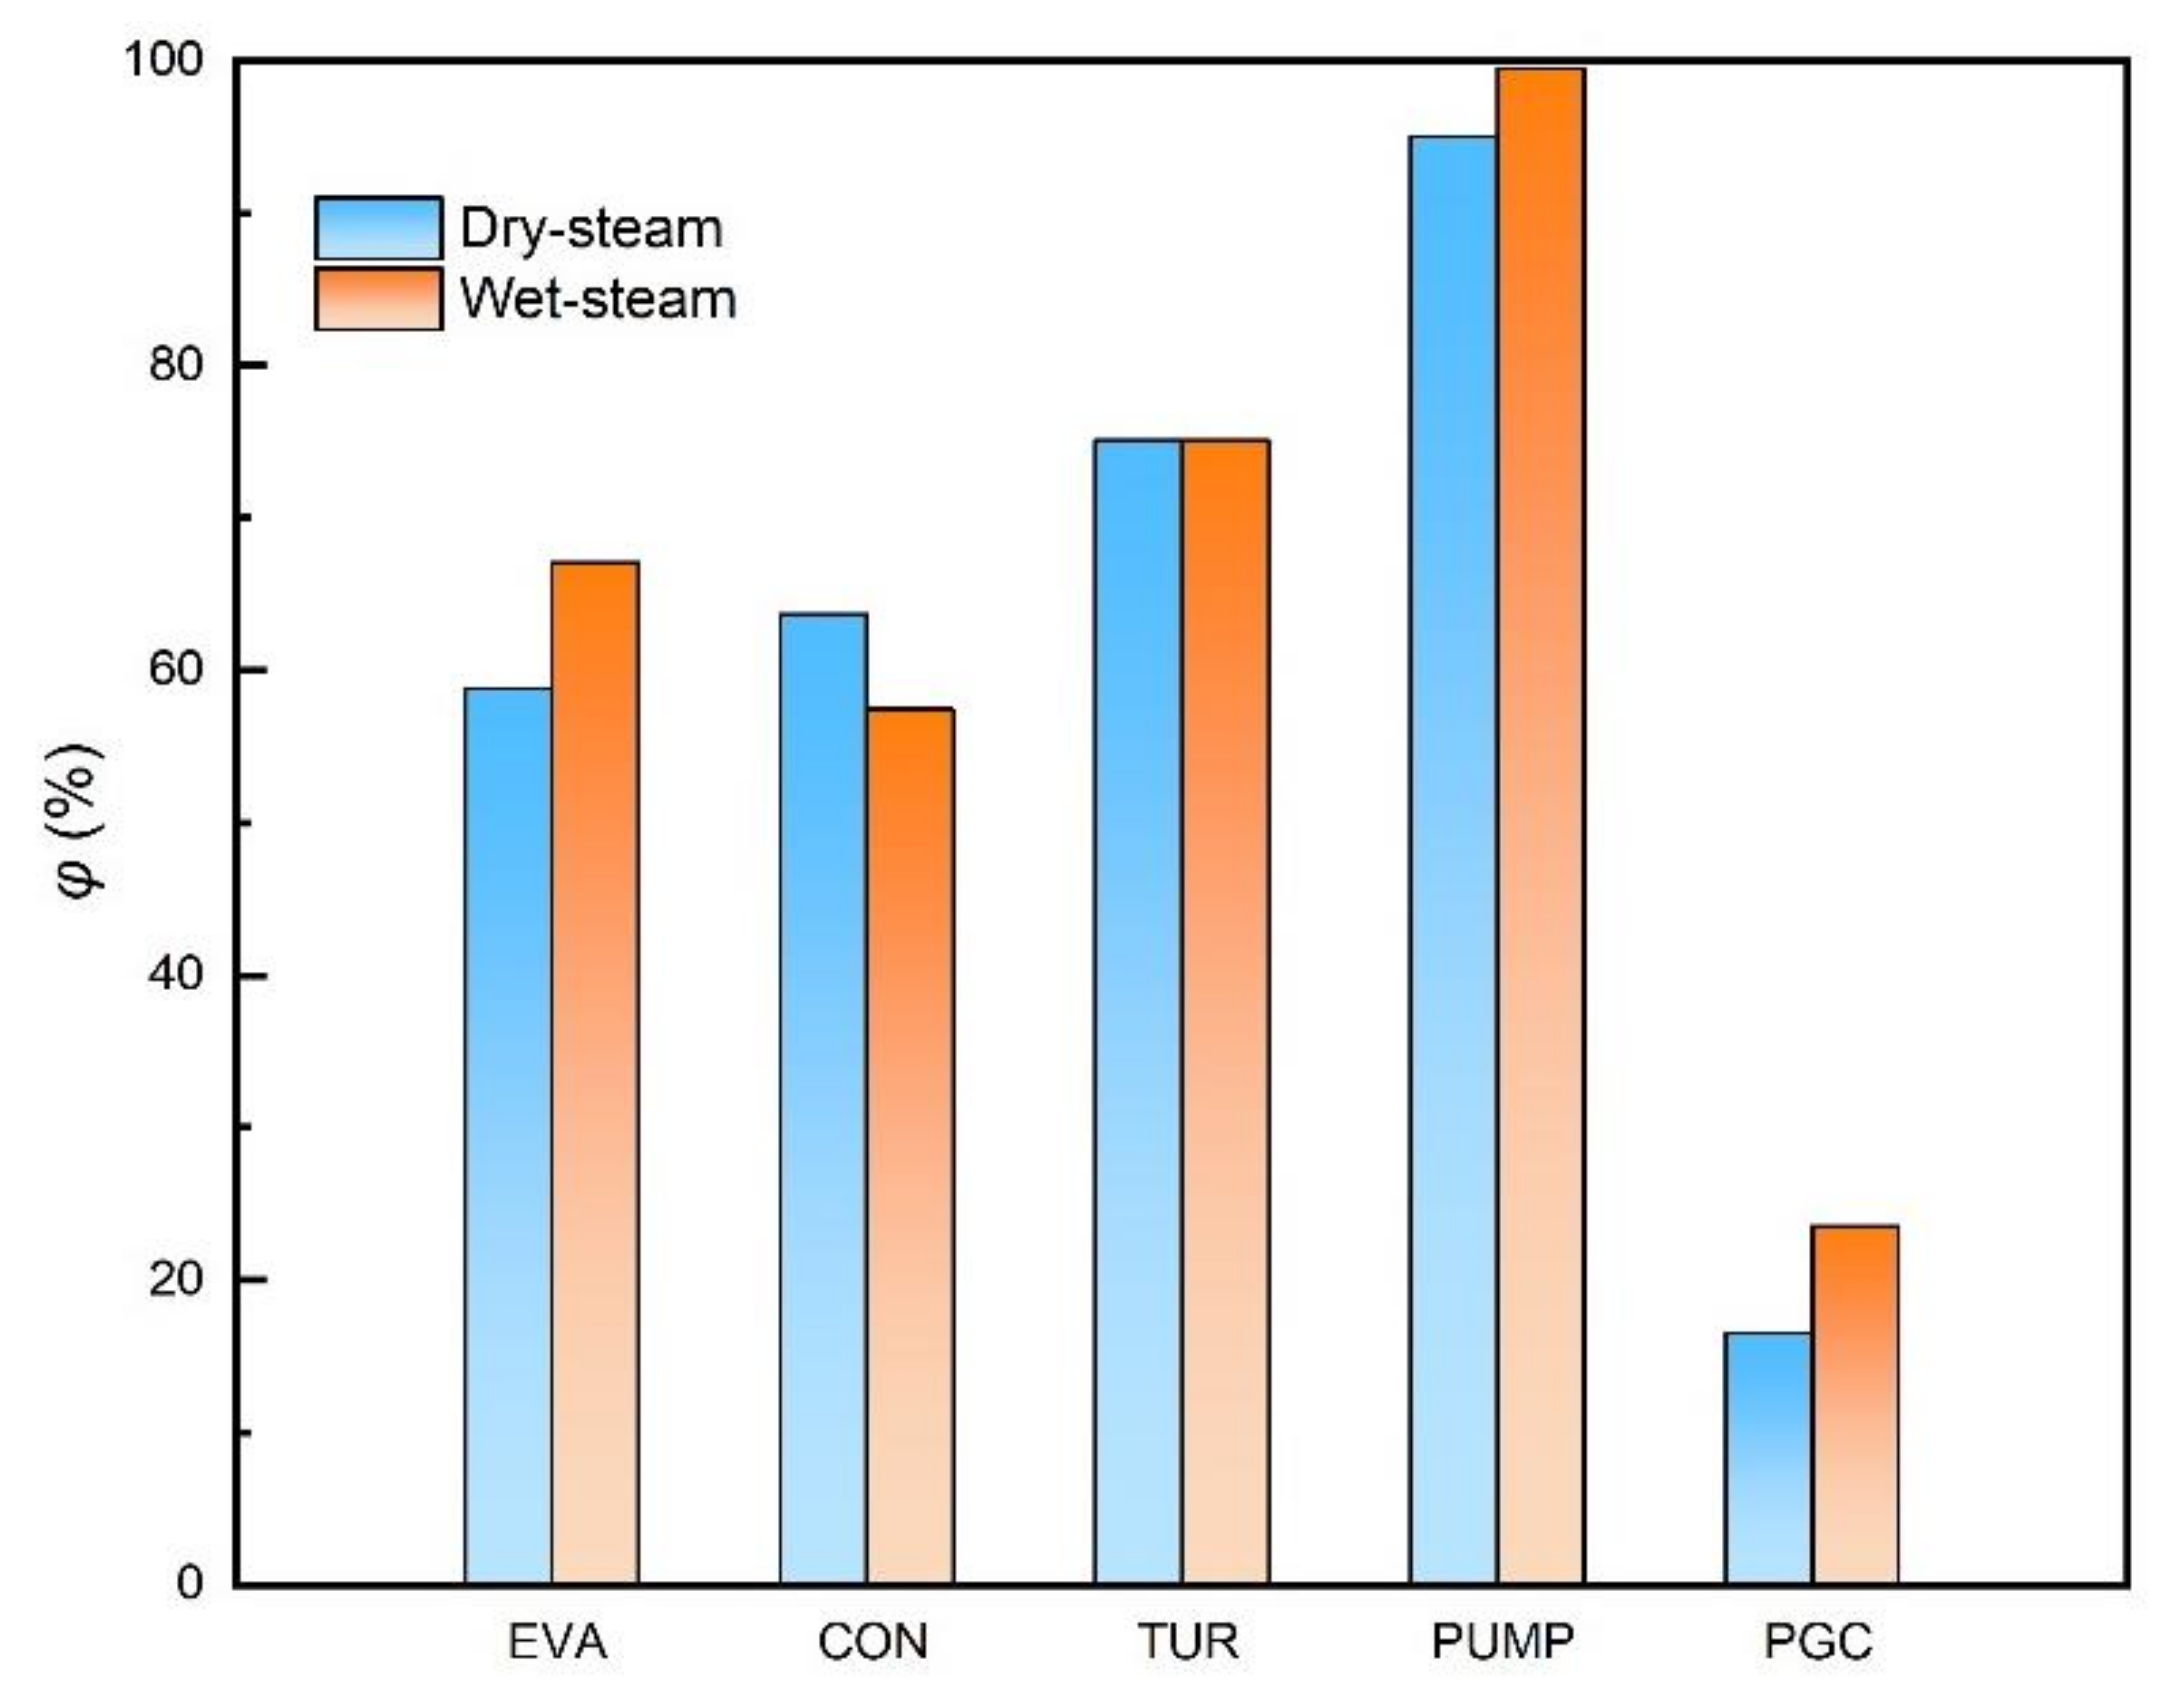
| Components | Exergy Destruction Rate (kW) | Exergy Destruction Ratio (%) | ||
|---|---|---|---|---|
| Dry Steam | Wet Steam | Dry Steam | Wet Steam | |
| Evaporator | 249.583 | 139.773 | 50.11 | 41.24 |
| Condenser | 81.357 | 65.201 | 16.34 | 19.24 |
| Turbine | 33.073 | 33.131 | 6.64 | 9.77 |
| WF pump | 2.656 | 2.682 | 0.53 | 0.79 |
| DCMD | 70.805 | 40.831 | 14.22 | 12.05 |
| Heat exchanger | 60.571 | 57.333 | 12.16 | 16.91 |
| Total | 498.045 | 338.952 | 100 | 100 |
| Regions | Electricity Price (USD/kWh) | Water Price (USD/m3) |
|---|---|---|
| Lamu (Kenya) | 0.224 | 0.78 |
| Hawaii (USA) | 0.275 | 2.23 |
| Tecoanapa (Mexico) | 0.192 | 0.7 |
| FernandodeNoronha (Brazil) | 0.179 | 1.2 |
| Manay (Philippine) | 0.199 | 0.365 |
| Chennai (India) | 0.084 | 0.14 |
| Kumejima (Japan) | 0.274 | 1.48 |
| Montego (Jamaica) | 0.295 | 0.36 |
| Subic (Fiji) | 0.135 | 0.253 |
| Kuta (Indonesia) | 0.108 | 0.157 |
| Rainbowbeach (Australia) | 0.246 | 1.98 |
| Semporna (Malasysia) | 0.06 | 0.29 |
| Ofu (Samoa) | 0.277 | 1.44 |
| Port-Gentil (Gabon) | 0.207 | 0.54 |
Publisher’s Note: MDPI stays neutral with regard to jurisdictional claims in published maps and institutional affiliations. |
© 2022 by the authors. Licensee MDPI, Basel, Switzerland. This article is an open access article distributed under the terms and conditions of the Creative Commons Attribution (CC BY) license (https://creativecommons.org/licenses/by/4.0/).
Share and Cite
Ma, Q.; Zheng, Y.; Lu, H.; Li, J.; Wang, S.; Wang, C.; Wu, Z.; Shen, Y.; Liu, X. A Novel Ocean Thermal Energy Driven System for Sustainable Power and Fresh Water Supply. Membranes 2022, 12, 160. https://doi.org/10.3390/membranes12020160
Ma Q, Zheng Y, Lu H, Li J, Wang S, Wang C, Wu Z, Shen Y, Liu X. A Novel Ocean Thermal Energy Driven System for Sustainable Power and Fresh Water Supply. Membranes. 2022; 12(2):160. https://doi.org/10.3390/membranes12020160
Chicago/Turabian StyleMa, Qingfen, Yun Zheng, Hui Lu, Jingru Li, Shenghui Wang, Chengpeng Wang, Zhongye Wu, Yijun Shen, and Xuejin Liu. 2022. "A Novel Ocean Thermal Energy Driven System for Sustainable Power and Fresh Water Supply" Membranes 12, no. 2: 160. https://doi.org/10.3390/membranes12020160
APA StyleMa, Q., Zheng, Y., Lu, H., Li, J., Wang, S., Wang, C., Wu, Z., Shen, Y., & Liu, X. (2022). A Novel Ocean Thermal Energy Driven System for Sustainable Power and Fresh Water Supply. Membranes, 12(2), 160. https://doi.org/10.3390/membranes12020160