Communication

High-Entropy Perovskites Pr1−xSrx(Cr,Mn,Fe,Co,Ni)O3−δ (x = 0–0.5): Synthesis and Oxygen Permeation Properties

Institute of Physical Chemistry and Electrochemistry, Leibniz University Hannover, Callinstr. 3A, 30167 Hannover, Germany
*
Authors to whom correspondence should be addressed.
Membranes 2022, 12(11), 1123; https://doi.org/10.3390/membranes12111123
Submission received: 27 September 2022 / Revised: 4 November 2022 / Accepted: 7 November 2022 / Published: 9 November 2022

Abstract

:
High-entropy perovskite oxides have already been studied in various fields owing to their high-entropy-induced properties. Partial substitution of an element by a lower valence element usually improves the oxygen permeability of perovskite oxides, but high substitution amounts may lead to structural instability. In this work, pure high-entropy perovskites Pr 1 x Srx(Cr,Mn,Fe,Co,Ni)O 3 δ with high amounts Sr up to x = 0.5 were synthesized via a sol–gel method. Several characterization methods prove that the solubility of Sr increases with higher temperatures of the heating treatment. The ceramic with x = 0.5 shows a transition from semi-conductive to metallic behavior when the temperature reaches 873 K. Its oxygen flux is comparable to the low-entropy counterpart La0.6Sr0.4Co0.5Fe0.5O 3 δ . A stable run of ca. 46.2 h was documented for oxygen permeation under an air/CO2 gradient.

1. Introduction

Since the discovery of single-phase alloys with five equiatomic components in 2004 [1], high-entropy materials have been attracting increasing research interest due to their high-entropy-induced properties, e.g., the tendency to form single phases and great tolerance to lattice distortion [2,3,4,5]. The extension of high-entropy materials is, therefore, continuously expanded. To date, many new systems have been developed, such as high-entropy oxides [6,7,8,9], high-entropy carbides [10,11], and high-entropy metal–organic frameworks [12]. As for perovskites with the general formula ABO3, both the MIIA(TM)O3 family and the RE(TM)O3 family can be crystallized to single phase [2,8,9,13,14,15,16], where MIIA and RE are metals of group IIA and rare earth metals on the A-site, and TM stands for transition metals on the B-site.
The effects of high entropy on the performance of perovskites can be summarized in three points. First, due to the probable stabilization effect of high-entropy, perovskites can have enhanced temperature and chemical stability. As an electrode material for solid oxide fuel cells, (La,Nd,Sm,Ca,Sr)MnO3 is stable at 1473 K for at least 100 h and has a higher chemical compatibility with the electrolyte 8YSZ (8 mol% Y2O3 stabilized ZrO2) compared to the low-entropy relatives La 1 x SrxMnO 3 δ [13]. Second, chemical disorder and lattice distortion can be induced by high entropy, resulting in extra phonon disorder and thus leading to low thermal conductivity and better thermoelectric performance [14,17]. Third, more elements can be packed into pure perovskites, rendering the synergetic effect of cations and improving the catalytic activities of La0.6Sr0.4(Co,Fe,Mn,Ni,Mg)O3 in oxygen evolution reactions [15], Pb(Ni,W,Mn,Nb,Zr,Ti)O3 in oxygen reduction reactions [18], and La(Co,Fe,Mn,Ni,Mg)O3 in CO oxidation reactions [19].
Although high-entropy perovskites have already been studied in various fields such as proton conducting materials [16,20], electrode materials in solid oxide fuel cells [13,21], thermoelectric materials [14,17], and catalysts [15,18,19], publications about mixed ionic–electronic conductors (MIECs) is rather rare. Wang et al. [22] have found that the A-site and B-site co-doped Ba0.5Sr0.5Co0.8Fe0.2O 3 δ (BSCF) ceramic Ca0.1La0.02Gd0.02Bi0.02Ba0.42Sr0.42Co0.736Fe0.184Zr0.02Ni0.02Cu0.02Al0.02O 3 δ exhibits improved stability of the perovskite structure and the oxygen permeation in the intermediate temperature range due to a stabilization effect caused by its increased mixed entropy. The oxygen permeation of the other type of high-entropy perovskite RE(TM)O3, however, is not reported despite its corresponding low-entropy relatives having been extensively studied as oxygen-transporting materials [23,24,25].
The partial substitution of A-site element by group IIA metals (e.g., Sr) is a commonly used strategy to boost the oxygen permeability in the field of oxygen-transporting materials, since it introduces additional ionic charge carriers (i.e., mobile oxygen vacancies) upon high substitution amount [21,26,27]. In addition, the electrical conductivity can also be enhanced by partial substitution due to the 3 d TM - 2 p O orbital overlapping and the change of oxidation state of the TM elements on B-site [21,26,27,28]. However, introducing those elements usually escalates the lattice distortion and leads to structural instability. Dąbrowa et al. [21,29] have found that the solubility of strontium is limited in RE(Cr,Mn,Fe,Co,Ni)O 3 δ , being 0.3 for RE = La and 0.1 for RE = Pr. Secondary phases, e.g., Sr(CO3)2 or SrCrO4, are found when the limit is exceeded. As a comparison, common Sr-doped perovskite oxides, e.g., Pr 1 x Srx(Co0.5Fe0.5)O 3 δ , can remain single phase even if x = 0.4 [26,30,31,32,33,34]. This is somehow inconsistent with the high-entropy stabilization effect, which is believed that high mixed entropy Δ S mix leads to a negative Gibbs free energy Δ G mix when T Δ S mix > Δ H mix as indicated by the following equations (in ideal solid solutions) [4,9]:
Δ G mix = Δ H mix T Δ S mix
Δ S mix = R a = 1 n x ln x A - site + b = 1 n y ln y B - site + 3 c = 1 n z ln z O - site
where R is the gas constant, and x, y, and z are the mole fraction of elements on A-, B-, and O-sites, respectively. According to Equation (2), Pr0.6Sr0.4(Co0.5Fe0.5)O 3 δ has a lower mixed entropy of 1.37R compared to Pr0.9Sr0.1(Cr,Mn,Fe,Co,Ni)O 3 δ and Pr0.5Sr0.5(Cr,Mn,Fe,Co,Ni)O 3 δ , where the values are 1.93R and 2.30R, respectively.
In this work, as an example of doped RE(TM)O3 family, a group of single-phase high-entropy perovskites Pr 1 x Srx(Cr,Mn,Fe,Co,Ni)O 3 δ ( x = 0–0.5) is synthesized via a sol–gel method with subsequent heating treatments. The influence of Sr content on the electrical conductivity and the oxygen permeability is presented.

2. Materials and Methods

2.1. Material Synthesis

The chemical formulae of high-entropy perovskite oxides reported in this work are written as Pr 1 x Srx(Cr,Mn,Fe,Co,Ni)O 3 δ ( x = 0–0.5) as recommended by the International Union of Pure and Applied Chemistry [35]. The nominal amounts of B-site elements are equal, i.e., all have a stoichiometric number of 0.2. The powders were synthesized by adapting a previously reported sol–gel method [36] using stoichiometric amounts of metal nitrates, ethylene-diamine-tetraacetic acid, and citric acid in a molar ratio of 1:1:2. Reactants were purchased from Alfa Aesar and used without further purification. Except for powders studied in phase analysis (Section 3.1), all powders were calcined at 1423 K for 10 h, following by tableting at 300 MPa for 0.25 h and sintering at 1673 K for 10 h (with natural cooling, see Figure A2).

2.2. Structural Characterization

The phase purity and crystal structure of products were investigated by X-ray diffraction (XRD) using a diffractometer (D8 Advance, Bruker AXS GmbH) with Cu-Kα radiation (40 kV and 40 mA, λ = 0.154 nm) and a step size of 0.01° in the 2 θ range from 10° to 85°. Rietveld refinements of XRD patterns were performed on the software TOPAS (Version 6, Bruker AXS GmbH). PrCrO3 ( P n m a , ICSD 251098) and SrCrO4 ( P 2 1 / n , ICSD 40922) were used as starting structures. The elemental composition and microstructure of membranes were examined by two field-emission scanning electron microscopes (FE-SEM): JEOL JSM-6700F equipped with an energy-dispersive X-ray spectrometer (EDXS, Oxford Instruments INCA-300) and JEOL JSM-7610FPlus with twin EDXS (Bruker XFlash 6|60). Before measurements, the cross-sections of membranes were vibratory-polished by VibroMet (Buehler). The backscattered electron channeling contrast images were captured at an acceleration voltage of 15 kV.

2.3. Electrical Conductivity Measurements

The sintered membranes were cut into bars with a conductive area of 2 mm2 and a length of 10 mm. The sample was fixed between two platinum plates, which were connected to a sweep/function generator (1 Hz square waveform, Wavetek Model 180) and digital multimeters (KEITHLEY 2100, Keithly Instruments) by platinum wires. The measurement cell was heated to 1223 K in a horizontal tube furnace (Carbolite Gero EVZ 12/450N) and the data were recorded by using the software LabVIEW 2015 (Version 15.0.0) at equilibrium conditions during the cooling process.

2.4. Oxygen Permeation Measurements

The oxygen permeabilities of sintered membranes were characterized from 1023 K to 1223 K by a home-made high-temperature permeation cell, which is described in detail elsewhere [32]. Before mounting the samples, membranes were polished to 1 mm thick by using 1200-grit sandpaper and washed with ethanol. The sample was then sealed on an alumina tube with a commercial ceramic sealant (Huitian 2767). Synthetic air (20 vol.% O2 and 80 vol.% N2) was used at a rate of 150 mL/min on the feed side of the sample, while on the sweep side, 1 mL/min of Ne and 29 mL/min of He were used. The flow rates were regulated by mass flow controllers (EL-Flow®, Bronkhorst, AK Ruurlo, The Netherlands) in normal conditions (273.15 K, 101325 Pa). The concentration of the effluent was analyzed by an on-line gas chromatograph (Agilent 7890A) equipped with a Carboxen® 1000 column (Merck, Darmstadt, Germany) and a thermal conductivity detector. Due to imperfect sealing, a small amount of N2 was also detected in the effluent and the leakage of oxygen was subtracted in the calculation of the oxygen permeation flux [37].

3. Results and Discussion

3.1. Phase Analysis of Powders

The XRD patterns of Pr 1 x Srx(Cr,Mn,Fe,Co,Ni)O 3 δ ( x = 
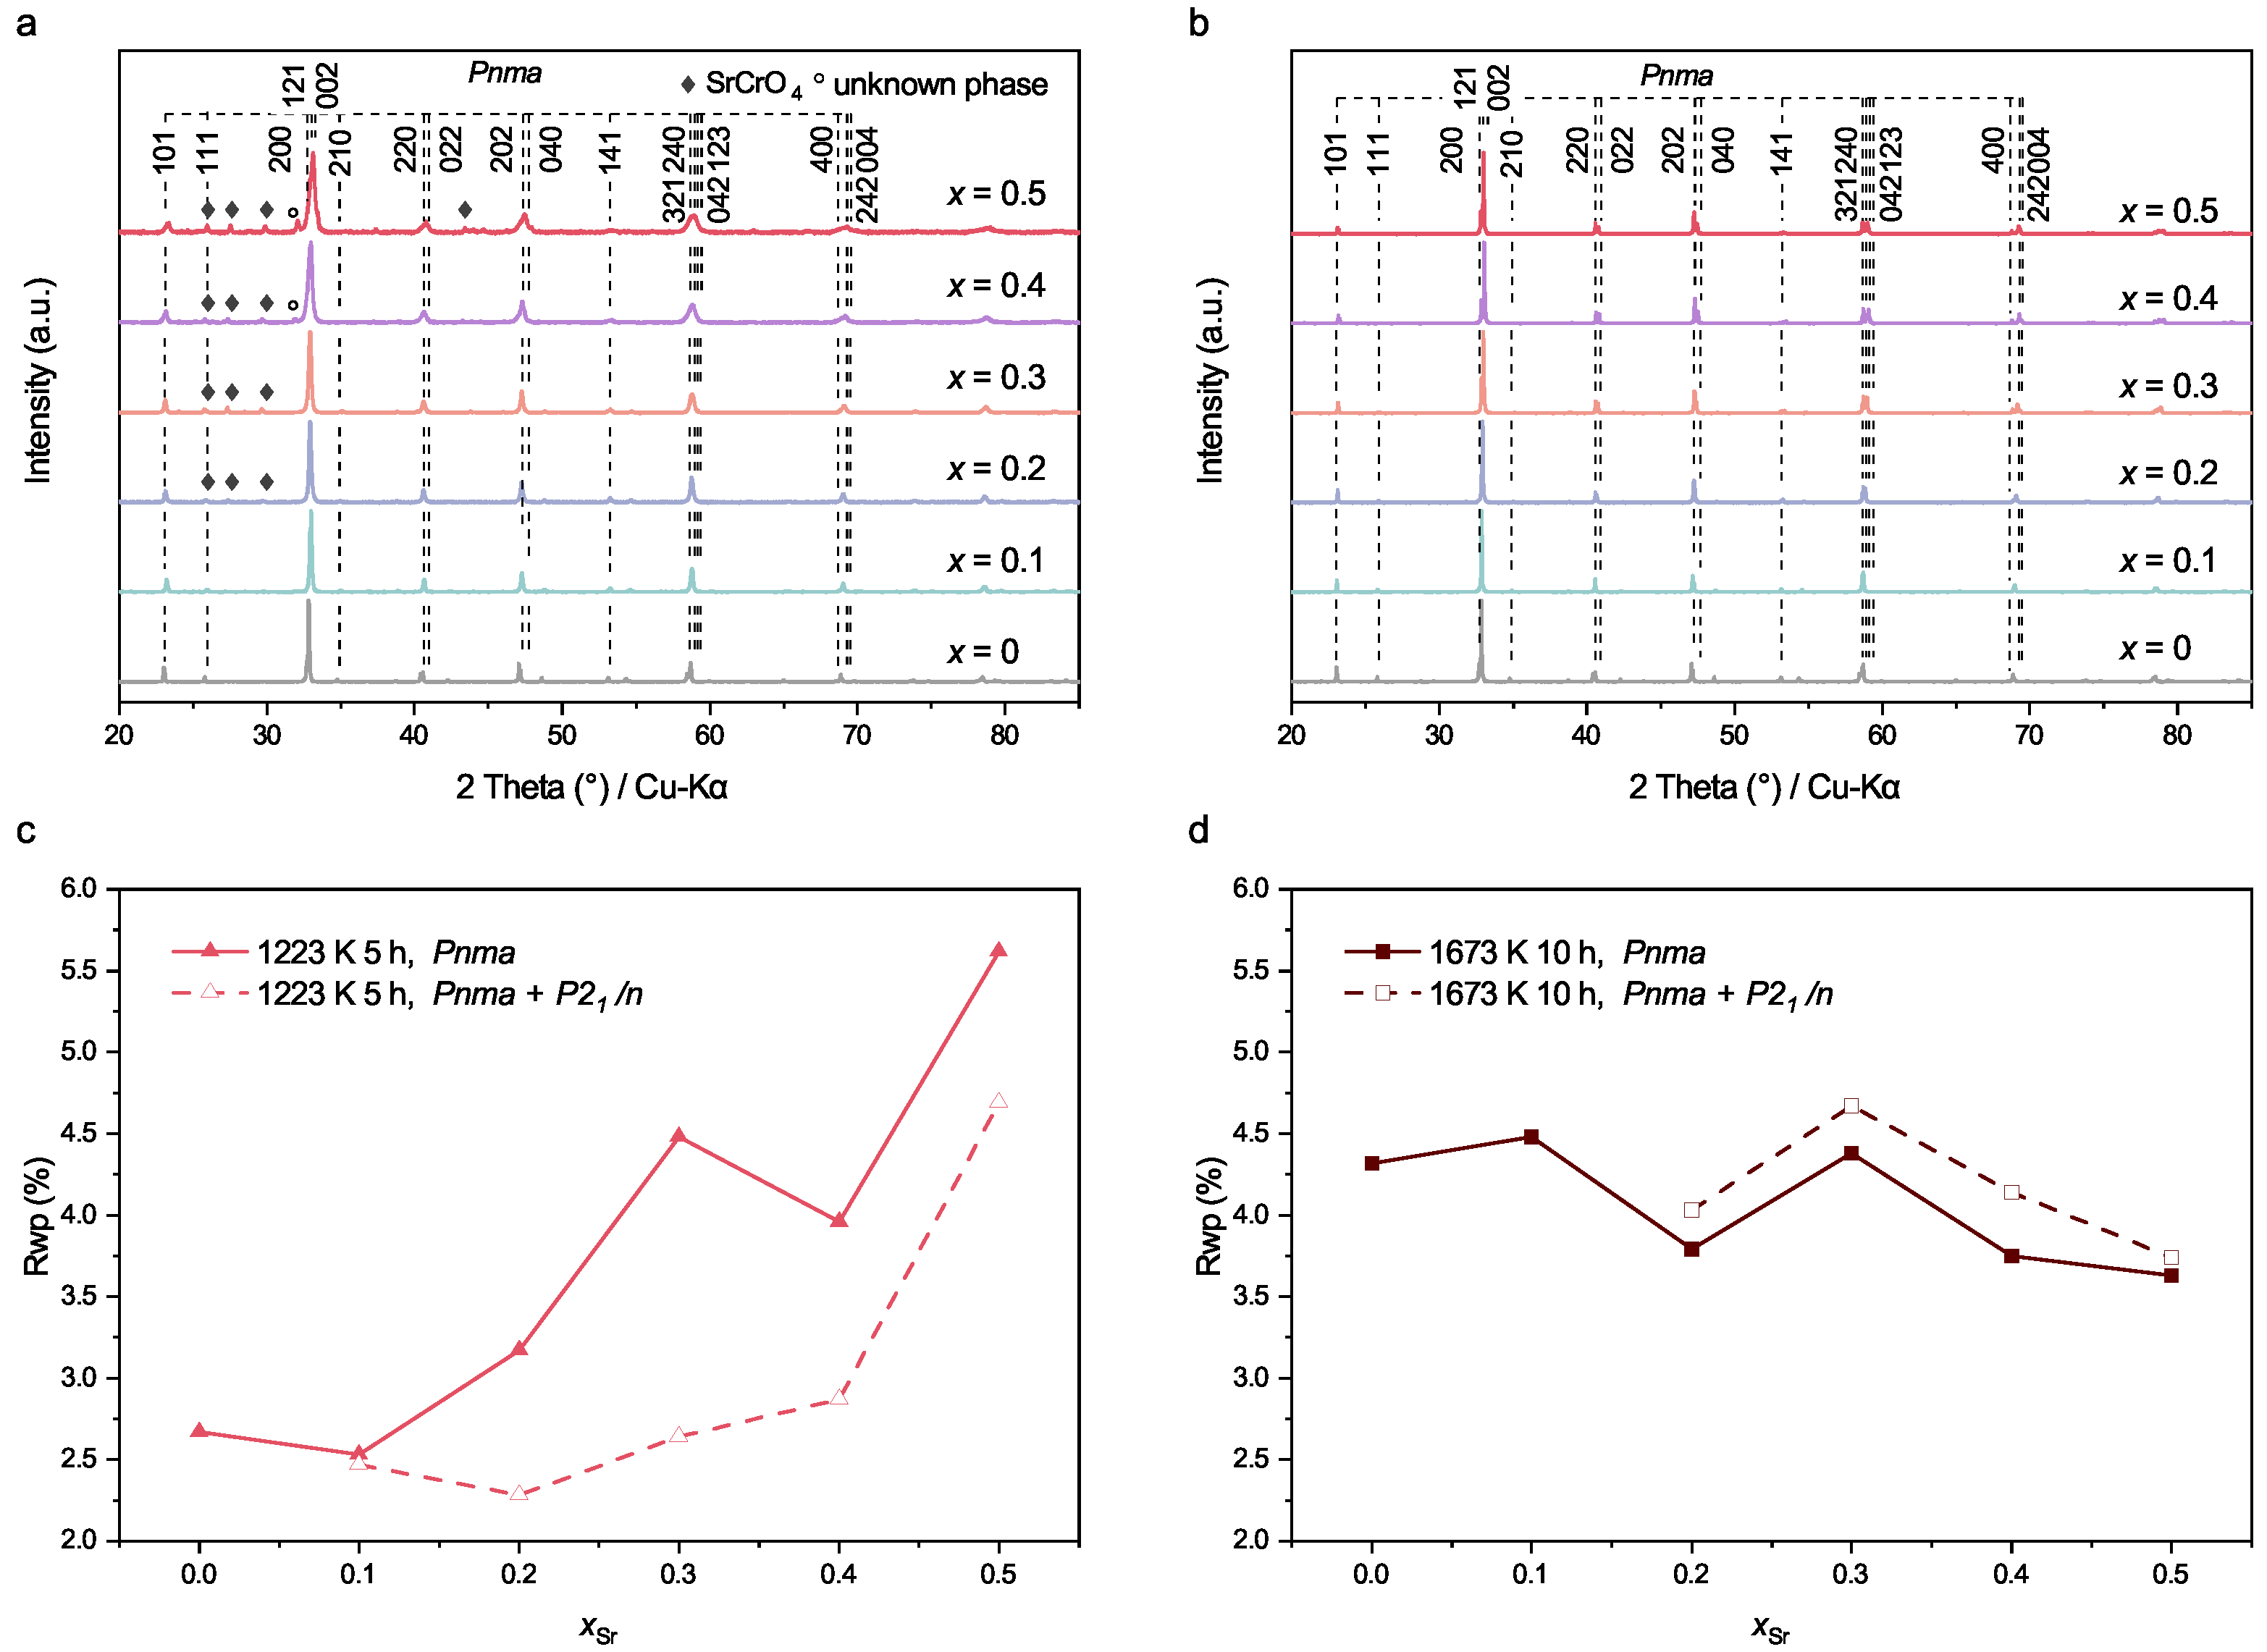
0–0.5) powders calcined at 1223 K and 1673 K are shown in Figure 1a,b. Details of Rietveld refinement are listed in Table A3. After calcinating at 1223 K, all powders have an orthorhombic perovskite structure ( P n m a ). The reflections of SrCrO4 become noticeable along with an increasing x. For the powder with x = 0.1 , the solely visible reflection of SrCrO4 overlaps with the 111 reflection of the perovskite. Nevertheless, as shown in Figure 1c, a comparison between one-phase Rietveld refinement (PrCrO3 as starting structure) and two-phase Rietveld refinement (PrCrO3 and SrCrO4 as starting structures) leads to the conclusion that the powder with x = 0.1 also has SrCrO4 as a secondary phase. This finding, although in good agreement with the work of Dąbrowa et al. [29], seems to be somehow contrary to the commonly understood high-entropy effect, namely that a single-phase solid solution tends to be formed when Δ S mix higher than 1.5R [2,4,38]. Note that Δ S mix increases as the x value increases from 0 to 0.5 (see Table A2).
In view of the Goldschmidt tolerance factor t, mixed entropy Δ S mix , size difference of A-site cations Δ ( R A ) , and size difference of B-site cations Δ ( R B ) , the powders with x from 0 to 0.5 should be pure phase, as shown in Table A2:
  • All the t factors are greater than 0.75 and become closer to 1 when x approaches 0.5, suggesting that a stable perovskite structure can be obtained [39].
  • The Δ S mix increases from 1.61R for x = 0 to 2.30R for x = 0.5 as calculated by using Equation (2). Larger mixed entropy should indicate a more stable structure and thus pure phase upon substitution [2,4,38].
  • The Δ ( R A ) and Δ ( R B ) are smaller than 6.5%, which means it is possible to form single-phase high-entropy perovskite [8,13,40].
Note that although Δ ( R A ) is smaller than 6.5%, it does increase along with the greater x due to the different ionic radii of Pr3+ and Sr2+ (see Table A1). The formation of the secondary phase may be correlated to the relatively large Δ ( R A ) .
Figure 1. Room-temperature XRD patterns of Pr 1 x Srx(Cr,Mn,Fe,Co,Ni)O 3 δ ( x = 0–0.5) powders calcined at (a) 1223 K and (b) 1673 K. Reflections of the main phase were indexed according to the results of Rietveld refinement using PrCrO3 (ICSD 251098) as the starting structure. The diamond symbols denote Bragg positions of SrCrO4 (ICSD 40922). Results of Rietveld refinements of corresponding powders calcined at 1223 K and 1673 K. The solid lines present the Rwp factors of refinements using PrCrO3 ( P n m a , ICSD 251098) as the starting structure, while the dashed lines draw the Rwp factors of refinements using PrCrO3 ( P n m a , ICSD 251098) and SrCrO4 ( P 2 1 / n , ICSD 40922) as the starting structures.
Membranes 12 01123 g001
However, when a higher calcination temperature of 1673 K is used, the powders are still pure phase even with a large amount of Sr (i.e., x = 0.5 ), as proven by the XRD patterns in Figure 1b and the corresponding Rietveld refinements in Figure 1d and Figure A1. As shown in Table A3, the powders are considered as pure phase when treated after 1223 K for x = 0 , 1423 K for x [ 0 , 0.1 ] , and 1673 K for x [ 0 , 0.5 ] . For the calcination temperature of 1223 K, only the sample with x = 0 has Rwp and GOF factors from one-phase refinements that are smaller than those from two-phase refinements. For the calcination temperature of 1423 K and x [ 0 , 0.1 ] , the Rwp and GOF factors from one-phase refinements are smaller than those from two-phase refinements. For the calcination temperature of 1673 K, all the Rwp and GOF factors from one-phase refinements are smaller than those from two-phase refinements. It seems that a high temperature is beneficial to maintain the perovskite structure and thus increase the strontium solubility. A higher temperature results in greater T Δ S mix , and thus a more negative Δ G mix according to Equation (1), which can compensate the effect of large Δ ( R A ) and ensure the formation of the pure phase.
Since all the powders are pure phase and have an orthorhombic P n m a structure, the quasi-cubic lattice parameter a 0 , which is calculated assuming the unit cell of the orthorhombic system is four times larger than the corresponding cubic system (i.e., a × b × c = 2 a 0 × 2 a 0 × 2 a 0 ), is used to probe the influence of Sr content. The lattice parameters of the orthorhombic system can be found in Table A3. A sharp decrease in a 0 can be clearly seen from x = 0 to x = 0.3 (Figure 2), while this trend slows down for x = 0.4 and x = 0.5 . The shrinkage of a 0 along with increasing Sr content, i.e., partial substitution of Pr3+ by Sr2+, indicates that charge compensation mechanism contributes more upon substitution, rather than the formation of oxygen vacancy [21]. Additionally, with more Sr in the composition, i.e., x [ 0.4 , 0.5 ] , the impact of oxygen vacancy growths and thus endows the unit cell the ability to expand, so that the decreasing trend of the lattice parameters becomes slower. The relationship between a 0 and x gives a hint that Sr enters the unit cell of Pr 1 x Srx(Cr,Mn,Fe,Co,Ni)O 3 δ , rather than evaporating during heating treatment. A more precise analysis is presented in Section 3.2. The influence of Sr content on the electrical conductivity and oxygen permeability will be discussed in Section 3.3 and Section 3.4.
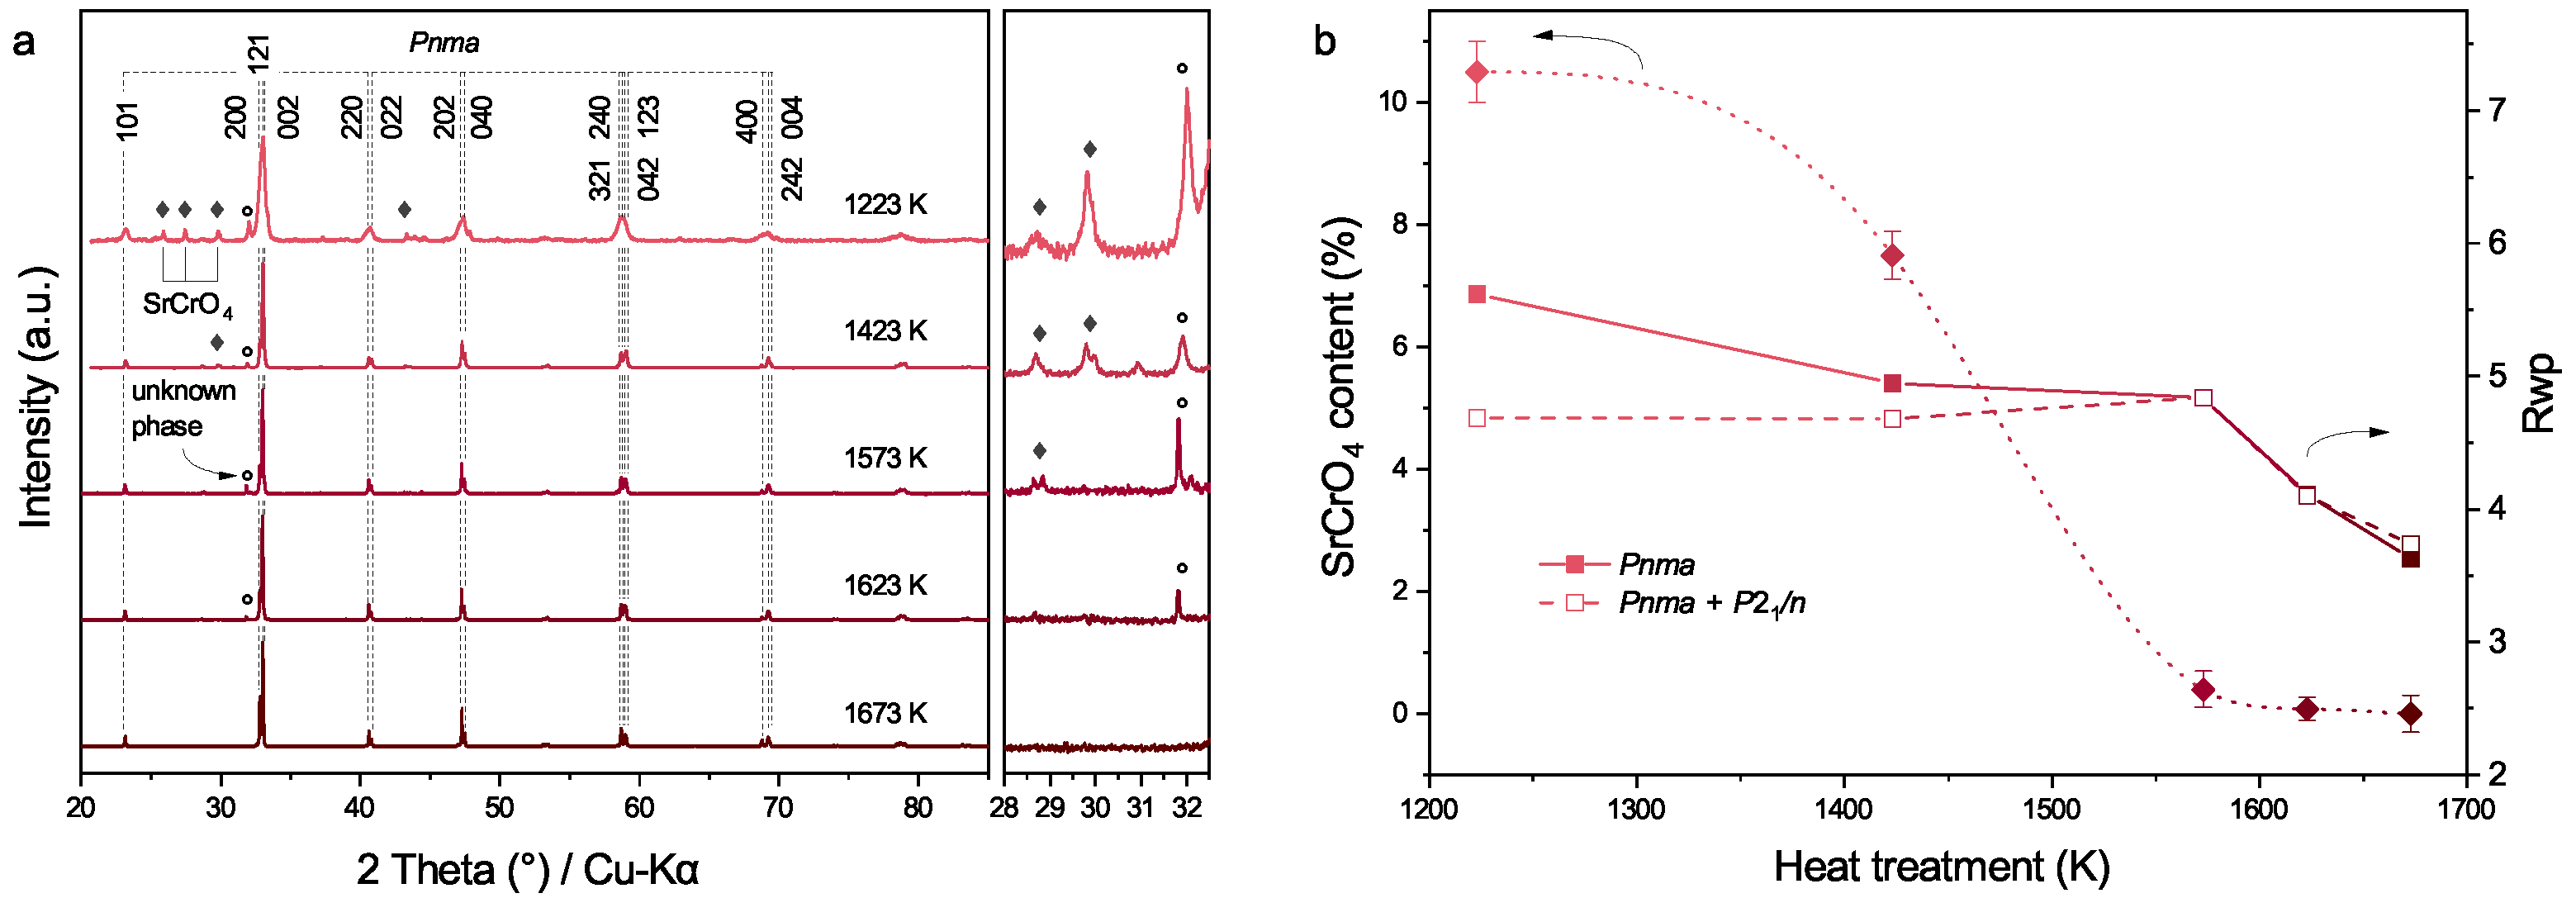
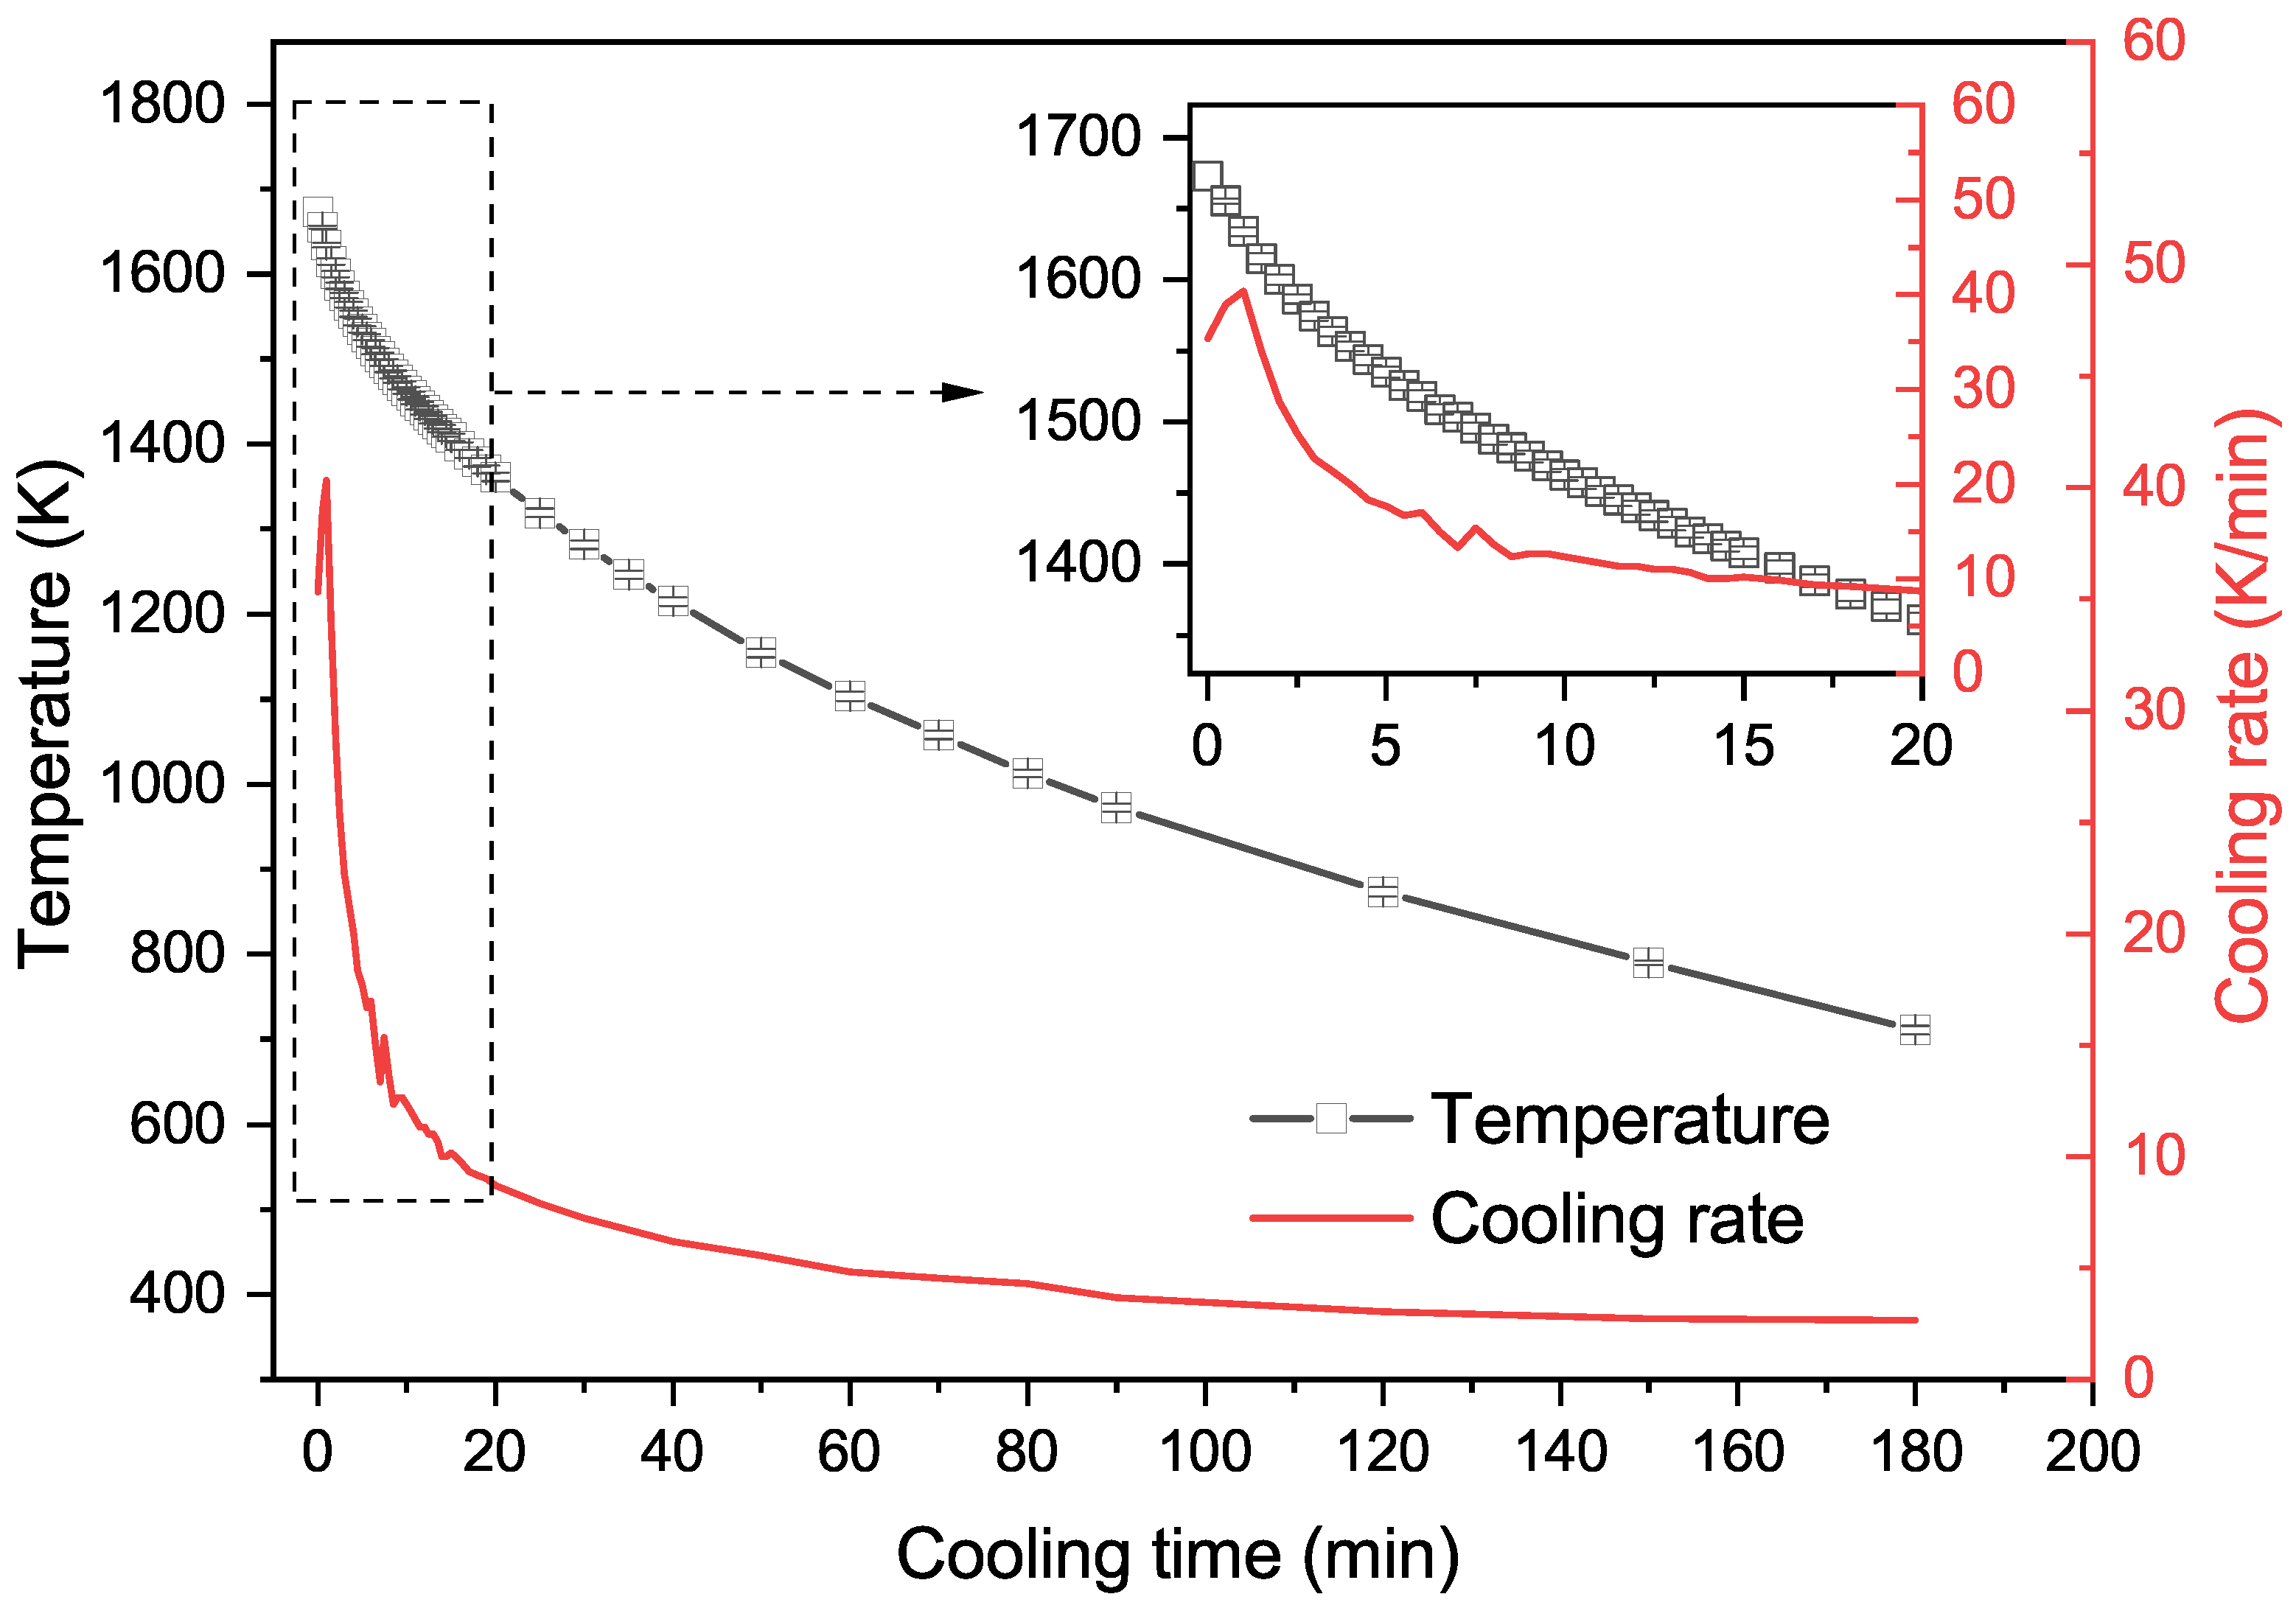
To further investigate the influence of heating temperatures on the Sr solubility, uncalcined Pr0.5Sr0.5(Cr,Mn,Fe,Co,Ni)O 3 δ were divided into five portions and treated at temperatures from 1223 K to 1673 K followed by natural cooling. The results are visualized in Figure 3 and the cooling rate can be found in Figure A2. After cooling down to room temperature from 1223 K, reflections from SrCrO4 and an unknown phase are present between the 101 and 200 reflections of the perovskite phase (Figure 3a). The reflections of SrCrO4 and the unknown phase disappear after heating at 1623 K. The Rwp values of the Rietveld refinements in Figure 3b also indicate that after heating at 1673 K, one-phase refinement ( P n m a ) fits better than two-phase refinement ( P n m a + P 2 1 / n ). The content of SrCrO4 in powders decreases from 10.5% to 0% (under the detection limit of XRD) as the heating temperature varies from 1223 K to 1673 K.
Interestingly, increasing the treatment temperature to 1673 K did not bring about a pure phase for the Sr amount of x = 0.7 , as shown by the XRD pattern in Figure A3. Moreover, the surface and cross-section of the x = 0.7 membranes were porous after sintering (Figure A6), which is not qualified as oxygen separation membranes. According to Equation (2), the mixed entropy Δ S mix increases with x from 0 to 0.5 and decreases with x from 0.5 to 1. Since Sr2+ has the largest ionic radius among Pr 1 x Srx(Cr,Mn,Fe,Co,Ni)O 3 δ and it reacts readily with Cr [21], we speculate that during the sintering process (1673 K for 10 h), Pr0.3Sr0.7(Cr,Mn,Fe,Co,Ni)O 3 δ is not stable and tends to release Sr to maximize Δ S mix . In other words, when the doping ratio of Sr exceeds 0.5, the system has a tendency to decrease the amount of Sr, letting the amount of Sr equals the amount of Pr; the released Sr may react with Cr, forming SrCrO4.

3.2. Characterization of Membranes

In Section 3.1, we have proved that the pure phase of Pr 1 x Srx(Cr,Mn,Fe,Co,Ni)O 3 δ with 
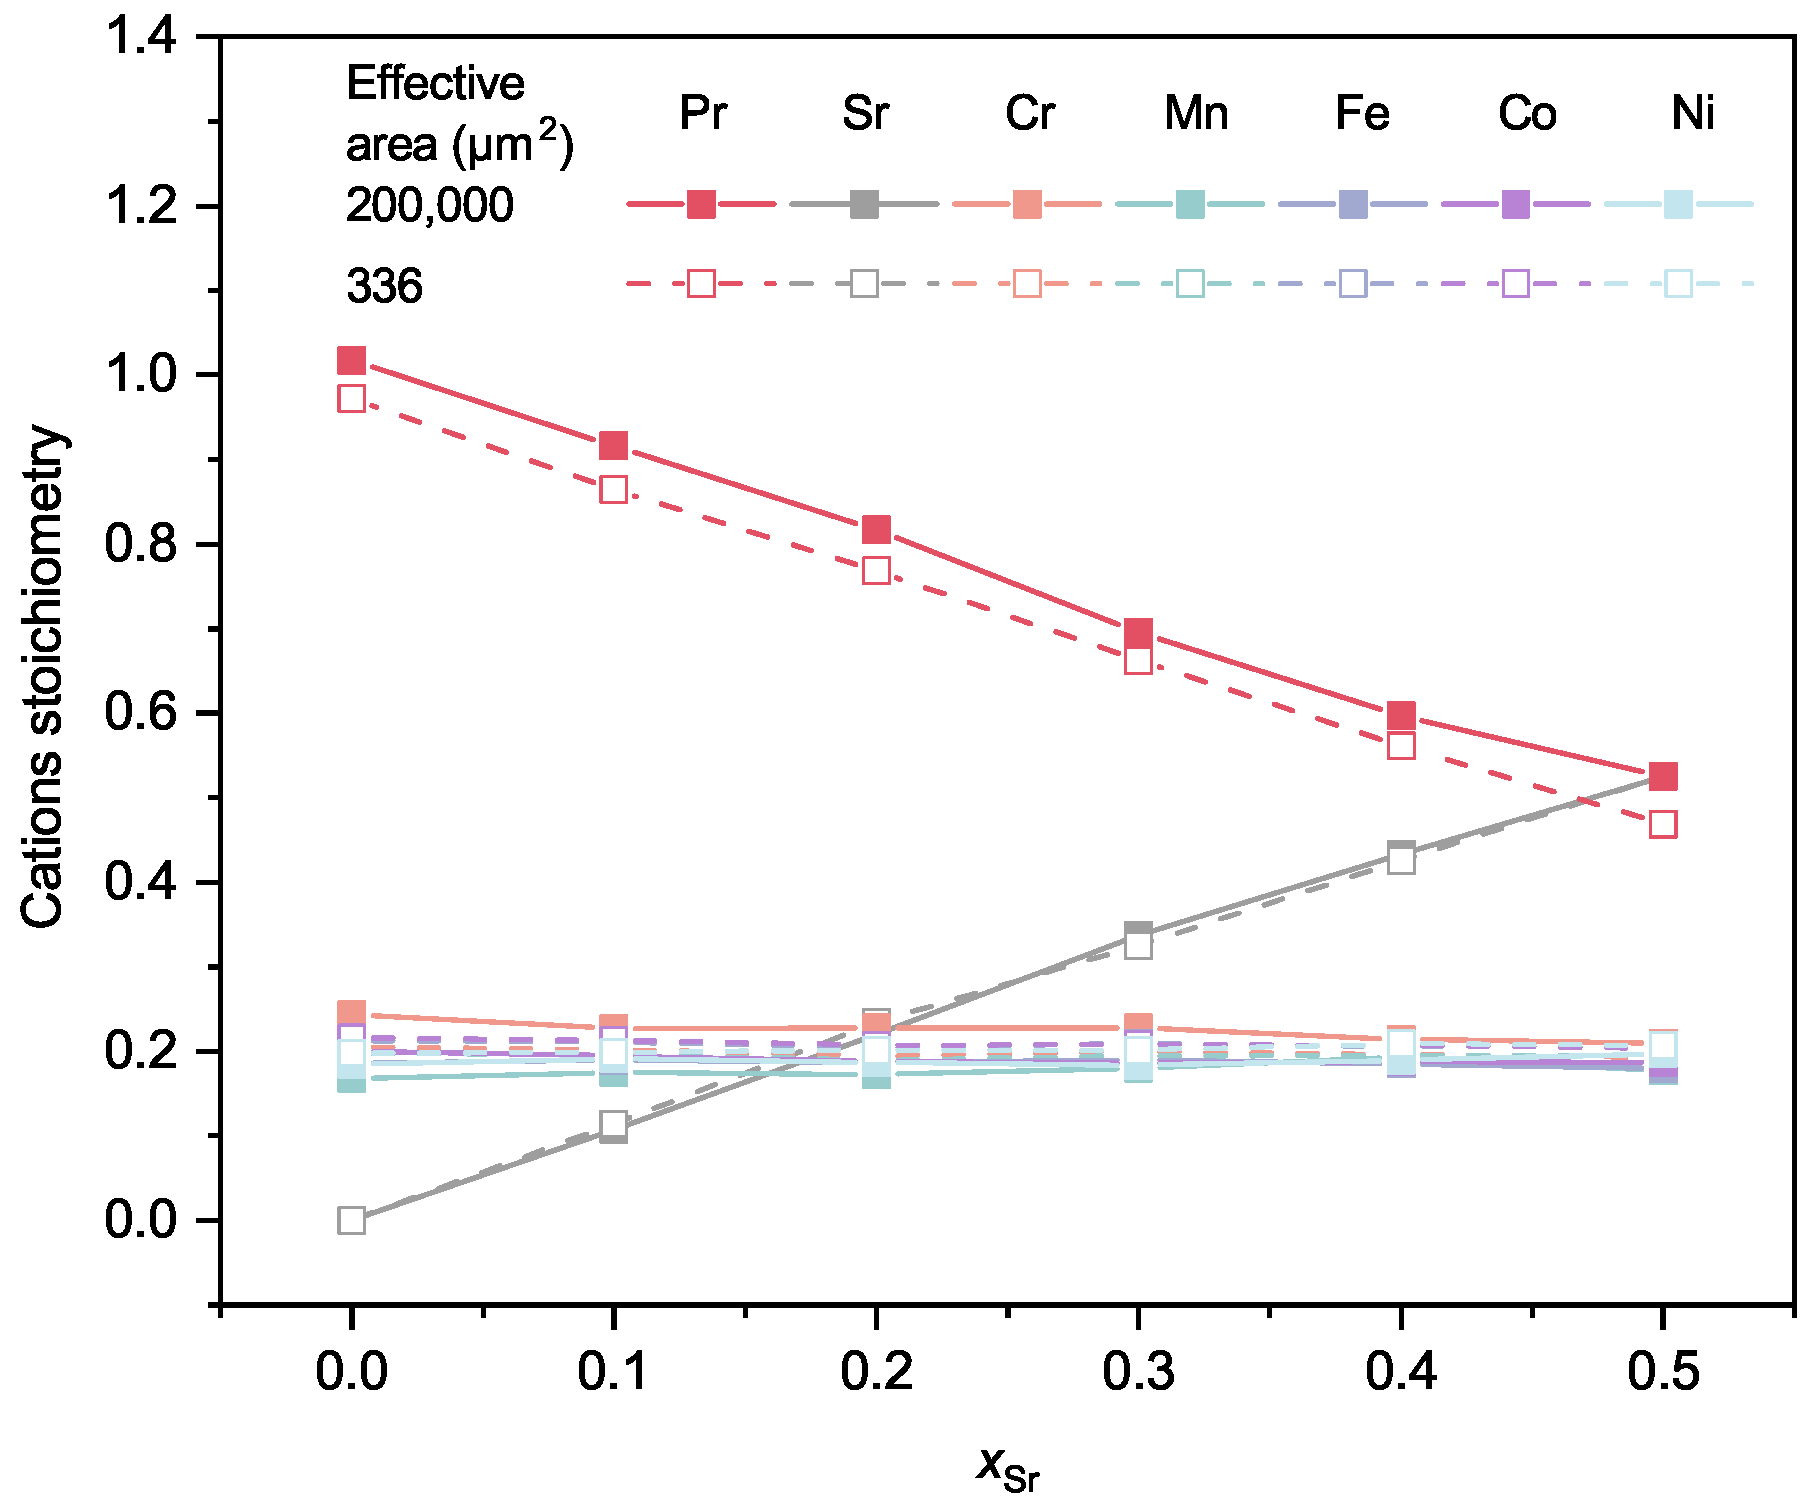
x ranging from 0 to 0.5 can be obtained after heating at 1673 K. The powders were then tableted and sintered at 1673 K for 10 h to prepare membranes. The vibratory-polished cross-sections of membranes were investigated by EDXS and SEM to gain insights into the content and distribution of elements in addition to the microstructure of membranes. The average compositions of the membranes are listed in Table A4 and Table A5, while the stoichiometry of the cations is illustrated in Figure 4. It is quite interesting that for both measurement areas of 200,000 µm2 and 336 µm2 the calculated stoichiometry matches well with the desired chemical formulae. The sum of Pr and Sr is about 1 and the other cations are all circling around 0.2. This finding suggests that during the calcination and sintering processes, there is no loss of elements, at least not of a single element.
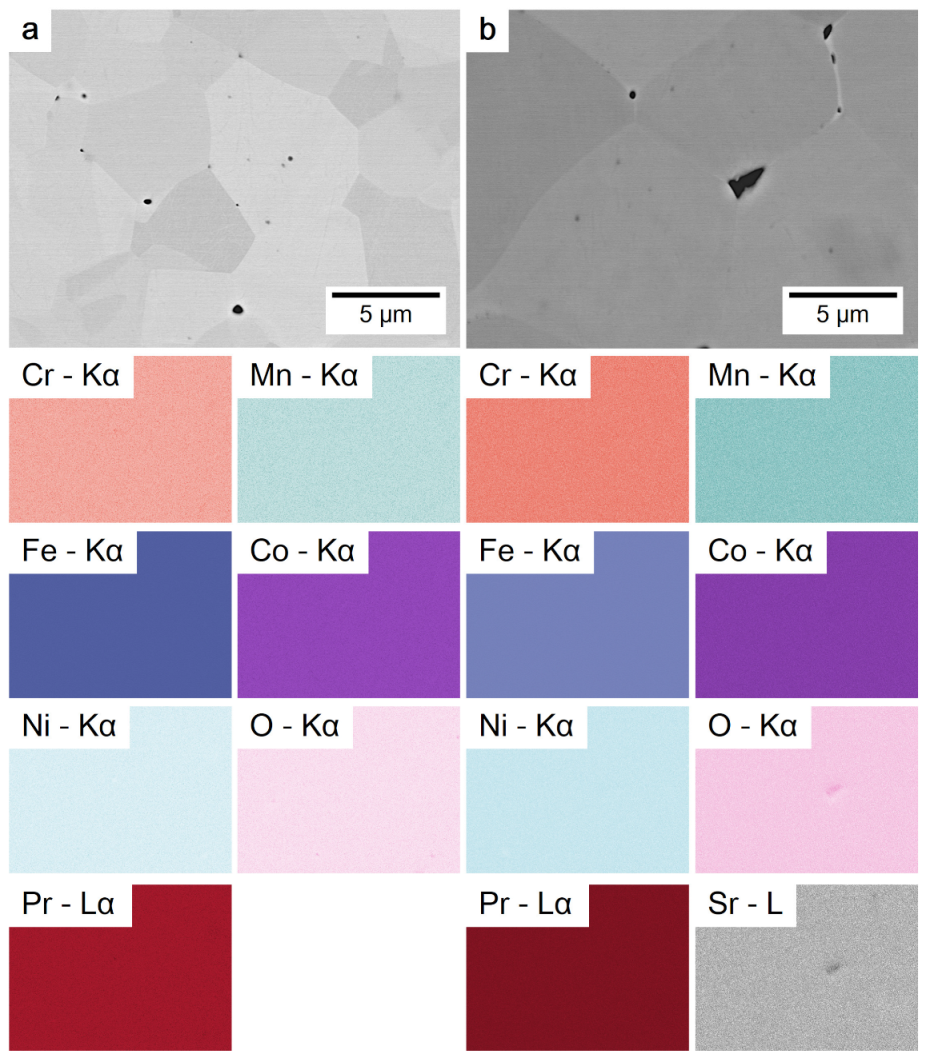
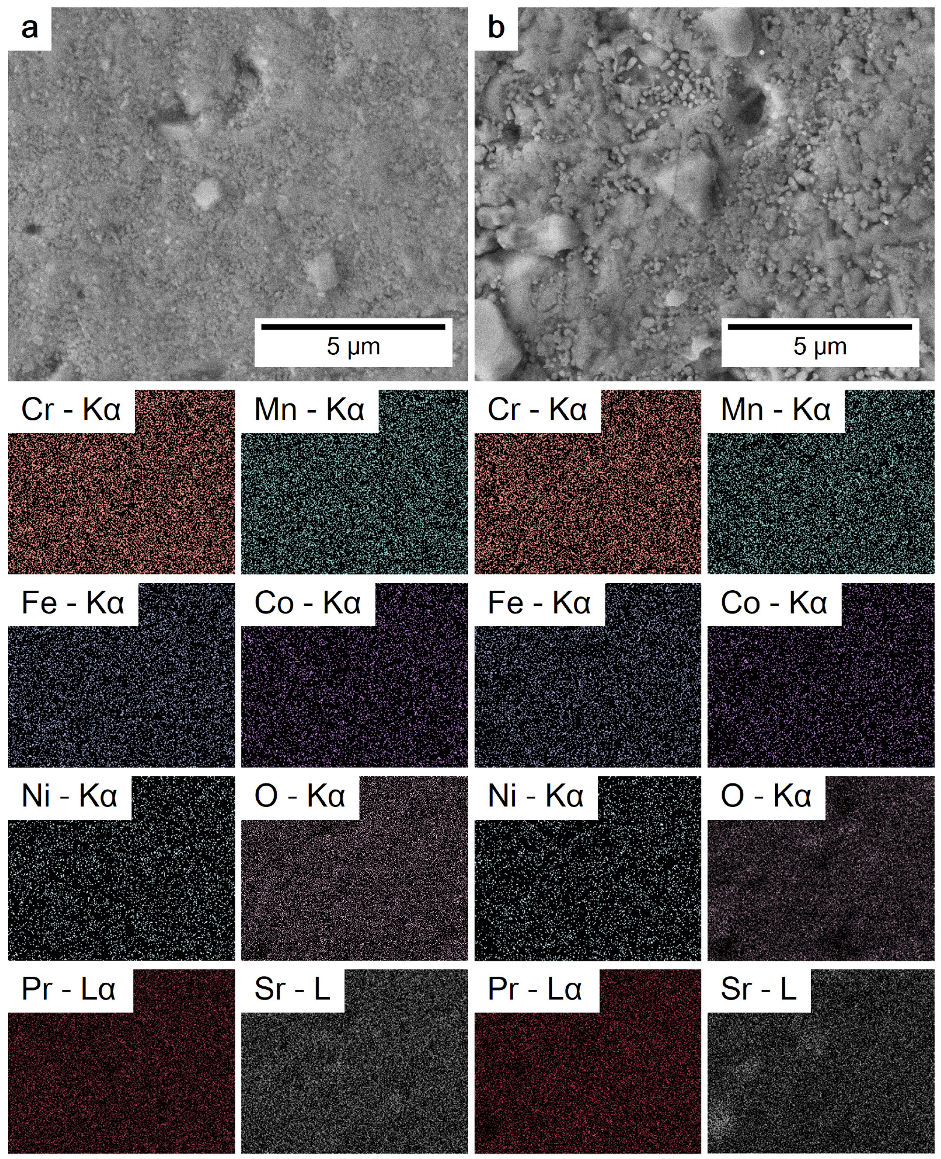
The SEM investigation in the backscattered electron channeling contrast mode produced similar images of membranes with x = 0 and x = 0.5 (Figure 5a,b), indicating that no intergrowths are formed after introducing Sr into Pr0.5Sr0.5(Cr,Mn,Fe,Co,Ni)O 3 δ . The electron channeling contrast comes from the change of the angle between the crystal lattice orientation and the incident electron beam. The following images further visualize the uniform distribution of each element in both samples without enrichment of Sr or Cr, which is found in Ln 1 x Srx(Cr,Mn,Fe,Co,Ni)O 3 δ (Ln = La, Pr, Nd, Sm, Gd), as reported in reference [21,29].
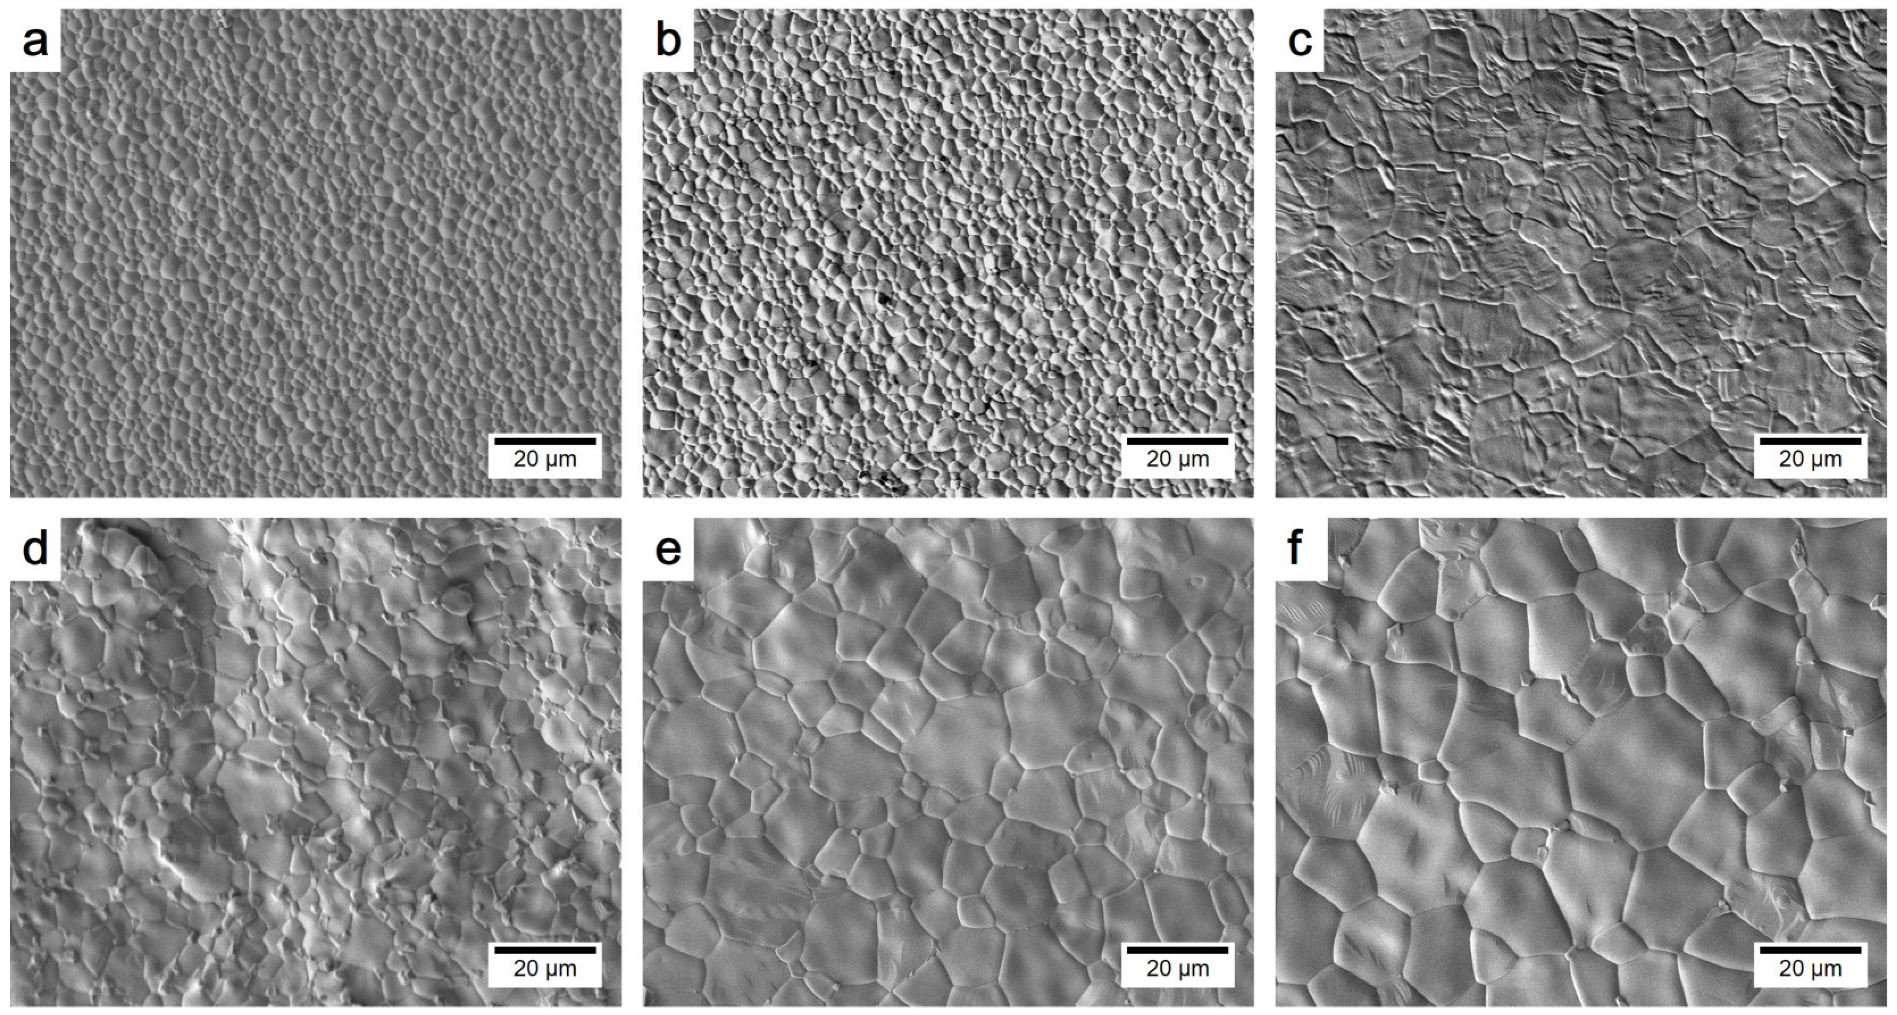
Figure 5 also demonstrates that the Sr content affects grain size of Pr 1 x Srx(Cr,Mn,Fe,Co,Ni)O 3 δ membranes. The average grain size increases with increasing strontium content, and is 4.6 µm2 for x = 0 and 14.7 µm2 for x = 0.5 (Figure A4). The Sr effect on grain size is explicitly shown by the SEM images of the membrane surface in Figure A5. A similar effect has been found in its low-entropy counterparts, e.g., La 1 x SrxCo0.2F0.8O3 [27,41,42]. Possible reasons could be the formation of a transient liquid phase or defects that facilitate mass transport during the sintering process [27]. Although this phenomenon is interesting and should be further investigated, it is beyond the scope of this work.

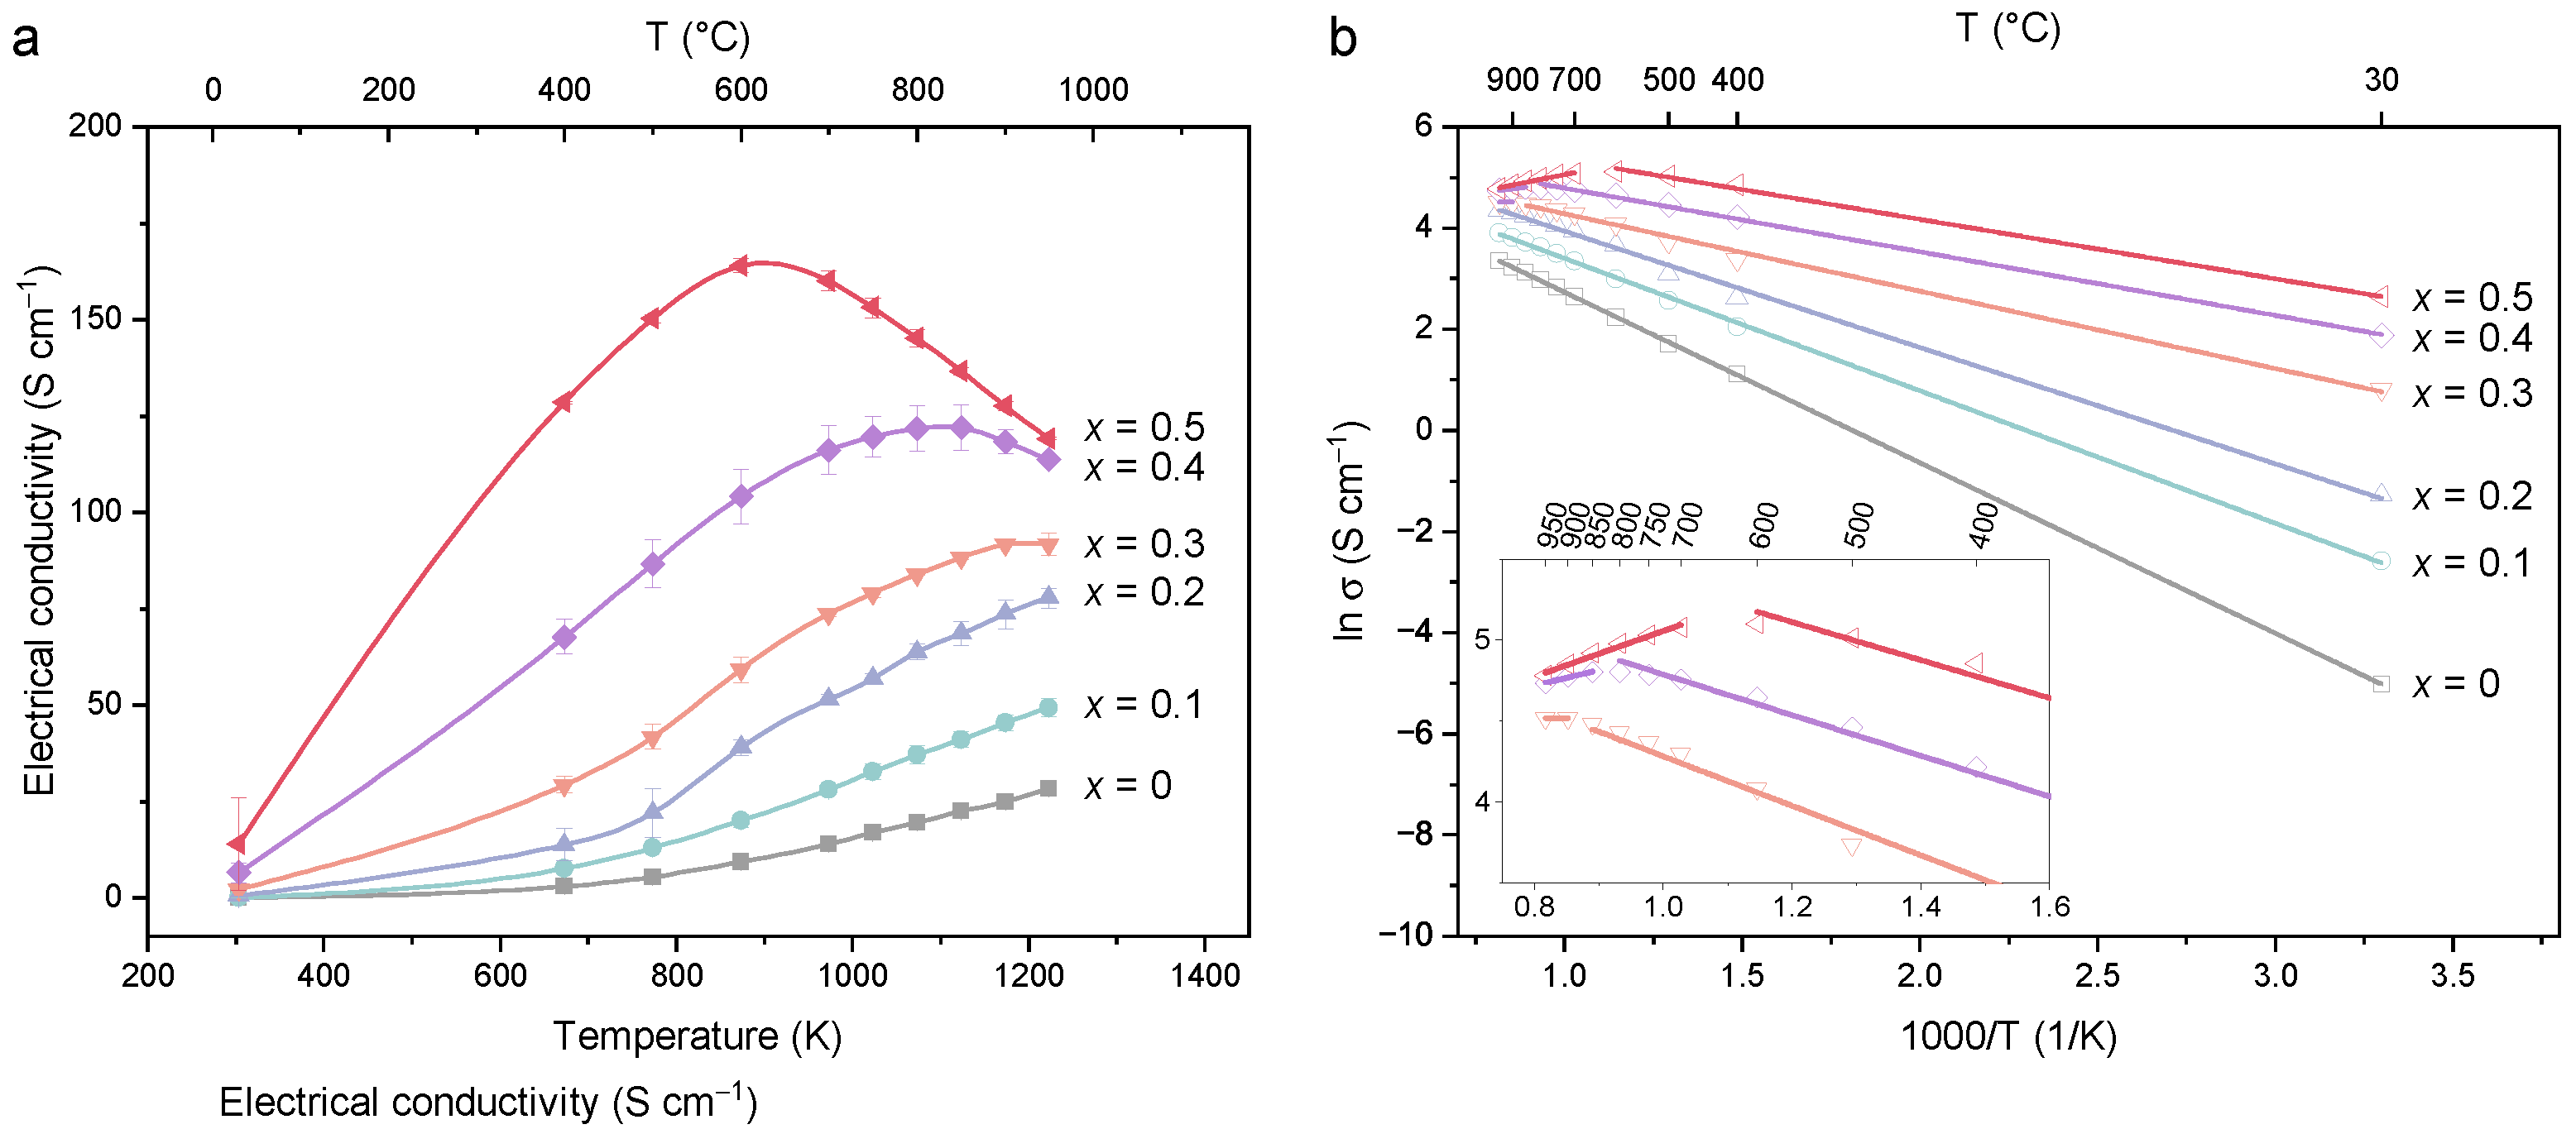
3.3. Electrical Conductivity

The temperature dependence of the electrical conductivity of sintered samples was recorded in ambient air. Since the ionic conductivity is much smaller than the electronic conductivity in perovskite [25,26], the electrical conductivity can be regarded as the electronic conductivity. The conductivity increases with higher temperatures, reaches a maximum at a certain temperature, and then starts to decrease in the case of x > 0.3 , as depicted in Figure 6a, showing a transition from a semi-conductive to metallic behavior.
The semi-conducting behavior is related to a p-type small polaron hopping mechanism, i.e., the mobility of localized electronic carriers is thermally activated, while the decrease in conductivity after T max (1073 K for x = 0.4 , 873 K for x = 0.5 ) could be attributed to the loss of oxygen from the lattice [26,33]. With the loss of oxygen, the concentration of charge carriers is reduced as described by Equation (3) [26]:
2   B B + O O × 2   B B × + V O + 1 2 O 2
where B B and V O are tetravalent cations (electron holes) on the B-site and oxygen vacancy, respectively. Moreover, the overlap between the 3d-orbitals of the B-site cations and the 2p-orbitals of oxygen is decreased with the loss of oxygen, and consequently causing a decline in conductivity since the overlap is responsible for the electron transportation [43].
Table 1 lists the maximum conductivity, the corresponding temperature, as well as the activation energy determined from the linear part of the Arrhenius plot (Figure 6b). While the activation energies of Pr 1 x Srx(Cr,Mn,Fe,Co,Ni)O 3 δ ( x = 0–0.5) are close to La 1 x Srx(Cr,Mn,Fe,Co,Ni)O 3 δ ( x = 0–0.3), as reported by Dąbrowa et al. [21], the clear difference lies in the maximum values of electronic conductivity. We attribute the difference of higher electronic conductivity to the close contact among the grains as shown by the cross-sectional images in Figure 5a,b and the top-view images in Figure A5. High electronic conductivity is beneficial to applications involving solid oxide fuel cells or mixed ionic–electronic conductors [44]. It is obvious that adding Sr to the A-site significantly enhances the electronic conductivity and reduces the activation energy, which is 578% in σ max and 34% in E a when comparing x = 0.5 to x = 0 . Similar effects of Sr doping are also found in Sr-doped La, Pr, and Nd perovskites [26,33,34,45,46].

3.4. Oxygen Permeation

The permeation performance was evaluated on Pr 1 x Srx(Cr,Mn,Fe,Co,Ni)O 3 δ ( x = 0–0.5) membranes by using helium as sweep gas between the temperature of 1023 K to 1223 K. The oxygen fluxes of samples with x [ 0 , 0.2 ] are below the detection limit of gas chromatography and thus not shown here. Data of samples with x [ 0.3 , 0.5 ] are presented in Figure 7a. The influence of temperature and Sr content is evident: oxygen fluxes increase with elevated temperature and higher Sr content. Meanwhile, the magnitude of the increase in oxygen flux is also larger when x changes from 0.4 to 0.5 than when x changes from 0.3 to 0.4. Taking the changes in quasi-cubic lattice parameter (Figure 2) and electrical conductivity (Figure 6) into account, we can conclude that when increasing x from 0.4 to 0.5, more oxygen vacancies are introduced than increasing x from 0.3 to 0.4. The oxygen vacancy leads to expansion in cell volume, thus compensating for the effect of the tetravalent B-site cations and slowing down the decreasing trend of lattice parameter at high x values (Figure 2). Since the creation of one oxygen vacancy annihilates two electron holes (see Equation (3)), the T max lowers with an increased x, and the decrease in electronic conductivity after T max becomes steeper (Figure 6a).
The oxygen flux of membrane with x = 0.5 is close to that of La0.6Sr0.4Co0.5Fe0.5O 3 δ [47]. Moreover, the membrane was stable by using (almost) pure CO2 as sweep gas and the oxygen flux was not impaired, at least in 46.2 h (Figure 7b), showing good tolerance to CO2. After switching back to He as sweep gas, the flux returned from 0.21 mLmin−1cm−2 to 0.32 mLmin−1cm−2. Hence, the reduction of oxygen flux (ca. 34%) upon switching from He to CO2 is possibly due to the adsorbed CO2 on membrane surface as observed by several groups [32,48,49].
The phase structure and morphology of the spent Pr0.5Sr0.5(Cr,Mn,Fe,Co,Ni)O 3 δ membrane are shown in Figure 8 and Figure A7, respectively. On the feed and sweep sides, no secondary phase, such as SrCrO4, can be detected by XRD. Furthermore, no accumulation of Sr and Cr was found by EDXS analysis (Figure A7), all elements are uniformly distributed on both sides of the membrane surface after the oxygen permeation experiment of 48.2 h. The post-characterization of the spent membrane together with the long-term permeation test indicates that the high-entropy Pr0.5Sr0.5(Cr,Mn,Fe,Co,Ni)O 3 δ membrane possesses similar stability against CO2 as the low-entropy counterpart La0.6Sr0.4Co0.5Fe0.5O 3 δ [47].

4. Conclusions

Sr-doped high-entropy perovskites Pr 1 x Srx(Cr,Mn,Fe,Co,Ni)O 3 δ ( x = 0–0.5) were successfully synthesized via a sol–gel method. Examination of phase purity by XRD, SEM, and EDXS demonstrated that raising the temperature of heating treatment can be used to increase the content of Sr in the pure phase. According to the results of Rietveld refinements, the quasi-cubic lattice parameter had a declined tendency towards higher Sr content and the tendency slowed down when x > 0.3 . Starting from this composition ( x > 0.3 ), a transition of semi-conductive to metallic behavior was observed in the electrical conductivity measurement within 1223 K. Furthermore, oxygen flux could be detected from 1023 K to 1223 K, and it was greatly enhanced by increasing the Sr content. The membrane Pr0.5Sr0.5(Cr,Mn,Fe,Co,Ni)O 3 δ exhibited a permeation behavior similar to La0.6Sr0.4Co0.5Fe0.5O 3 δ , in view of the magnitude of oxygen flux and the chemical stability against CO2 in the range of tested temperatures.

Author Contributions

Conceptualization, A.F. and Z.Z.; Methodology, Z.Z. and L.R.; Validation, Z.Z. and L.R.; Formal Analysis, Z.Z. and L.R.; Investigation, Z.Z., L.R. and F.S.; Data Curation, Z.Z. and L.R.; Writing—Original Draft Preparation, Z.Z.; Writing—Review and Editing, Z.Z., L.R., F.S. and A.F.; Visualization, Z.Z.; Supervision, A.F.; Project Administration, A.F.; Funding Acquisition, A.F. All authors have read and agreed to the published version of the manuscript.

Funding

This research was funded by the Deutsche Forschungsgemeinschaft (DFG, German Research Foundation)—project number 435833397.

Institutional Review Board Statement

Not applicable.

Data Availability Statement

Not applicable.

Acknowledgments

The authors thank R. Hinterding and K. Kruppa for their assistance during the electrical conductivity measurements, O. Stölting for his preparation of some samples, R. Almeev for access to the JSM-7610FPlus scanning electron microscope, and A. Sarkar from the Karlsruhe Institute of Technology for helpful scientific exchange.

Conflicts of Interest

The authors declare no conflict of interest.

Abbreviations

The following abbreviations are used in this manuscript:
MIECmixed ionic–electronic conductor
BSCFBa0.5Sr0.5Co0.8Fe0.2O 3 δ
XRDX-ray diffraction
FE-SEMfield-emission scanning electron microscope
EDXSenergy-dispersive X-ray spectrometer
LSCFLa0.6Sr0.4Co0.5Fe0.5O 3 δ

Appendix A

Figure A1. Rietveld refinements of Pr 1 x Srx(Cr,Mn,Fe,Co,Ni)O 3 δ ( x = 0–0.5) powders treated at 1673 K. PrCrO3 ( P n m a , ICSD 251098) was used as starting structure since the powders are pure phase after heating at 1673 K, as discussed in Section 3.1 in the main text.
Membranes 12 01123 g0a1
Figure A2. Temperature profile of the Carbolite HTF 1700 oven during natural cooling. The cooling rate is derived from the first-order derivative of the temperature curve. Ambient temperature: 297 ± 1 K. The cooling process was conducted three times. Error bars are inside the hollow squares.
Membranes 12 01123 g0a2
Figure A3. XRD pattern of Pr0.3Sr0.7(Cr,Mn,Fe,Co,Ni)O 3 δ powder treated after 1673 K for 10 h. Reflections were indexed according to the results of Rietveld refinement using PrCrO3 (ICSD 251098) as the starting structure.
Membranes 12 01123 g0a3
Figure A4. Grain size distribution of Pr 1 x Srx(Cr,Mn,Fe,Co,Ni)O 3 δ membranes ( x = 0 , 0.5 ) fitted with a log-normal density function. The dashed lines show the distribution of grains from the membrane surface, whereas the solid lines demonstrate the distribution of grains from the membrane cross-section. The grain diameter d is calculated according to d = 4 A / π , where A is the measured area of grains. In each case, 100 grains were evaluated.
Membranes 12 01123 g0a4
Figure A5. SEM images of the Pr 1 x Srx(Cr,Mn,Fe,Co,Ni)O 3 δ ( x = 0–0.5) membrane surface. (a) x = 0 ; (b) x = 0.1 ; (c) x = 0.2 ; (d) x = 0.3 ; (e) x = 0.4 ; (f) x = 0.5 . The close contact among the grains is responsible for enhanced electrical conductivity compared to La 1 x Srx(Cr,Mn,Fe,Co,Ni)O 3 δ ( x = 0 – 0.3), as reported by Dąbrowa et al. [21].
Membranes 12 01123 g0a5
Figure A6. SEM images of Pr0.3Sr0.7(Cr,Mn,Fe,Co,Ni)O 3 δ membrane: (a) surface; (b) cross-section.
Membranes 12 01123 g0a6
Figure A7. SEM images of the spent Pr0.5Sr0.5(Cr,Mn,Fe,Co,Ni)O 3 δ membrane and corresponding elemental distributions: (a) feed side and (b) sweep side. The surfaces were polished prior to the oxygen permeation measurement, and, therefore, no grain boundary is visible.
Membranes 12 01123 g0a7
Table A1. Ionic radii of elements in Pr 1 x Srx(Cr,Mn,Fe,Co,Ni)O 3 δ ( x = 0–0.5) [50,51]. LS and HS stand for low spin and high spin, respectively.
IonCoordination NumberIonic Radius (pm)
Pr3+XII132
Sr2+XII144
Cr3+VI61.5
Mn3+VI59LS, 64.5HS
Fe3+VI55LS, 64.5HS
Co3+VI54.5LS, 61HS
Ni3+VI56LS, 60HS
Cr4+VI55
Mn4+VI53
Fe4+VI58.5
Co4+VI53
Ni4+VI48
O2-VI140
Table A2. Goldschimdt tolerance factor t, size difference of A-site cations Δ ( R A ) , size difference of B-site cations Δ ( R B ) , and mixed entropy Δ S mix of Pr 1 x Srx(Cr,Mn,Fe,Co,Ni)O 3 δ ( x = 0–0.5). LS and HS stand for low spin and high spin, respectively.
Samplet (B3+)t (B4+) * Δ ( R A) ** Δ ( R B 3 + ) Δ ( R B 4 + ) * Δ S mix
x = 0 0.98LS, 0.95HS0.990.00%4.47%LS, 2.99%HS6.37%1.61R
x = 0.1 0.98LS, 0.95HS1.002.70%4.47%LS, 2.99%HS6.37%1.93R
x = 0.2 0.98LS, 0.96HS1.003.57%4.47%LS, 2.99%HS6.37%2.11R
x = 0.3 0.99LS, 0.96HS1.014.06%4.47%LS, 2.99%HS6.37%2.22R
x = 0.4 0.99LS, 0.97HS1.014.30%4.47%LS, 2.99%HS6.37%2.28R
x = 0.5 1.00LS, 0.97HS1.024.35%4.47%LS, 2.99%HS6.37%2.30R
* Assuming that the elements on B-site all have a valence of +4, which implies the absence of oxygen vacancies, ** The size difference is calculated as in Equation (A1).
Δ ( R A ) = i = 1 N c i 1 R A i / i = 1 N c i R A i
where R A i is ionic radius of i th cation on the A-site and c i is the mole fraction of i th cation.
Table A3. Results of Rietveld refinements of Pr 1 x Srx(Cr,Mn,Fe,Co,Ni)O 3 δ ( x = 0–0.5) after different heating treatments. As an initial point of the refinement, the PrCrO3 ( P n m a , ICSD 251098) and SrCrO4 ( P 2 1 / n , ICSD 40922) structures were used. The bold numbers highlight the smallest x value, from which the samples are not considered as pure phase ( P n m a ) any more, as reflected by their corresponding Rwp values. It is clear that with higher heating temperatures, the maximum x value in the pure phase of Pr 1 x Srx(Cr,Mn,Fe,Co,Ni)O 3 δ is increased.
 xa (Å)b (Å)c (Å)Rwp (%)GOFP21/n (wt%)a (Å)b (Å)c (Å)Rwp (%)GOF
Pnma Pnma + P 2 1 / n
1223 K 5 h05.4698(2)7.6982(3)5.4407(2)2.671.29
0.15.4576(4)7.7007(5)5.4491(4)2.531.231.8(2)5.4577(4)7.7008(5)5.4491(4)2.471.2
0.25.4459(8)7.6939(1)5.4537(8)3.171.57.7(2)5.4461(6)7.6939(8)5.4536(6)2.281.09
0.35.4505(1)7.6853(2)5.4309(1)4.482.311.3(2)5.4501(7)7.6862(1)5.4305(7)2.641.36
0.45.423(2)7.668(3)5.453(2)3.962.0310.1(2)5.4228(2)7.668(2)5.4531(2)2.871.47
0.55.434(6)7.663(8)5.470(6)5.622.9910.5(5)5.433(5)7.659(6)5.466(5)4.692.5
1423 K 10 h05.4700(1)7.6977(2)5.4403(1)3.711.71
0.15.4522(1)7.6999(2)5.4526(1)3.521.570.0(5)5.4520(2)7.6999(2)5.4528(1)3.521.57
0.25.4379(4)7.6940(6)5.4552(4)3.481.540.1(4)5.4380(4)7.6940(6)5.4552(4)3.471.54
0.35.4578(4)7.6842(5)5.4284(4)3.981.912.7(3)5.4578(4)7.6842(5)5.4285(4)3.931.89
0.45.4204(4)7.6700(7)5.4568(5)3.541.663.8(3)5.4204(4)7.6700(6)5.4569(4)3.431.61
0.55.4166(7)7.6589(1)5.4597(7)4.952.427.5(4)5.4166(7)7.6588(1)5.4597(7)4.682.29
1673 K 10 h05.4774(3)7.7098(4)5.4496(3)4.321.72
0.15.4491(3)7.7115(4)5.4440(3)4.482.21
0.25.4354(3)7.6912(4)5.4535(3)3.791.910.1(1)5.4353(3)7.6913(4)5.4537(3)4.032.03
0.35.4583(3)7.6788(4)5.4239(3)4.382.253.3(1)5.4583(3)7.6790(4)5.4238(3)4.672.40
0.45.4656(2)7.6657(3)5.4211(2)3.751.953.5(1)5.4173(2)7.6604(3)5.4620(2)4.142.16
0.55.4623(2)7.6628(3)5.4232(2)3.631.926.4(1)5.4172(2)7.6543(3)5.4563(2)3.741.97
Table A4. Average composition of Pr 1 x Srx(Cr,Mn,Fe,Co,Ni)O 3 δ ( x = 0–0.5) obtained on an effective area of 200,000 µm2 by a lithium-drifted silicon detector.
Average Composition (at.%)Ratio of Cations
xPrSrCrMnFeCoNiOPrSrCrMnFeCoNi
019.040.004.573.143.493.753.4662.501.020.000.240.170.190.200.18
0.117.052.004.223.253.523.623.5562.780.920.110.230.170.190.190.19
0.215.974.314.463.383.663.683.6660.890.820.220.230.170.190.190.19
0.313.306.454.353.453.623.553.5161.760.700.340.230.180.190.190.18
0.411.718.494.203.783.643.693.7160.780.600.430.210.190.190.190.19
0.510.4910.494.203.543.583.743.9460.700.520.520.210.180.180.190.20
Table A5. Average composition of Pr 1 x Srx(Cr,Mn,Fe,Co,Ni)O 3 δ ( x = 0–0.5) obtained on an effective area of 336 µm2 by silicon drift detectors.
Average Composition (at.%)Ratio of Cations
xPrSrCrMnFeCoNiOPrSrCrMnFeCoNi
027.300.005.755.545.976.055.5643.820.970.000.200.200.210.220.20
0.123.573.105.515.355.775.805.4145.490.860.110.200.200.210.210.20
0.221.576.575.475.325.755.815.6643.840.770.230.190.190.200.210.20
0.318.298.975.515.385.765.745.5644.780.660.330.200.190.210.210.20
0.415.7611.945.515.485.795.815.8643.850.560.430.200.200.210.210.21
0.513.1214.735.405.485.765.715.8143.990.470.530.190.200.210.200.21

References

  1. Cantor, B.; Chang, I.T.H.; Knight, P.; Vincent, A.J.B. Microstructural development in equiatomic multicomponent alloys. Mater. Sci. Eng. A 2004, 375–377, 213–218. [Google Scholar] [CrossRef]
  2. Oses, C.; Toher, C.; Curtarolo, S. High-entropy ceramics. Nat. Rev. Mater. 2020, 5, 295–309. [Google Scholar] [CrossRef]
  3. Dragoe, N.; Bérardan, D. Order emerging from disorder. Science 2019, 366, 573–574. [Google Scholar] [CrossRef] [PubMed]
  4. Sarkar, A.; Breitung, B.; Hahn, H. High entropy oxides: The role of entropy, enthalpy and synergy. Scr. Mater. 2020, 187, 43–48. [Google Scholar] [CrossRef]
  5. Spurling, R.J.; Lass, E.A.; Wang, X.; Page, K. Entropy-driven phase transitions in complex ceramic oxides. Phys. Rev. Mater. 2022, 6, 090301. [Google Scholar] [CrossRef]
  6. Rost, C.M.; Sachet, E.; Borman, T.; Moballegh, A.; Dickey, E.C.; Hou, D.; Jones, J.L.; Curtarolo, S.; Maria, J.P. Entropy-stabilized oxides. Nat. Commun. 2015, 6, 8485. [Google Scholar] [CrossRef] [Green Version]
  7. Dąbrowa, J.; Stygar, M.; Mikuła, A.; Knapik, A.; Mroczka, K.; Tejchman, W.; Danielewski, M.; Martin, M. Synthesis and microstructure of the (Co,Cr,Fe,Mn,Ni)3O4 high entropy oxide characterized by spinel structure. Mater. Lett. 2018, 216, 32–36. [Google Scholar] [CrossRef]
  8. Jiang, S.; Hu, T.; Gild, J.; Zhou, N.; Nie, J.; Qin, M.; Harrington, T.; Vecchio, K.; Luo, J. A new class of high-entropy perovskite oxides. Scr. Mater. 2018, 142, 116–120. [Google Scholar] [CrossRef]
  9. Sarkar, A.; Djenadic, R.; Wang, D.; Hein, C.; Kautenburger, R.; Clemens, O.; Hahn, H. Rare earth and transition metal based entropy stabilised perovskite type oxides. J. Eur. Ceram. Soc. 2018, 38, 2318–2327. [Google Scholar] [CrossRef]
  10. Sarker, P.; Harrington, T.; Toher, C.; Oses, C.; Samiee, M.; Maria, J.P.; Brenner, D.W.; Vecchio, K.S.; Curtarolo, S. High-entropy high-hardness metal carbides discovered by entropy descriptors. Nat. Commun. 2018, 9, 4980. [Google Scholar] [CrossRef]
  11. Zhou, J.; Tao, Q.; Ahmed, B.; Palisaitis, J.; Persson, I.; Halim, J.; Barsoum, M.W.; Persson, P.O.Å.; Rosen, J. High-entropy laminate metal carbide (MAX phase) and its two-dimensional derivative MXene. Chem. Mater. 2022, 34, 2098–2106. [Google Scholar] [CrossRef]
  12. Zhao, X.; Xue, Z.; Chen, W.; Bai, X.; Shi, R.; Mu, T. Ambient fast, large-scale synthesis of entropy-stabilized metal-organic framework nanosheets for electrocatalytic oxygen evolution. J. Mater. Chem. A 2019, 7, 26238–26242. [Google Scholar] [CrossRef]
  13. Shi, Y.; Ni, N.; Ding, Q.; Zhao, X. Tailoring high-temperature stability and electrical conductivity of high entropy lanthanum manganite for solid oxide fuel cell cathodes. J. Mater. Chem. A 2022, 10, 2256–2270. [Google Scholar] [CrossRef]
  14. Lou, Z.; Zhang, P.; Zhu, J.; Gong, L.; Xu, J.; Chen, Q.; Reece, M.J.; Yan, H.; Gao, F. A novel high-entropy perovskite ceramics Sr0.9La0.1(Zr0.25Sn0.25Ti0.25Hf0.25)O3 with low thermal conductivity and high Seebeck coefficient. J. Eur. Ceram. Soc. 2022, 42, 3480–3488. [Google Scholar] [CrossRef]
  15. Tang, L.; Yang, Y.; Guo, H.; Wang, Y.; Wang, M.; Liu, Z.; Yang, G.; Fu, X.; Luo, Y.; Jiang, C.; et al. High configuration entropy activated lattice oxygen for O2 formation on perovskite electrocatalyst. Adv. Funct. Mater. 2022, 32, 2112157. [Google Scholar] [CrossRef]
  16. Gazda, M.; Miruszewski, T.; Jaworski, D.; Mielewczyk-Gryń, A.; Skubida, W.; Wachowski, S.; Winiarz, P.; Dzierzgowski, K.; apiński, M.; Szpunar, I.; et al. Novel class of proton conducting materials—High entropy oxides. ACS Mater. Lett. 2020, 2, 1315–1321. [Google Scholar] [CrossRef]
  17. Banerjee, R.; Chatterjee, S.; Ranjan, M.; Bhattacharya, T.; Mukherjee, S.; Jana, S.S.; Dwivedi, A.; Maiti, T. High-entropy perovskites: An emergent class of oxide thermoelectrics with ultralow thermal conductivity. ACS Sustain. Chem. Eng. 2020, 8, 17022–17032. [Google Scholar] [CrossRef]
  18. Chen, Z.; Wu, J.; Chen, Z.; Yang, H.; Zou, K.; Zhao, X.; Liang, R.; Dong, X.; Menezes, P.W.; Kang, Z. Entropy enhanced perovskite oxide ceramic for efficient electrochemical reduction of oxygen to hydrogen peroxide. Angew. Chem. Int. Ed. 2022, 61, e202200086. [Google Scholar] [CrossRef]
  19. Chen, D.; Nie, S.; Wu, L.; Zheng, X.; Du, S.; Duan, X.; Niu, Q.; Zhang, P.; Dai, S. Metal–tannin coordination assembly route to nanostructured high-entropy oxide perovskites with abundant defects. Chem. Mater. 2022, 34, 1746–1755. [Google Scholar] [CrossRef]
  20. Guo, R.; He, T. High-entropy perovskite electrolyte for protonic ceramic fuel cells operating below 600 °C. ACS Mater. Lett. 2022, 4, 1646–1652. [Google Scholar] [CrossRef]
  21. Dąbrowa, J.; Olszewska, A.; Falkenstein, A.; Schwab, C.; Szymczak, M.; Zajusz, M.; Moździerz, M.; Mikuła, A.; Zielińska, K.; Berent, K.; et al. An innovative approach to design SOFC air electrode materials: High entropy La1−xSrx(Co,Cr,Fe,Mn,Ni)O3−δ (x = 0, 0.1, 0.2, 0.3) perovskites synthesized by the sol-gel method. J. Mater. Chem. A 2020, 8, 24455–24468. [Google Scholar] [CrossRef]
  22. Wang, J.; Cao, Z.; Zhu, X.; Yang, W. Improving intermediate-temperature stability of BSCF by constructing high entropy perovskites. J. Membr. Sci. Lett. 2022, 2, 100026. [Google Scholar] [CrossRef]
  23. Chen, G.; Feldhoff, A.; Weidenkaff, A.; Li, C.; Liu, S.; Zhu, X.; Sunarso, J.; Huang, K.; Wu, X.Y.; Ghoniem, A.F.; et al. Roadmap for sustainable mixed ionic-electronic conducting membranes. Adv. Funct. Mater. 2021, 32, 2105702. [Google Scholar] [CrossRef]
  24. Zhang, C.; Sunarso, J.; Liu, S. Designing CO2-resistant oxygen-selective mixed ionic–electronic conducting membranes: Guidelines, recent advances, and forward directions. Chem. Soc. Rev. 2017, 46, 2941–3005. [Google Scholar] [CrossRef]
  25. Sunarso, J.; Baumann, S.; Serra, J.; Meulenberg, W.; Liu, S.; Lin, Y.; Diniz da Costa, J. Mixed ionic–electronic conducting (MIEC) ceramic-based membranes for oxygen separation. J. Membr. Sci. 2008, 320, 13–41. [Google Scholar] [CrossRef]
  26. Stevenson, J.W.; Armstrong, T.R.; Carneim, R.D.; Pederson, L.R.; Weber, W.J. Electrochemical properties of mixed conducting perovskites La1-xMxCo1−yFeyO3−δ (M = Sr, Ba, Ca). J. Electrochem. Soc. 1996, 143, 2722–2729. [Google Scholar] [CrossRef]
  27. Chou, Y.S.; Stevenson, J.W.; Armstrong, T.R.; Pederson, L.R. Mechanical properties of La1−xSrxCo0.2Fe0.8O3 mixed-conducting perovskites made by the combustion synthesis technique. J. Am. Ceram. Soc. 2000, 83, 1457–1464. [Google Scholar] [CrossRef]
  28. Fujimori, A. Electronic structure of metallic oxides: Band-gap closure and valence control. J. Phys. Chem. Solids 1992, 53, 1595–1602. [Google Scholar] [CrossRef]
  29. Dąbrowa, J.; Zielińska, K.; Stępień, A.; Zajusz, M.; Nowakowska, M.; Moździerz, M.; Berent, K.; Szymczak, M.; Świerczek, K. Formation of solid solutions and physicochemical properties of the high-entropy Ln1−xSrx(Co,Cr,Fe,Mn,Ni)O3−δ (Ln = La, Pr, Nd, Sm or Gd) perovskites. Materials 2021, 14, 5264. [Google Scholar] [CrossRef]
  30. Partovi, K.; Liang, F.; Ravkina, O.; Caro, J. High-flux oxygen-transporting membrane Pr0.6Sr0.4Co0.5Fe0.5O3−δ: CO2 stability and microstructure. ACS Appl. Mater. Interfaces 2014, 6, 10274–10282. [Google Scholar] [CrossRef]
  31. Han, N.; Zhang, C.; Tan, X.; Wang, Z.; Kawi, S.; Liu, S. Re-evaluation of La0.6Sr0.4Co0.2Fe0.8O3−δ hollow fiber membranes for oxygen separation after long-term storage of five and ten years. J. Membr. Sci. 2019, 587, 117180. [Google Scholar] [CrossRef]
  32. Chen, G.; Zhao, Z.; Widenmeyer, M.; Yan, R.; Wang, L.; Feldhoff, A.; Weidenkaff, A. Synthesis and characterization of 40 wt% Ce0.9Pr0.1O2−δ–60 wt% NdxSr1−xFe0.9Cu0.1O3−δ dual-phase membranes for efficient oxygen separation. Membranes 2020, 10, 183. [Google Scholar] [CrossRef] [PubMed]
  33. Meng, X.; Lü, S.; Ji, Y.; Wei, T.; Zhang, Y. Characterization of Pr1−xSrxCo0.8Fe0.2O3−δ (0.2 ≤ x ≤ 0.6) cathode materials for intermediate-temperature solid oxide fuel cells. J. Power Sources 2008, 183, 581–585. [Google Scholar] [CrossRef]
  34. Lee, K.T.; Manthiram, A. Characterization of Nd1−xSrxCoO3−δ (0 ≤ x ≤ 0.5) cathode materials for intermediate temperature SOFCs. J. Electrochem. Soc. 2005, 152, A197. [Google Scholar] [CrossRef]
  35. International Union of Pure and Applied Chemistry. Nomenclature of Inorganic Chemistry; Royal Society of Chemistry: Cambridge, UK, 2005; p. 21. [Google Scholar]
  36. Feldhoff, A.; Arnold, M.; Martynczuk, J.; Gesing, T.M.; Wang, H. The sol-gel synthesis of perovskites by an EDTA/citrate complexing method involves nanoscale solid state reactions. Solid State Sci. 2008, 10, 689–701. [Google Scholar] [CrossRef]
  37. Xue, J.; Schulz, A.; Wang, H.; Feldhoff, A. The phase stability of the Ruddlesden-Popper type oxide (Pr0.9La0.1)2.0Ni0.74Cu0.21Ga0.05 O4+δ in an oxidizing environment. J. Membr. Sci. 2016, 497, 357–364. [Google Scholar] [CrossRef]
  38. Knorpp, A.J.; Bell, J.G.; Huangfu, S.; Stuer, M. From synthesis to microstructure: Engineering the high-entropy ceramic materials of the future. Chimia 2022, 76, 212. [Google Scholar] [CrossRef]
  39. Ramadass, N. ABO3-type oxides—Their structure and properties—A bird’s eye view. Mater. Sci. Eng. 1978, 36, 231–239. [Google Scholar] [CrossRef]
  40. Xiang, H.; Xing, Y.; zhi Dai, F.; Wang, H.; Su, L.; Miao, L.; Zhang, G.; Wang, Y.; Qi, X.; Yao, L.; et al. High-entropy ceramics: Present status, challenges, and a look forward. J. Adv. Ceram. 2021, 10, 385–441. [Google Scholar] [CrossRef]
  41. Wu, Y.C.; Huang, P.Y.; Xu, G. Properties and microstructural analysis of La1−xSrxCoO3−δ (x = 0–0.6) cathode materials. Ceram. Int. 2017, 43, 2460–2470. [Google Scholar] [CrossRef]
  42. Liou, Y.C. Effect of strontium content on microstructure in LaxSr1−xFeO3 ceramics. Ceram. Int. 2004, 30, 667–669. [Google Scholar] [CrossRef]
  43. Richter, J.; Holtappels, P.; Graule, T.; Nakamura, T.; Gauckler, L.J. Materials design for perovskite SOFC cathodes. Monatsh. Chem. 2009, 140, 985–999. [Google Scholar] [CrossRef] [Green Version]
  44. Steele, B.C.H.; Heinzel, A. Materials for fuel-cell technologies. Nature 2001, 414, 345–352. [Google Scholar] [CrossRef] [PubMed]
  45. Partovi, K.; Geppert, B.; Liang, F.; Rüscher, C.H.; Caro, J. Effect of the B-site composition on the oxygen permeability and the CO2 stability of Pr0.6Sr0.4CoxFe1−xO3−δ (0.0 ≤ x ≤ 1.0) membranes. Chem. Mater. 2015, 27, 2911–2919. [Google Scholar] [CrossRef]
  46. Nikonov, A.; Pavzderin, N.; Khrustov, V.; Semenova, I.; Demidova, K.; Kuterbekov, K.; Bekmyrza, K.; Nurakov, S.; Koketay, T.; Gyrdasova, O. Investigation of thermal, electrical, and electrochemical properties of Pr1−xSrxFe1−yCoyO3 (0 < x < 0.4;y = 0.2,0.5) cathode materials for SOFC. J. Alloy. Compd. 2021, 865, 158898. [Google Scholar] [CrossRef]
  47. Klande, T.; Ravkina, O.; Feldhoff, A. Effect of A-site lanthanum doping on the CO2 tolerance of SrCo0.8Fe0.2O3−δ oxygen-transporting membranes. J. Membr. Sci. 2013, 437, 122–130. [Google Scholar] [CrossRef]
  48. Lane, J.; Kilner, J. Oxygen surface exchange on gadolinia doped ceria. Solid State Ion. 2000, 136–137, 927–932. [Google Scholar] [CrossRef]
  49. Khromushin, I.; Aksenova, T.; Zhotabaev, Z. Mechanism of gas–solid exchange processes for some perovskites. Solid State Ion. 2003, 162–163, 37–40. [Google Scholar] [CrossRef]
  50. Shannon, R.D. Revised effective ionic radii and systematic studies of interatomic distances in halides and chalcogenides. Acta Crystallogr. A 1976, 32, 751–767. [Google Scholar] [CrossRef]
  51. Jia, Y. Crystal radii and effective ionic radii of the rare earth ions. J. Solid State Chem. 1991, 95, 184–187. [Google Scholar] [CrossRef]
Figure 2. Quasi-cubic lattice parameter of Pr 1 x Srx(Cr,Mn,Fe,Co,Ni)O 3 δ ( x = 0–0.5) powders after heating at 1673 K.
Membranes 12 01123 g002
Figure 3. (a) Room-temperature XRD patterns of Pr0.5Sr0.5(Cr,Mn,Fe,Co,Ni)O 3 δ powders treated at temperatures in the range of 1223 K to 1673 K followed by natural cooling. The cooling rates are shown in Figure A2. Reflections of the main phase were indexed according to the Rietveld refinement using PrCrO3 ( P n m a , ICSD 251098) as the starting structure. The diamond symbols denote Bragg positions of SrCrO4 ( P 2 1 / n , ICSD 40922). (b) The influence of heating temperatures on the SrCrO4 content and the corresponding Rwp factors obtained by Rietveld refinements.
Membranes 12 01123 g003
Figure 4. Cation stoichiometry of Pr 1 x Srx(Cr,Mn,Fe,Co,Ni)O 3 δ ( x = 0–0.5) calculated from results of EDXS (Table A4 and Table A5) under the assumption that the sum of A-site cations and B-site cations is two. The solid lines present data obtained on an effective area of 200,000 µm2 by a lithium-drifted silicon detector while the dashed lines are data on an effective area of 336 µm2 by silicon drift detectors. The cross-sections of samples were vibratory-polished and sputtered with a carbon layer before measurement.
Membranes 12 01123 g004
Figure 5. Electron channeling contrast images of vibratory-polished cross-sections of membranes (a) Pr(Cr,Mn,Fe,Co,Ni)O 3 δ and (b) Pr0.5Sr0.5(Cr,Mn,Fe,Co,Ni)O 3 δ and corresponding elemental distributions derived from silicon drift detectors.
Membranes 12 01123 g005
Figure 6. (a) Temperature-dependent electrical conductivity of Pr 1 x Srx(Cr,Mn,Fe,Co,Ni)O 3 δ ( x = 0–0.5) membranes and (b) its Arrhenius plot.
Membranes 12 01123 g006
Figure 7. Oxygen flux of Pr 1 x Srx(Cr,Mn,Fe,Co,Ni)O 3 δ ( x = 0–0.5) membranes as functions of (a) temperature and (b) duration. Test conditions: 150 mLmin−1 synthetic air as the feed gas, 29 mLmin−1 He or CO2 as the sweep gas, and 1 mLmin−1 Ne as the internal standard gas. Membrane thickness: 1.0 mm. Data for the La0.6Sr0.4Co0.5Fe0.5O 3 δ (LSCF) membrane were taken from our previous study [47].
Membranes 12 01123 g007
Figure 8. XRD patterns of the spent Pr0.5Sr0.5(Cr,Mn,Fe,Co,Ni)O 3 δ membrane after the experiment displayed in Figure 7 (CO2 + Ne sweep at 1223 K for 46.2 h and He + Ne sweep for 2 h). Reflections were indexed according to the results of Rietveld refinement using PrCrO3 (ICSD 251098) as the starting structure. Arrows: Bragg positions of CaCO3 (ICSD 52151) from XRD sample holders.
Membranes 12 01123 g008
Table 1. Activation energies E a of Pr 1 x Srx(Cr,Mn,Fe,Co,Ni)O 3 δ ( x = 0–0.5) membranes determined from the linear range of the Arrhenius plots shown in Figure 6b. σ max and T max are the maximum values of electrical conductivity and corresponding temperature among the measured data points.
x E a (eV)Temperature Range (K) σ max (S cm−1) T max (K)
00.29303–122328.39>1223
0.10.23303–122349.37>1223
0.20.20303–122377.69>1223
0.30.13303–115381.82>1153
0.40.11303–1073121.891073
0.50.10303–873163.99873
Publisher’s Note: MDPI stays neutral with regard to jurisdictional claims in published maps and institutional affiliations.

