
Intrinsic Dependence of Groundwater Cation Hydraulic and Concentration Features on Negatively Charged Thin Composite Nanofiltration Membrane Rejection and Permeation Behavior

Abstract
:
1. Introduction
2. Materials and Methods
2.1. Water Source
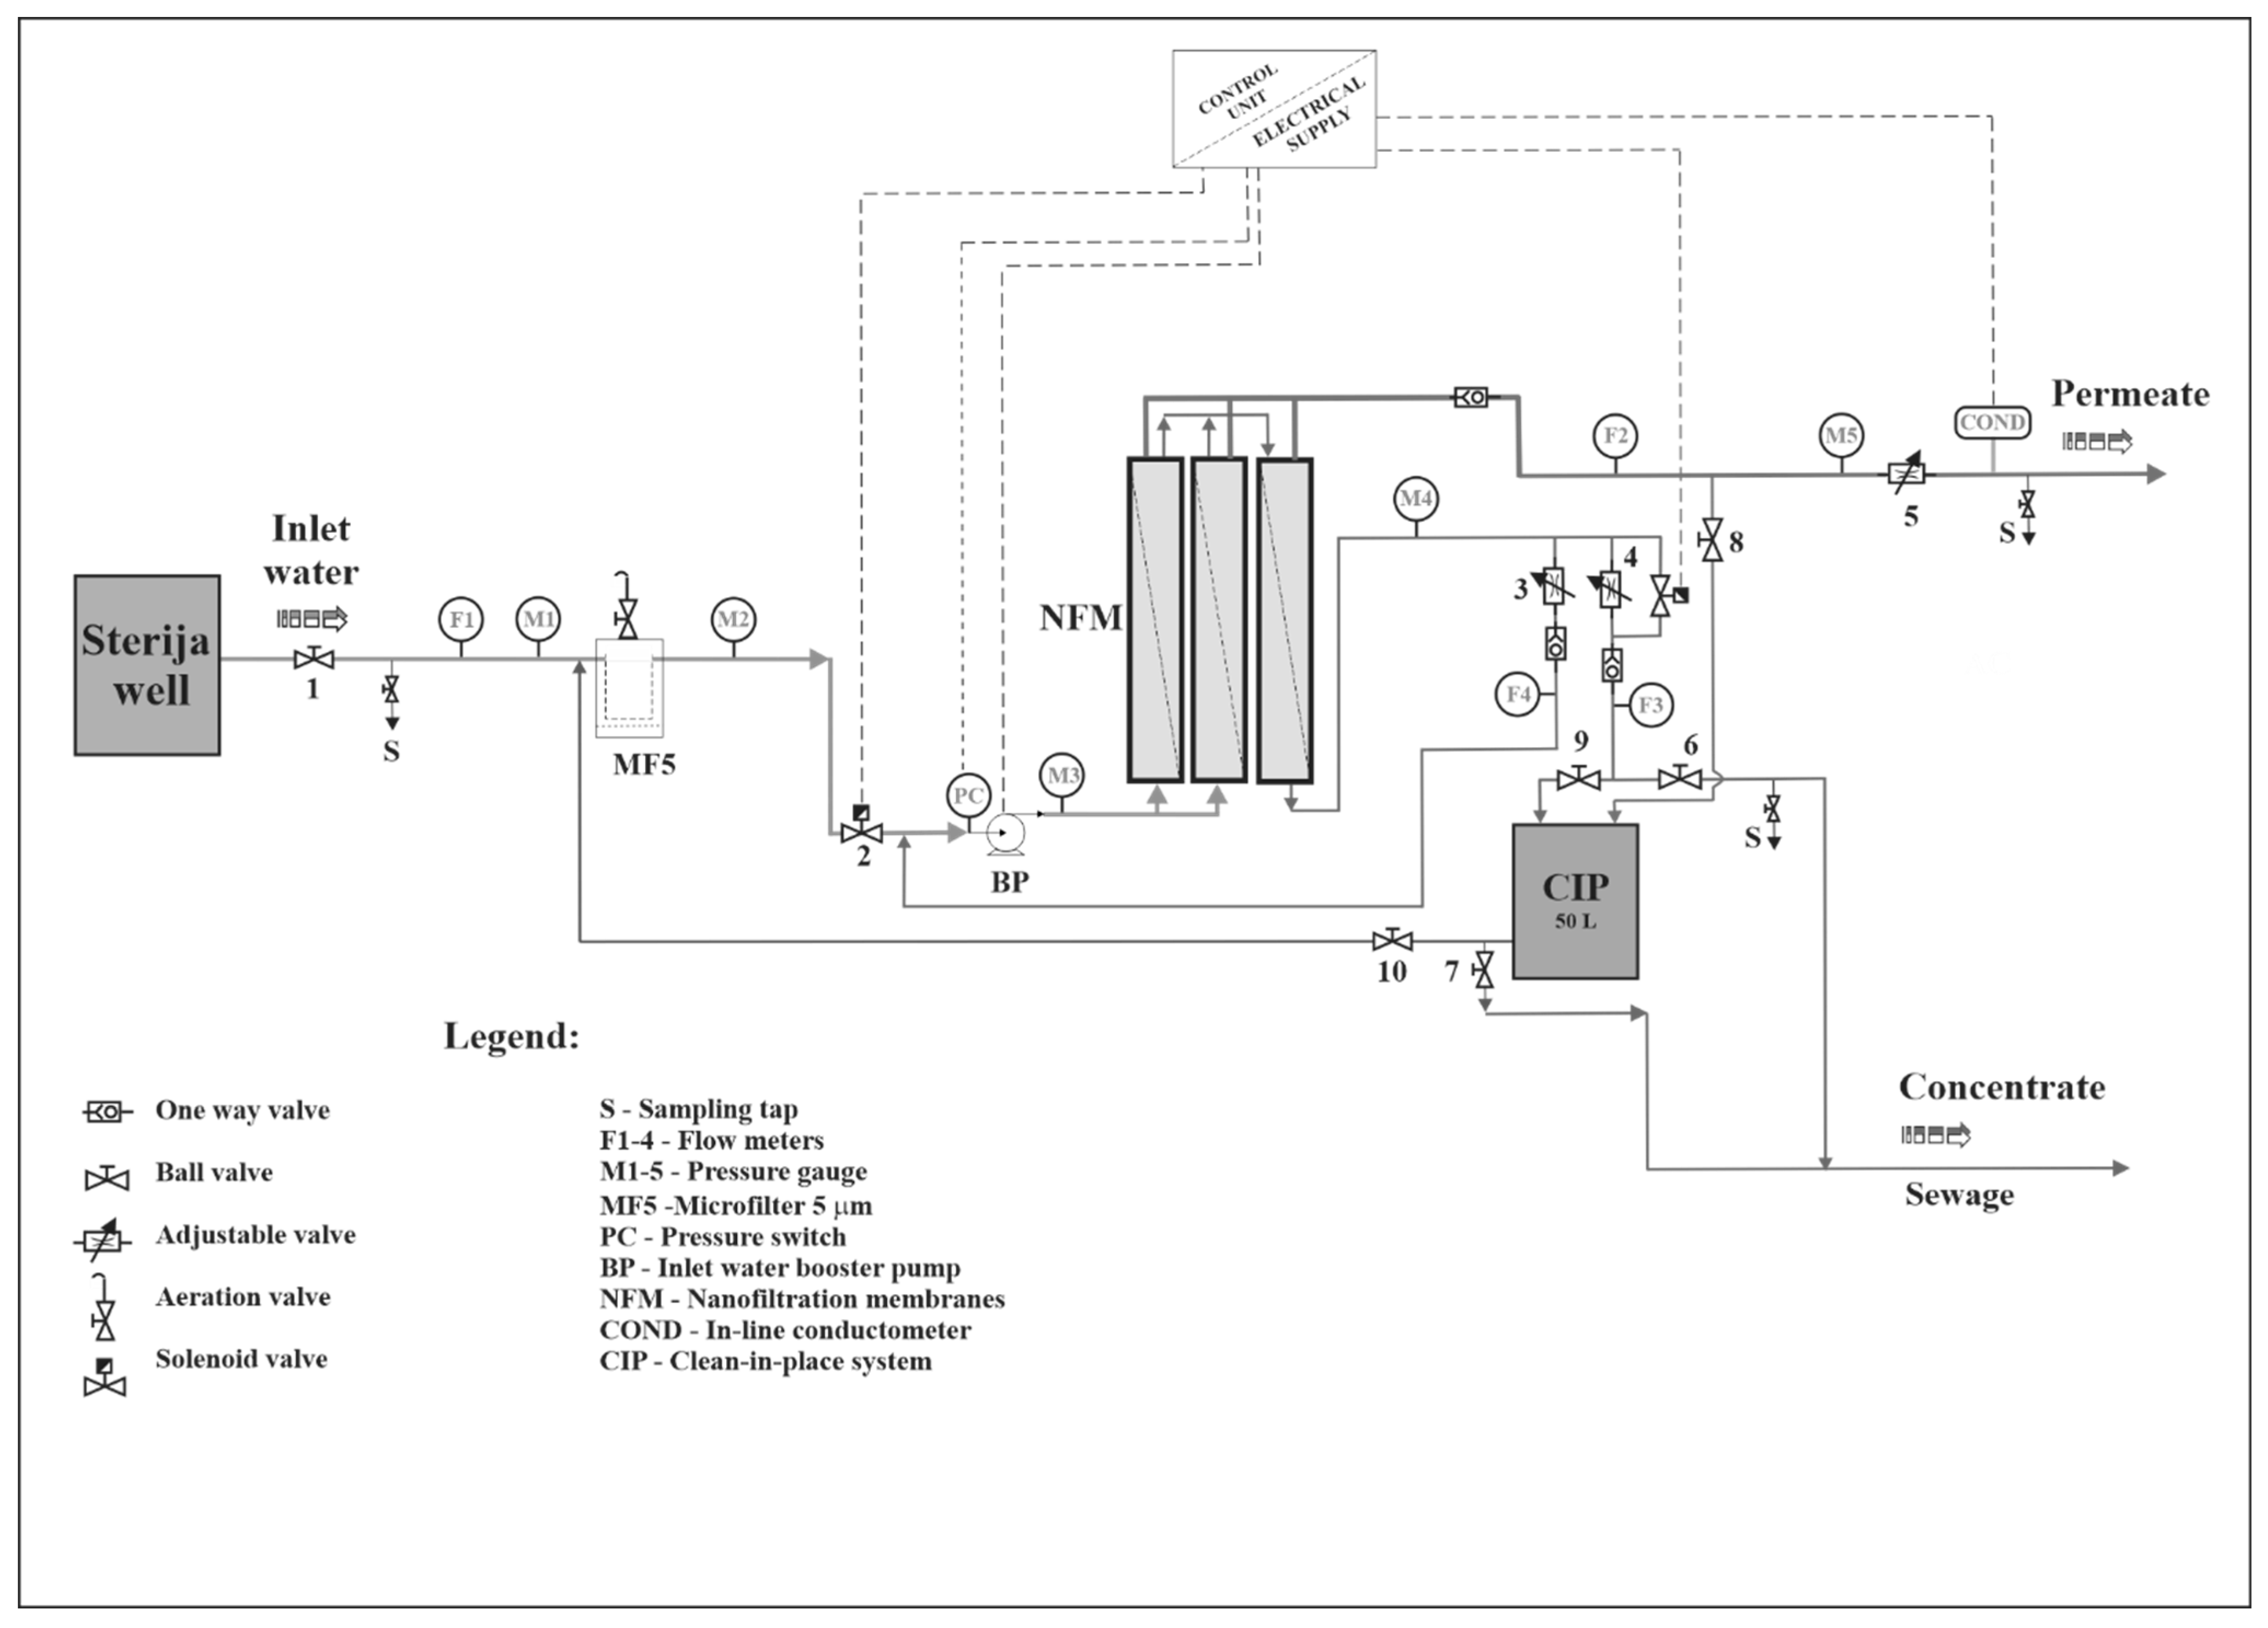
2.2. Nanofiltration Pilot Plant
2.3. Applied Calculations
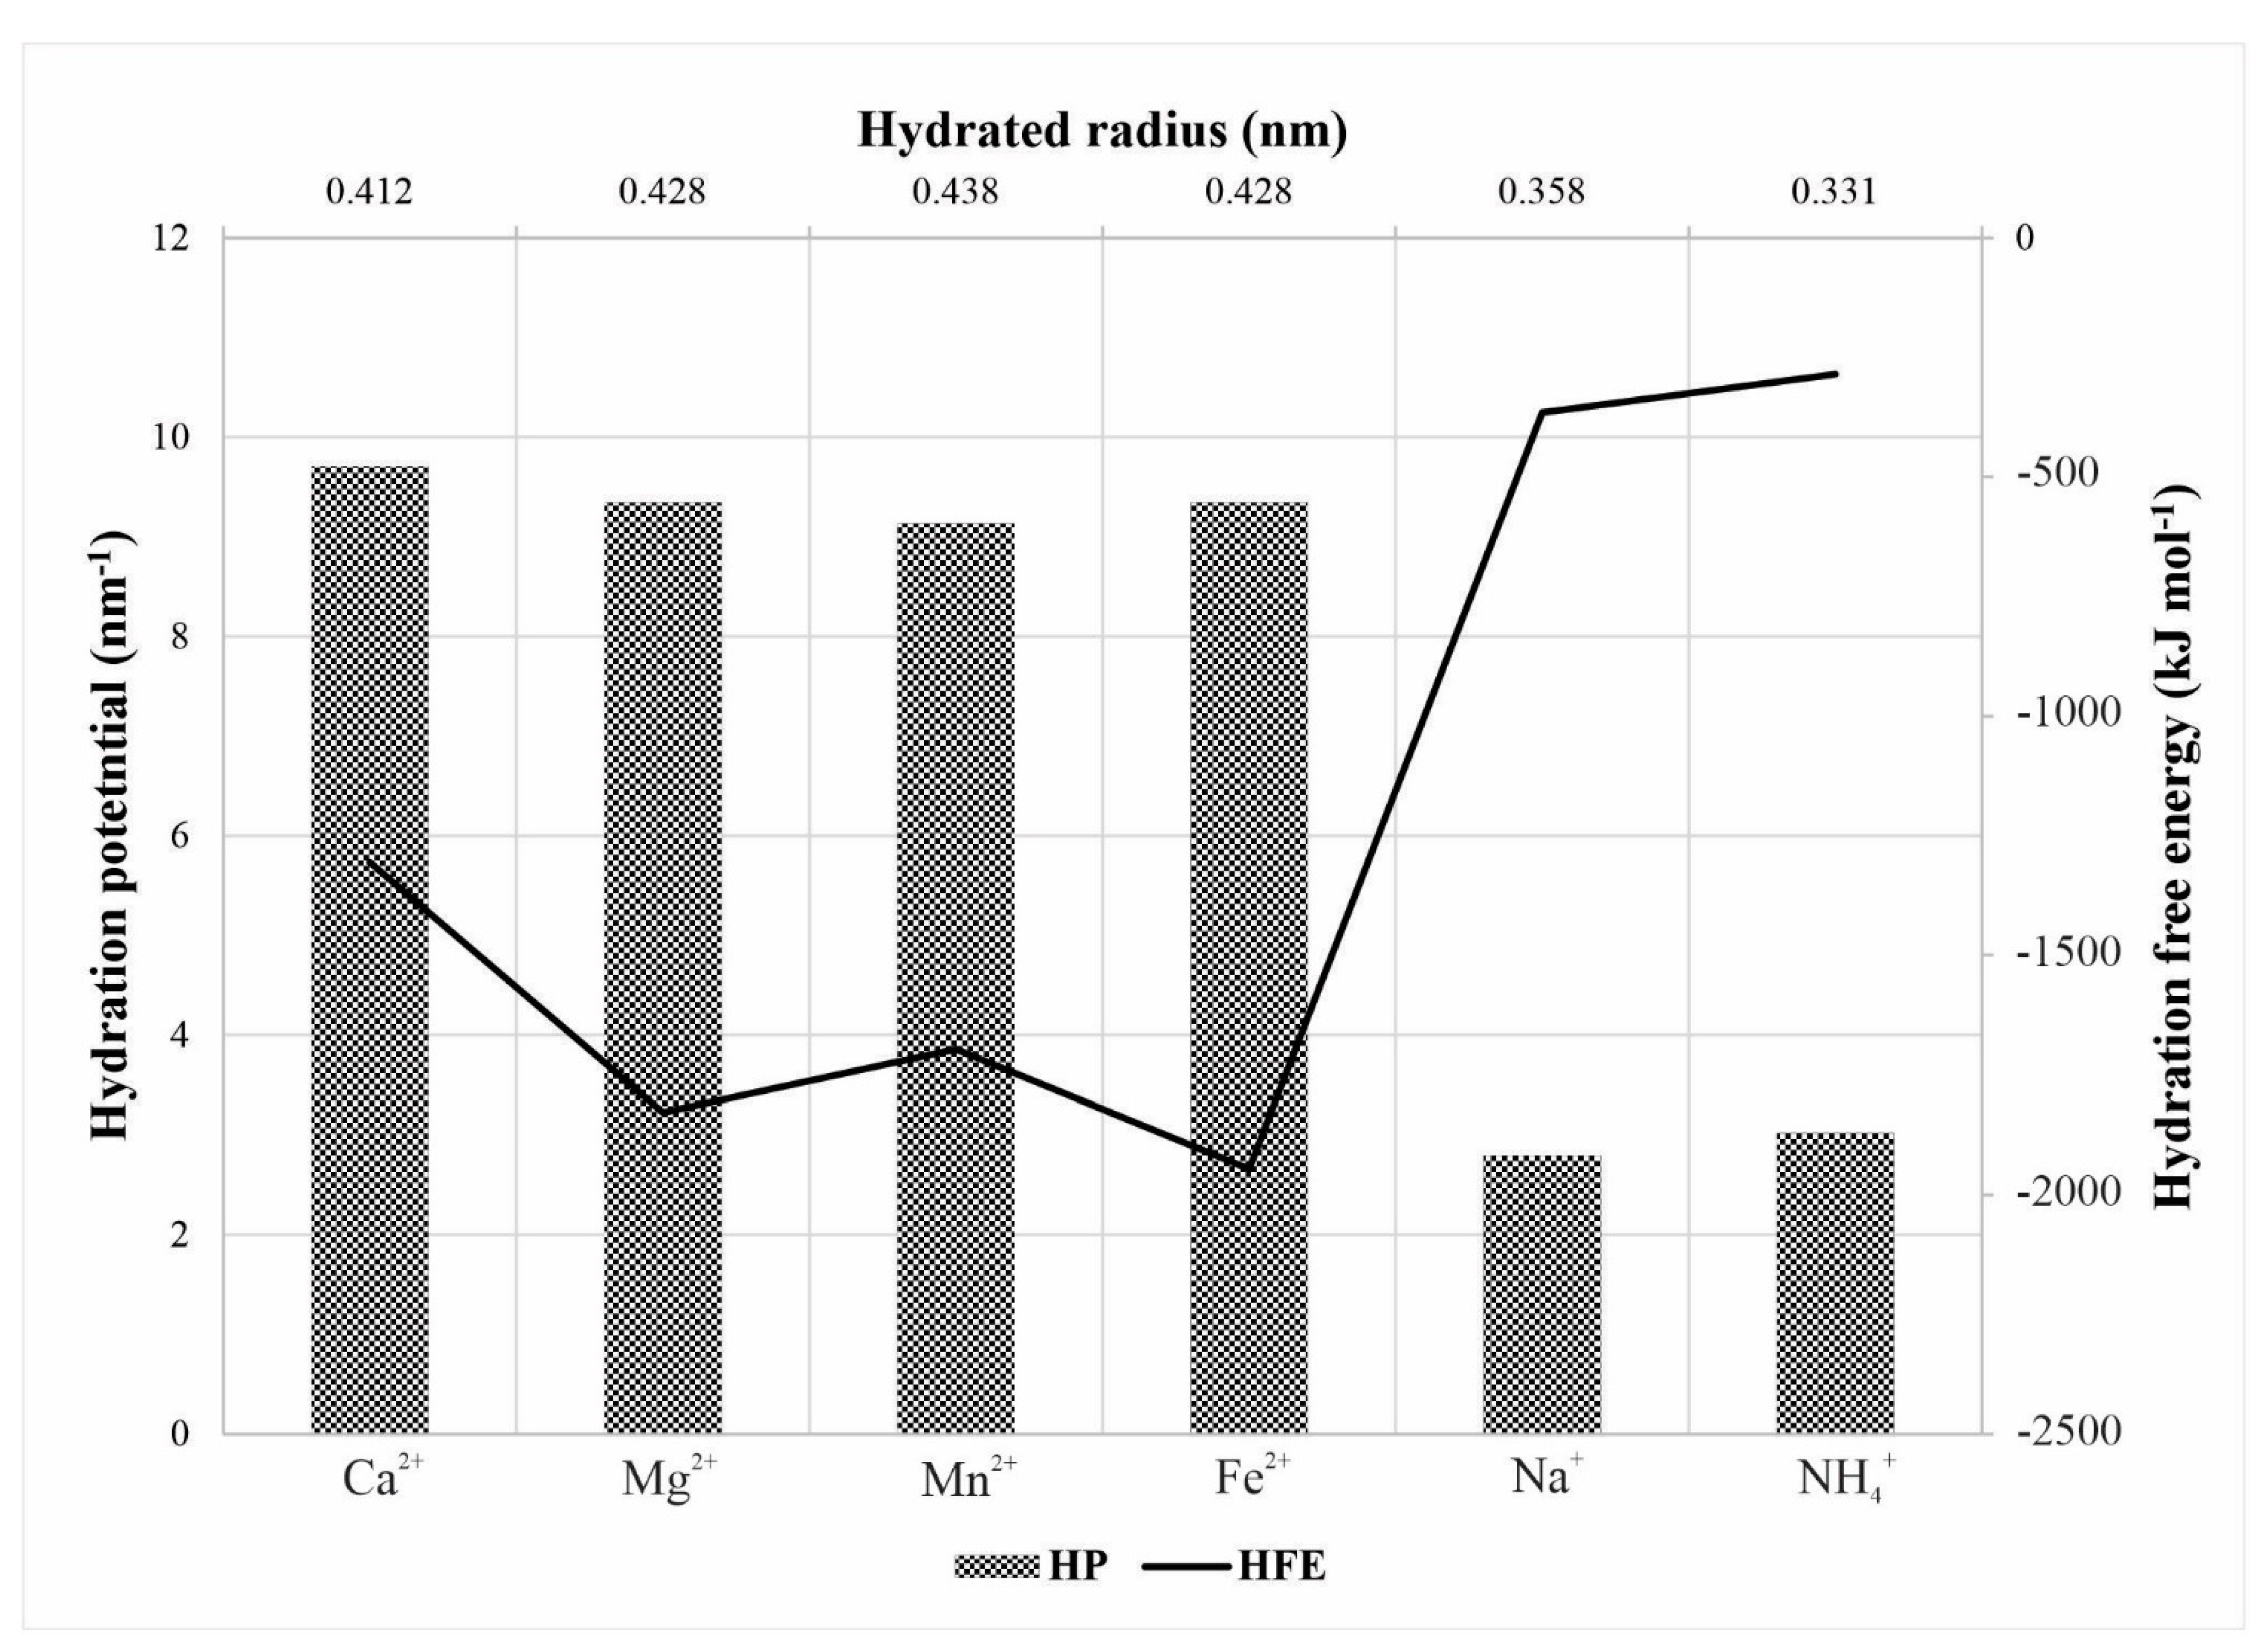
2.4. Characteristics of Hydrated Cations
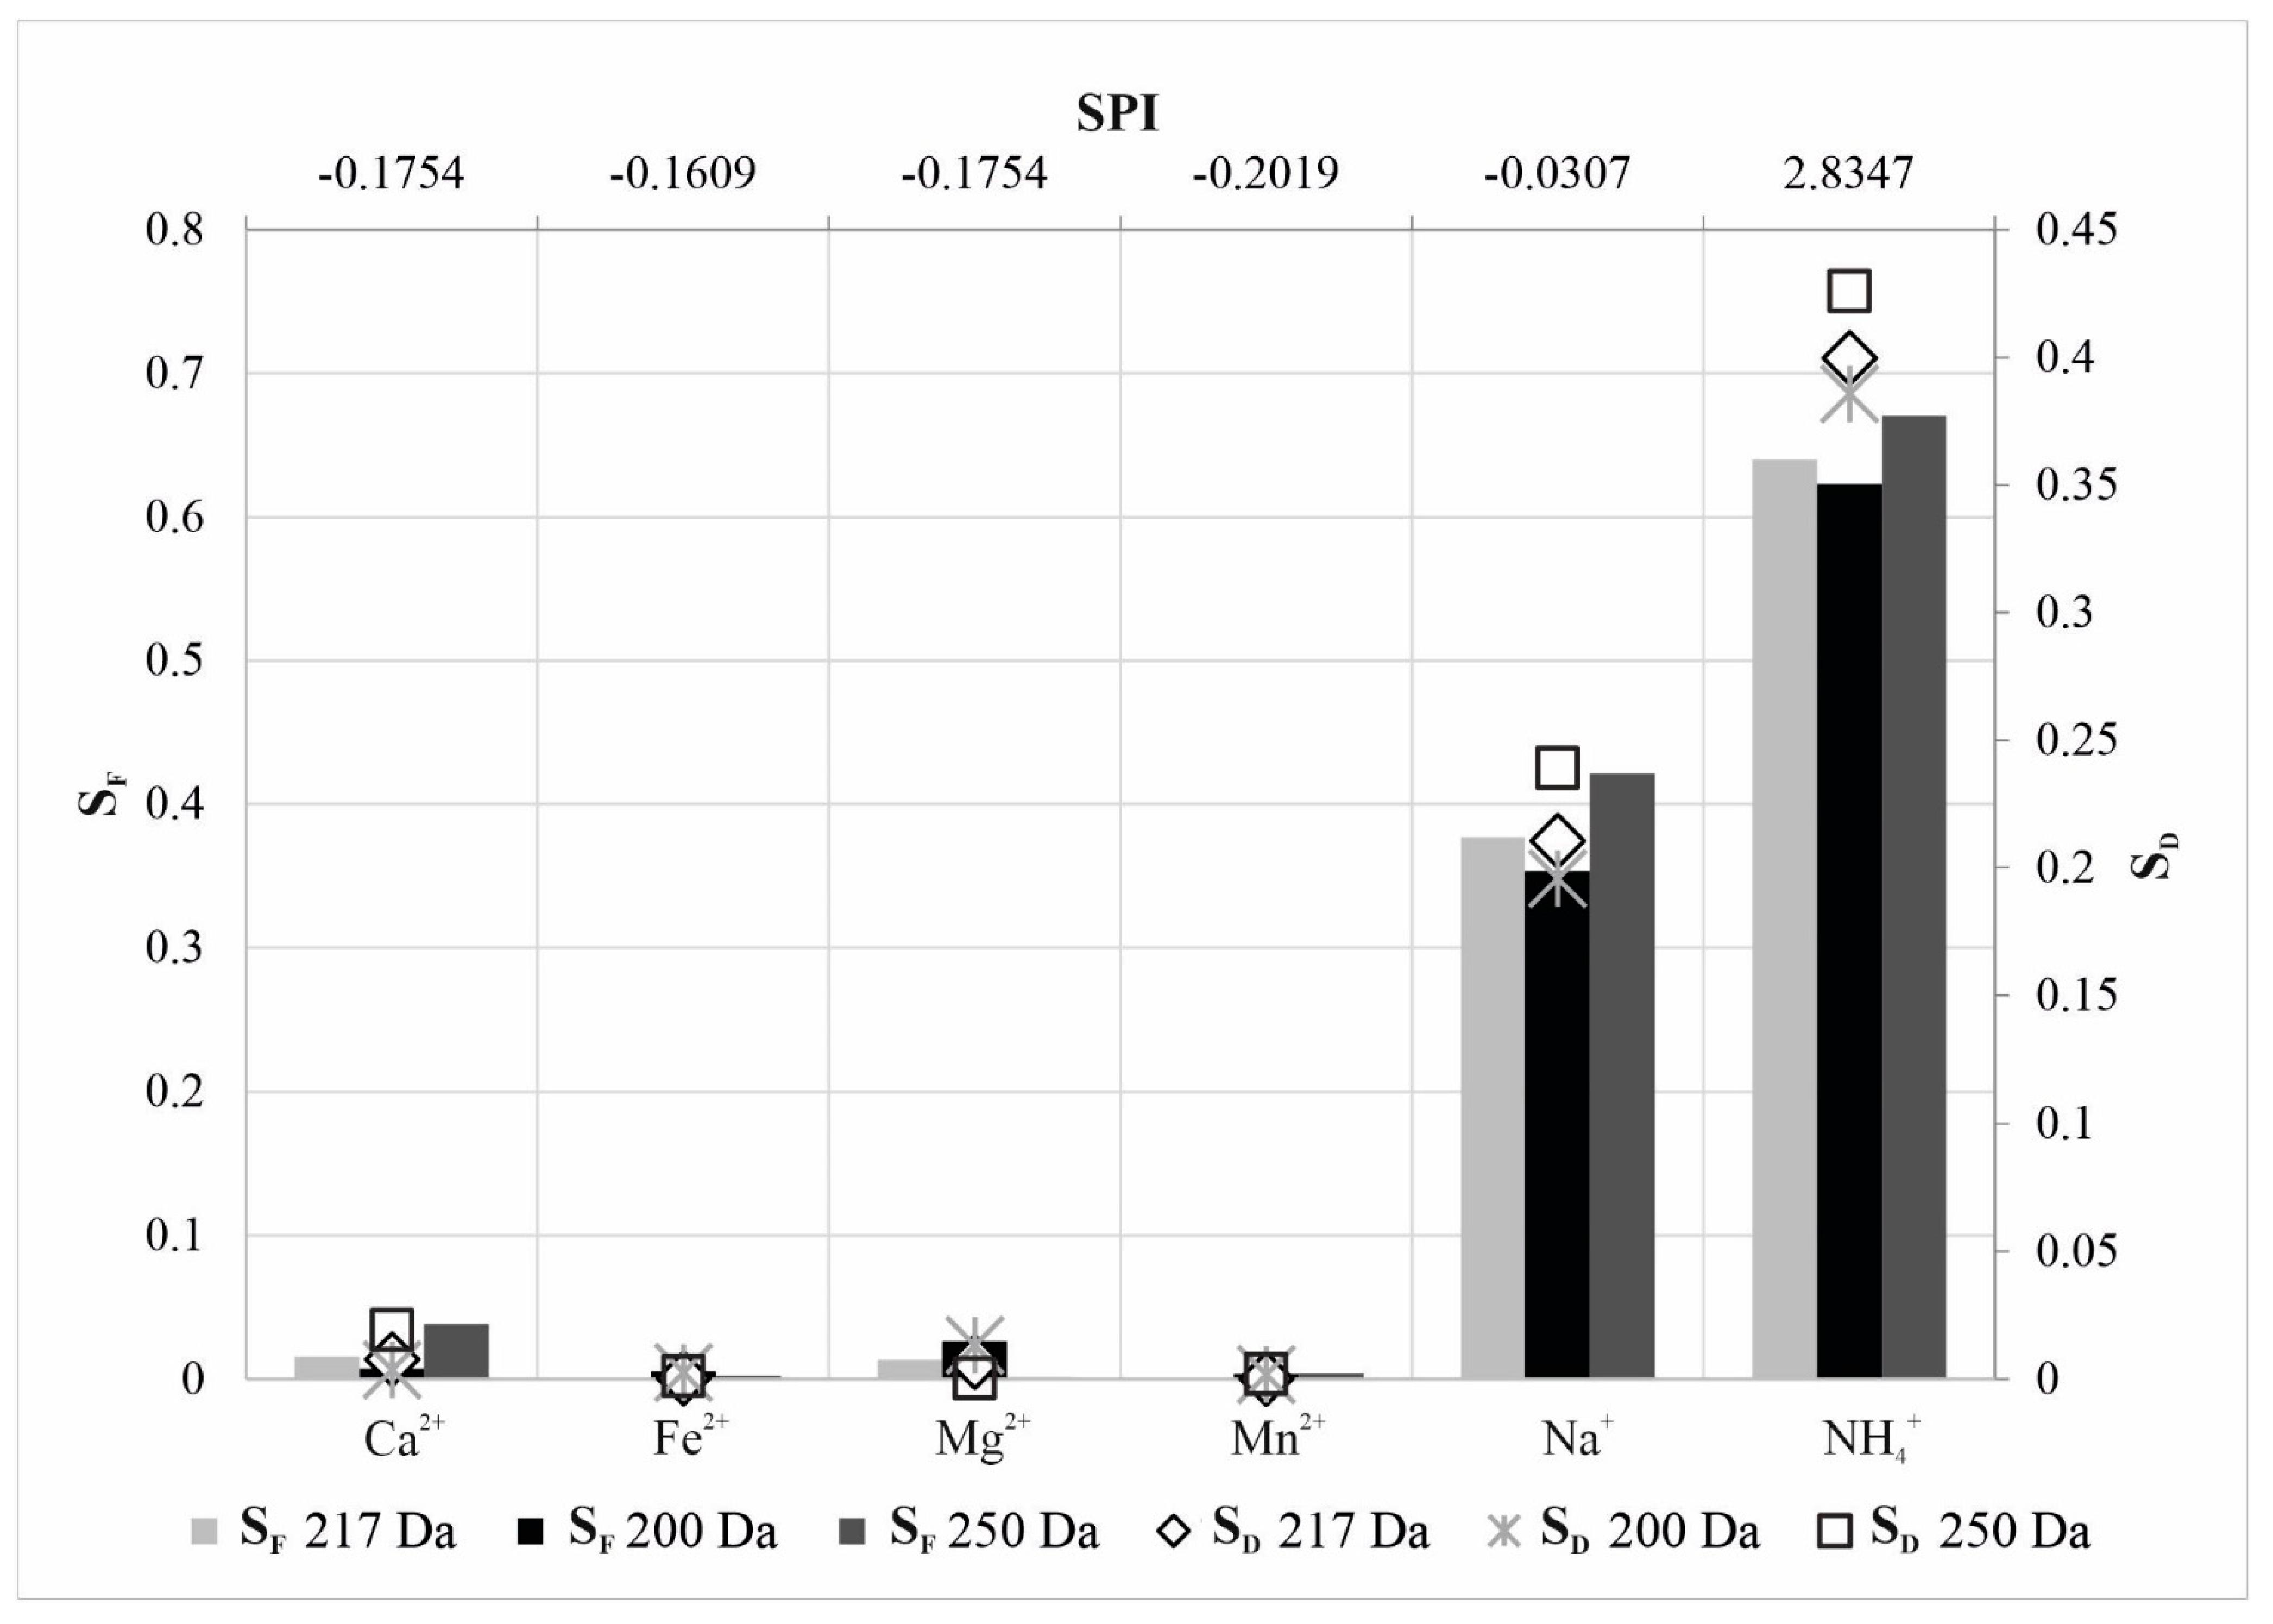
2.5. Steric Hindrance Factors
3. Results and Discussion
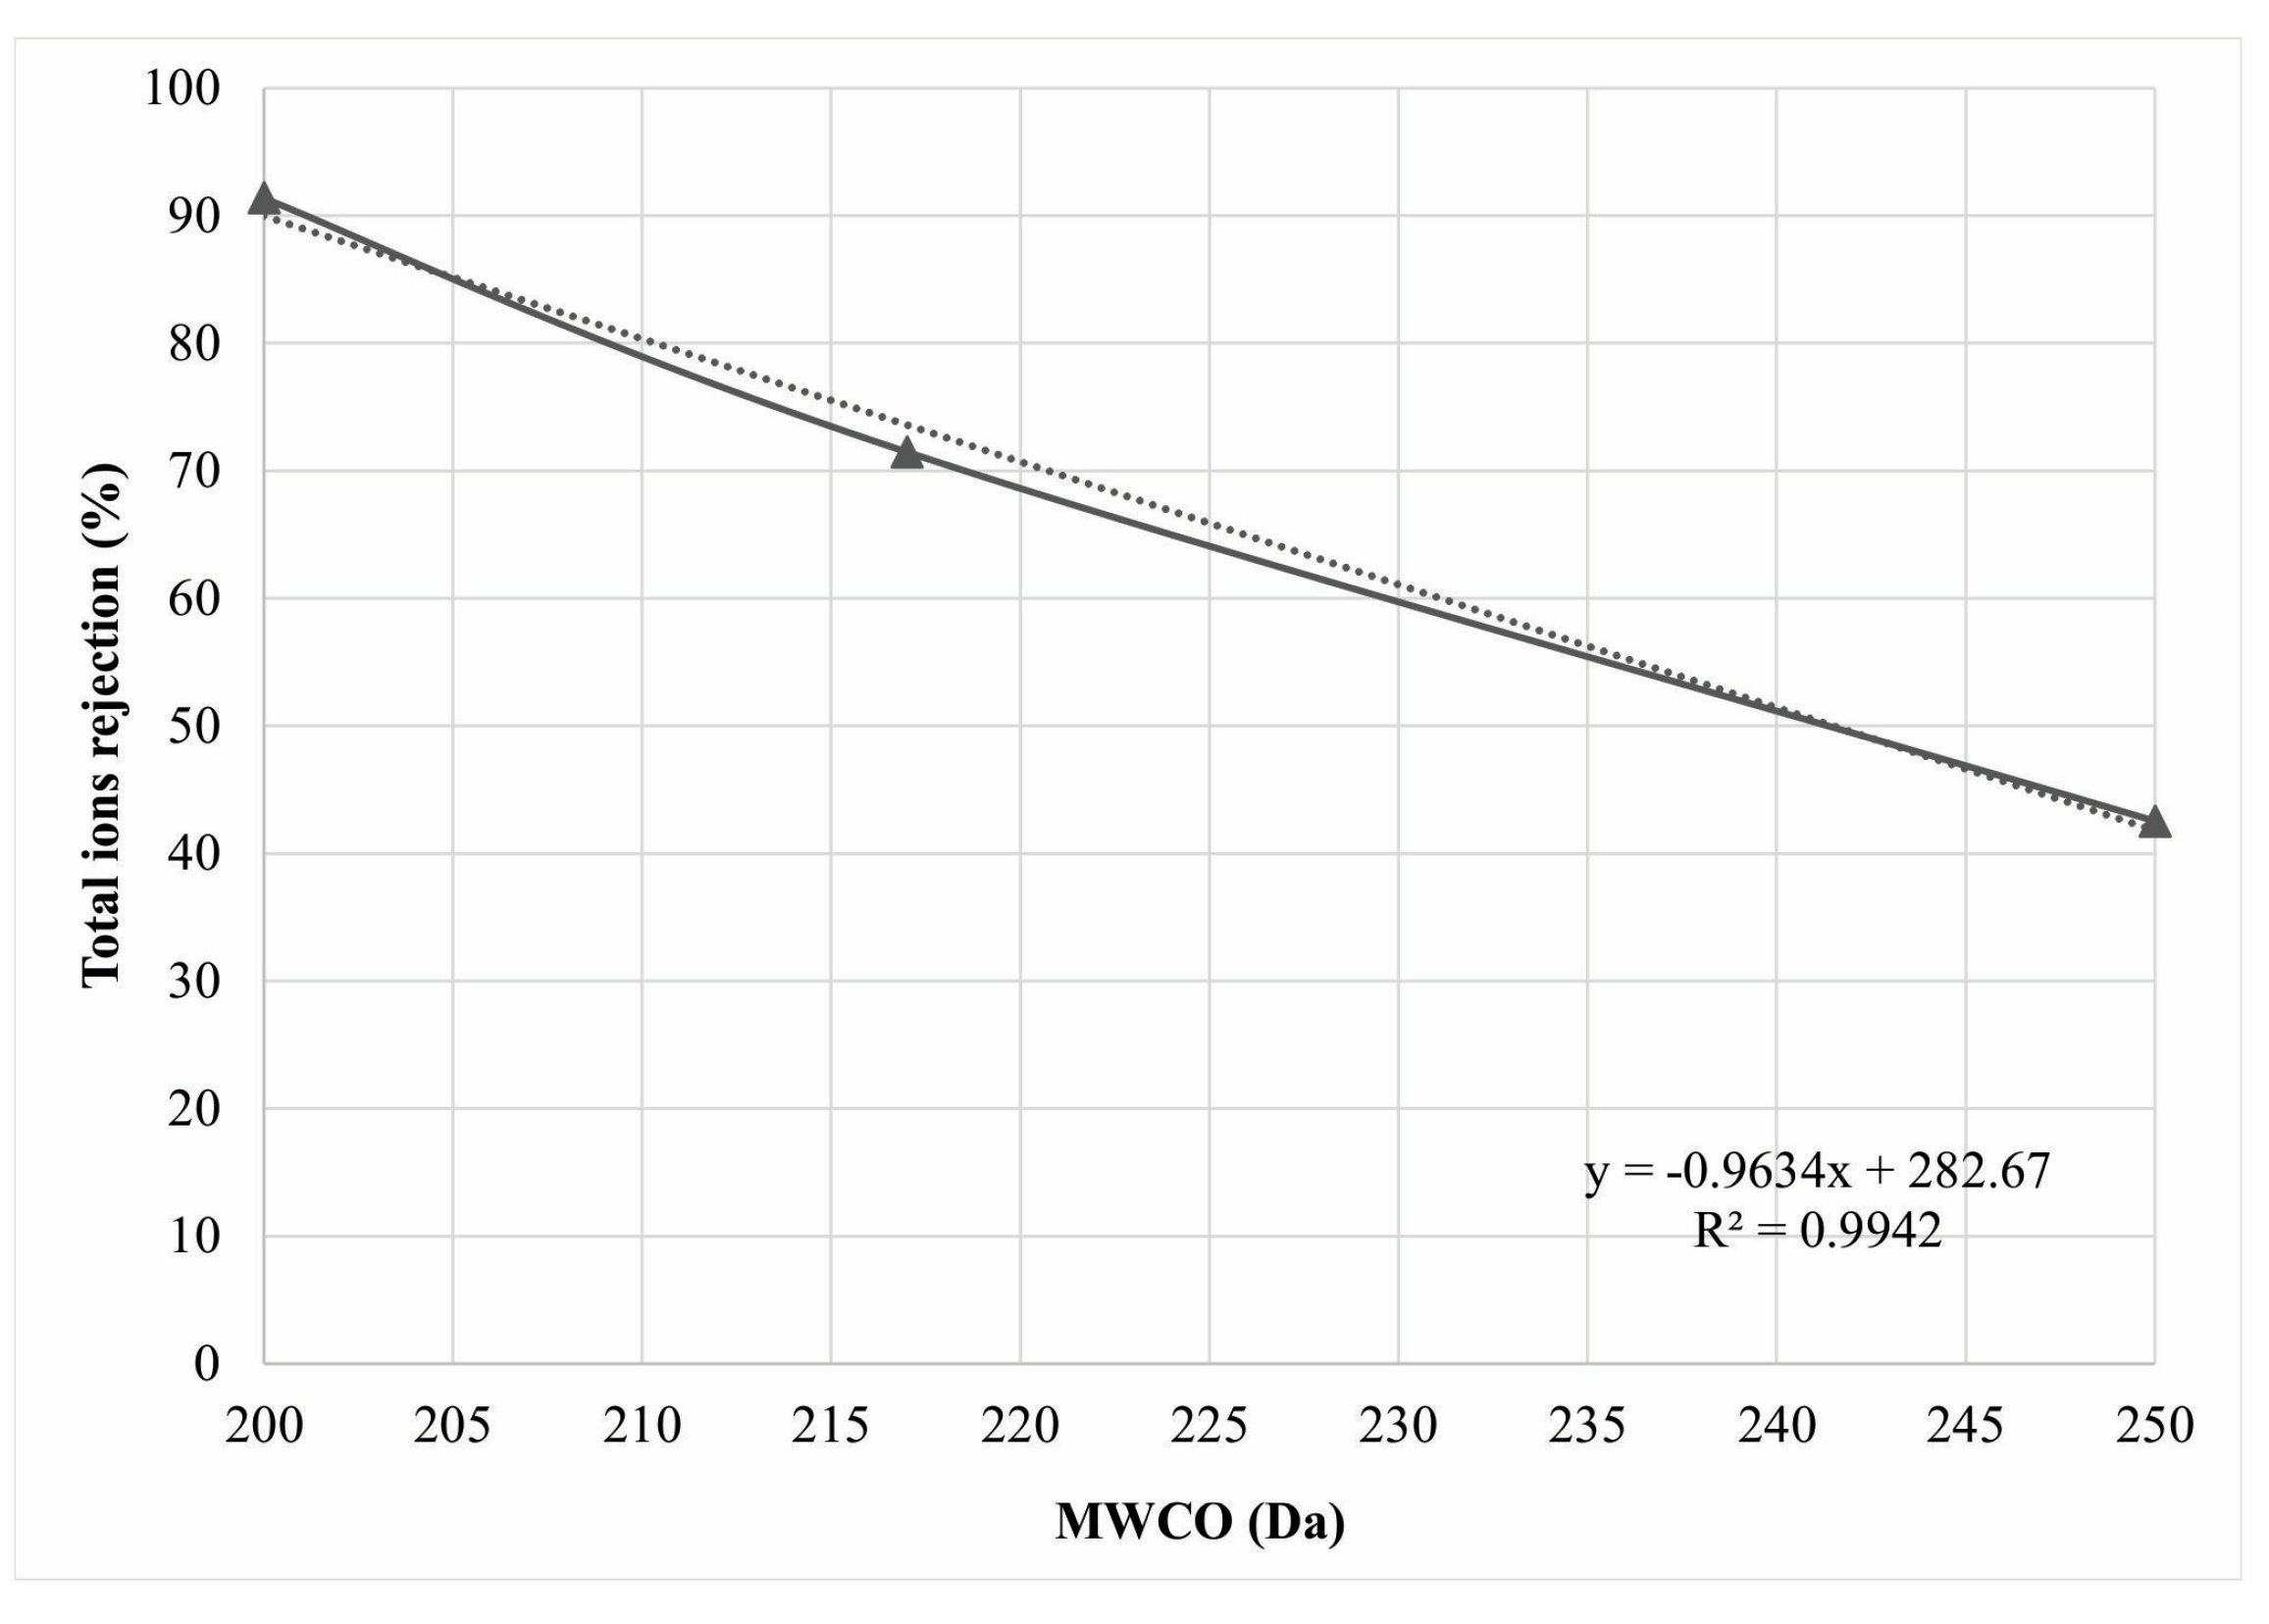
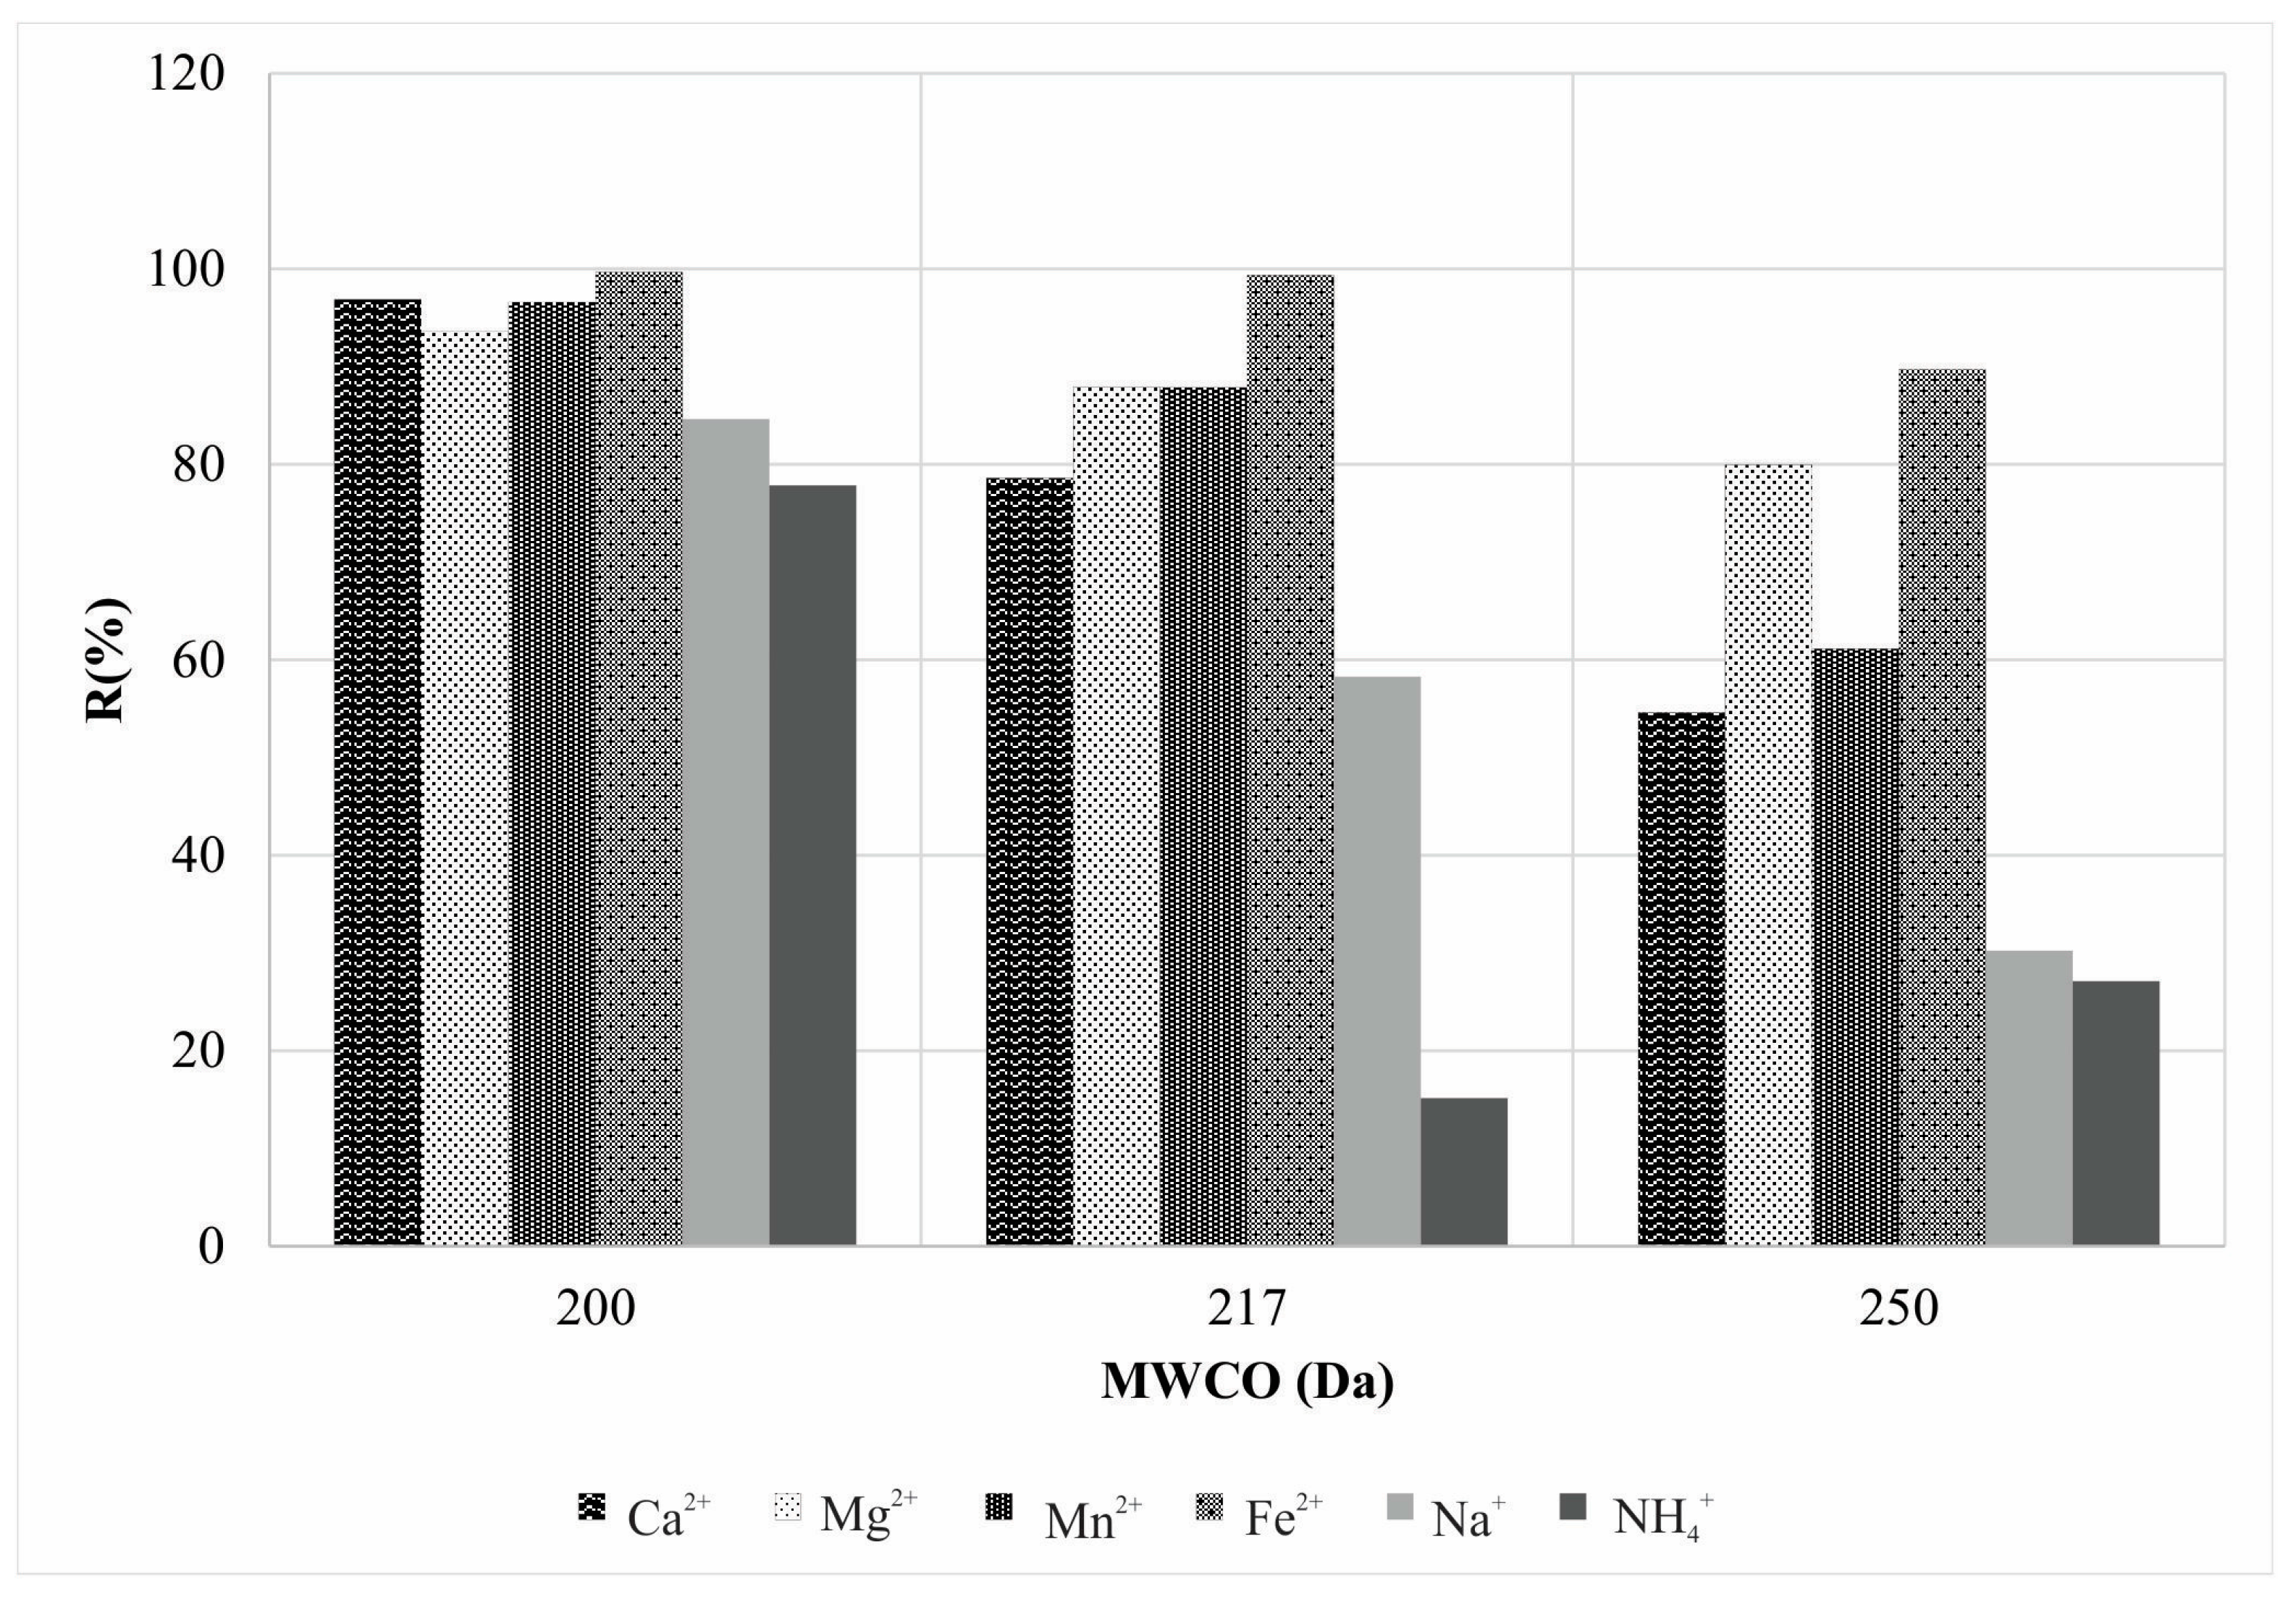
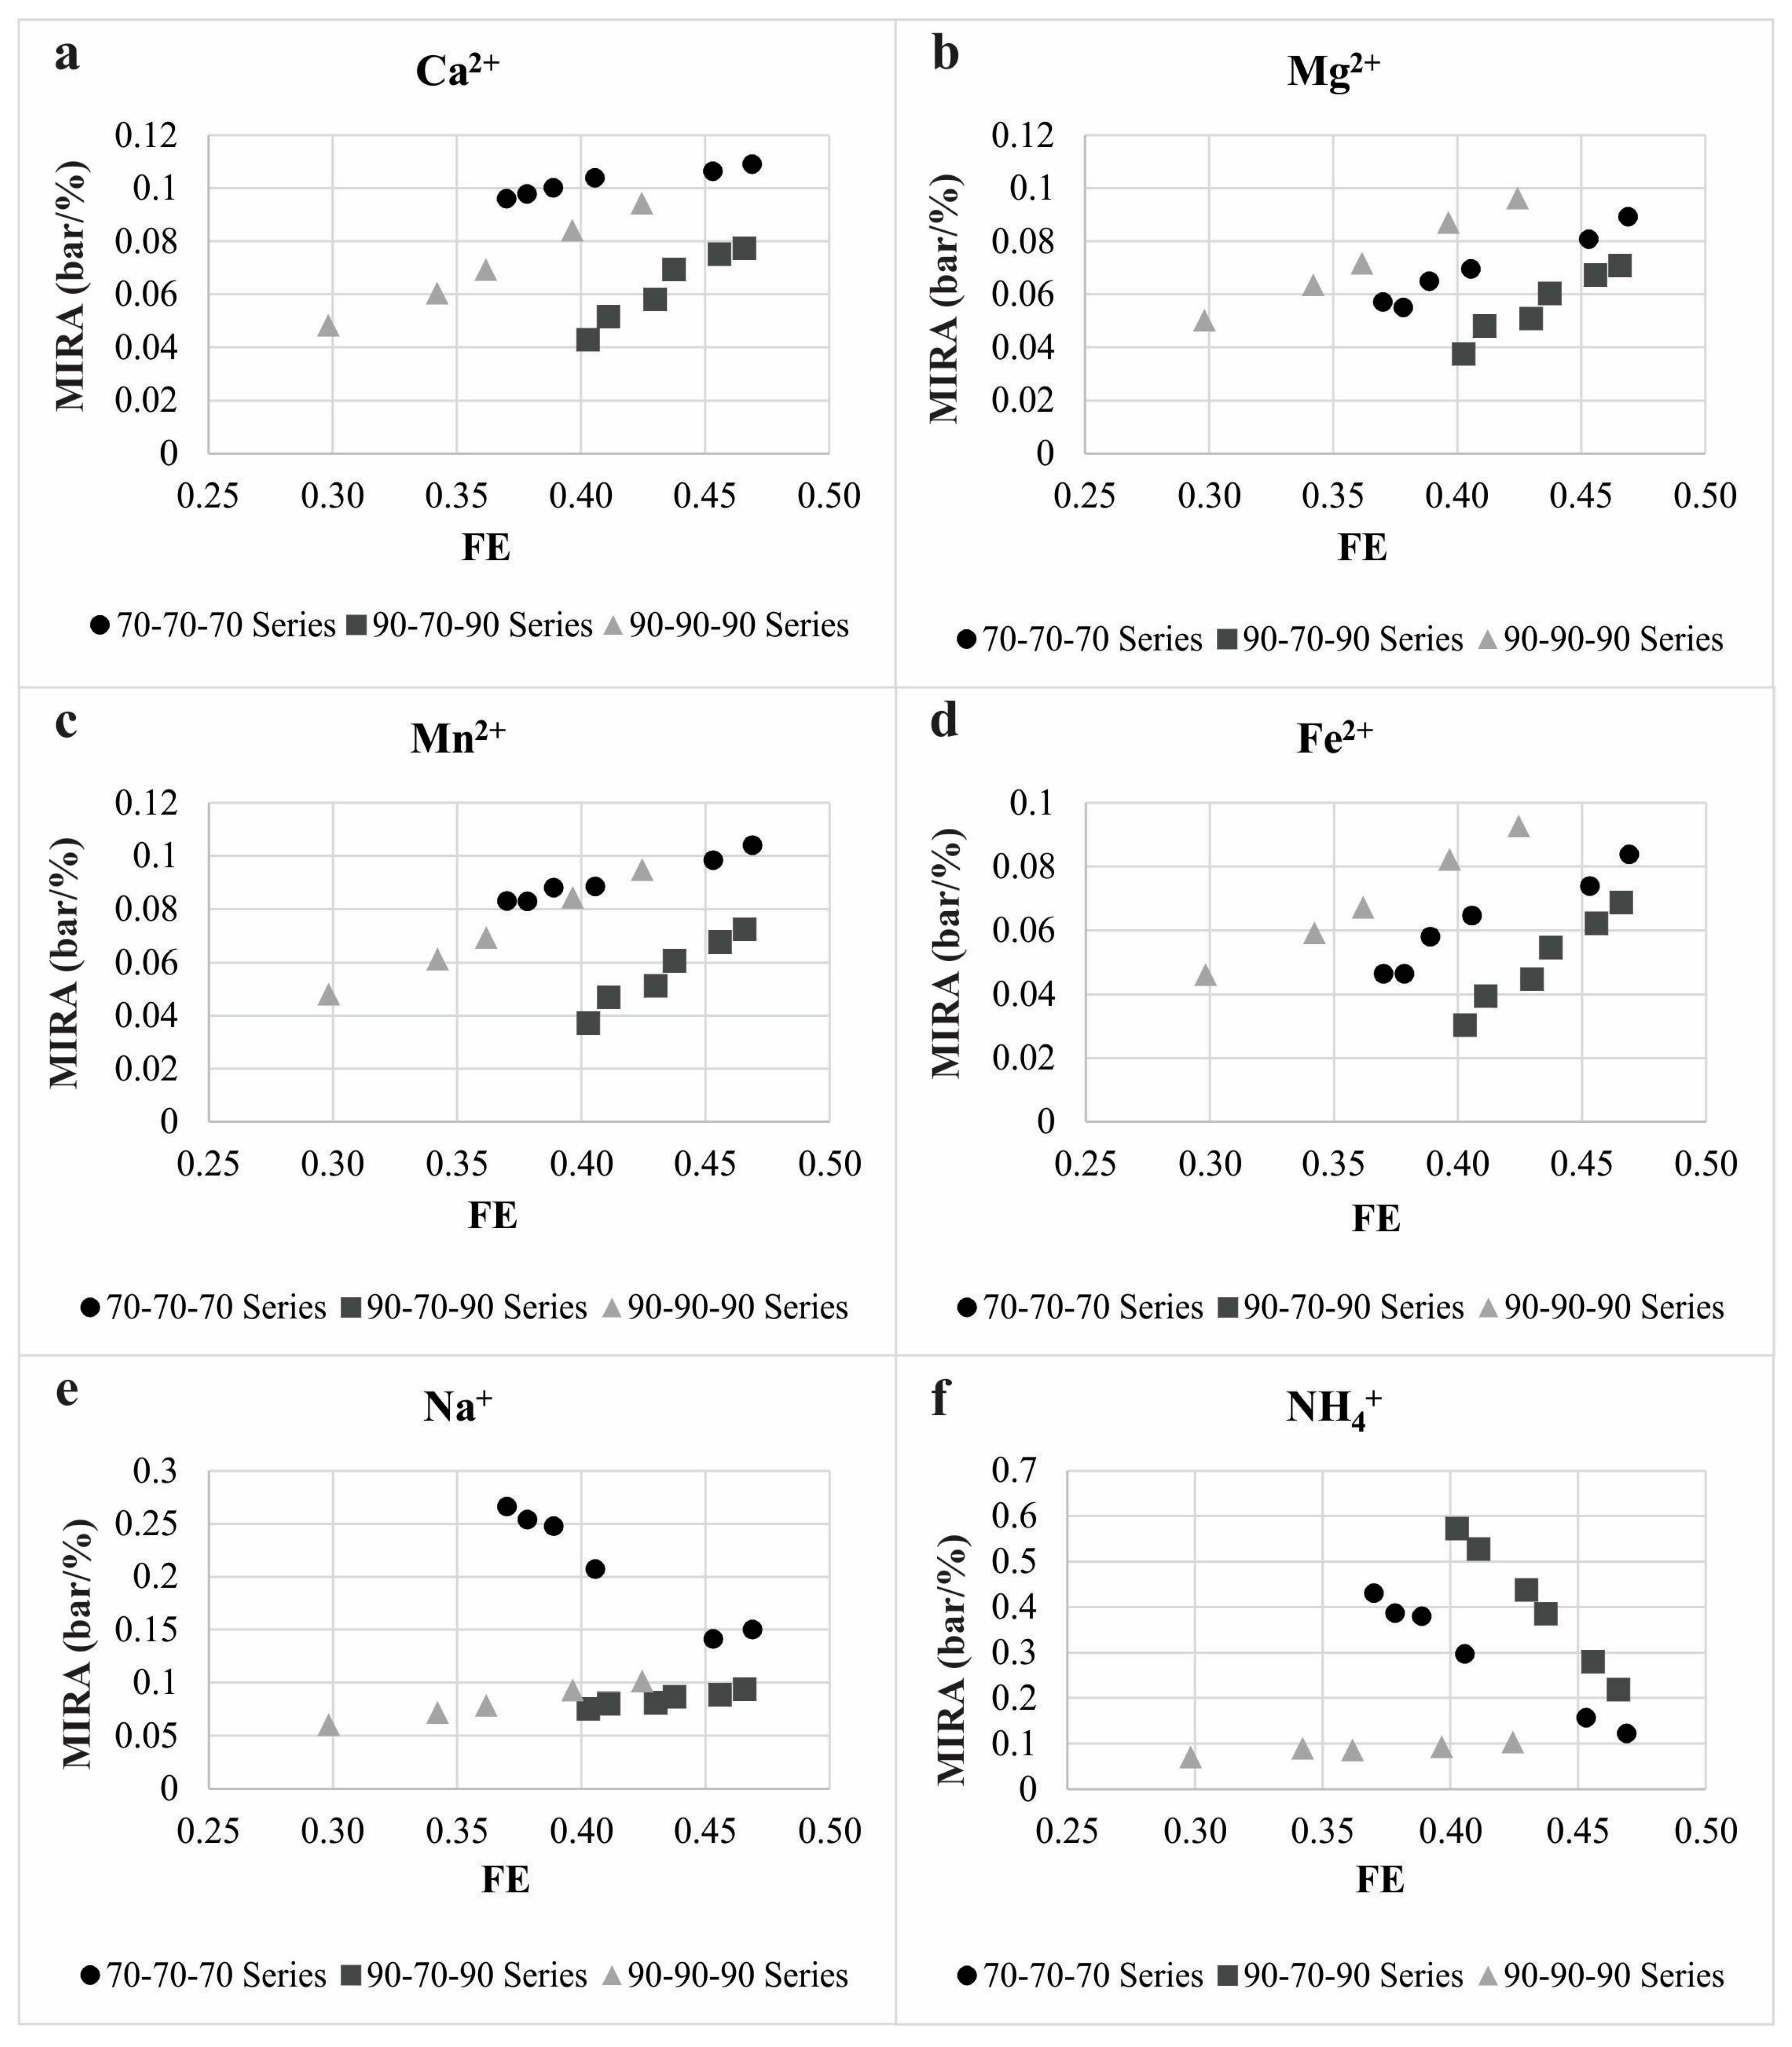
3.1. The Cation Rejection and Permeability Behavior of the Membrane
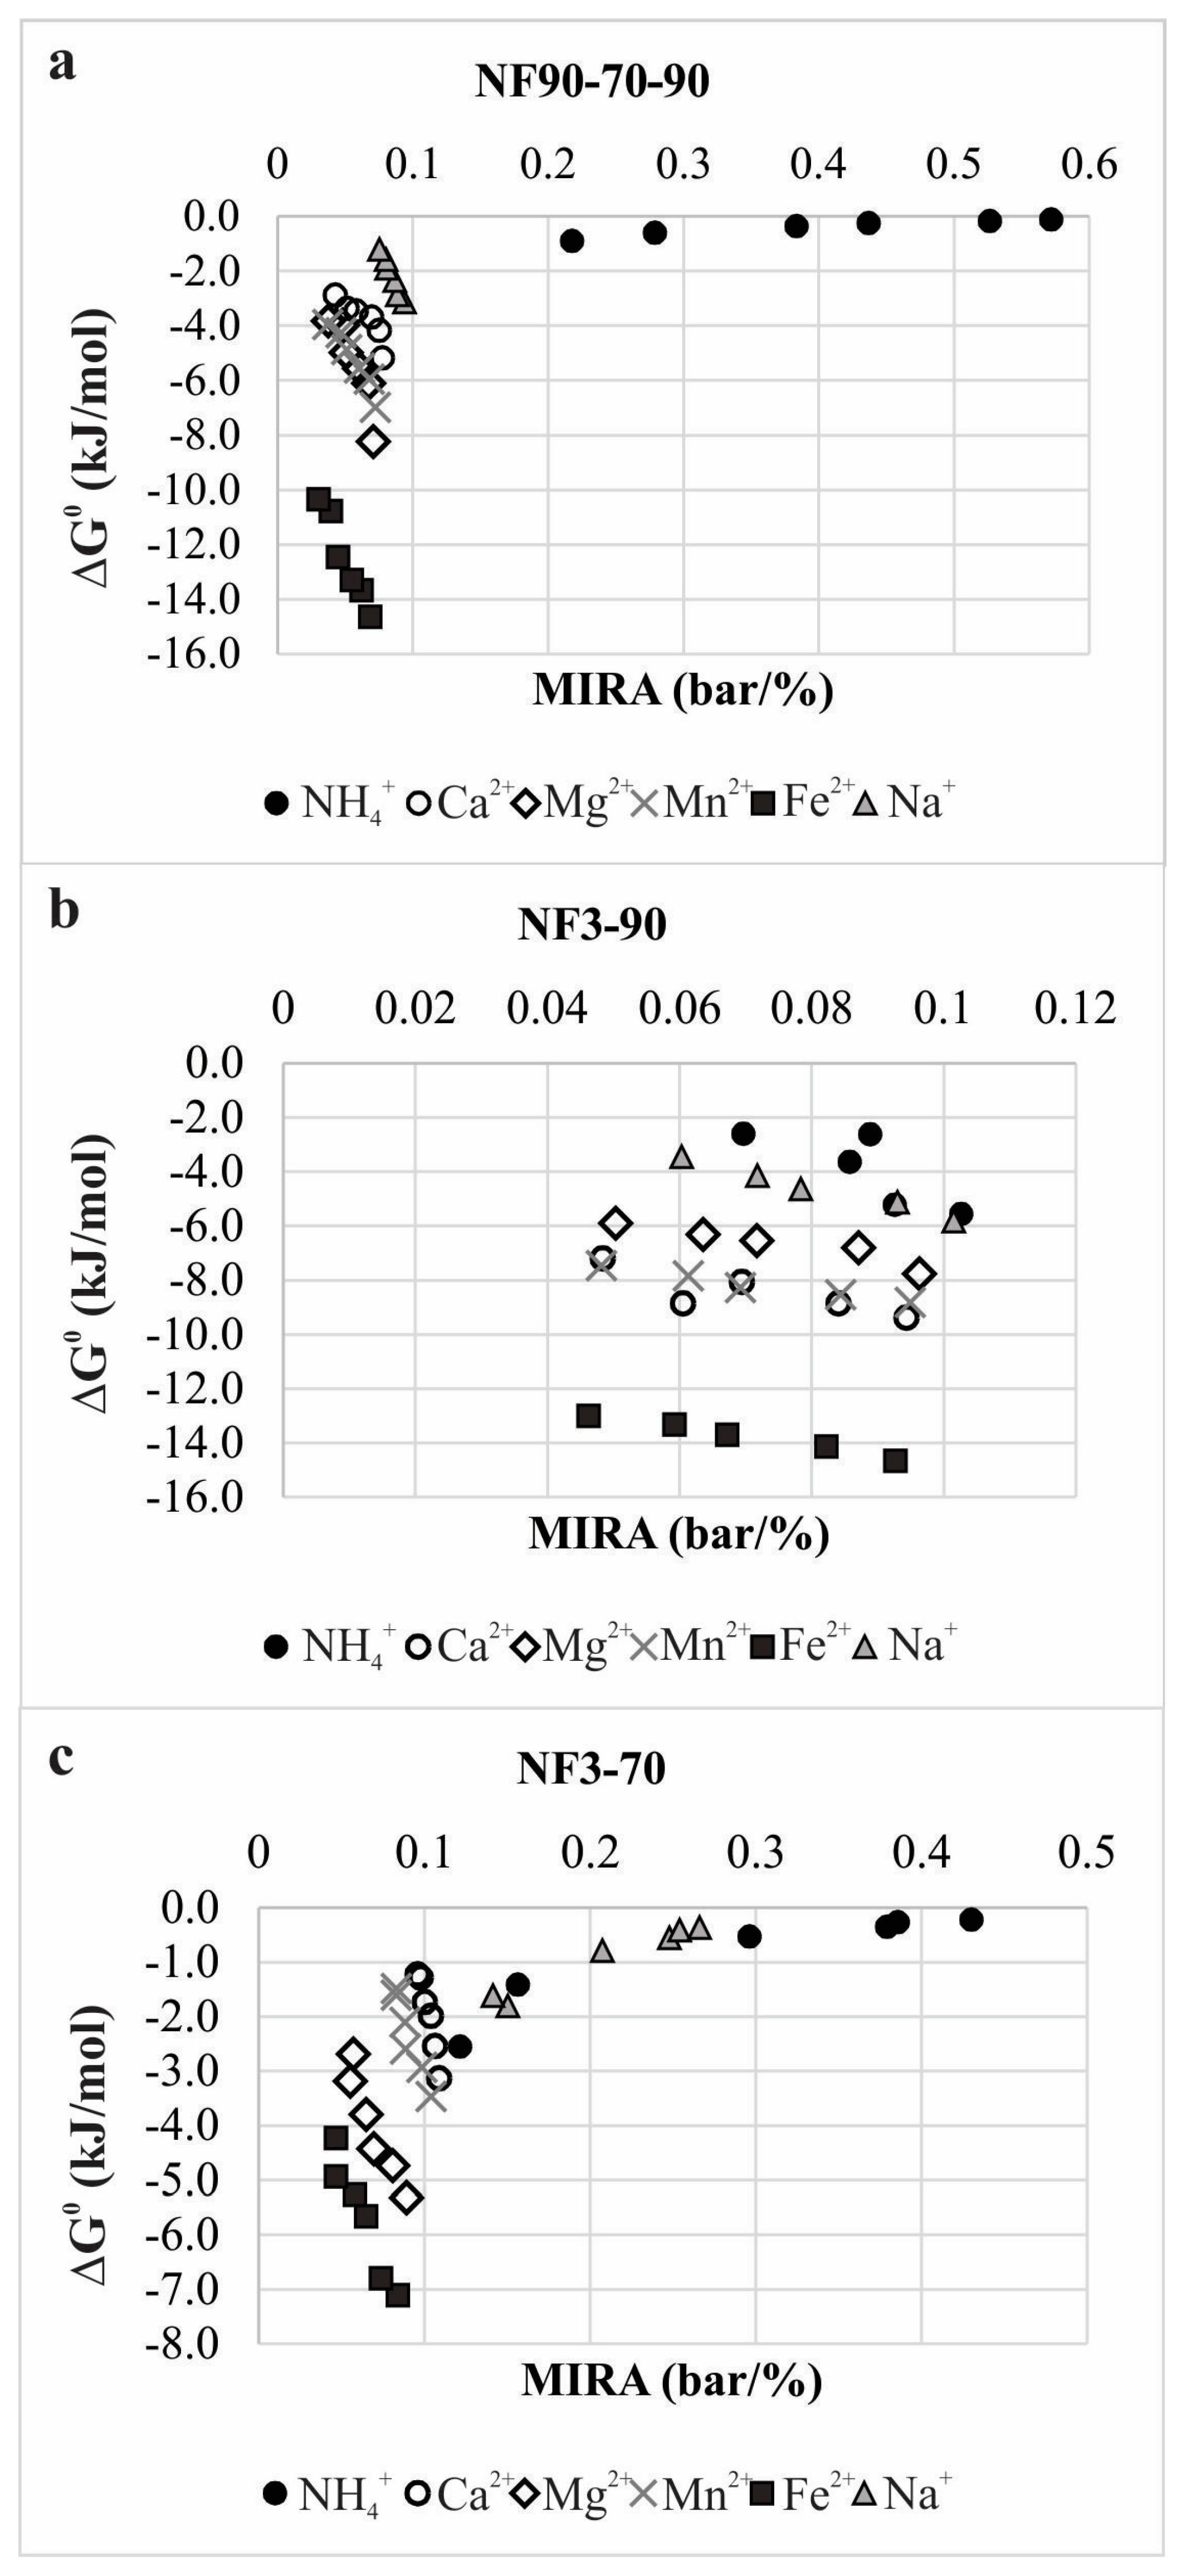
3.2. The Membrane Separation Process Thermodynamics
4. Conclusions
Supplementary Materials
Author Contributions
Funding
Institutional Review Board Statement
Informed Consent Statement
Data Availability Statement
Acknowledgments
Conflicts of Interest
References
- Ruiz-García, A.; Carrascosa-Chisvert, M.D.; Mena, V.; Souto, R.M.; Santana, J.J.; Nuez, I. Groundwater Quality Assessment in a Volcanic Mountain Range (South of Gran Canaria Island, Spain). Water 2019, 11, 754. [Google Scholar] [CrossRef] [Green Version]
- Chilton, J. Groundwater. In Water Quality Assessments—A Guide to Use of Biota, Sediments and Water in Environmental Monitoring, 2nd ed.; Chapman, D., Ed.; E&FN Spon: Cambridge, UK, 1996. [Google Scholar]
- Song, Y.; Li, T.; Zhou, J.; Li, Z.; Gao, C. Analysis of nanofiltration membrane performance during softening process of simulated brackish groundwater. Desalination 2016, 399, 159–164. [Google Scholar] [CrossRef]
- Vargas, C.; Bórquez, R. Evaluation of the operation seawater and brackish water desalination system using two-pass nanofiltration. Desalin. Water Treat. 2020, 204, 50–58. [Google Scholar] [CrossRef]
- Cai, Y.-H.; Yang, X.J.; Schäfer, A.I. Removal of Naturally Occurring Strontium by Nanofiltration/Reverse Osmosis from Groundwater. Membranes 2020, 10, 321. [Google Scholar] [CrossRef]
- Ruiz-García, A.; Dimitriou, E.; Nuez, I. Retrofitting assessment of a full-scale brackish water reverse osmosis desalination plant with a feed capacity of 600 m3/d. Desalin. Water Treat. 2019, 144, 72–78. [Google Scholar] [CrossRef]
- Labbez, C.; Fievet, P.; Szymczyk, A.; Vidonne, A.; Foissy, A.; Pagetti, J. Retention of mineral salts by a polyamide nanofiltration membrane. Sep. Purif. Technol. 2003, 30, 47–55. [Google Scholar] [CrossRef]
- Xu, P.; Wang, W.; Qian, X.; Wang, H.; Guo, C.; Li, N.; Xu, Z.; Teng, K.; Wang, Z. Positive charged PEI-TMC composite nanofiltration membrane for separation of Li+ and Mg2+ from brine with high Mg2+/Li+ ratio. Desalination 2019, 449, 57–68. [Google Scholar] [CrossRef]
- Jin, P.; Robeyn, M.; Zheng, J.; Yuan, S.; Van der Bruggen, B. Tailoring Charged Nanofiltration Membrane Based on Non-Aromatic Tris(3-aminopropyl)amine for Effective Water Softening. Membranes 2020, 10, 251. [Google Scholar] [CrossRef] [PubMed]
- Tansel, B.; Sager, J.; Rector, T.; Garland, J.; Strayer, R.F.; Levine, L.; Roberts, M.; Hummerick, M.; Bauer, J. Significance of hydrated radius and hydration shells on ionic permeability during nanofiltration in dead end and cross flow modes. Sep. Purif. Technol. 2006, 51, 40–47. [Google Scholar] [CrossRef]
- Tansel, B. Significance of thermodynamic and physical characteristics on permeation of ions during membrane separation: Hydrated radius, hydration free energy and viscous effects. Sep. Purif. Technol. 2012, 86, 119–126. [Google Scholar] [CrossRef]
- Roy, Y.; Lienhard, J.H. Factors contributing to the change in permeate quality upon temperature variation in nanofiltration. Desalination 2019, 455, 58–70. [Google Scholar] [CrossRef]
- Zhang, Z.; Wadekar, S.S.; Lokare, O.R.; Vidic, R.D. Comparison of calcium scaling in direct contact membrane distillation (DCMD) and nanofiltration (NF). J. Membr. Sci. 2021, 638, 119647. [Google Scholar] [CrossRef]
- Lin, D.; Bai, L.; Xu, D.; Zhang, H.; Guo, T.; Li, G.; Liang, H. Effects of oxidation on humic-acid-enhanced gypsum scaling in different nanofiltration phases: Performance, mechanisms and prediction by differential log-transformed absorbance spectroscopy. Water Res. 2021, 195, 116989. [Google Scholar] [CrossRef] [PubMed]
- Yu, W.; Song, D.; Chen, W.; Yang, H. Antiscalants in RO membrane scaling control. Water Res. 2020, 183, 115985. [Google Scholar] [CrossRef] [PubMed]
- Ruiz-García, A.; Feo-García, J. Estimation of maximum water recovery in RO desalination for different feedwater inorganic compositions. Desalin. Water Treat. 2017, 70, 34–45. [Google Scholar] [CrossRef]
- Mitko, K.; Laskowska, E.; Turek, M.; Dydo, P.; Piotrowski, K. Scaling Risk Assessment in Nanofiltration of Mine Waters. Membranes 2020, 10, 288. [Google Scholar] [CrossRef]
- Hao, Y.; Li, Q.; He, B.; Liao, B.; Li, X.; Hu, M.; Ji, Y.; Cui, Z.; Younas, M.; Li, J. An ultrahighly permeable-selective nanofiltration membrane mediated by an in situ formed interlayer. J. Mater. Chem. A 2020, 8, 5275–5283. [Google Scholar] [CrossRef]
- Zhang, S.; Guan, S.; Liu, C.; Wang, Z.; Wang, D.; Jian, X. Effect of Chemical Structure on the Performance of Sulfonated Poly(aryl ether sulfone) Composite Nanofiltration Membranes. Membranes 2019, 9, 6. [Google Scholar] [CrossRef] [Green Version]
- Rho, H.; Chon, K.; Cho, J. Surface charge characterization of nanofiltration membranes by potentiometric titrations and electrophoresis: Functionality vs. zeta potential. Desalination 2018, 427, 19–26. [Google Scholar] [CrossRef]
- Luo, J.; Wan, Y. Effects of pH and salt on nanofiltration—A critical review. J. Membr. Sci. 2013, 438, 18–28. [Google Scholar] [CrossRef]
- Roy, Y.; Warsinger, D.M.; Lienhard, J.H. Effect of temperature on ion transport in nanofiltration membranes: Diffusion, convection and electromigration. Desalination 2017, 420, 241–257. [Google Scholar] [CrossRef]
- Labban, O.; Liu, C.; Chong, T.H. Fundamentals of low-pressure nanofiltration: Membrane characterization, modeling, and understanding the multi-ionic interactions in water softening. J. Membr. Sci. 2017, 521, 18–32. [Google Scholar] [CrossRef]
- Dizge, N.; Epsztein, R.; Cheng, W.; Porter, C.J.; Elimelech, M. Biocatalytic and salt selective multilayer polyelectrolyte nanofiltration membrane. J. Membr. Sci. 2018, 549, 357–365. [Google Scholar] [CrossRef]
- Bonner, R.; Germishuizen, C.; Franzsen, S. Prediction of nanofiltration rejection performance in brackish water reverse osmosis brine treatment processes. J. Water Process Eng. 2019, 32, 100900. [Google Scholar] [CrossRef]
- Van der Bruggen, B.; Koninckx, A.; Vandecasteele, C. Separation of monovalent and divalent ions from aqueous solution by electrodialysis and nanofiltration. Water Res. 2004, 38, 1347–1353. [Google Scholar] [CrossRef]
- Deen, W.M. Hindered transport of large molecules in liquid-filled pores. AICHE J. 1987, 33, 1409–1425. [Google Scholar] [CrossRef]
- Fang, W.; Shi, L.; Wang, R. Mixed polyamide-based composite nanofiltration hollow fiber membranes with improved low-pressure water softening capability. J. Membr. Sci. 2014, 468, 52–61. [Google Scholar] [CrossRef]
- Zhao, S.; Wang, Z. A loose nano-filtration membrane prepared by coating HPAN UF membrane with modified PEI for dye reuse and desalination. J. Membr. Sci. 2017, 524, 214–224. [Google Scholar] [CrossRef]
- Van der Bruggen, B.; Vandecasteele, C. Modelling of the retention of uncharged molecules with nanofiltration. Water Res. 2002, 36, 1360–1368. [Google Scholar] [CrossRef]
- Epsztein, R.; Shaulsky, E.; Dizge, N.; Warsinger, D.M.; Elimelech, M. Role of Ionic Charge Density in Donnan Exclusion of Monovalent Anions by Nanofiltration. Environ. Sci. Technol. 2018, 52, 4108–4116. [Google Scholar] [CrossRef]
- Bowen, W.R.; Mohammad, A.W.; Hilal, N. Characterisation of nanofiltration membranes for predictive purposes—Use of salts, uncharged solutes and atomic force microscopy. J. Membr. Sci. 1997, 126, 91–105. [Google Scholar] [CrossRef]
- Hwang, S.-T. Nonequilibrium thermodynamics of membrane transport. AICHE J. 2004, 50, 862–870. [Google Scholar] [CrossRef]
- Adapa, S.; Malani, A. Role of hydration energy and co-ions association on monovalent and divalent cations adsorption at mica-aqueous interface. Sci. Rep. 2018, 8, 12198. [Google Scholar] [CrossRef] [PubMed]
- Radke, C.J. Gibbs adsorption equation for planar fluid–fluid interfaces: Invariant formalism. Adv. Colloid Interface Sci. 2015, 222, 600–614. [Google Scholar] [CrossRef] [PubMed] [Green Version]
- Shen, M.; Keten, S.; Lueptow, R.M. Rejection mechanisms for contaminants in polyamide reverse osmosis membranes. J. Membr. Sci. 2016, 509, 36–47. [Google Scholar] [CrossRef] [Green Version]
- Meschke, K.; Hansen, N.; Hofmann, R.; Haseneder, R.; Repke, J.-U. Influence of process parameters on separation performance of strategic elements by polymeric nanofiltration membranes. Sep. Purif. Technol. 2020, 235, 116186. [Google Scholar] [CrossRef]
- Kéba Diawara, C.; Paugam, L.; Pontié, M.; Pierre Schlumpf, J.; Jaouen, P.; Quéméneur, F. Influence of Chloride, Nitrate, and Sulphate on the Removal of Fluoride Ions by Using Nanofiltration Membranes. Sep. Sci. Technol. 2005, 40, 3339–3347. [Google Scholar] [CrossRef]
- Kukučka, M.; Kukučka Stojanović, N.; Tomić, Ž.; Furundžić, D. Adsorptive and thermodynamic properties derived from different synthetic zeolite—Groundwater ammonium species molar ratios. Desalin. Water Treat. 2018, 106, 165–176. [Google Scholar] [CrossRef]
- Ghiu, S.M.S.; Carnahan, R.P.; Barger, M. Mass transfer in RO TFC membranes—Dependence on the salt physical and thermodynamic parameters. Desalination 2003, 157, 385–393. [Google Scholar] [CrossRef]
- Nightingale, E.R. Phenomenological Theory of Ion Solvation. Effective Radii of Hydrated Ions. J. Phys. Chem. 1959, 63, 1381–1387. [Google Scholar] [CrossRef]
- Marcus, Y. Thermodynamics of solvation of ions. Part 5.—Gibbs free energy of hydration at 298.15 K. J. Chem. Soc. Faraday Trans. 1991, 87, 2995–2999. [Google Scholar] [CrossRef]
- Rudolph, W.W.; Irmer, G. Hydration and speciation studies of Mn2+ in aqueous solution with simple monovalent anions (ClO4−, NO3−, Cl−, Br−). Dalton Trans. 2013, 42, 14460–14472. [Google Scholar] [CrossRef] [PubMed]
- Shannon, R.D. Revised effective ionic radii and systematic studies of interatomic distances in halides and chalcogenides. Acta Crystallogr. Sect. A 1976, 32, 751–767. [Google Scholar] [CrossRef]
- Richards, L.A.; Schäfer, A.I.; Richards, B.S.; Corry, B. The Importance of Dehydration in Determining Ion Transport in Narrow Pores. Small 2012, 8, 1701–1709. [Google Scholar] [CrossRef] [Green Version]
- Kalyuzhnyi, Y.; Vlachy, V.J.; Dill, K. Hydration of simple ions. Effect of the charge density. Acta Chim. Slov. 2001, 48, 309–316. [Google Scholar]
- Collins, K.D. Charge density-dependent strength of hydration and biological structure. Biophys. J. 1997, 72, 65–76. [Google Scholar] [CrossRef] [Green Version]
- Einstein, A. Über die von der molekularkinetischen Theorie der Wärme geforderte Bewegung von in ruhenden Flüssigkeiten suspendierten Teilchen. Annalen Physik 1905, 322, 549–560. [Google Scholar] [CrossRef] [Green Version]
- Nair, R.R.; Protasova, E.; Strand, S.; Bilstad, T. Implementation of Spiegler–Kedem and Steric Hindrance Pore Models for Analyzing Nanofiltration Membrane Performance for Smart Water Production. Membranes 2018, 8, 78. [Google Scholar] [CrossRef] [Green Version]
- Oren, Y.S.; Biesheuvel, P.M. Theory of Ion and Water Transport in Reverse-Osmosis Membranes. Phys. Rev. Appl. 2018, 9, 024034. [Google Scholar] [CrossRef] [Green Version]
- Luo, H.; Peng, H.; Zhao, Q. High flux Mg2+/Li+ nanofiltration membranes prepared by surface modification of polyethylenimine thin film composite membranes. Appl. Surf. Sci. 2022, 579, 152161. [Google Scholar] [CrossRef]
- Izadpanah, A.A.; Javidnia, A. The Ability of a Nanofiltration Membrane to Remove Hardness and Ions from Diluted Seawater. Water 2012, 4, 283. [Google Scholar] [CrossRef]
- Wang, X.-L.; Tsuru, T.; Nakao, S.-I.; Kimura, S. The electrostatic and steric-hindrance model for the transport of charged solutes through nanofiltration membranes. J. Membr. Sci. 1997, 135, 19–32. [Google Scholar] [CrossRef]
- Onsager, L. Reciprocal Relations in Irreversible Processes. I. Phys. Rev. 1931, 37, 405–426. [Google Scholar] [CrossRef]
- Kolev, V.; Freger, V. Molecular Dynamics Investigation of Ion Sorption and Permeation in Desalination Membranes. J. Phys. Chem. B 2015, 119, 14168–14179. [Google Scholar] [CrossRef] [PubMed]
- Fridman-Bishop, N.; Tankus, K.A.; Freger, V. Permeation mechanism and interplay between ions in nanofiltration. J. Membr. Sci. 2018, 548, 449–458. [Google Scholar] [CrossRef]
- Madaeni, S.S.; Salehi, E. Adsorption of cations on nanofiltration membrane: Separation mechanism, isotherm confirmation and thermodynamic analysis. Chem. Eng. J. 2009, 150, 114–121. [Google Scholar] [CrossRef]

| Parameter | Concentration | Molar Concentration |
|---|---|---|
| Temperature | 289 K | |
| pH | 7.39 | |
| Ca2+(aq) | 80.08 mg L−1 | 1.998 mmol L−1 |
| Mg2+(aq) | 37.11 mg L−1 | 1.526 mmol L−1 |
| Mn2+(aq) | 0.332 mg L−1 | 0.006 mmol L−1 |
| Fe2+(aq) | 1.79 mg L−1 | 0.032 mmol L−1 |
| Na+(aq) | 80.67 mg L−1 | 3.509 mmol L−1 |
| NH4+(aq) | 3.24 mg L−1 | 0.180 mmol L−1 |
| Component | Characteristics | Manufacturer |
|---|---|---|
| Microfilter for inlet water pretreatment | Polypropylene filter cartridge of 5 µm with housing | Atlas |
| Booster pump | Centrifugal multistage pump | Grundfos |
| CR1-23; Q = 1.8 m3/h; H = 104 m | ||
| Nanofiltration modules | NF membranes | Torey-Korea Inc. |
| Φ = 0.102 m; L = 1.02 m | ||
| Instantaneous inlet water, permeate, and concentrate flow meter | Polysulfone rotameter | IBG-Praher |
| F1 300–3.000 L/h | ||
| F2 and F3 200–2.000 L/h | ||
| F4 100–1.000 L/h | ||
| Water pressure meter | Pressure gauge | Wika |
| 0–10 bar (M1, M2 and M5) | ||
| 0–20 bar (M3 and M4) | ||
| Solenoid valve | EV220A NC; ¾ inch | Danfoss |
| Electric control unit | Programmable logic controller | Omron |
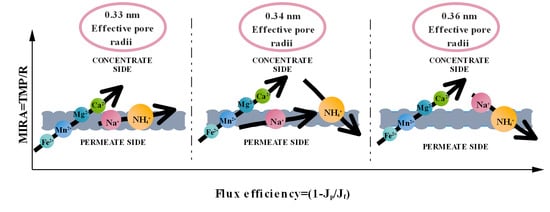
| Series | First Stage | Second Stage | MWCO (Da) | rE (nm) |
|---|---|---|---|---|
| NF3-90 | NE90 and NE90 | NE90 | 200 | 0.33 |
| NF90-70-90 | NE90 and NE70 | NE90 | ~217 * | 0.34 |
| NF3-70 | NE70 and NE70 | NE70 | 250 | 0.36 |
| Ca2+ | Mg2+ | Mn2+ | Fe2+ | Na+ | NH4+ | |
|---|---|---|---|---|---|---|
| rS (nm) | 0.310 | 0.347 | 0.368 | 0.344 | 0.184 | 0.125 |
| ri (nm) | 0.100 | 0.066 | 0.086 | 0.075 | 0.117 | 0.148 |
| CD (C mm−3) | 52 | 120 | 114 | 181 | 24 | 11 |
| Series | Ca2+(aq) | Mg2+(aq) | Mn2+(aq) | Fe2+(aq) | Na+(aq) | NH4+(aq) | |
|---|---|---|---|---|---|---|---|
| NF90-70-90 | k | 0.5483 | 0.4997 | 0.5333 | 0.5807 | 0.2648 | −5.6061 |
| n | −0.1754 | −0.1609 | −0.1754 | −0.2019 | −0.0307 | 2.8347 | |
| r2 | 0.9519 | 0.9514 | 0.9674 | 0.9759 | 0.9271 | 0.9977 | |
| RP (%) | 21.4214 | 12.0934 | 12.1406 | 0.6611 | 41.7400 | 84.8765 | |
| NF3-90 | k | 0.3737 | 0.3746 | 0.3780 | 0.3759 | 0.3358 | 0.2338 |
| n | −0.0649 | −0.0628 | −0.0662 | −0.0675 | −0.0414 | 0.0027 | |
| r2 | 0.9916 | 0.9941 | 0.9938 | 0.9938 | 0.991 | 0.9009 | |
| RP (%) | 3.1002 | 6.4259 | 3.3866 | 0.3352 | 15.3554 | 22.1605 | |
| NF3-70 | k | 0.1200 | 0.3213 | 0.2074 | 0.3555 | −1.2991 | −3.1300 |
| n | 0.0529 | −0.0626 | 0.0056 | −0.0838 | 0.7448 | 1.5808 | |
| r2 | 0.9361 | 0.9646 | 0.9733 | 0.9444 | 0.9581 | 0.9910 | |
| RP (%) | 45.4451 | 20.0584 | 38.8711 | 10.3073 | 69.7492 | 72.8910 |
| MWCO (Da) | 217 | 200 | 250 |
|---|---|---|---|
| SDk | |||
| Divalent ions | 0.03363 | 0.00187 | 0.1079 |
| Monovalent ions | 4.15135 | 0.07212 | 1.2946 |
| Total ions | 2.48941 | 0.05691 | 1.40119 |
| SDn | |||
| Divalent ions | 0.01709 | 0.00227 | 0.06282 |
| Monovalent ions | 2.02614 | 0.03118 | 0.59114 |
| Total ions | 1.21954 | 0.02759 | 0.66826 |
Publisher’s Note: MDPI stays neutral with regard to jurisdictional claims in published maps and institutional affiliations. |
© 2022 by the authors. Licensee MDPI, Basel, Switzerland. This article is an open access article distributed under the terms and conditions of the Creative Commons Attribution (CC BY) license (https://creativecommons.org/licenses/by/4.0/).
Share and Cite
Kukučka, M.; Kukučka Stojanović, N. Intrinsic Dependence of Groundwater Cation Hydraulic and Concentration Features on Negatively Charged Thin Composite Nanofiltration Membrane Rejection and Permeation Behavior. Membranes 2022, 12, 79. https://doi.org/10.3390/membranes12010079
Kukučka M, Kukučka Stojanović N. Intrinsic Dependence of Groundwater Cation Hydraulic and Concentration Features on Negatively Charged Thin Composite Nanofiltration Membrane Rejection and Permeation Behavior. Membranes. 2022; 12(1):79. https://doi.org/10.3390/membranes12010079
Chicago/Turabian StyleKukučka, Miroslav, and Nikoleta Kukučka Stojanović. 2022. "Intrinsic Dependence of Groundwater Cation Hydraulic and Concentration Features on Negatively Charged Thin Composite Nanofiltration Membrane Rejection and Permeation Behavior" Membranes 12, no. 1: 79. https://doi.org/10.3390/membranes12010079
APA StyleKukučka, M., & Kukučka Stojanović, N. (2022). Intrinsic Dependence of Groundwater Cation Hydraulic and Concentration Features on Negatively Charged Thin Composite Nanofiltration Membrane Rejection and Permeation Behavior. Membranes, 12(1), 79. https://doi.org/10.3390/membranes12010079