
Impact of a Graphene Oxide Reducing Agent on a Semi-Permeable Graphene/Reduced Graphene Oxide Forward Osmosis Membrane Filtration Efficiency

 , ,
, ,  , ,
, ,  , ,
, , 
Abstract
:1. Introduction
2. Materials and Methods
2.1. Materials
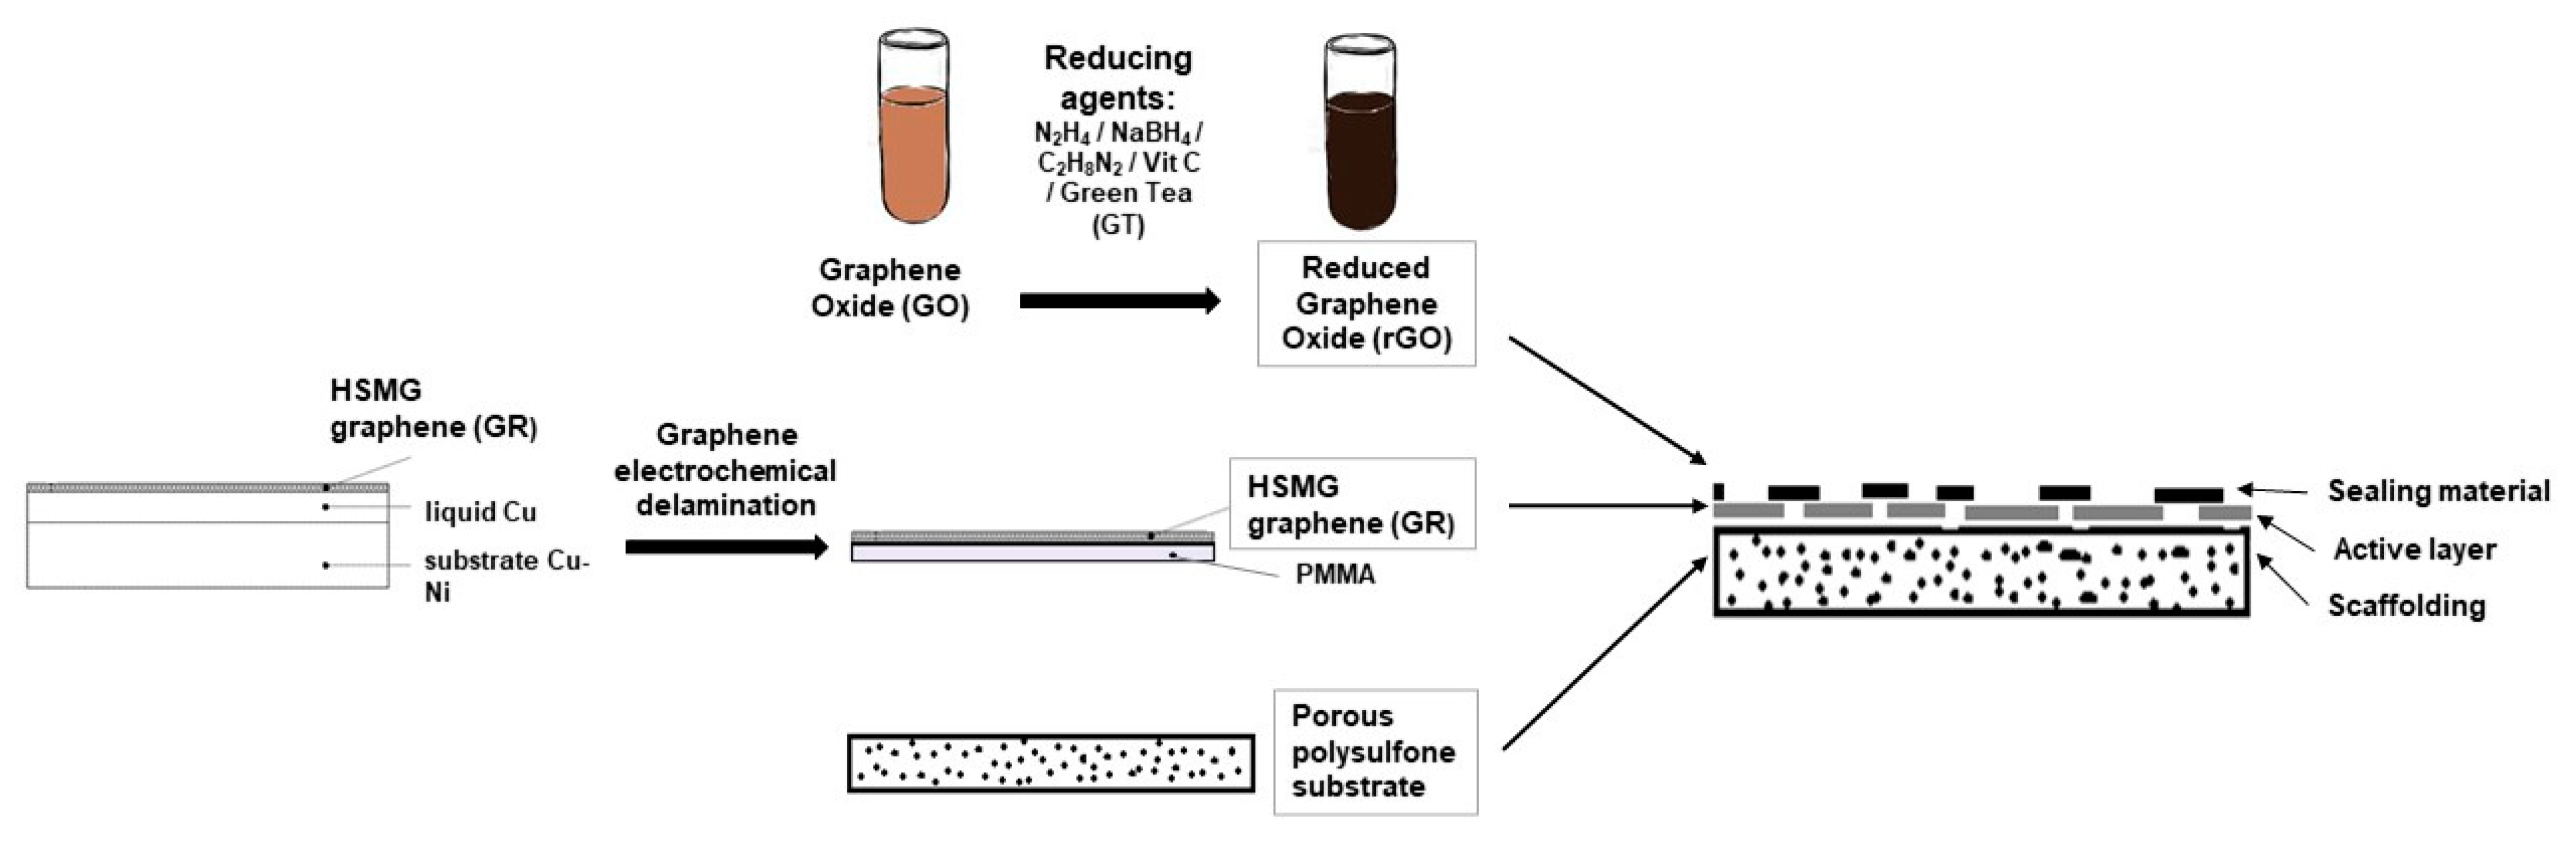
2.2. Transfer of Graphene
2.3. Reduced Graphene Oxide Preparation
2.4. Reduced Graphene Oxide Characterization
2.5. Membrane Preparation and Characterization
2.6. Experimental Setup for Filtration Test
2.7. Water and Salt Transport Measurements
3. Results and discussion
3.1. Reduced Graphene Oxide Characterization
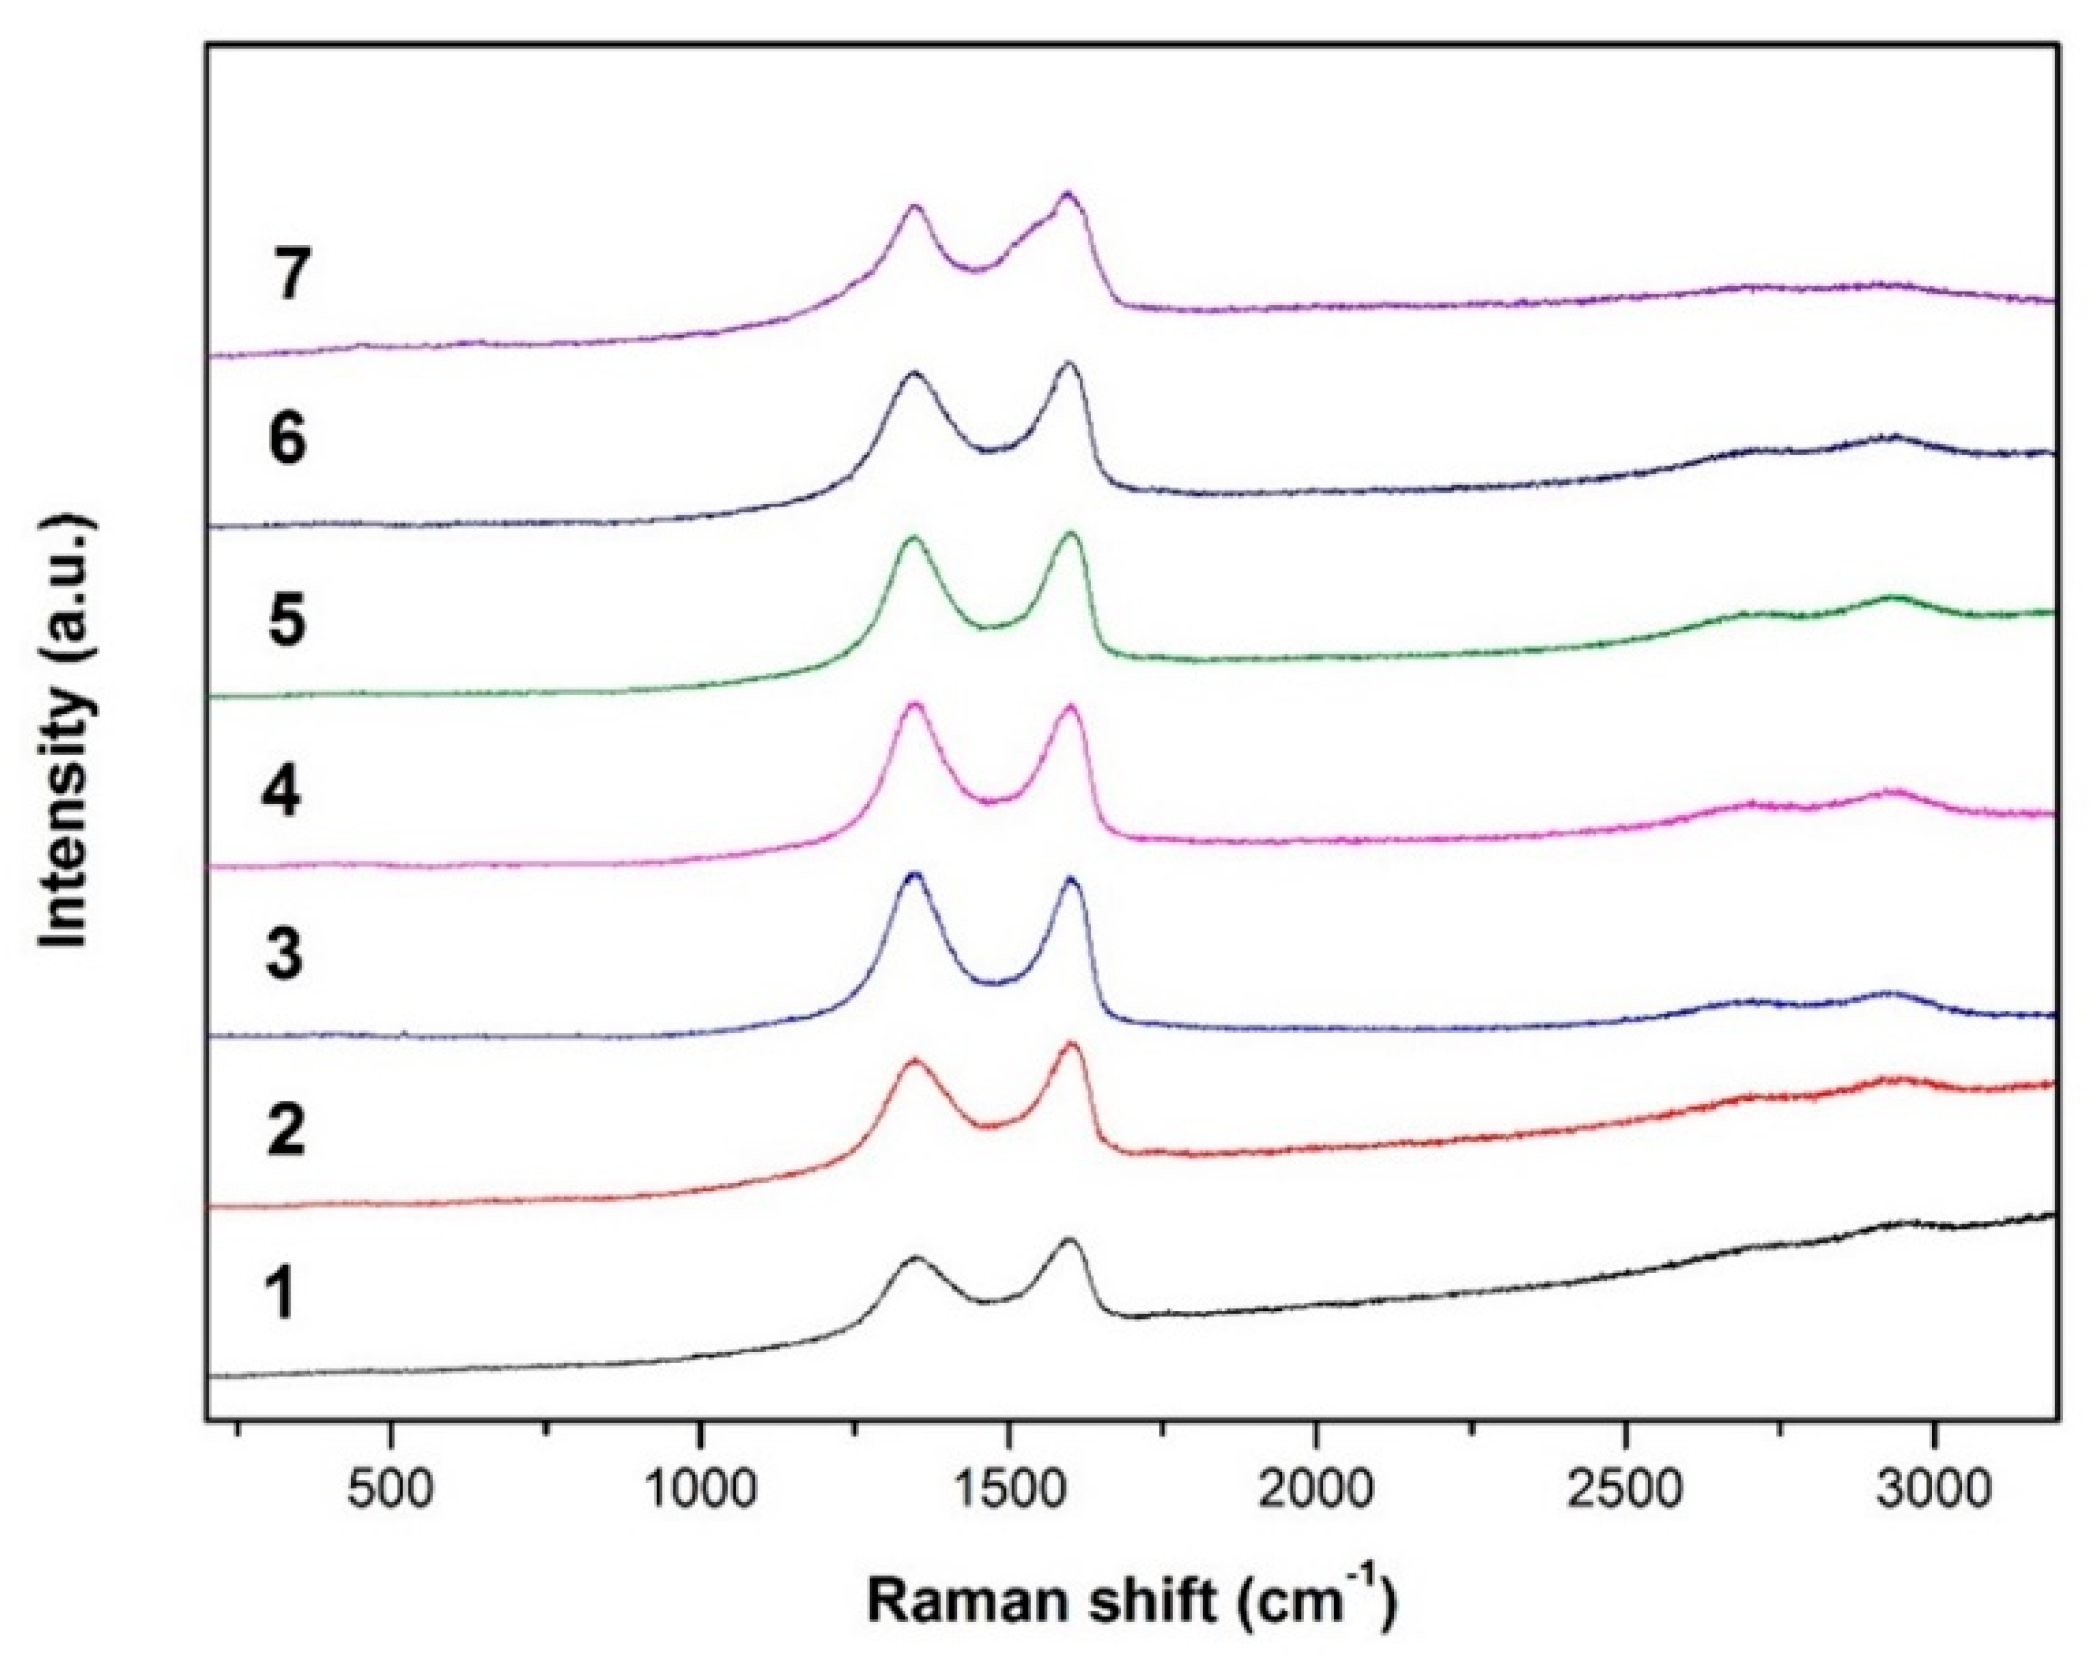
3.1.1. Raman Spectroscopy
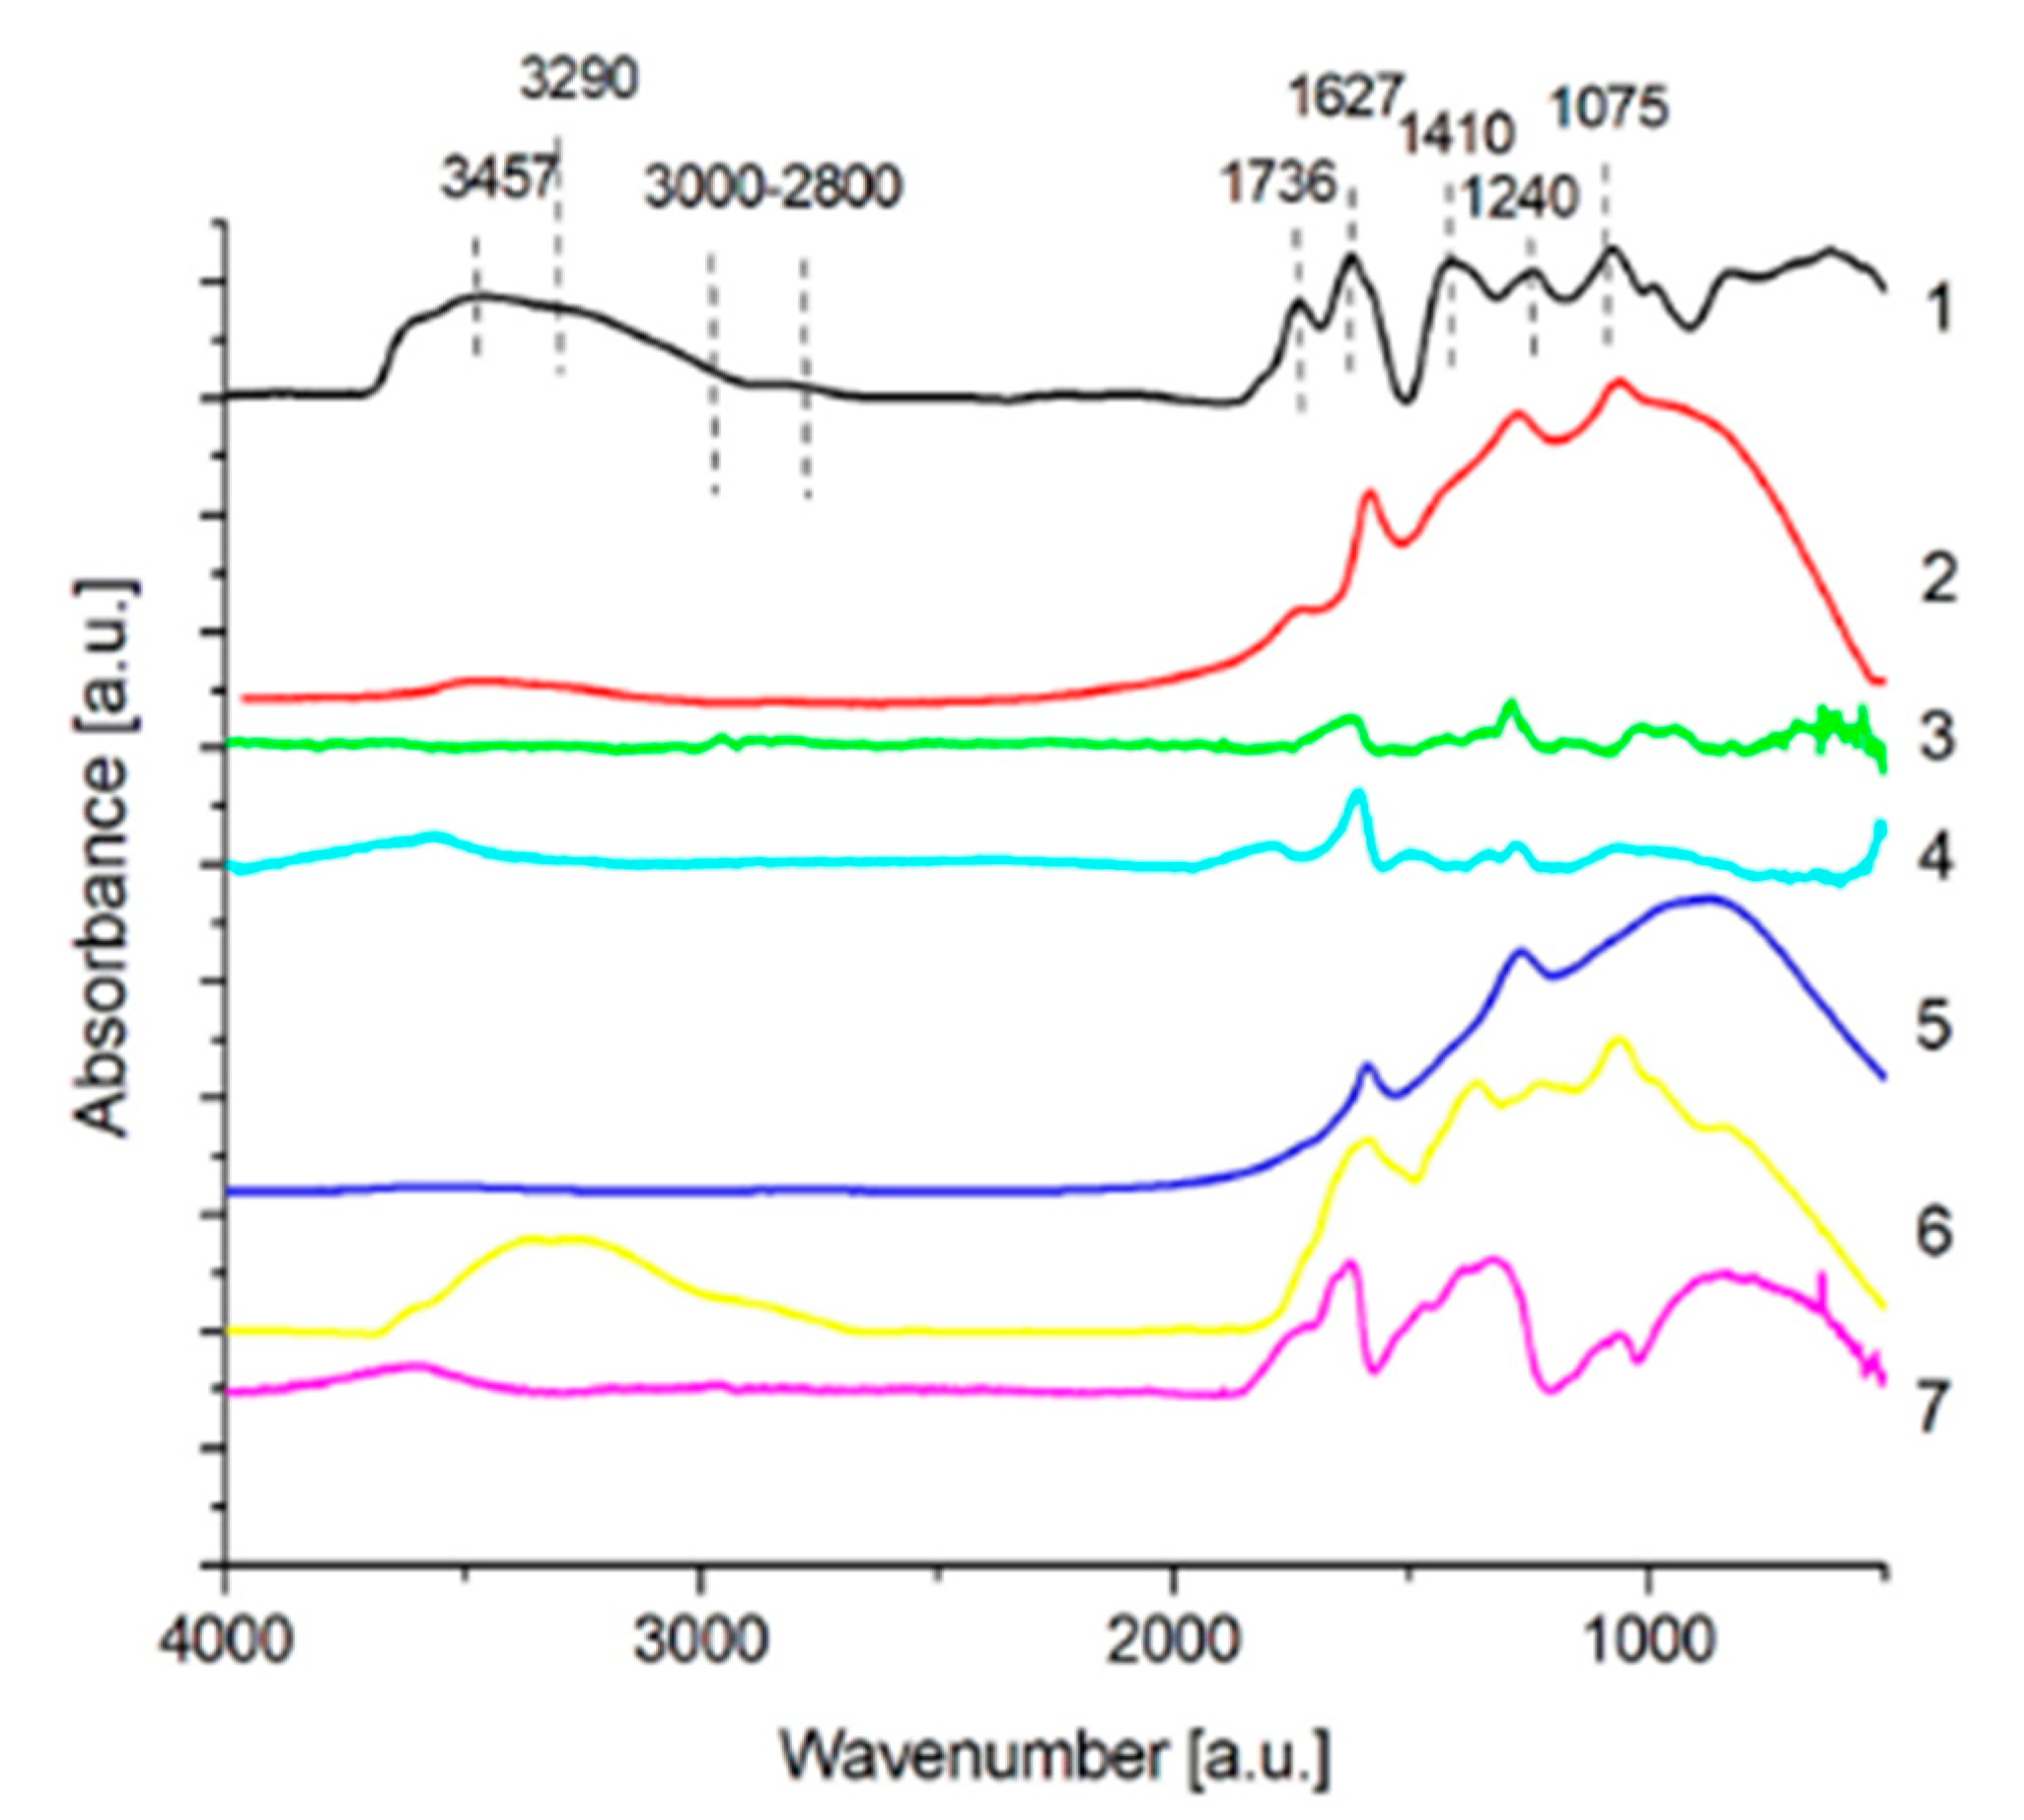
3.1.2. FTIR
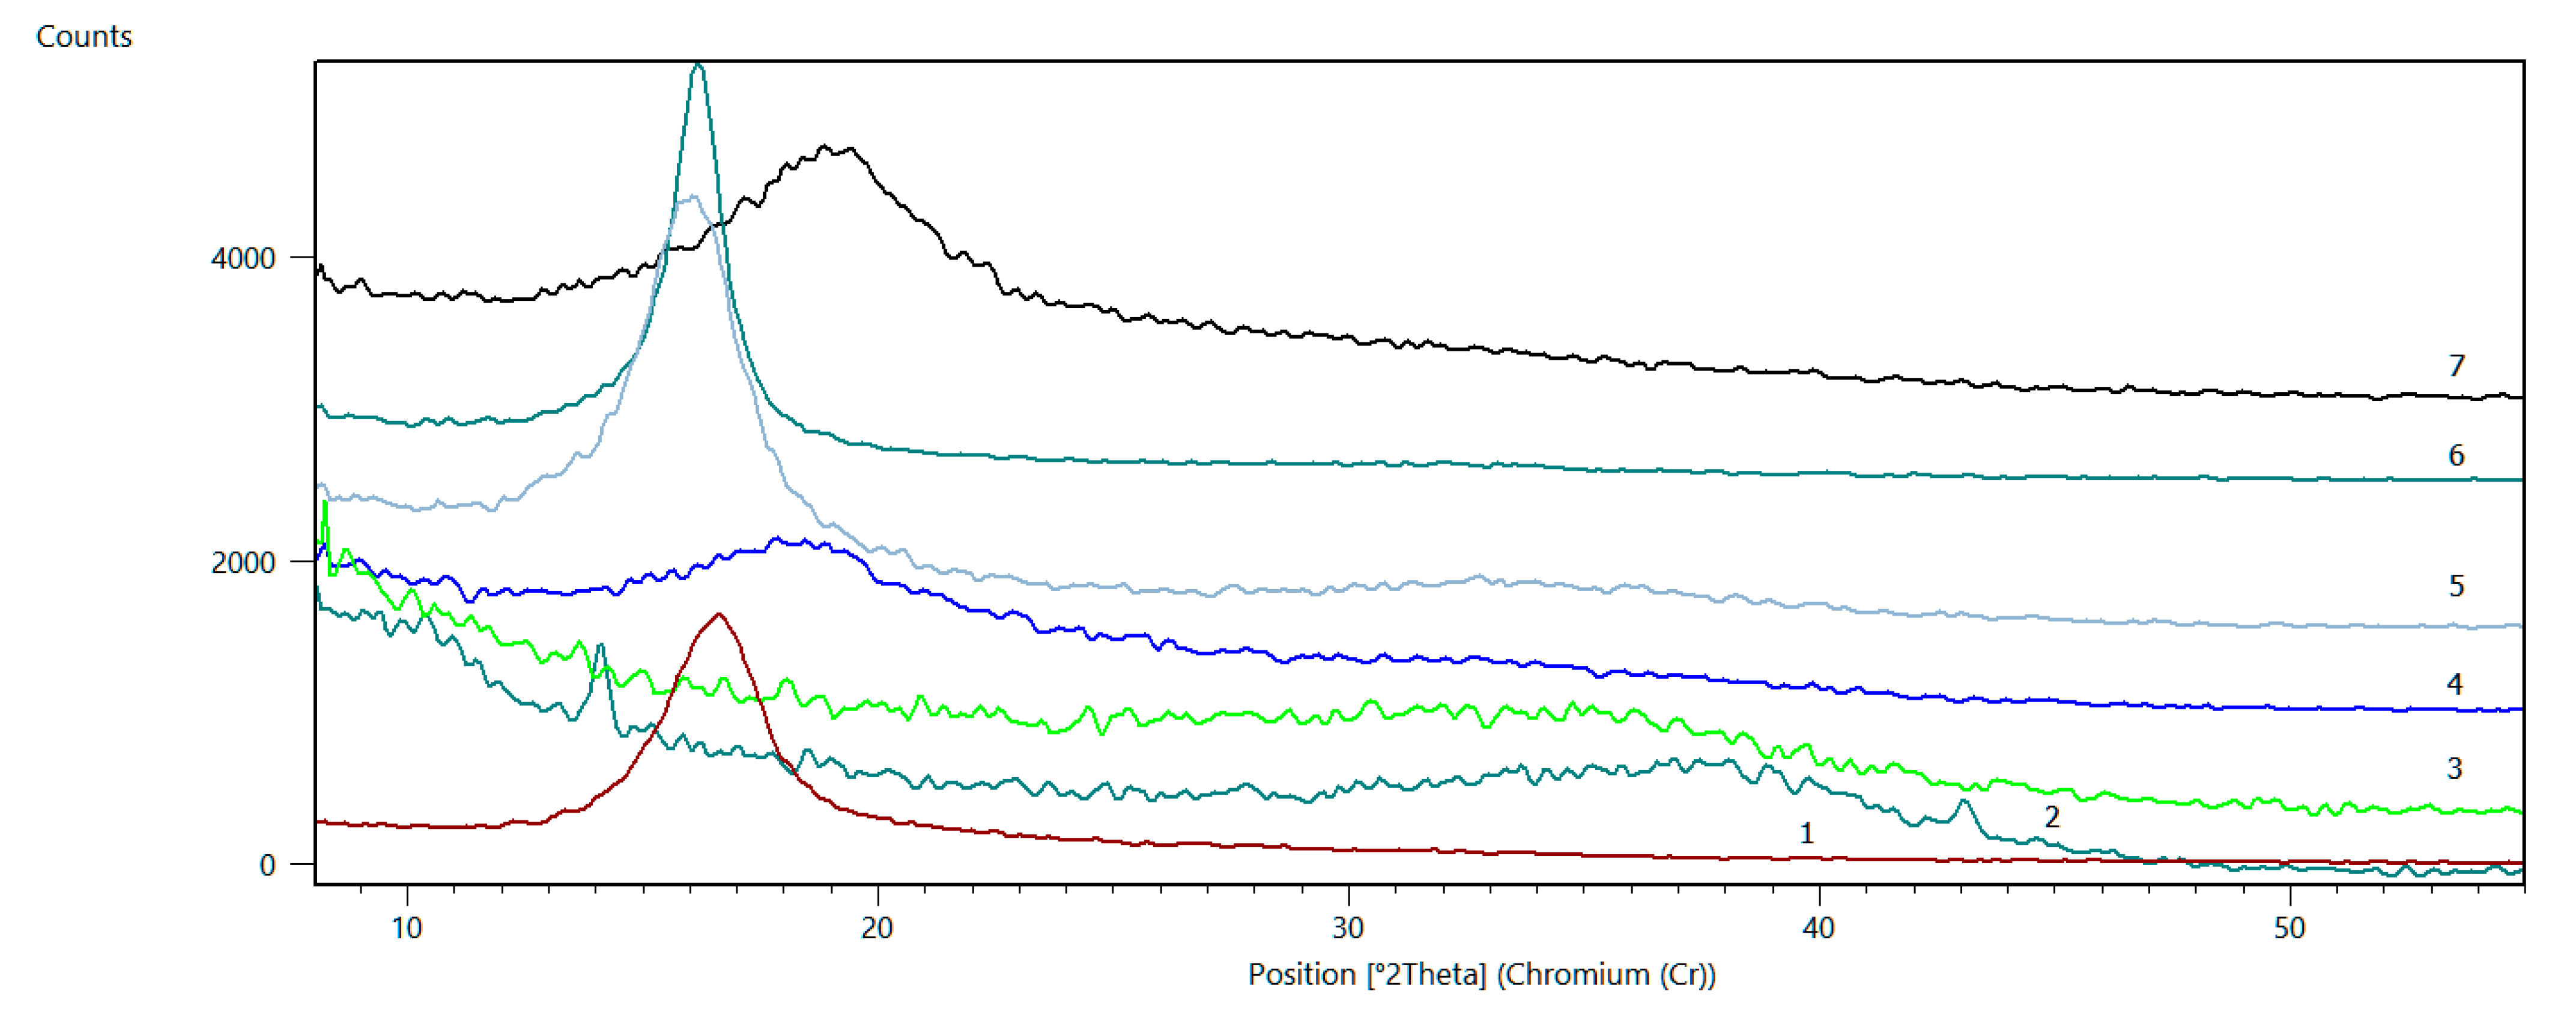
3.1.3. XRD
3.2. Composite Graphene/Reduced Graphene Oxide Membranes Characterisation
3.2.1. Effectiveness of Sealing Membranes with rGO–SEM Characterisation
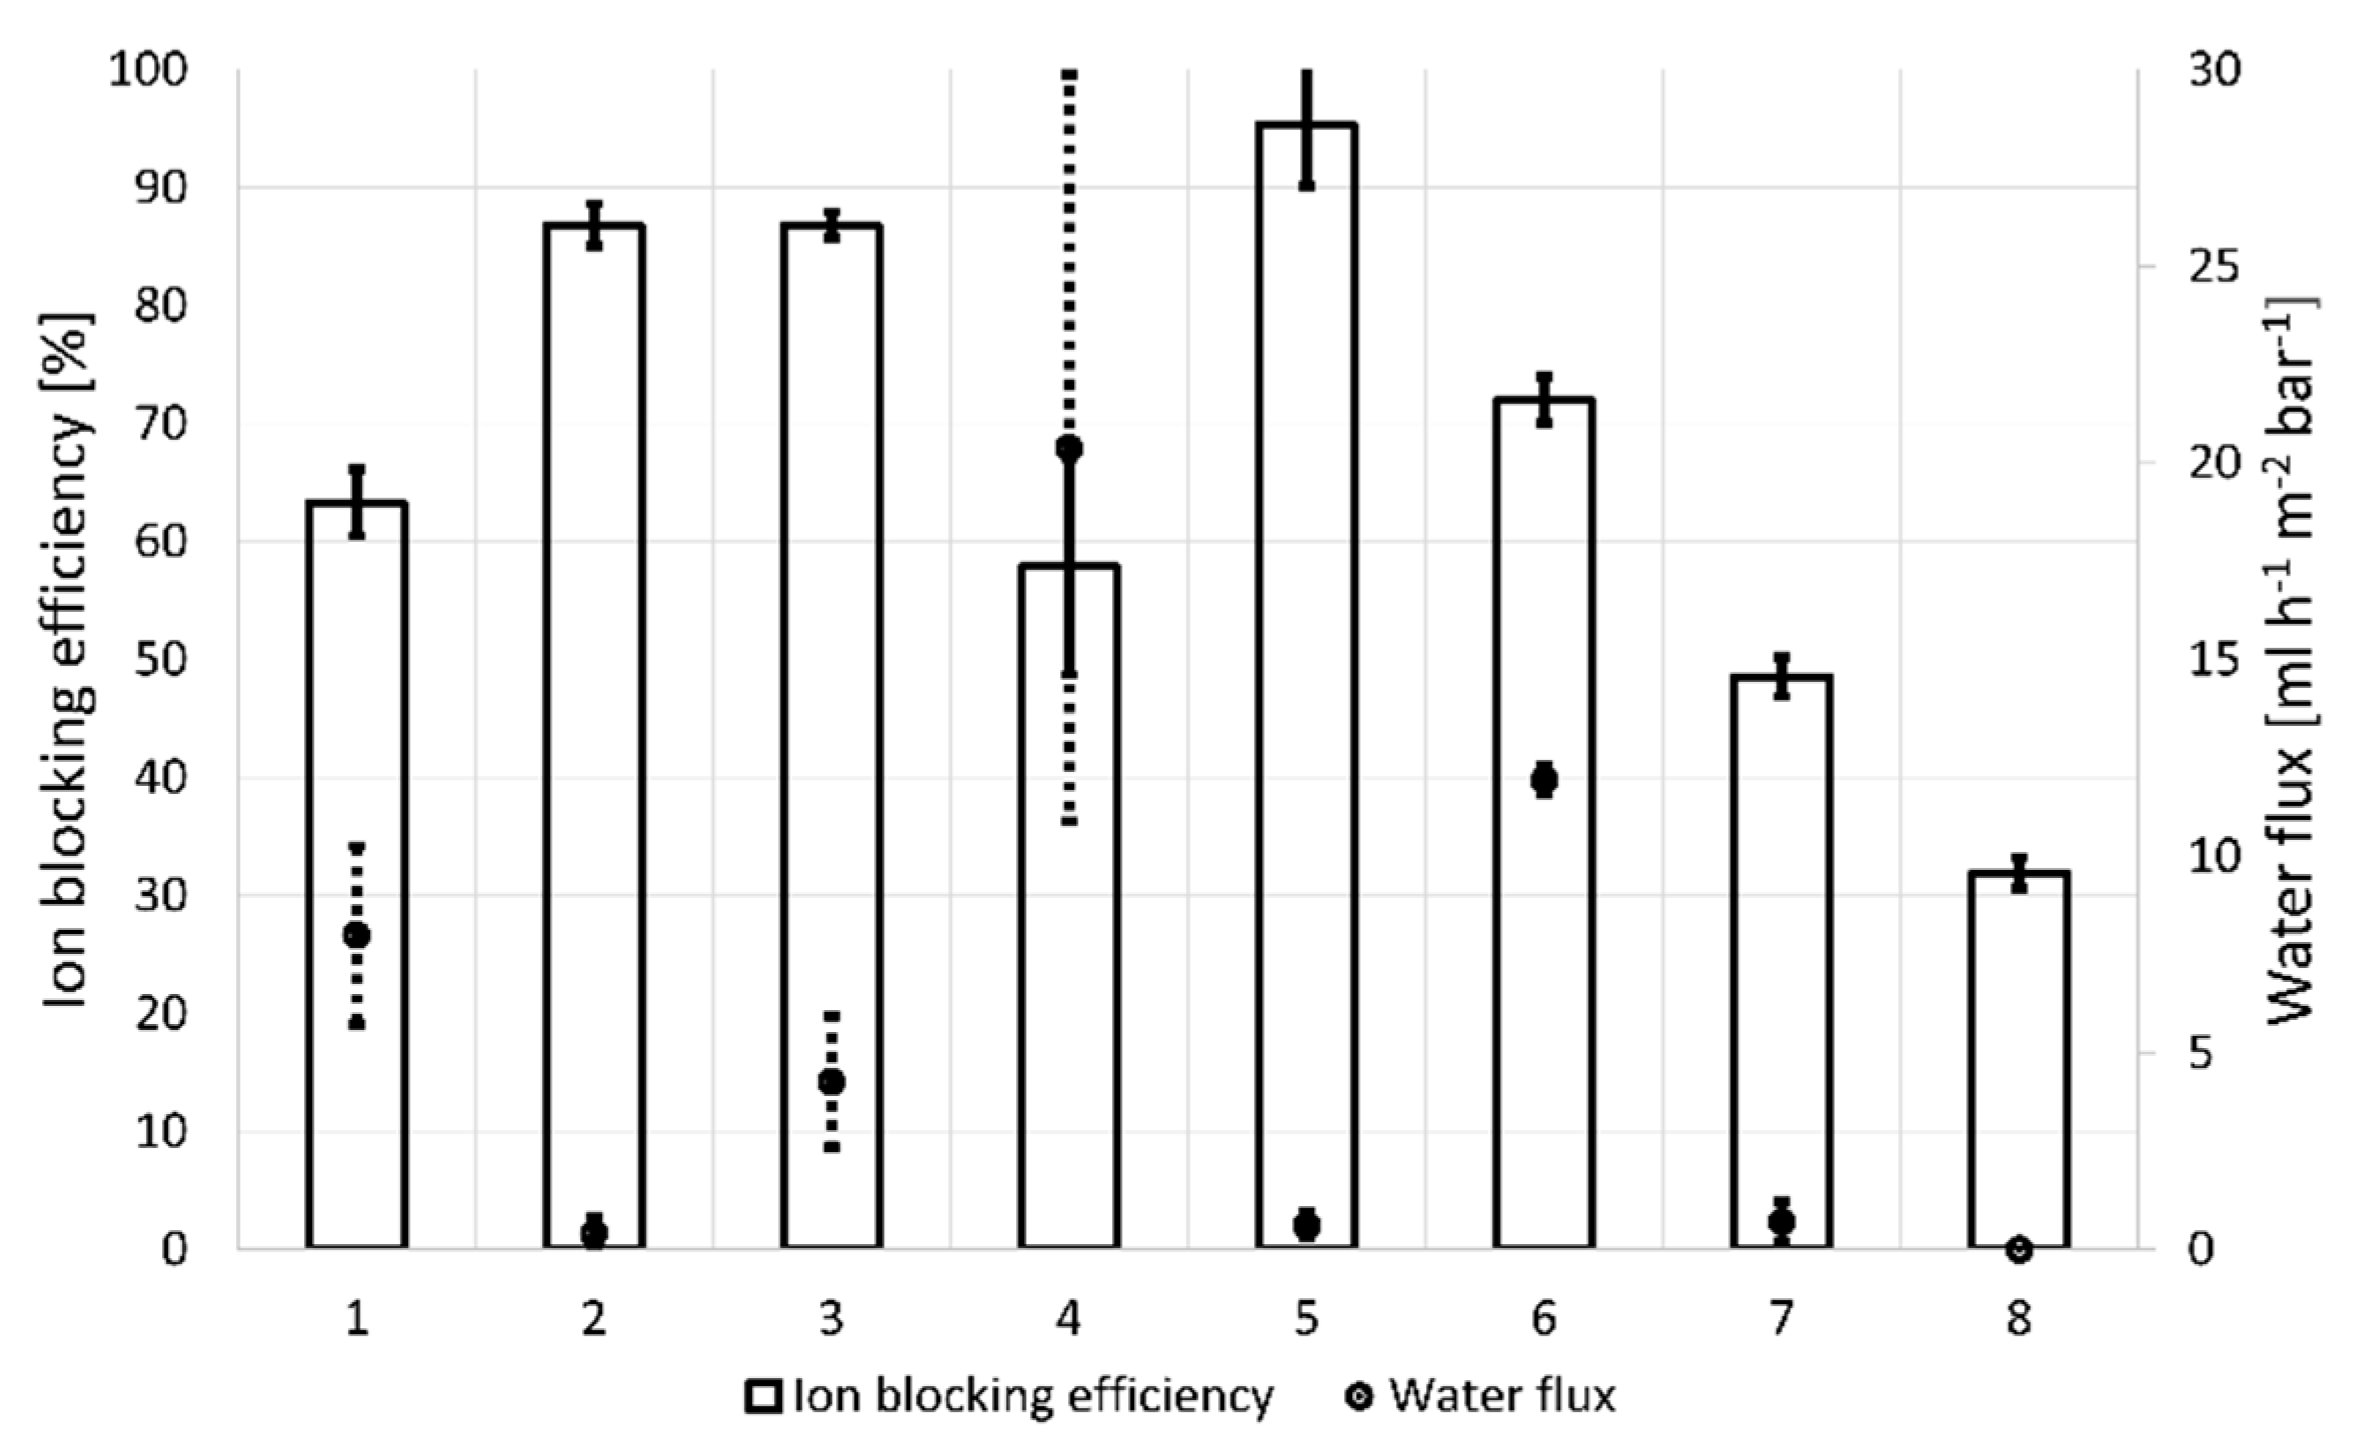
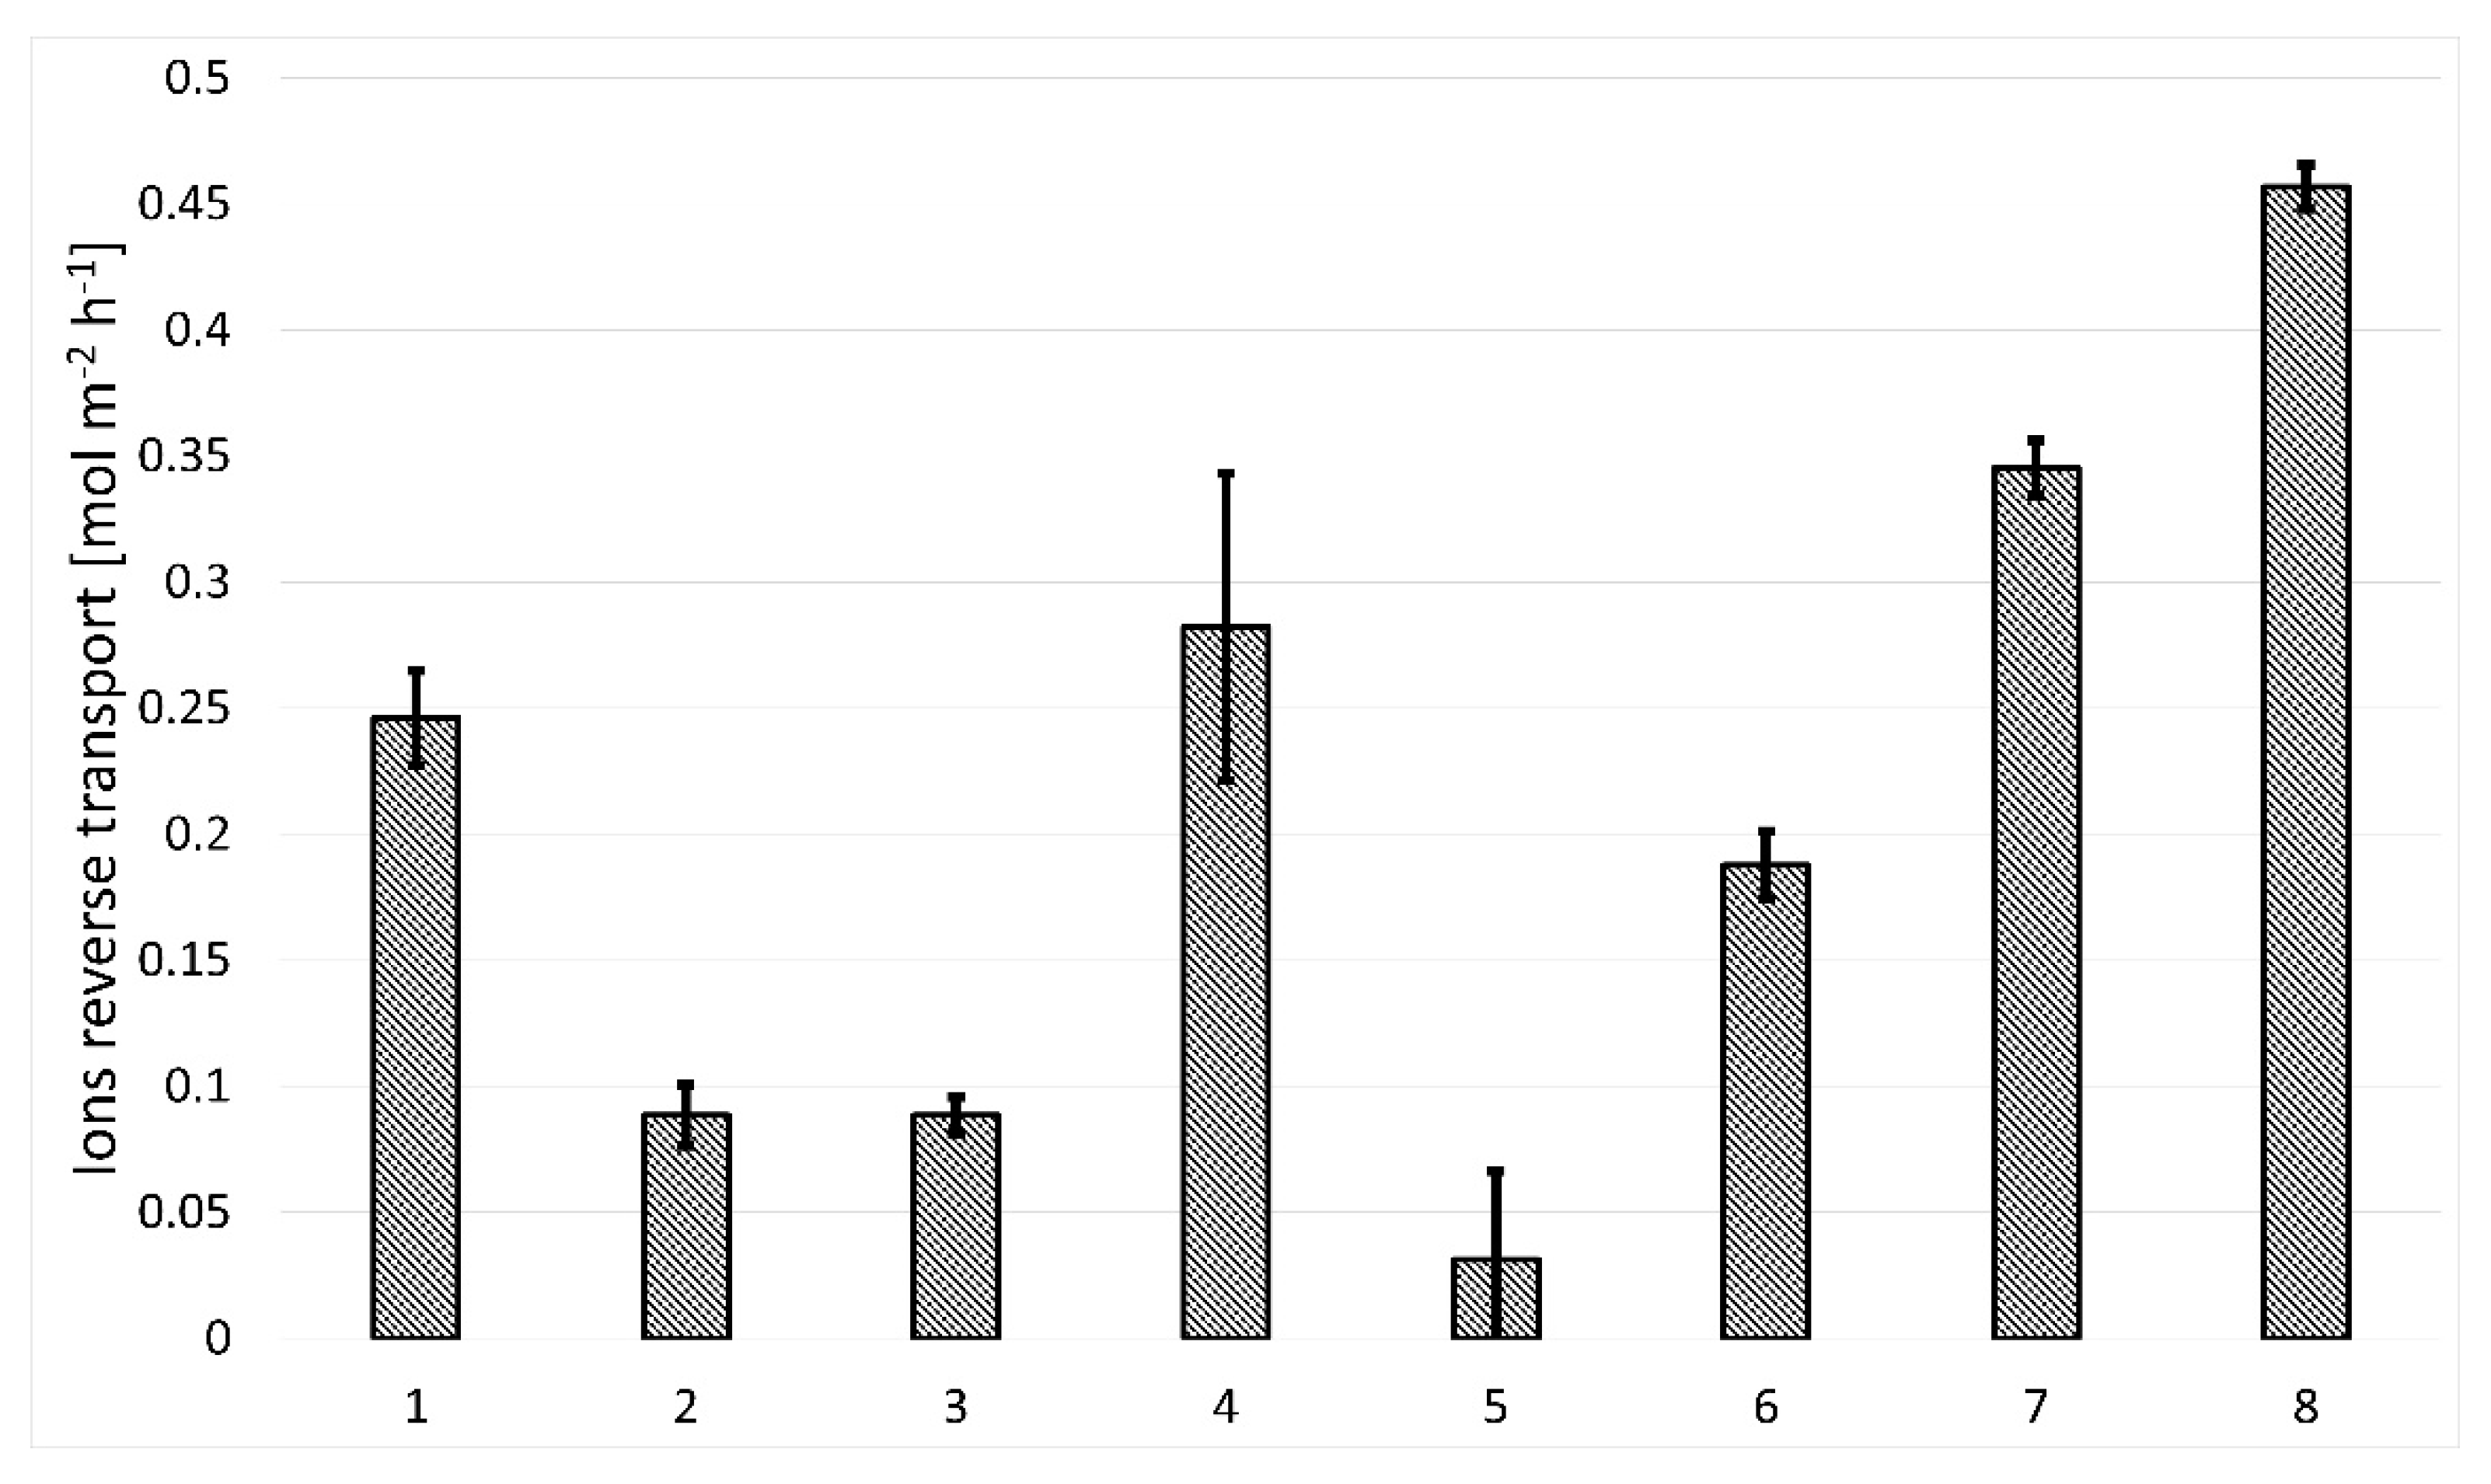
3.2.2. Forward Osmosis Performance of Membranes
4. Conclusions
Author Contributions
Funding
Institutional Review Board Statement
Informed Consent Statement
Data Availability Statement
Acknowledgments
Conflicts of Interest
References
- FAO. Coping with Water Scarcity: Challenge of the Twenty-First Century; United Nations: New York, NY, USA, 2007. [Google Scholar]
- Boretti, A.; Al-Zubaidy, S.; Vaclavikova, M.; Al-Abri, M.; Castelletto, S.; Mikhalovsky, S. Outlook for Graphene-Based Desalination Membranes. npj Clean Water 2018, 1, 1–11. [Google Scholar] [CrossRef]
- Lee, A.; Elam, J.W.; Darling, S.B. Membrane Materials for Water Purification: Design, Development, and Application. Environ. Sci. Water Res. Technol. 2016, 2, 17–42. [Google Scholar] [CrossRef]
- Lutchmiah, K.; Verliefde, A.R.D.; Roest, K.; Rietveld, L.C.; Cornelissen, E.R. Forward Osmosis for Application in Wastewater Treatment: A Review. Water Res. 2014, 58, 179—197. [Google Scholar] [CrossRef]
- Wu, W.; Shi, Y.; Liu, G.; Fan, X.; Yu, Y. Recent Development of Graphene Oxide Based Forward Osmosis Membrane for Water Treatment: A Critical Review. Desalination 2020, 491, 114452. [Google Scholar] [CrossRef]
- Leenaerts, O.; Partoens, B.; Peeters, F. Graphene: A Perfect Nanoballoon. Appl. Phys. Lett. 2008, 93, 193107. [Google Scholar] [CrossRef] [Green Version]
- O’Hern, S.C.; Jang, D.; Bose, S.; Idrobo, J.-C.; Song, Y.; Laoui, T.; Kong, J.; Karnik, R. Nanofiltration across Defect-Sealed. Nanoporous monolayer graphene. Nano Lett. 2015, 15, 3254–3260. [Google Scholar] [CrossRef] [Green Version]
- Surwade, S.P.; Smirnov, S.N.; Vlassiouk, I.; Unocic, R.R.; Veith, G.M.; Dai, S.; Mahurin, S.M. Water Desalination Using Nanoporous Single-Layer Graphene. Nat. Nanotechnol. 2015, 10, 459—464. [Google Scholar] [CrossRef] [PubMed]
- Celebi, K.; Buchheim, J.; Wyss, R.M.; Droudian, A.; Gasser, P.; Shorubalko, I.; Kye, J.I.; Lee, C.; Park, H.G. Ultimate Permeation across Atomically Thin Porous Graphene. Science 2014, 344, 289–292. [Google Scholar] [CrossRef]
- O’Hern, S.C.; Stewart, C.A.; Boutilier, M.S.H.; Idrobo, J.-C.; Bhaviripudi, S.; Das, S.K.; Kong, J.; Laoui, T.; Atieh, M.; Karnik, R. Selective Molecular Transport through Intrinsic Defects in a Single Layer of CVD Graphene. ACS Nano 2012, 6, 10130–10138. [Google Scholar] [CrossRef]
- Kaczmarek, Ł.; Kula, P.; Szymański, W.; Kołodziejczyk, Ł.; Atraszkiewicz, R.; Dybowski, K.; Grabarczyk, J.; Pietrasik, R.; Niedzielski, P.; Cłapa, M. High Strength Metallurgical Graphene—Mechanisms of Growth and Properties. Arch. Metall. Mater. 2015, 60, 2535–2542. [Google Scholar] [CrossRef] [Green Version]
- Kolodziejczyk, L.; Kula, P.; SzymaDski, W.; Atraszkiewicz, R.; Dybowski, K.; Pietrasik, R. Frictional Behaviour of Polycrystalline Graphene Grown on Liquid Metallic Matrix. Tribol. Int. 2016, 93, 628–639. [Google Scholar] [CrossRef]
- Chen, Y.; Gong, X.L.; Gai, J.G. Progress and Challenges in Transfer of Large-Area Graphene Films. Adv. Sci. 2016, 3, 1500343. [Google Scholar] [CrossRef]
- Dybowski, K.; Romaniak, G.; Kula, P.; Jeziorna, A.; Kowalczyk, P.; Atraszkiewicz, R.; Kołodziejczyk, Ł.; Nowak, D.; Zawadzki, P.; Kucińska, M. Impact of the Method of Separating Graphene from the Growth Substrate on the Quality of the 2D Material Obtained. Arch. Metall. Mater. 2019, 64, 1321–1326. [Google Scholar] [CrossRef]
- Kafiah, F.M.; Khan, Z.; Ibrahim, A.; Karnik, R.; Atieh, M.; Laoui, T. Monolayer Graphene Transfer onto Polypropylene and Polyvinylidenedifluoride Microfiltration Membranes for Water Desalination. Desalination 2016, 388, 29–37. [Google Scholar] [CrossRef]
- Yang, E.; Kim, C.-M.; Song, J.; Ki, H.; Ham, M.-H.; Kim, I.S. Enhanced Desalination Performance of Forward Osmosis Membranes Based on Reduced Graphene Oxide Laminates Coated with Hydrophilic Polydopamine. Carbon 2017, 117, 293–300. [Google Scholar] [CrossRef]
- Kim, S.; Lin, X.; Ou, R.; Liu, H.; Zhang, X.; Simon, G.P.; Easton, C.D.; Wang, H. Highly Crosslinked, Chlorine Tolerant Polymer Network Entwined Graphene Oxide Membrane for Water Desalination. J. Mater. Chem. A 2017, 5, 1533–1540. [Google Scholar] [CrossRef]
- Li, Z.; Wang, Y.; Han, M.; Wang, D.; Han, S.; Liu, Z.; Zhou, N.; Shang, R.; Xie, C. Graphene Oxide Incorporated Forward Osmosis Membranes With Enhanced Desalination Performance and Chlorine Resistance. Front. Chem. 2020, 7, 877. [Google Scholar] [CrossRef]
- Romaniak, G.; Dybowski, K.; Jeziorna, A.; Kula, P.; Kaźmierczak, T. Synthesis and Characterization of Semi-Permeable Graphene/Graphene Oxide Membranes for Water Desalination. J. Mater. Sci. 2020, 55, 9775–9786. [Google Scholar] [CrossRef] [Green Version]
- Pei, S.; Cheng, H.-M. The Reduction of Graphene Oxide. Carbon 2012, 50, 3210–3228. [Google Scholar] [CrossRef]
- Kaczmarek, Ł.; Warga, T.; Makowicz, M.; Kyzioł, K.; Bucholc, B.; Majchrzycki, Ł. The Influence of the Size and Oxidation Degree of Graphene Flakes on the Process of Creating 3D Structures during Its Cross-Linking. Materials 2020, 13, 681. [Google Scholar] [CrossRef] [Green Version]
- Kaczmarek, Ł.; Kula, P.; Warga, T.; Kołodziejczyk, Ł.; Louda, P.; Borůvková, K.; Niedzielski, P.; Szymański, W.; Voleský, L.; Pawłowski, W.; et al. Creation of a 3D Structure Based on the High Strength Metallurgical Graphene®. Surf. Rev. Lett. 2018, 26, 1850206. [Google Scholar] [CrossRef]
- Yang, Z.; Zheng, Q.; Qiu, H.; Li, J.; Yang, J. A Simple Method for the Reduction of Graphene Oxide by Sodium Borohydride with CaCl2 as a Catalyst. Carbon 2015, 86, 372. [Google Scholar] [CrossRef]
- Zhang, J.; Yang, H.; Shen, G.; Cheng, P.; Zhang, J.; Guo, S. Reduction of Graphene Oxide Vial-Ascorbic Acid. Chem. Commun. 2010, 46, 1112–1114. [Google Scholar] [CrossRef] [PubMed]
- Moosa, A.; Jaafar, J. Green Reduction of Graphene Oxide Using Tea Leaves Extract with Applications to Lead Ions Removal from Water. Nanosci. Nanotechnol. 2017, 7, 38–47. [Google Scholar] [CrossRef]
- Abdullah, M.F.; Zakaria, R.; Zein, S.H.S. Green Tea Polyphenol–Reduced Graphene Oxide: Derivatisation, Reduction Efficiency, Reduction Mechanism and Cytotoxicity. RSC Adv. 2014, 4, 34510–34518. [Google Scholar] [CrossRef]
- King, A.A.K.; Davies, B.R.; Noorbehesht, N.; Newman, P.; Church, T.L.; Harris, A.T.; Razal, J.M.; Minett, A.I. A New Raman Metric for the Characterisation of Graphene Oxide and Its Derivatives. Sci. Rep. 2016, 6, 19491. [Google Scholar] [CrossRef] [Green Version]
- Gong, Y.; Li, D.; Fu, Q.; Pan, C. Influence of Graphene Microstructures on Electrochemical Performance for Supercapacitors. Prog. Nat. Sci. 2015, 25, 379–385. [Google Scholar] [CrossRef] [Green Version]
- Dutta, R.; Verma, S. A Facile Method of Synthesizing Ammonia Modified Graphene Oxide for Efficient Removal of Uranyl Ions from Aqueous Medium. RSC Adv. 2015, 5, 77192–77203. [Google Scholar] [CrossRef]
- Silverstein, R.M. Spectrometric Identification of Organic Compounds, 7th ed.; John Wiley & Sons: San Francisco, CA, USA, 2005. [Google Scholar]
- Lambert, J.B. Introduction to Organic Spectroscopy; Macmillan: New York, NY, USA, 1987. [Google Scholar]
- Shahriary, L.; Athawale, A. Graphene Oxide Synthesized by Using Modified Hummers Approach. Int. J. Renew. Energy Environ. Eng. 2014, 2, 58–63. [Google Scholar]
- Szymczycha-Madeja, A.; Welna, M.; Zyrnicki, W. Multi-Element Analysis, Bioavailability and Fractionation of Herbal Tea Products. J. Braz. Chem. Soc. 2013, 24, 777–787. [Google Scholar] [CrossRef]
- Blanton, T.; Majumdar, D. X-ray Diffraction Characterization of Polymer Intercalated Graphite Oxide. Powder Diffr. 2012, 27, 104–107. [Google Scholar] [CrossRef] [Green Version]
- Pavoski, G.; Maraschin, T.; Fim, F.; Balzaretti, N.; Moura, C.; Basso, N. Few Layer Reduced Graphene Oxide: Evaluation of the Best Experimental Conditions for Easy Production. Mater. Res. 2016, 20, 53–61. [Google Scholar] [CrossRef] [Green Version]
- Jiao, X.; Qiu, Y.; Zhang, L.; Zhang, X. Comparison of the Characteristic Properties of Reduced Graphene Oxides Synthesized from Natural Graphites with Different Graphitization Degrees. RSC Adv. 2017, 7, 52337–52344. [Google Scholar] [CrossRef] [Green Version]
- Jang, D.; Idrobo, J.C.; Laoui, T.; Karnik, R. Water and Solute Transport Governed by Tunable Pore Size Distributions in Nanoporous Graphene Membranes. ACS Nano 2017, 11, 10042–10052. [Google Scholar] [CrossRef] [PubMed]
- Jang, J.; Park, I.; Chee, S.-S.; Song, J.-H.; Kang, Y.S.; Lee, C.; Lee, W.; Ham, M.-H.; Kim, I. Graphene Oxide Nanocomposite Membrane Cooperatively Cross-Linked by Monomer and Polymer Overcoming the Trade-off between Flux and Rejection in Forward Osmosis. J. Membr. Sci 2019, 598, 117684. [Google Scholar] [CrossRef]
- Liu, H.; Wang, H.; Zhang, X. Facile Fabrication of Freestanding Ultrathin Reduced Graphene Oxide Membranes for Water Purification. Adv. Mater. 2015, 27, 249–254. [Google Scholar] [CrossRef]
- Hu, M.; Mi, B. Layer-by-Layer Assembly of Graphene Oxide Membranes via Electrostatic Interaction. J. Membr. Sci. 2014, 469, 80–87. [Google Scholar] [CrossRef]


| Reducing Agent | GO/rGO Sample Number; Membrane Designation |
|---|---|
| Unreduced graphene oxide | 1 |
| Hydrazine (N2H4) (without centrifugation of reaction products | 2 |
| Hydrazine (N2H4) | 3 |
| L(+)-ascorbic acid (C6H8O6) | 4 |
| Sodium borohydride (NaBH4) | 5 |
| Ethylenediamine (C2H8N2) | 6 |
| Green tea | 7 |
| Sample No. | GAPP Position (cm−1) | D’ Position (cm−1) | (D’-Gapp) | R2 |
|---|---|---|---|---|
| 1 | 1601.10 | 1600.58 | −0.52 | 0.991 |
| 2 | 1601.56 | 1614.86 | 13.30 | 0.982 |
| 3 | 1600.84 | 1614.30 | 13.46 | 0.988 |
| 4 | 1600.85 | 1605.86 | 5.01 | 0.991 |
| 5 | 1600.85 | 1608.11 | 7.26 | 0.985 |
| 6 | 1603.89 | 1605.68 | 1.79 | 0.990 |
| 7 | 1600.85 | 1601.35 | 0.5 | 0.982 |
| Sample No. | Reflection | 2theta | FWHM [2Th] | d [A] | D [A] | n |
|---|---|---|---|---|---|---|
| 1 | (001) GO | 16.51 | 2.37 | 7.97 | 25.7 | 4 |
| 2 | (001) GO | 14.08 | 0.35 | 9.34 | 374 | 41 |
| (002)rGO | 37 | 9.8 | 3.61 | 13.3 | 4–5 | |
| (100)GO | 43.06 | 0.4 | 3.12 | 327 | 105 | |
| 3 | (001) GO | --- | ---- | --- | --- | --- |
| (002)rGO | 33.7 | 8 | 3.95 | 9.5 | 3 | |
| 4 | (001) GO | 18.48 | 4.8 | 7.13 | 11.5 | 2–3 |
| (002)rGO | 33.9 | 5 | 3.92 | 14.1 | 4 | |
| 5 | (001) GO | 15.96 | 2.53 | 8.25 | 34.2 | 5 |
| (002)rGO | 33.8 | 13 | 3.94 | 6.8 | 2–3 | |
| 6 | (001) GO | 16.12 | 1.24 | 8.16 | 46.8 | 7 |
| 7 | (001) GO | 18.93 | 5 | 6.96 | 11.4 | 2–3 |
| No. | SE Mode | AEE Mode |
|---|---|---|
| 1 |  | 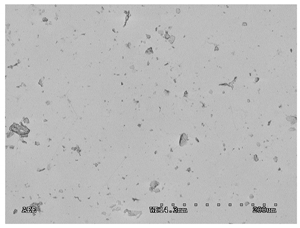 |
| 2 | 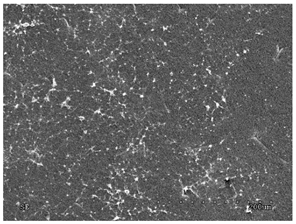 | 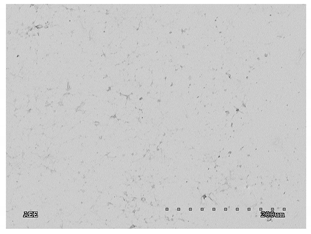 |
| 3 | 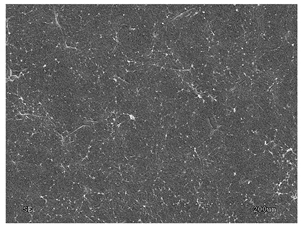 | 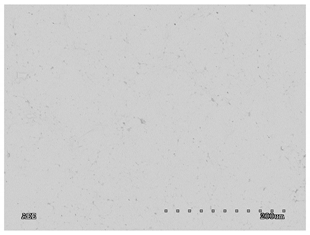 |
| 4 | 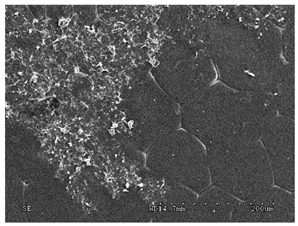 | 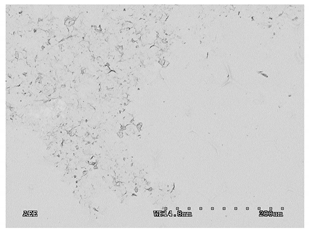 |
| 5 | 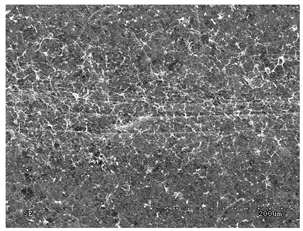 | 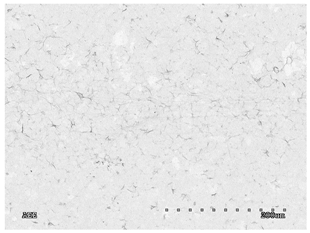 |
| 6 |  |  |
| 7 |  | 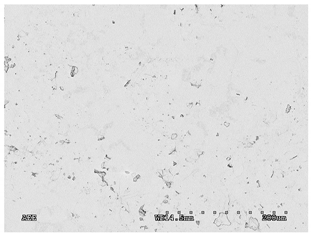 |
| 8 | 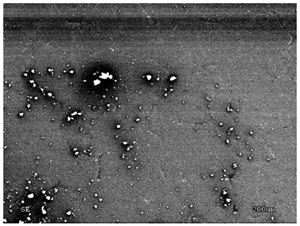 |  |
Publisher’s Note: MDPI stays neutral with regard to jurisdictional claims in published maps and institutional affiliations. |
© 2021 by the authors. Licensee MDPI, Basel, Switzerland. This article is an open access article distributed under the terms and conditions of the Creative Commons Attribution (CC BY) license (https://creativecommons.org/licenses/by/4.0/).
Share and Cite
Romaniak, G.; Dybowski, K.; Jędrzejczak, A.; Sobczyk-Guzenda, A.; Januszewicz, B.; Szymański, W.; Kowalczyk, P.; Kaźmierczak, T.; Siniarski, J.; Kula, P. Impact of a Graphene Oxide Reducing Agent on a Semi-Permeable Graphene/Reduced Graphene Oxide Forward Osmosis Membrane Filtration Efficiency. Membranes 2021, 11, 679. https://doi.org/10.3390/membranes11090679
Romaniak G, Dybowski K, Jędrzejczak A, Sobczyk-Guzenda A, Januszewicz B, Szymański W, Kowalczyk P, Kaźmierczak T, Siniarski J, Kula P. Impact of a Graphene Oxide Reducing Agent on a Semi-Permeable Graphene/Reduced Graphene Oxide Forward Osmosis Membrane Filtration Efficiency. Membranes. 2021; 11(9):679. https://doi.org/10.3390/membranes11090679
Chicago/Turabian StyleRomaniak, Grzegorz, Konrad Dybowski, Anna Jędrzejczak, Anna Sobczyk-Guzenda, Bartłomiej Januszewicz, Witold Szymański, Paulina Kowalczyk, Tomasz Kaźmierczak, Jan Siniarski, and Piotr Kula. 2021. "Impact of a Graphene Oxide Reducing Agent on a Semi-Permeable Graphene/Reduced Graphene Oxide Forward Osmosis Membrane Filtration Efficiency" Membranes 11, no. 9: 679. https://doi.org/10.3390/membranes11090679
APA StyleRomaniak, G., Dybowski, K., Jędrzejczak, A., Sobczyk-Guzenda, A., Januszewicz, B., Szymański, W., Kowalczyk, P., Kaźmierczak, T., Siniarski, J., & Kula, P. (2021). Impact of a Graphene Oxide Reducing Agent on a Semi-Permeable Graphene/Reduced Graphene Oxide Forward Osmosis Membrane Filtration Efficiency. Membranes, 11(9), 679. https://doi.org/10.3390/membranes11090679