Article

A Theoretical Analysis on a Multi-Bed Pervaporation Membrane Reactor during Levulinic Acid Esterification Using the Computational Fluid Dynamic Method

by
Milad Ghahremani
1,
Kamran Ghasemzadeh
1,*,
Elham Jalilnejad
1 and
Adolfo Iulianelli
2,*
1
Faculty of Chemical Engineering, Urmia University of Technology, Urmia 5756151818, Iran
2
Institute on Membrane Technology of the Italian National Research Council (CNR-ITM), Via P. Bucci cubo 17/C, 87036 Rende, CS, Italy
*
Authors to whom correspondence should be addressed.
Membranes 2021, 11(8), 635; https://doi.org/10.3390/membranes11080635
Submission received: 15 July 2021 / Revised: 28 July 2021 / Accepted: 12 August 2021 / Published: 17 August 2021
(This article belongs to the Special Issue State-of-the-Art Membrane Science and Technology in Italy 2021, 2022)

Abstract

:
Pervaporation is a peculiar membrane separation process, which is considered for integration with a variety of reactions in promising new applications. Pervaporation membrane reactors have some specific uses in sustainable chemistry, such as the esterification processes. This theoretical study based on the computational fluid dynamics method aims to evaluate the performance of a multi-bed pervaporation membrane reactor (including poly (vinyl alcohol) membrane) to produce ethyl levulinate as a significant fuel additive, coming from the esterification of levulinic acid. For comparison, an equivalent multi-bed traditional reactor is also studied at the same operating conditions of the aforementioned pervaporation membrane reactor. A computational fluid dynamics model was developed and validated by experimental literature data. The effects of reaction temperature, catalyst loading, feed molar ratio, and feed flow rate on the reactor’s performance in terms of levulinic acid conversion and water removal were hence studied. The simulations indicated that the multi-bed pervaporation membrane reactor results to be the best solution over the multi-bed traditional reactor, presenting the best simulation results at 343 K, 2 bar, catalyst loading 8.6 g, feed flow rate 7 mm3/s, and feed molar ratio 3 with levulinic acid conversion equal to 95.3% and 91.1% water removal.

Graphical Abstract

1. Introduction

Global warming caused by the growing greenhouse gases generation has been currently recognized as a major environmental problem. The use of petroleum-derived fossil fuel and the concomitant vegetation areas reduction are the main causes of a rise in CO2 concentration in the atmosphere. Apart from the CO2 effect, an increase in other industrial byproducts such as chlorofluorocarbons, hydrocarbons, methane, nitrogen oxides (NOx), and sulfur oxides (SOx) also increase the greenhouse effect. From an environmental point of view, the main advantage of using biofuels is reducing the effect of greenhouse and acid rain. As a renewable fuel option, in the near future, the importance of using biodiesel and bio-ethanol and, in the medium future, the importance of using biomass-derived Fischer-Tropsch diesel and cellulosic biomass-based additives will increase. Biomass-based ethyl levulinate (EtLA) is a significant fuel additive. The use of EtLA as a bio-fuel provides higher engine efficiency and lower CO and NOx emissions in addition to providing long operating life. Since diesel engines are responsible for high NOx and exhaust gas emissions, they have negative effects on the environment. To solve this issue, one of the most effective methods consists of the addition of oxygenates to fossil fuels, which are known as alkyl levulinate as a fuel oxygenate. EtLA attracted special attention due to its properties of high ignition temperature, 33% oxygen content, and high-efficiency clean combustion [1,2,3,4,5,6]. Levulinate esters are important chemical compounds used as fuel additives, solvents, and plasticizers. Ethyl levulinate can be used as a bio-additive in diesel fuel up to 5 wt%. The EtLA is synthesized by esterification of levulinic acid (LA) with ethanol (Et) in the presence of homogeneous or heterogeneous acid catalysts. Both reactants are produced from bio-based sources. The use of bio-based reactants makes the production of EtLA process green and environmentally friendly [7,8]. EtLA is usually synthesized by using acid catalysts such as H2SO4, HCl, and H3PO4. They are unrecyclable and corrosive. Therefore, in recent years, many research groups explored the potential of green catalysts use. Heterogeneous solid acid catalysts are a suitable alternative to overcome the drawbacks of homogeneous acid catalysts. Heterogeneous catalysts can be separated from the reaction mixtures easily and reused for repeated runs [8,9,10,11].
Nowadays, membrane processes belong to a large group of techniques for separating the components of liquid and gas mixtures, depending on the properties of the used membranes and the specific characteristics of the separation itself. Different membrane operations are currently adopted for separating products ranging in size from tens of µm to tenths of nm, and particular types of membranes allow for the separation of vapors, gases, ions, etc. (reverse osmosis, nanofiltration, and membrane distillation). Among them, membrane pervaporation (PV) is useful for separating liquid mixtures, including those forming azeotropes. It depends on the selective sorption and diffusion rate differences and not from the liquid-vapor equilibrium. Most of the polymeric membranes used currently in PV processes may be categorized as in the following:
  • Inert membranes possessing hydrophilic nature (i.e., polyvinyl alcohol, cellulose acetate);
  • Inert membranes possessing hydrophobic nature (i.e., polydimethylsiloxane);
  • Hydrophilic ion exchange membranes.
Furthermore, membrane engineering deals also with the combination of two or more operation units in order to provide benefits such as the reduction in the cost of investment and the energy consumption. In this regard, pervaporation membrane reactors (PVMRs) may perform both the reaction and separation stages simultaneously. The application of PVMR enhances the conversion of reversible reactions as a result of the continuous removal from the reaction mixture of the byproduct with a membrane. Esterification of carboxylic acids and alcohols is a typical example of an equilibrium-limited reaction that produces ester and water as products. Limited by the equilibrium conversion, the aforementioned process generally shows low conversion, and an excess of reactants is required to enhance its value, determining an increase in the costs. Accordingly, removing reaction products from the reaction side, for instance, an ester or water, by pervaporation allows that, for the Le Chatelier principle, the reaction may be shifted toward the products. The esterification of LA with Et to produce EtLA and water is reported in the following [12,13,14,15,16,17,18,19,20]:
LA + Et ↔ EtLA + H2O
Numerical models could be useful to avoid high experimental costs and to develop a better understanding of the effects of various parameters for the design and the fruitful application of PVMR in the levulinic acid esterification (LA-ESR) as well as for specific features and constraints such as the need of obtaining high conversion. To this purpose, the computational fluid dynamic (CFD) tool is a feasible method to simulate detailed liquid flow characteristics at any point of a membrane system. Indeed, the CFD approach can be used for the virtual prototyping of chemical reactors and separators. Since it is based on controlled volume methodology, the local variations of the fluid, thermal, and mass transport properties can be visualized in comparison to simple models and used to design a PVMR [21,22,23,24]. Nevertheless, to our best knowledge, there are not CFD-based studies about the application of PVMR for the LA-ESR. In this work, the LA-ESR reaction in a multi-bed PVMR (MB-PVMR) was theoretically analyzed, using the CFD method in order to evaluate the effects of the most significant operating parameters such as the reaction temperature, catalyst loading, feed molar ratio, and feed flow rate on the performance of the MB-PVMR in terms of LA conversion and water removal. Furthermore, the MB-PVMR performance was compared with those of a multi-bed traditional reactor (MB-TR) and discussed.

2. Developing of CFD Model

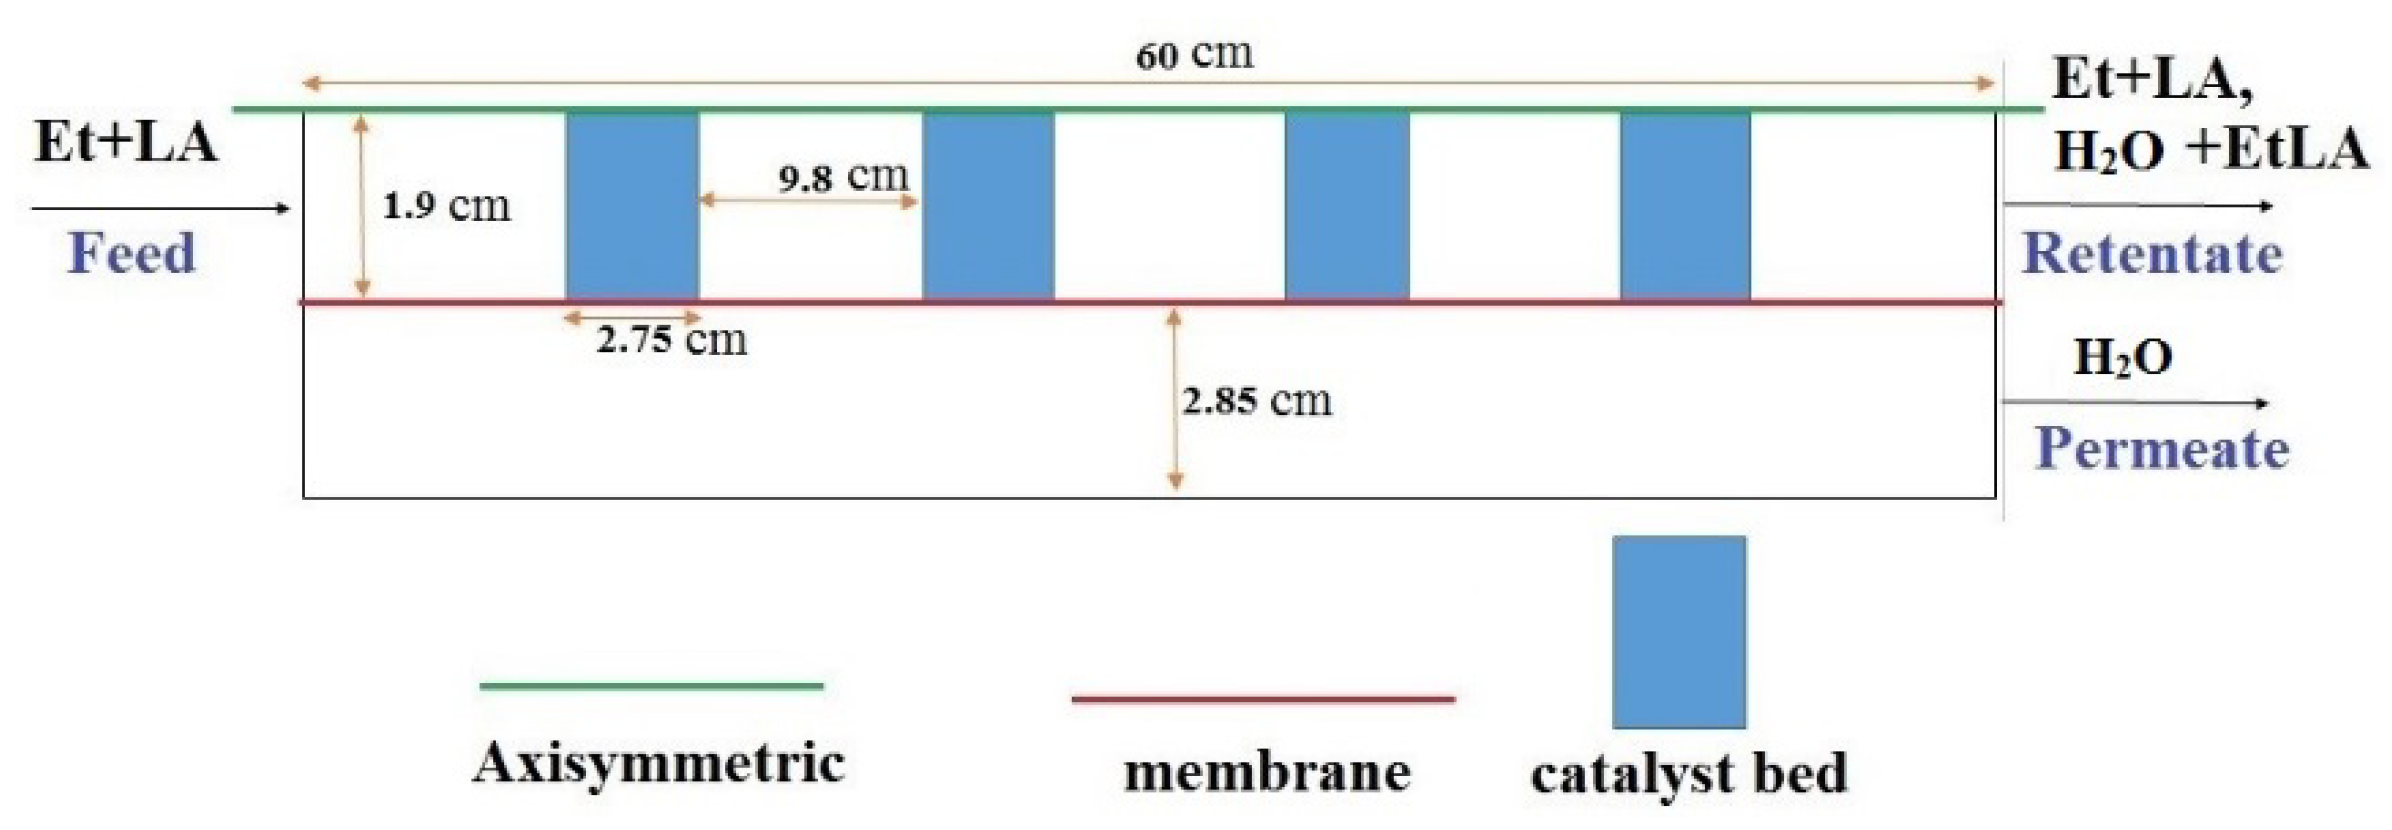
A CFD-based model was developed to simulate the performance of an MB-PVMR housing a poly(vinyl alcohol) (PVA) membrane, considering a two-dimensional and axisymmetric geometry. Figure 1 displays a simple scheme of the MB-PVMR (including four catalytic beds) adopted for EtLA production during LA-ESR reaction over a Smopex-101 catalyst. The main assumptions performed in the CFD simulations are summarized below:
  • Isothermal condition;
  • Steady-state regime;
  • The film transport resistance at the interface of feed/membrane was considered negligible;
  • Absence of concentration polarization effects;
  • Membrane and catalyst not affected by deactivation.

2.1. Governing Physical Equations

The governing equations in nonporous and porous zones are given in Table 1. The source term Si in the porous momentum equation is expressed as [25]:
S = μ K br   u + β F | u | u
where μ is the liquid mixture viscosity, Kbr is permeability, and β F is the Forchheimer coefficient for packed-bed particles. Kbr and β F are defined as:
K br = d cat 2   ε 3 180 ( 1 ε ) 2
β F = 1 · 75 ρ 150 K br ε 3
The effective diffusion in porous media,   D ei , depends on the structure of the porous material and the phases involved. In saturated or partially saturated porous media, the effective diffusivity is defined as:
D ei = ε τ D Li
The fluid tortuosity for the Millington and Quirk model is:
τ = ε 1 / 3
where ε ,   ρ , dcat, and D Li are the porosity, density of fluid, diameter of catalyst particle, and single-phase diffusion coefficients for the species in fluid, respectively. The porosity and particle diameter were set at 0.3124 and 0.01 mm, respectively. Porosity for the nonporous zone was set at 1. The flow pattern at the nonporous zone momentum equation is laminar flow. Si in the porous species equation is the sink/source term of component i, which accounts for the addition or removal of component i into the system for permeation through the membrane. In this work, since only water permeates from the retentate to the permeate side, it appears as a sink term on the retentate side and a source term on the permeate side. In other words, Si = 0 is considered for all components except for H2O, which is calculated as:
S i = A   J H 2 O M H 2 O V
where A is the membrane surface, V is the computational cell volume, MH2O is the water molar weight, and JH2O is the water permeating flux across the PVA membrane, calculated by Equation (8):
JH2O = J0,H2O(CH2O,permeateCH2O,retentate)
The water permeating flux (J0,H2O) is reported at different temperatures in Table 2 [25].

2.2. Chemical Kinetic Reactions

The empirical reaction rate of LA-ESR reaction, conducted by Russo et al. [26,27] using Smopex-101 heterogeneous catalyst and the report self-catalyzed of this reaction is used as follows:
R 1 = k 1.0 c LA ( c LA c Et 1 K c EtLA c w ) ( self catalyzed )  
R 2 = k 2.0 ρ cat ( c LA c Et 1 K c EtLA c w ) ( heterogeneous   catalyst   =   Smopex 101 )
Rt = R1 + R2
r LA = r Et = Rt   and   r LAEt = r H 2 O = Rt
where Rt and R1 are the reaction rate at the catalytic and non-catalytic beds, respectively. Moreover, rate constants are defined according to Equation (12).
k i = k i 0   exp ( E i R ( 1 T 1 T ref ) )
In Equation (10), ρ cat is the catalyst density and K the equilibrium constant expressed as:
K = K ref   exp ( H R ( 1 T 1 T ref ) )
The parameters used of reaction rate constants are reported in Table 3.

2.3. Chemical-Physical Properties

The dependence of the liquid density on the temperature for each single component was evaluated according to the empirical expression reported below [27]:
ρ i = MW i · A i B i [ 1 + ( 1 T C i ) D i ]
The coefficients of Equation (14) for each component are reported in Table 4.
The evaluation of the diffusion coefficient (Di) of the various components was carried out in accordance with the Wilke and Chang equation for liquid systems [28]:
D i = 7 · 4 10 8 ( φ M i ) 1 / 2 T μ mix V i 0.6
where Vi represents the molar volume at the normal boiling point (cm3/mol), calculated through the inverse of Equation (14), and µmix is the viscosity of the reaction mixture (cP). The term ϕ is defined as association factor and depends on the nature of the chemical component (ϕLA = ϕEtLA = 1.0, ϕEt = 1.5 and ϕH2O = 2.6). The ϕMi was therefore obtained for each component according to the Equation (16):
ϕ M i = j n 1 x i j · ϕ i · MW i   ( n = 4 ; j i )
where x i j is a molar fraction, in each step, determined for three components, using the i-th component and varying the j factor [28]. The temperature dependence on the viscosity was hence evaluated for each single component present in the reaction system, based on the empirical expression retrieved from the CHEMCAD database [29].
μ i = exp ( A μ i + B μ i T + C μ i · ln ( T ) + D μ i T E μ i )
The coefficients of the Equation (17) for each component are reported in Table 5.

2.4. Boundary Conditions and Post Processing Definitions

In Table 6, the boundary conditions for retentate and permeate sides are shown. The following correlations were defined for describing the MB-PVMR performance in LA-ESR reaction:
LA conversion   ( % ) = LA in LA out LA in 100  
Water   removal   ( % ) = H 2 O Permeate H 2 O Permeate + H 2 O retentate 100
where LAin and LAout are the inlet and outlet levulinic acid molar flow rates, respectively, and H2Oretentate and H2Opermeate are the water molar flow rates in the retentate and permeate flow, respectively.

2.5. Numerical Method

Numerical simulations were performed using the commercial CFD package COMSOL Multiphysics 5.4, and the finite element method was used to solve the governing equations in the two-dimensional CFD model. Moreover, the pressure-velocity correction was performed using a coupling algorithm. Meanwhile, the equation solution was considered to be achieved when the residuals converged to values less than the magnitude of 10−5, and all the variable values were not changed with the iteration.

2.6. Mesh Independency

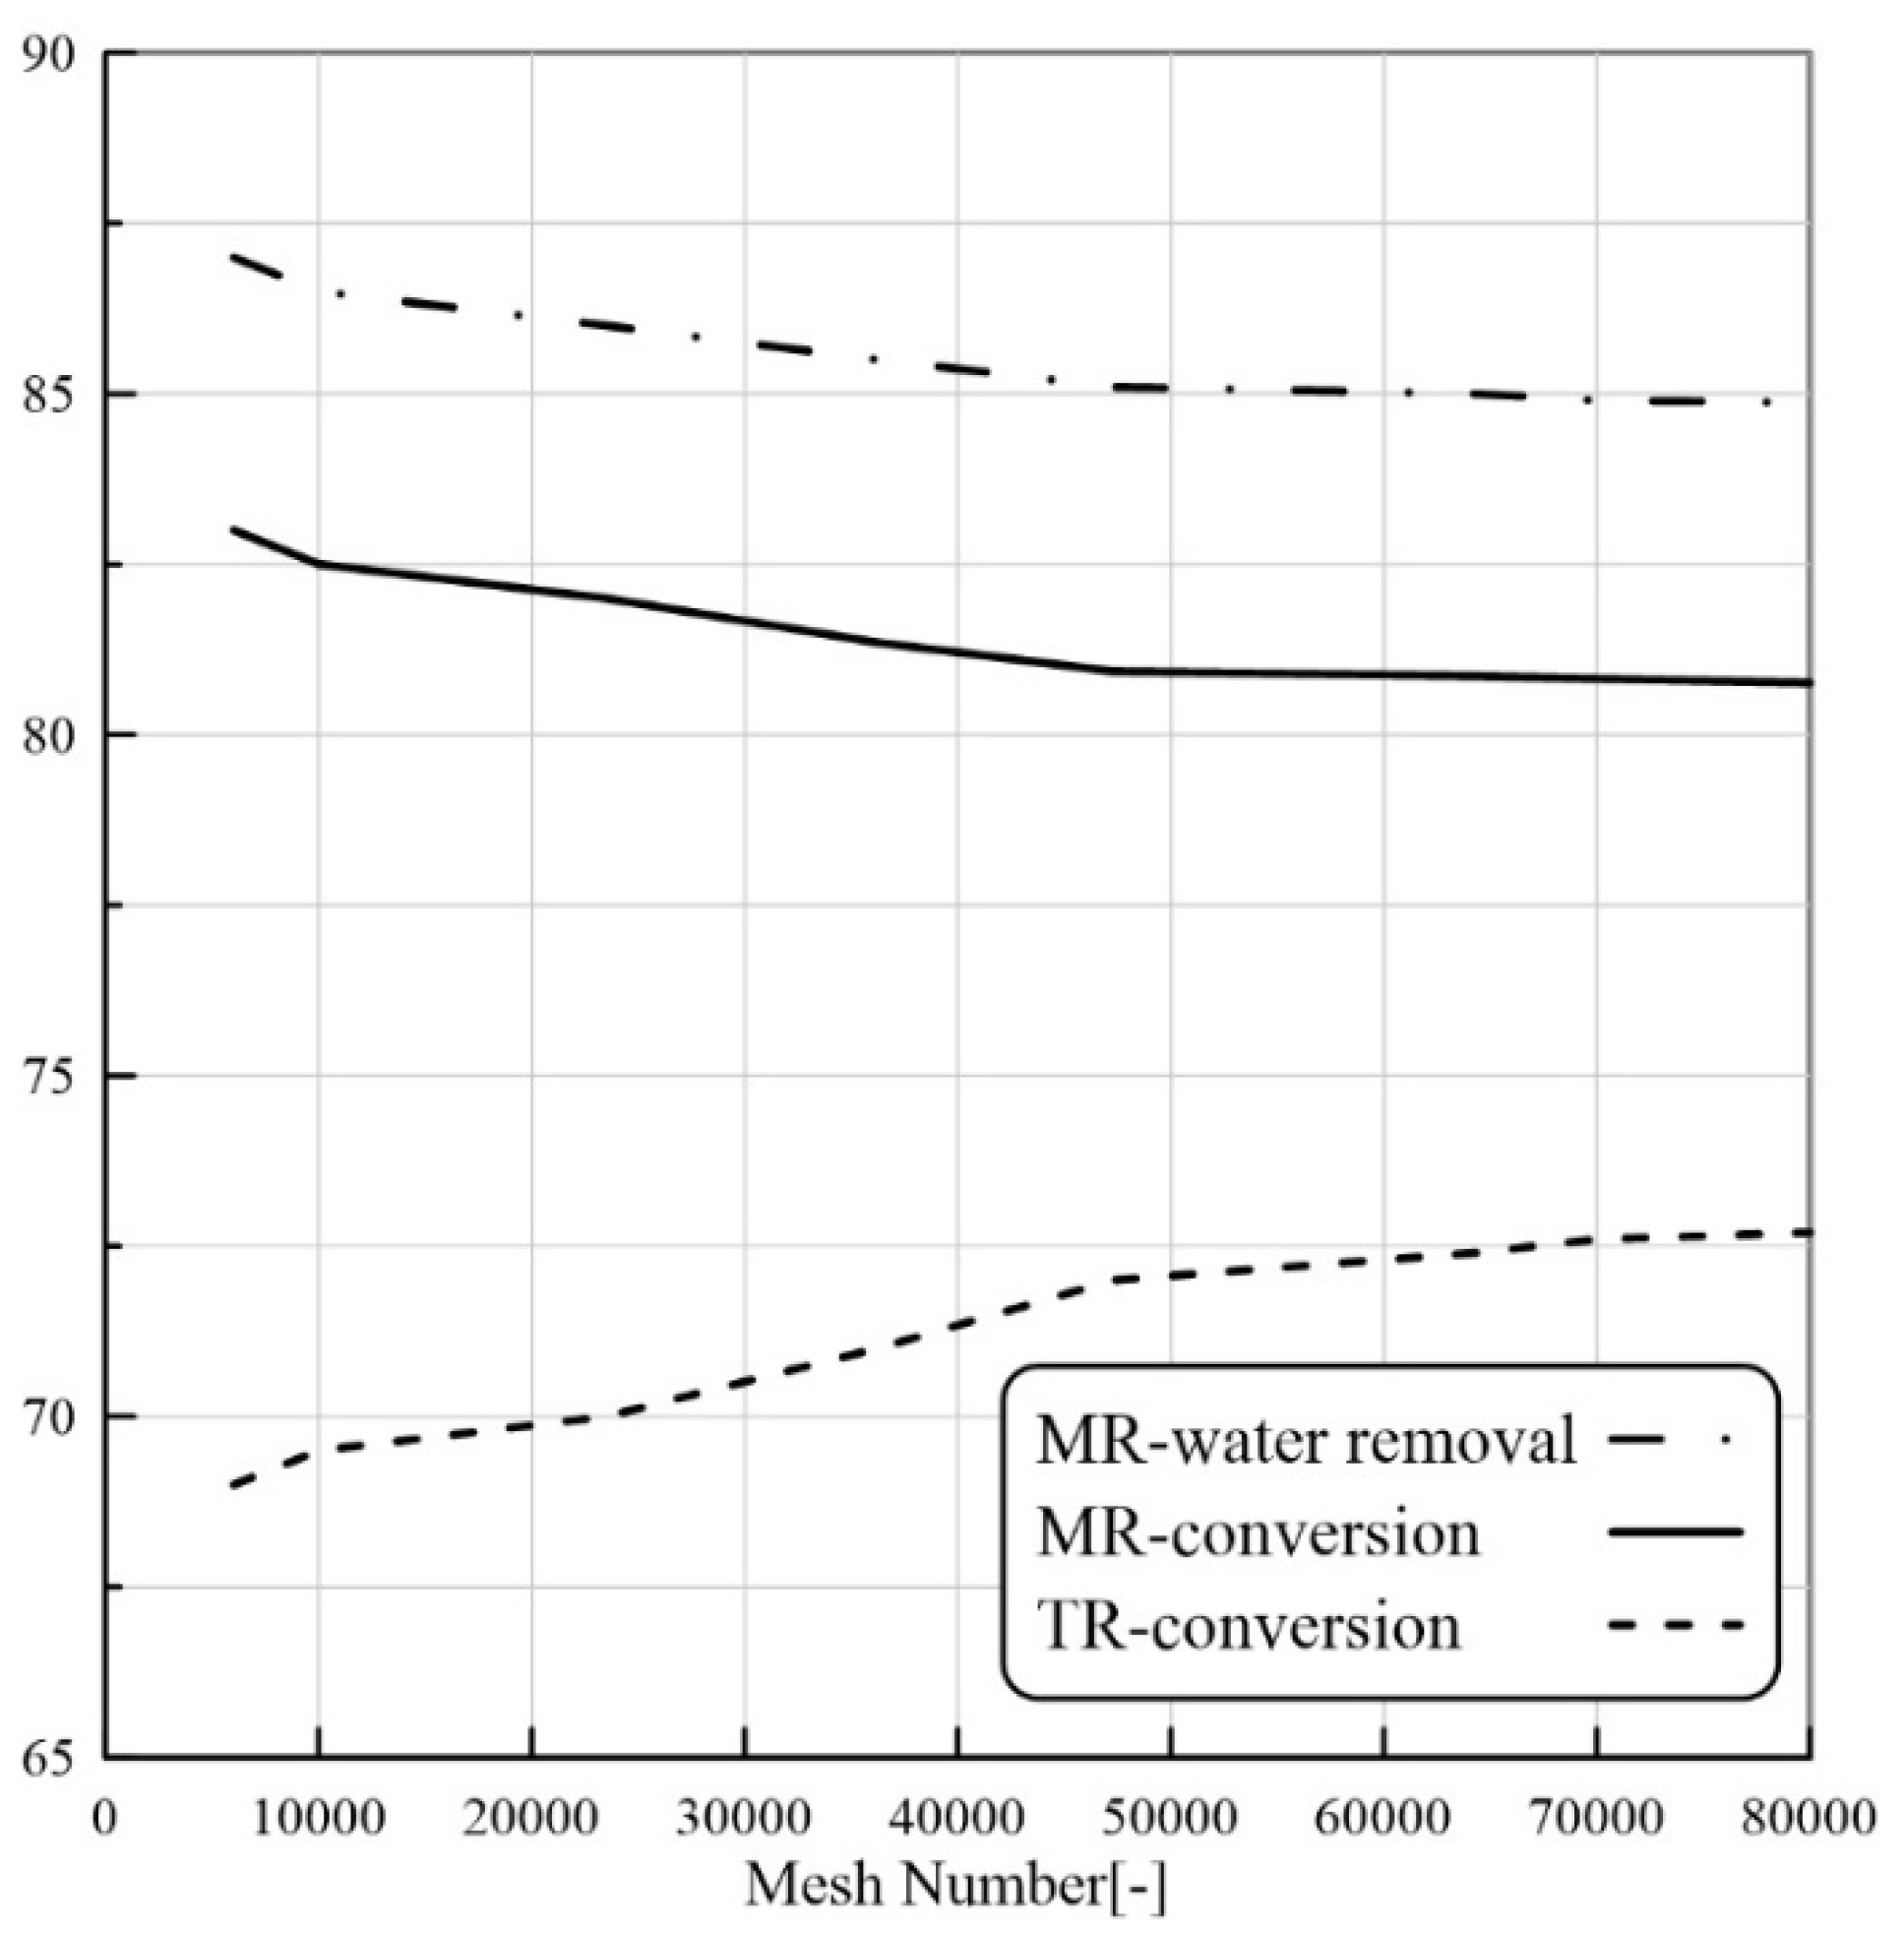
Another objective of the preliminary CFD simulations was to carry out a grid independence test. For this purpose, CFD simulations were carried out using different grid densities to find out the values beyond which the results become grid-independent. The investigated mesh numbers were 6020, 23,478, 36,240, 64,256, and 80,000. These simulations were carried out for MBPMR configuration during LA-ESR reaction (reaction temperature 343 K, feed flow rate 7 mm3/s, and molar ratio of Et/LA:1.25 and W = 8.6 g). The results for the grid independence tests are shown in Figure 2. The tracked parameter is the LA conversion. The results depict that beyond 48,000 meshes, the conversion shows a slowly decreasing trend, whereas it becomes constant at higher grid numbers. The finest grid was, therefore, identified as the grid density at which the solution becomes grid-independent. This grid number (48,000 meshes) was considered in all the final simulations discussed in the subsequent sections.

3. Result and Discussion

3.1. Model Validation

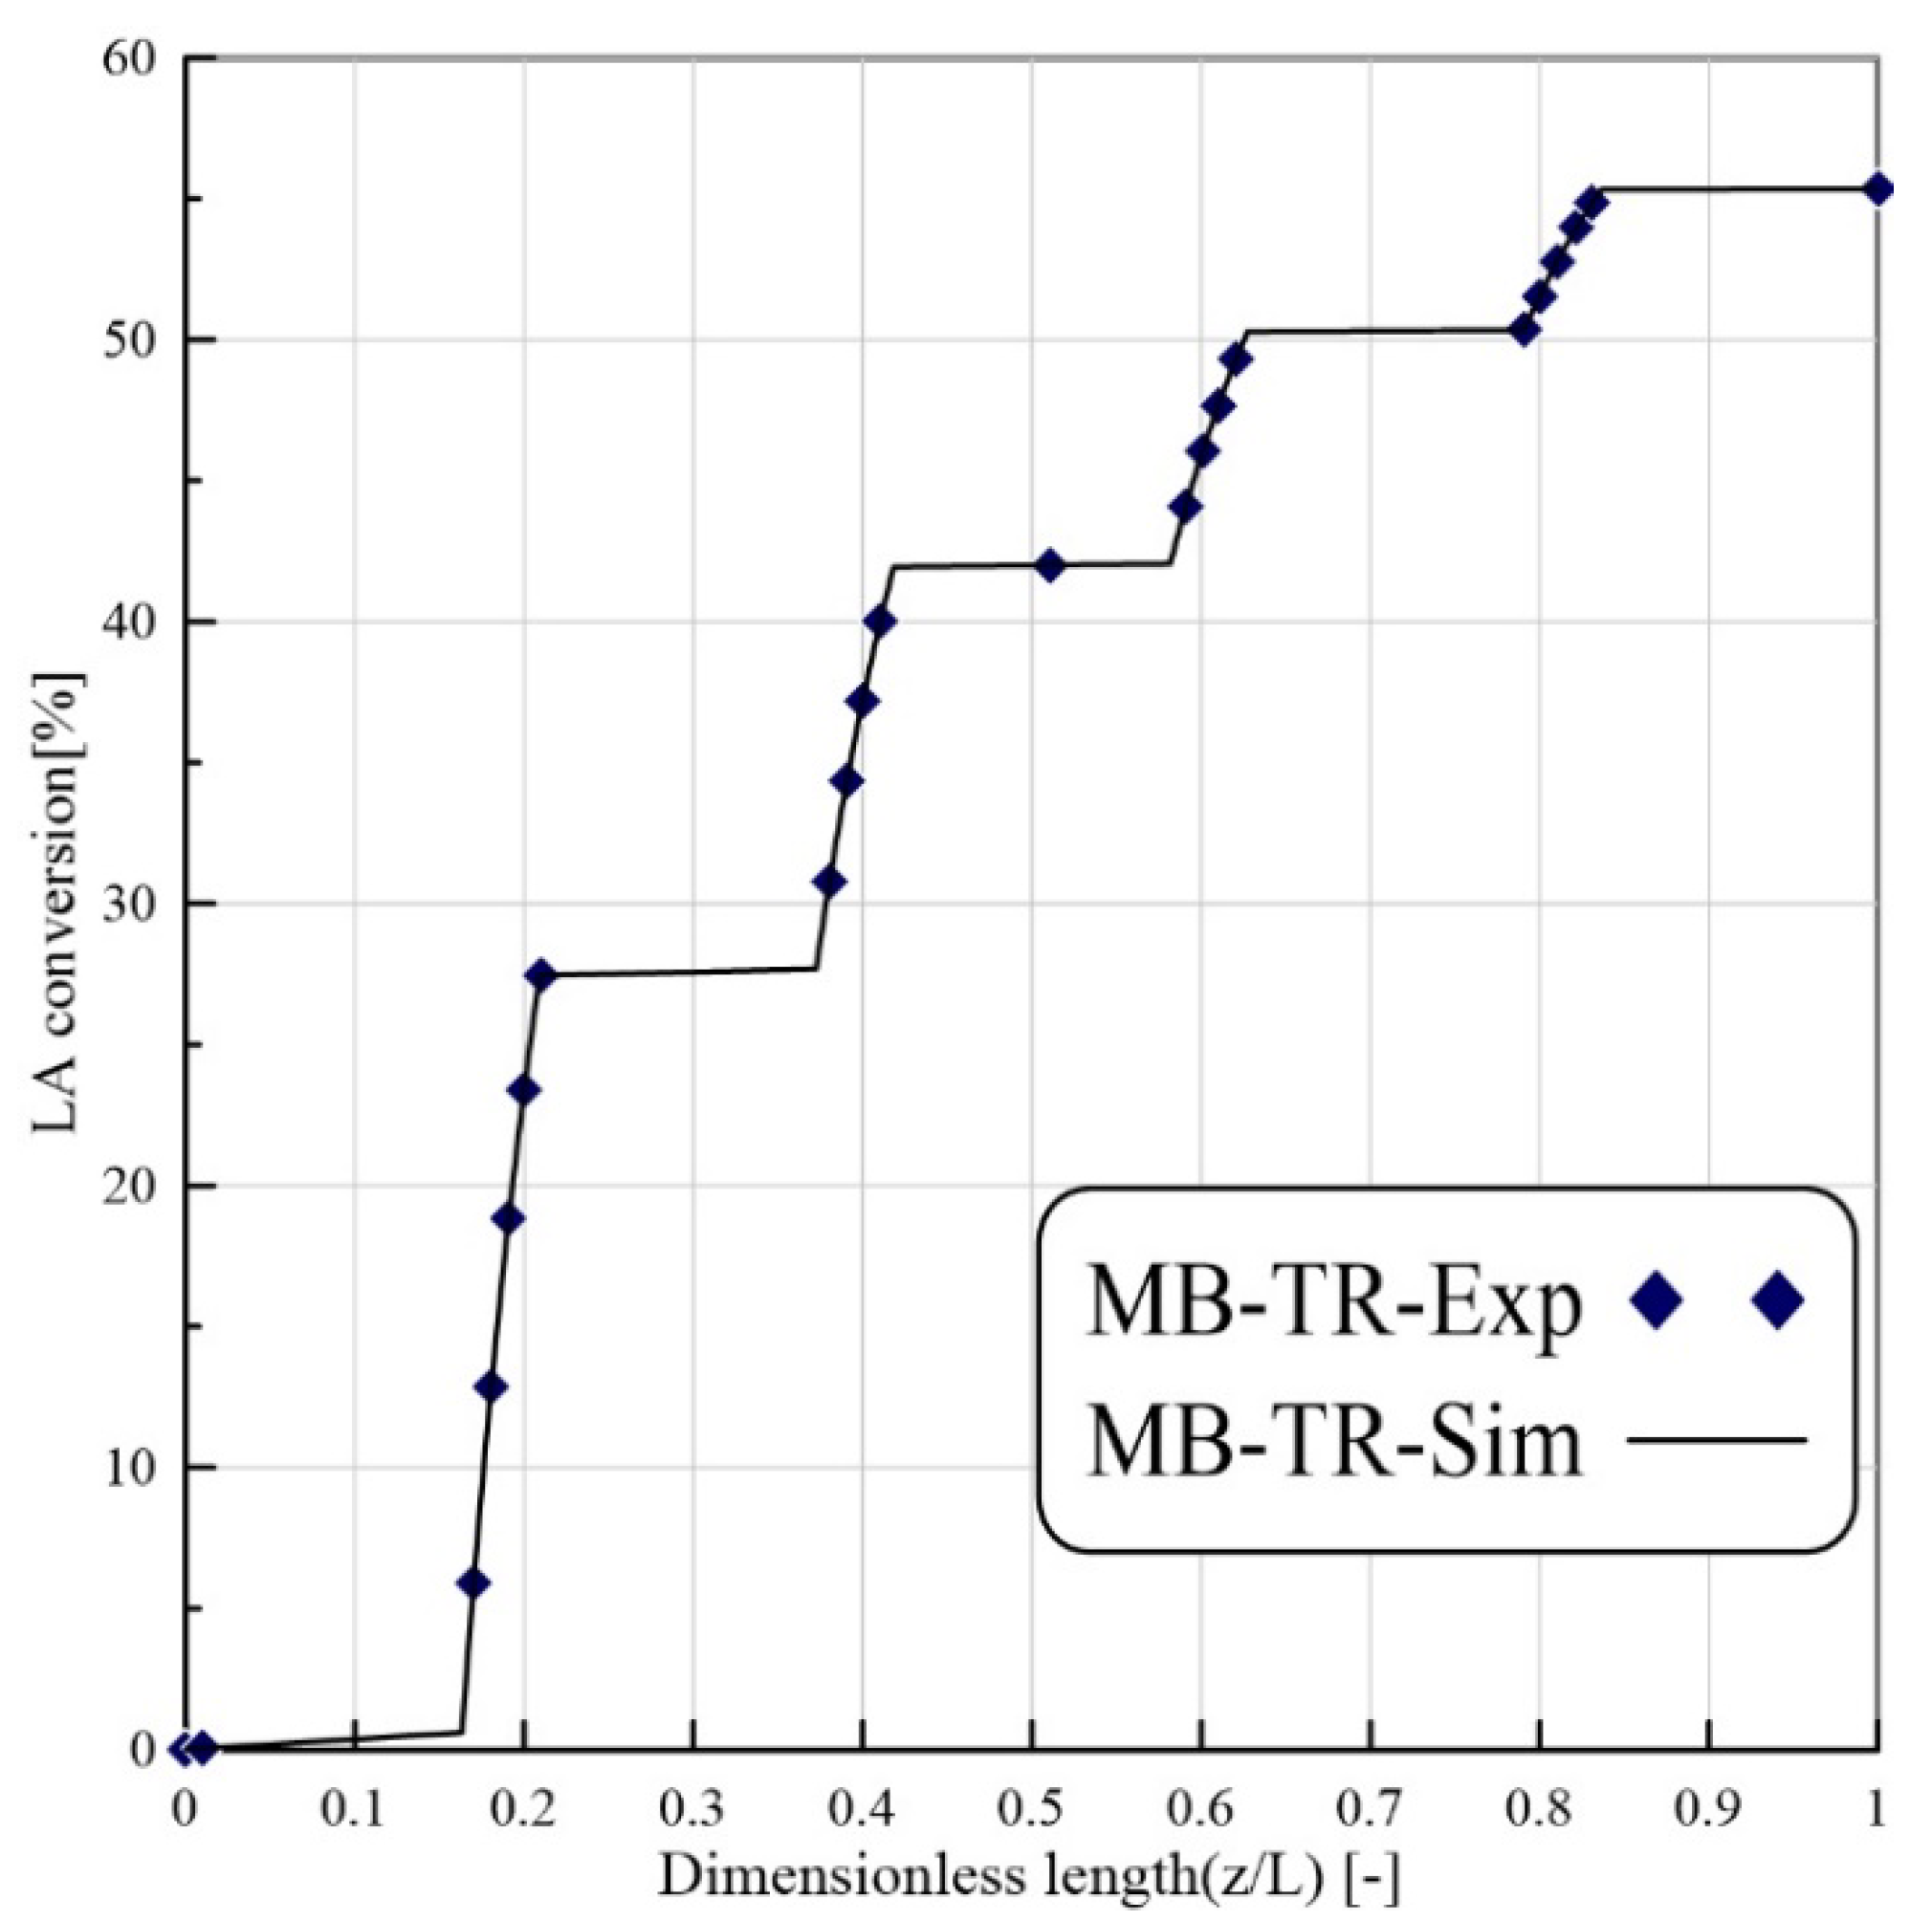
The exactness of the CFD model was confirmed using trial information of Russo et al. [27]. Figure 3 illustrates the LA conversion versus the reactor length for the MB-TR during the levulinic acid esterification reaction. The working conditions for the TR model are T = 333 K, Et/LA = 1:1 and volume flow rate = 16.7 mm3/s, W = 8.6 g. As shown in the latter figure, the simulated and the experimental values are in suitable agreement.

3.2. Concentration and Velocity Distributions

The velocity distributions in the MB-PVMR, including the retentate and permeate zones, are shown in Figure 4b. The velocity values are indicated by the different colors of contours in agreement with the scale shown on the right side of the chart, where velocity distribution at the nonporous zone follows a parabolic form in both sides of the MB-PVMR. Indeed, the maximum values of velocity are observed in the central area of the permeate and retentate sides. On the other hand, in the porous zone (catalyst bed), the velocity distribution is uniform in the catalyst bed. Figure 4a illustrated the velocity profile in porous and nonporous zones. Mole fraction distribution of H2O in both sides of the MB-PVMR is the most important parameter for the optimization of the process. Figure 5 sketches the distribution of H2O and levulinic acid concentrations as well as the permeation of water by membrane during production. The mass transfer flux in the shell and tube sides is composed of diffusion and convection. The convection mechanism tends to transfer H2O to the outlet of MB-PVMR owing to the high contribution of velocity in the vertical direction. The H2O is transferred toward the membrane by diffusional mass transfer that is responsible for the H2O removal.

3.3. Evaluation of Operating Parameters Effects

As reported in Table 7, after the preliminary CFD analysis, simulations were carried out to understand the effects of the most important operating parameters on the performance of the dense MB-PVMR in terms of LA conversion and water removal during LA-ESR reaction. The operating parameters were firstly checked in the model validation and, successively, we simulated the membrane reactor analyzing the mutual influence of them each other. This approach made it possible to understand from a theoretical point of view which kind of combination of operating conditions may determine better performance in terms of simulated conversion and water removal. In particular, the simulation sets can be subdivided into four parts, in which reaction temperature, catalyst loading, feed molar ratio, and feed flow rate values were changed for four cases of MB-PVMR and MB-TR.

3.3.1. Effect of Feed Molar Ratio on PVMR Performance

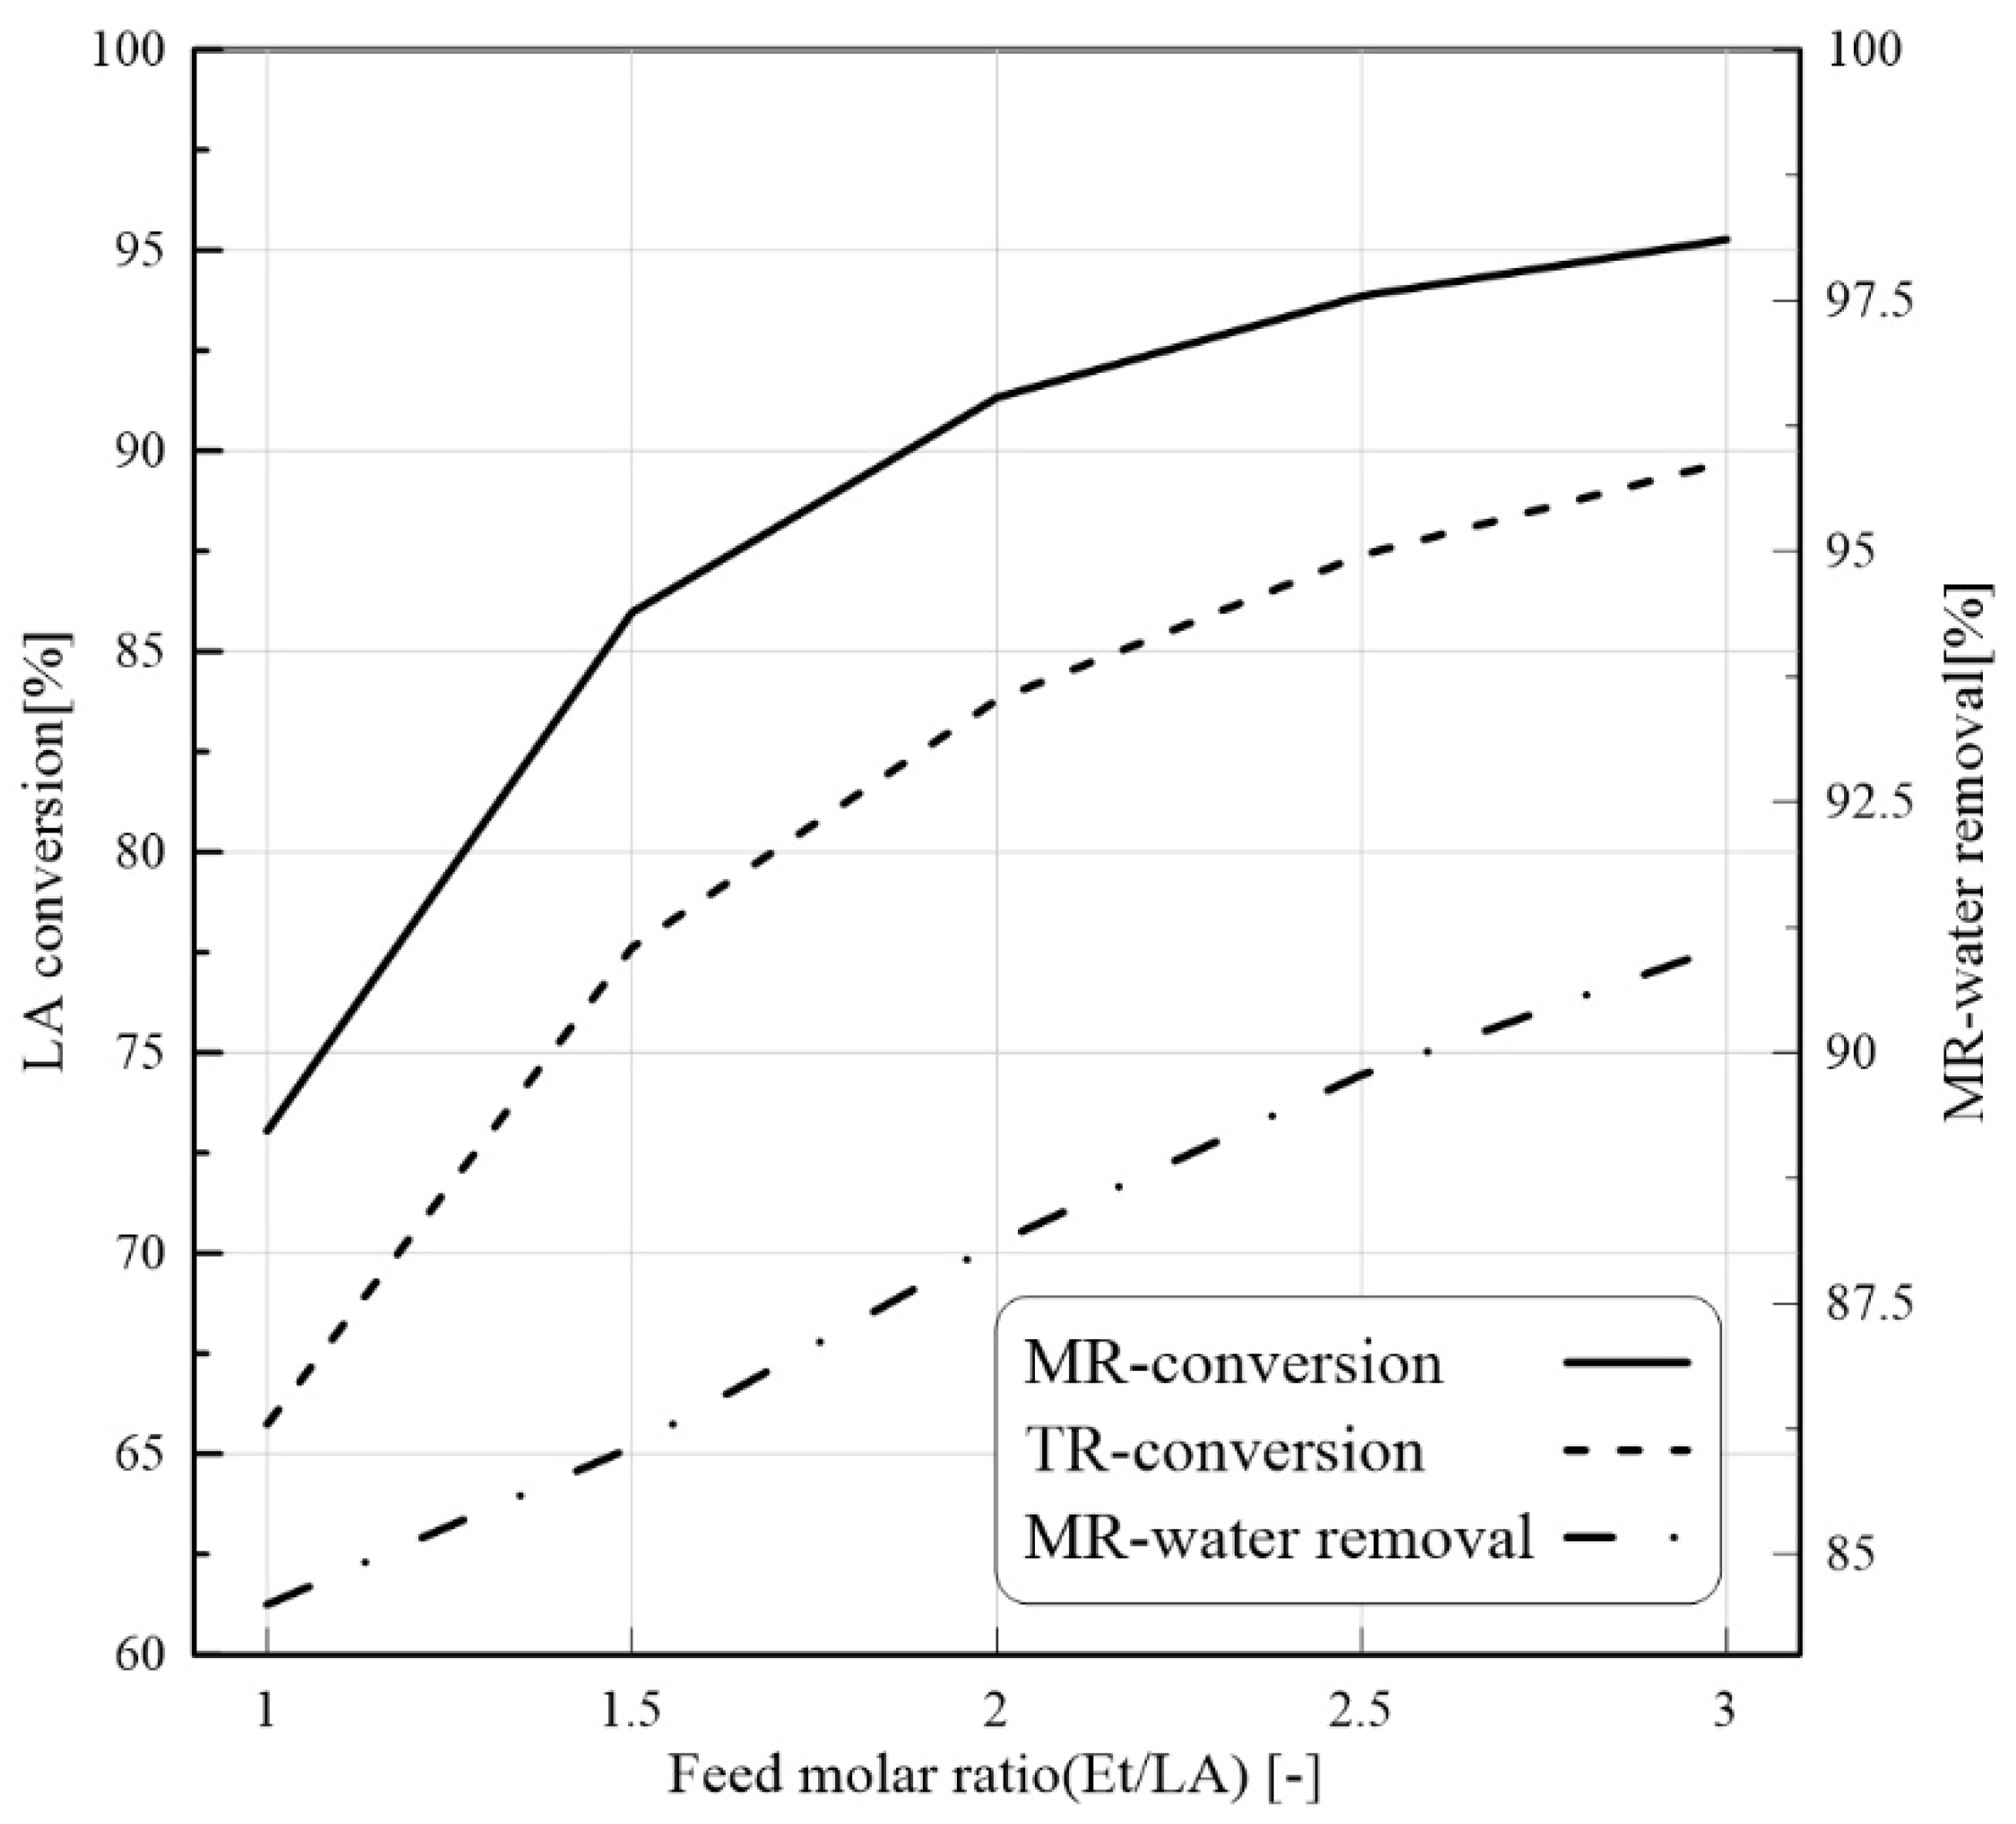
A further parameter that strongly affects the MB-PVMR performance is the feed molar ratio (Et/LA). High conversion of LA in higher content of Et is reachable. As shown in Figure 6, by increasing the feed molar ratio, LA conversion is enhanced. According to the LA-ESR reaction, an increase in Et/LA ratio may shift the reaction toward the products. Therefore, according to Le Chatelier’s principle, the LA conversion and water production can be improved at a higher Et/LA value. In the meantime, H2O removal is also improved (Figure 6). By considering the H2O compositions in both permeate and retentate sides, the H2O permeation driving force is increased at a higher feed molar ratio.

3.3.2. Effect of Feed Flow Rate on PVMR Performance

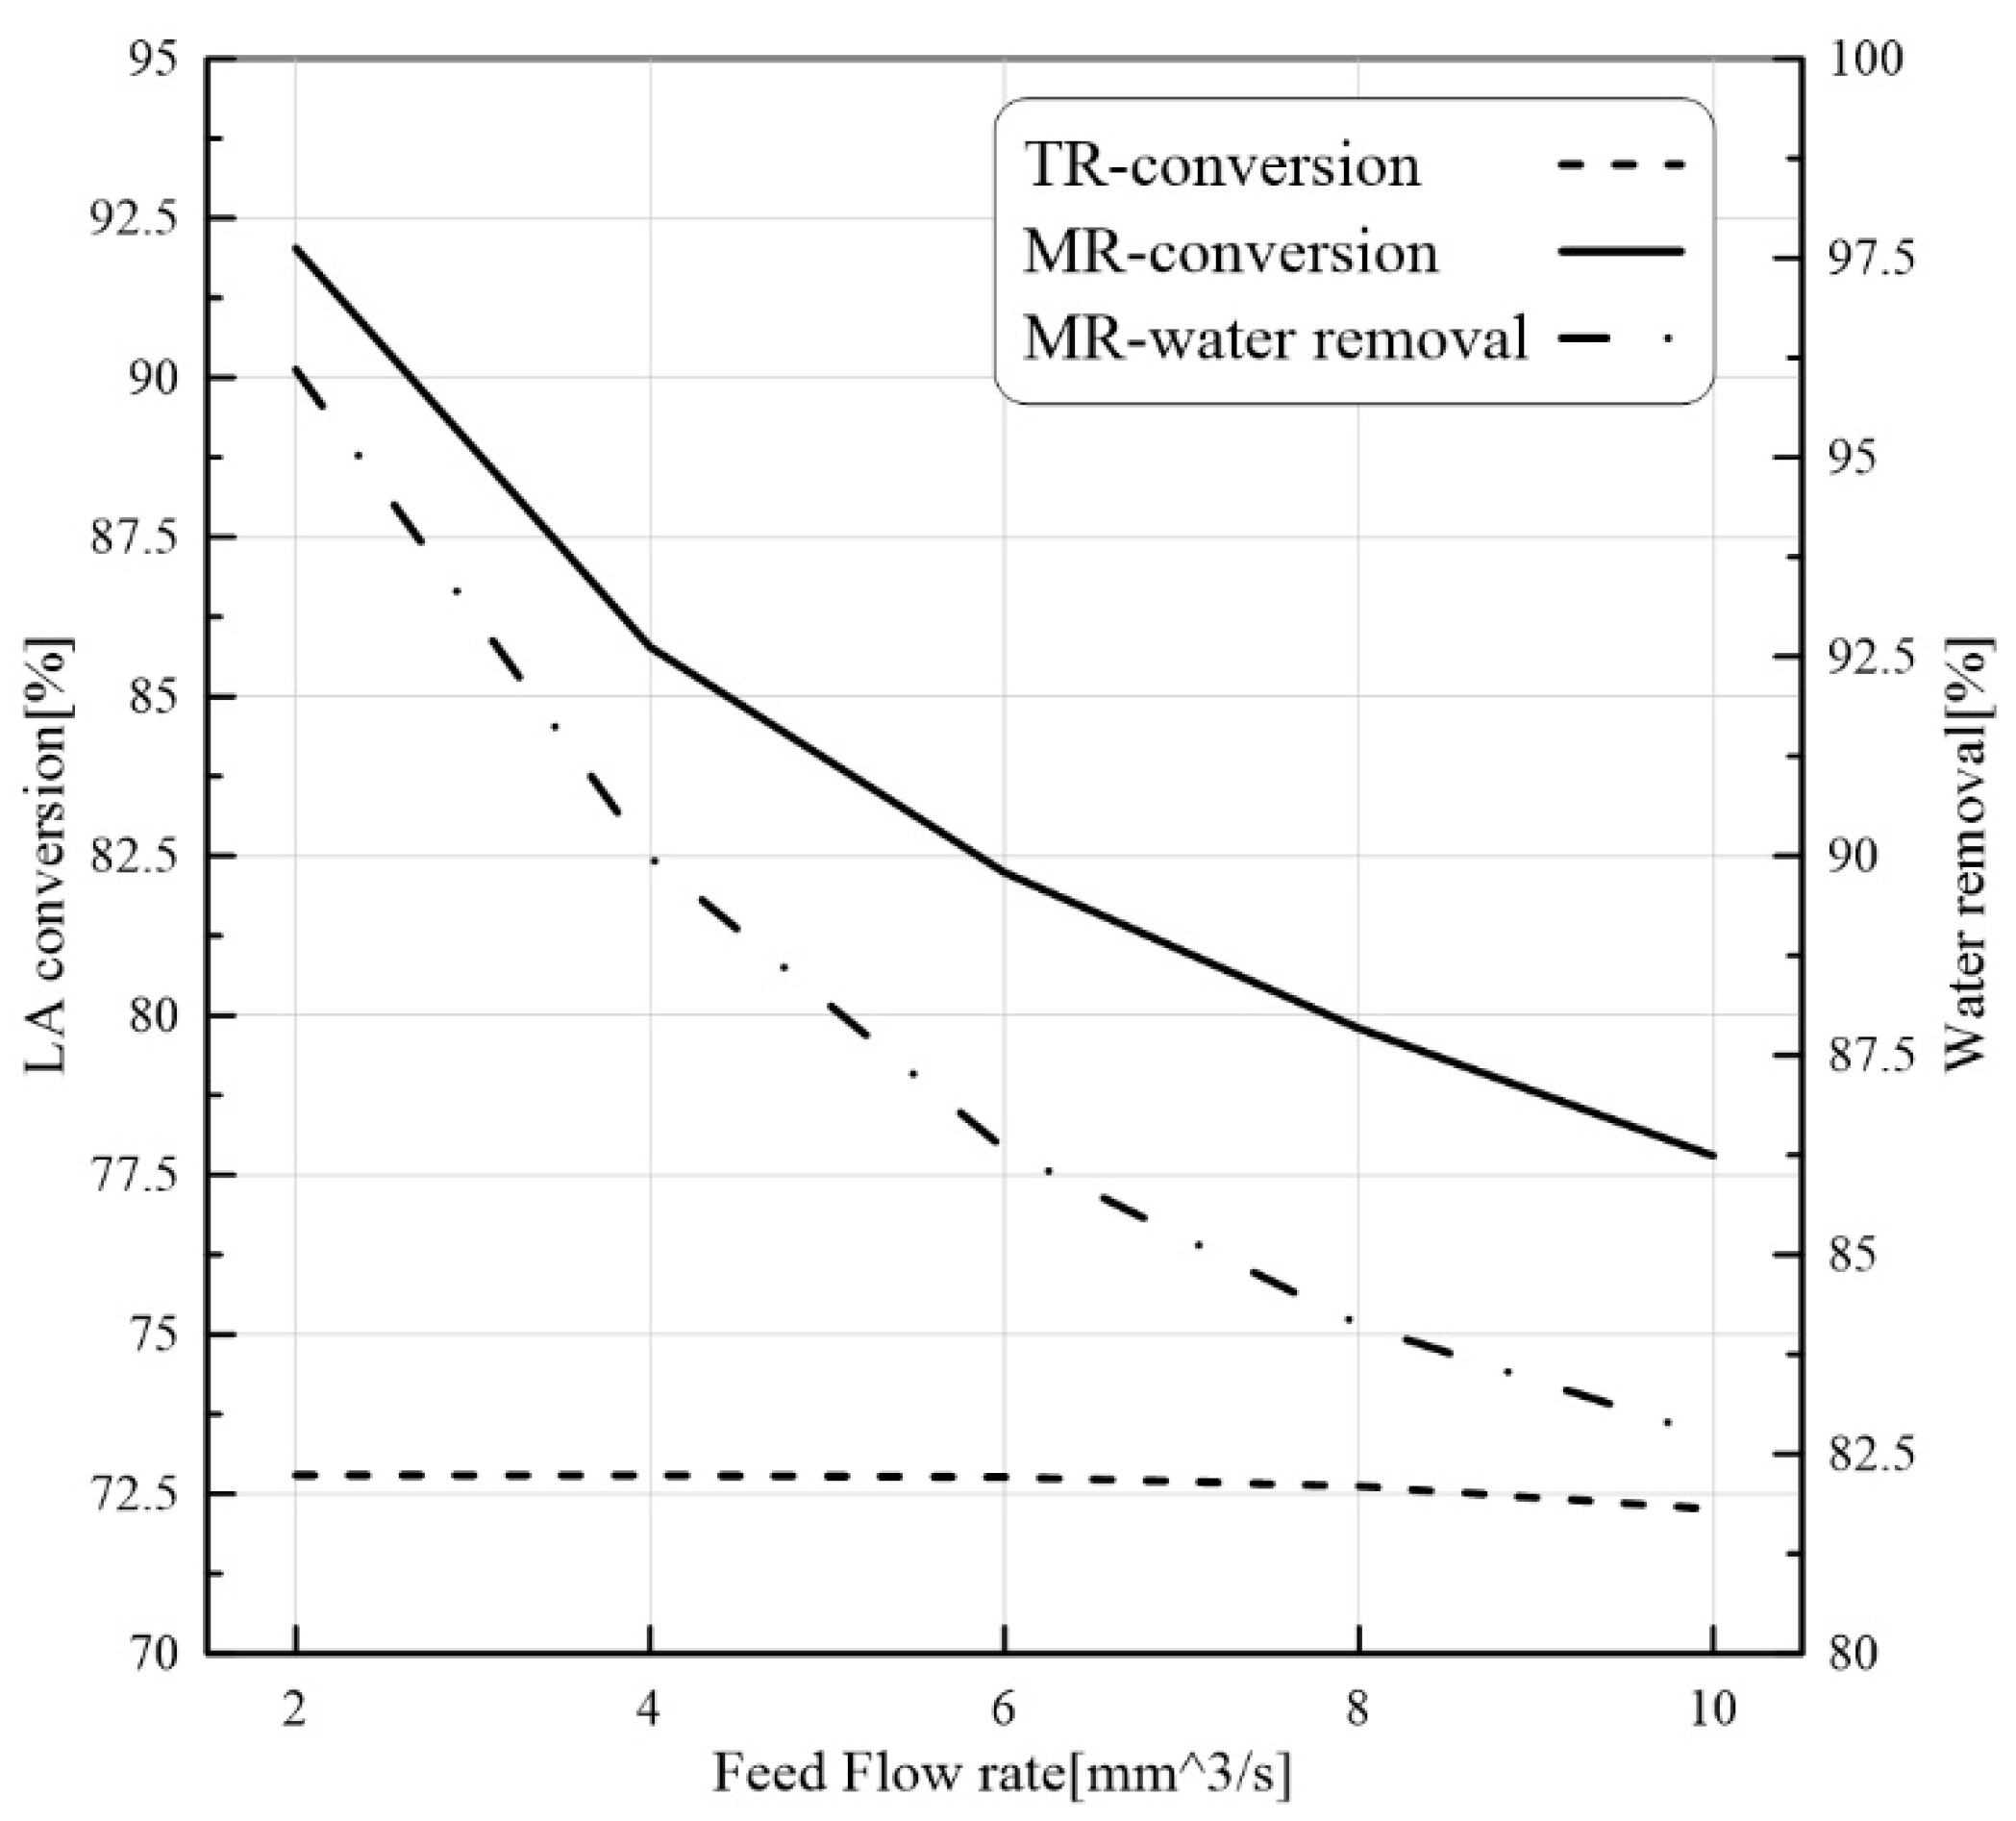
Residence time can be directly responsible for the conversion variation. It is clear that a higher flow rate may be responsible for a reduction in the residence time. As illustrated in Figure 7, an increase in feed flow rate reduced LA conversion. Similar to the previous case, LA conversion in the MB-PVMR is higher than that of the MB-TR. The higher the amount of H2O in the reaction zone, the higher the membrane surface required to overcome the reduction in H2O removal. Therefore, under a constant membrane area, the H2O removal is depleted. So, a feed flow rate increase from 2 to 10 mm3/s reduced the LA conversion from ~ 92% to ~ 78% in the MB-PVMR and from ~ 72.8% to 72.26% in the MB-TR.

3.3.3. Effect of Catalyst Loading on PVMR Performance

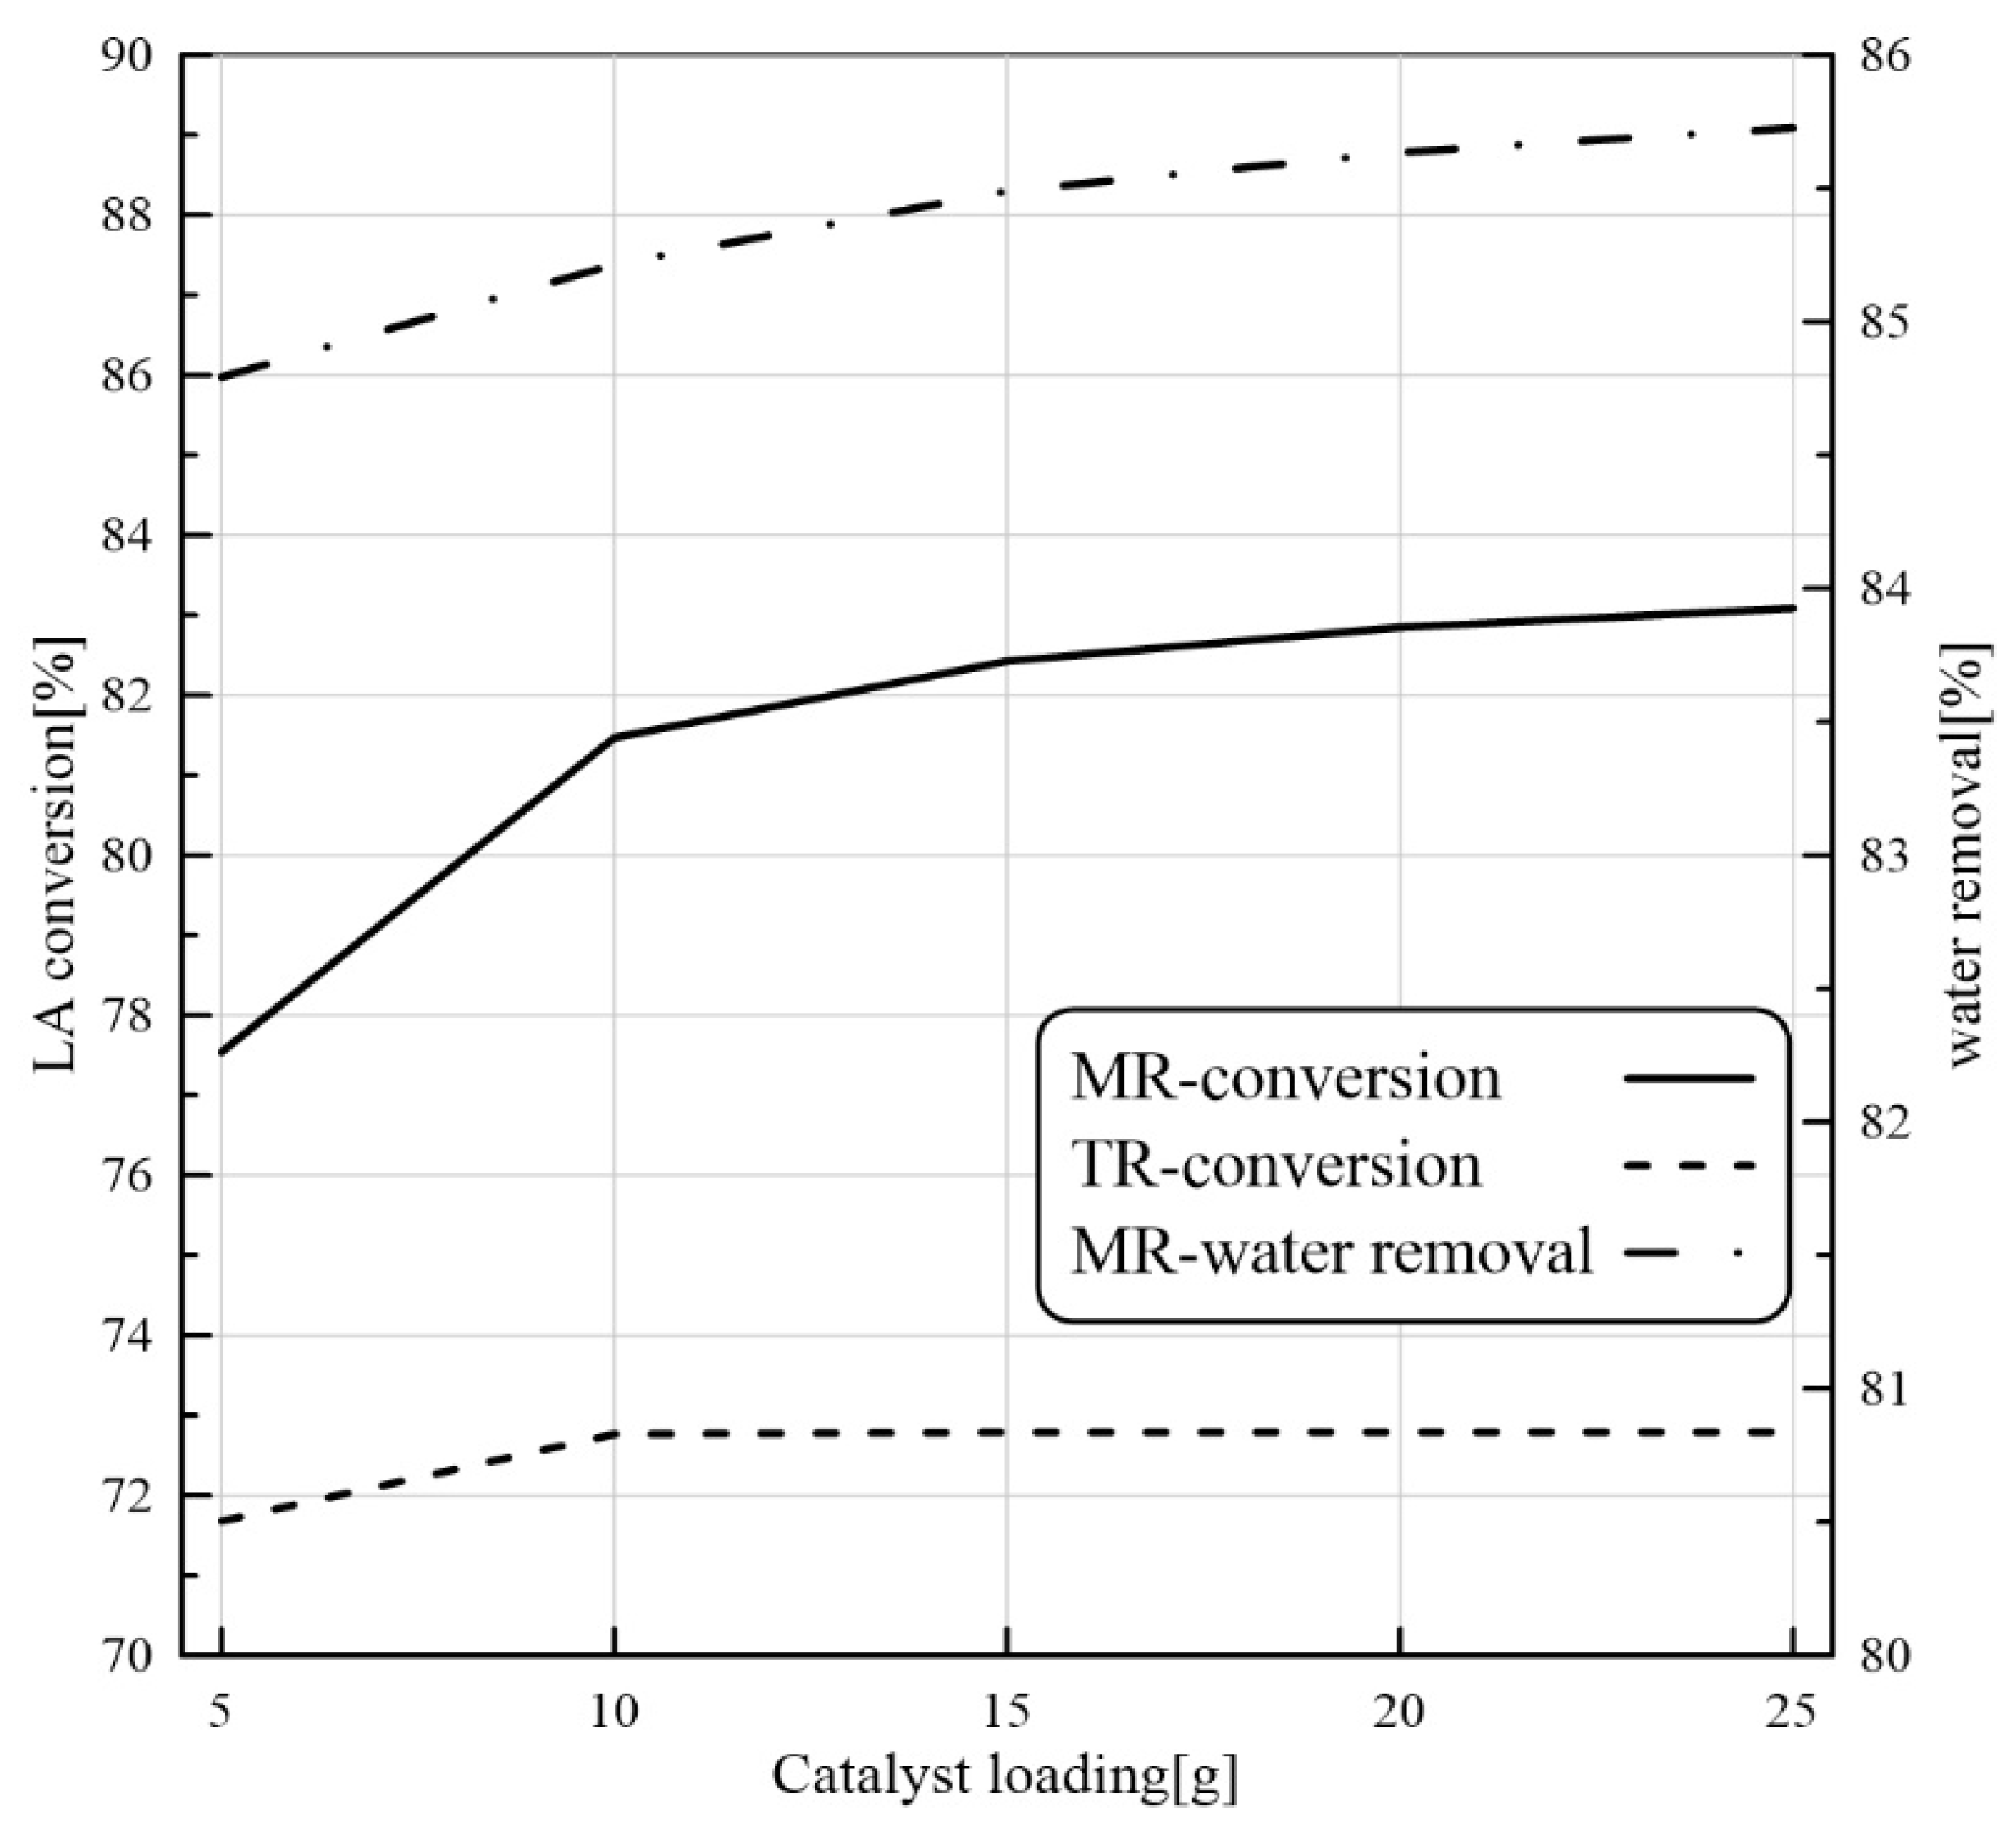
The catalyst performance during the reaction process is restricted by the catalyst load. Figure 8 depicts the impact of the catalyst load on the LA conversion and H2O removal in the MB-TR and MB-PVMR. Looking at the profiles of Figure 8, it is possible to observe that the increase in the catalyst load promotes the LA conversion. A slightly higher LA conversion in the MB-PVMR than that in the MB-TR is observed. The reason for that is attributed to the water separation in the MB-PVMR. In fact, by increasing the catalyst load, the conversion is enhanced and, therefore, H2O production is improved, leading to an increase in the driving force for a larger H2O removal.

3.3.4. Effect of Temperature Reaction on PVMR Performance

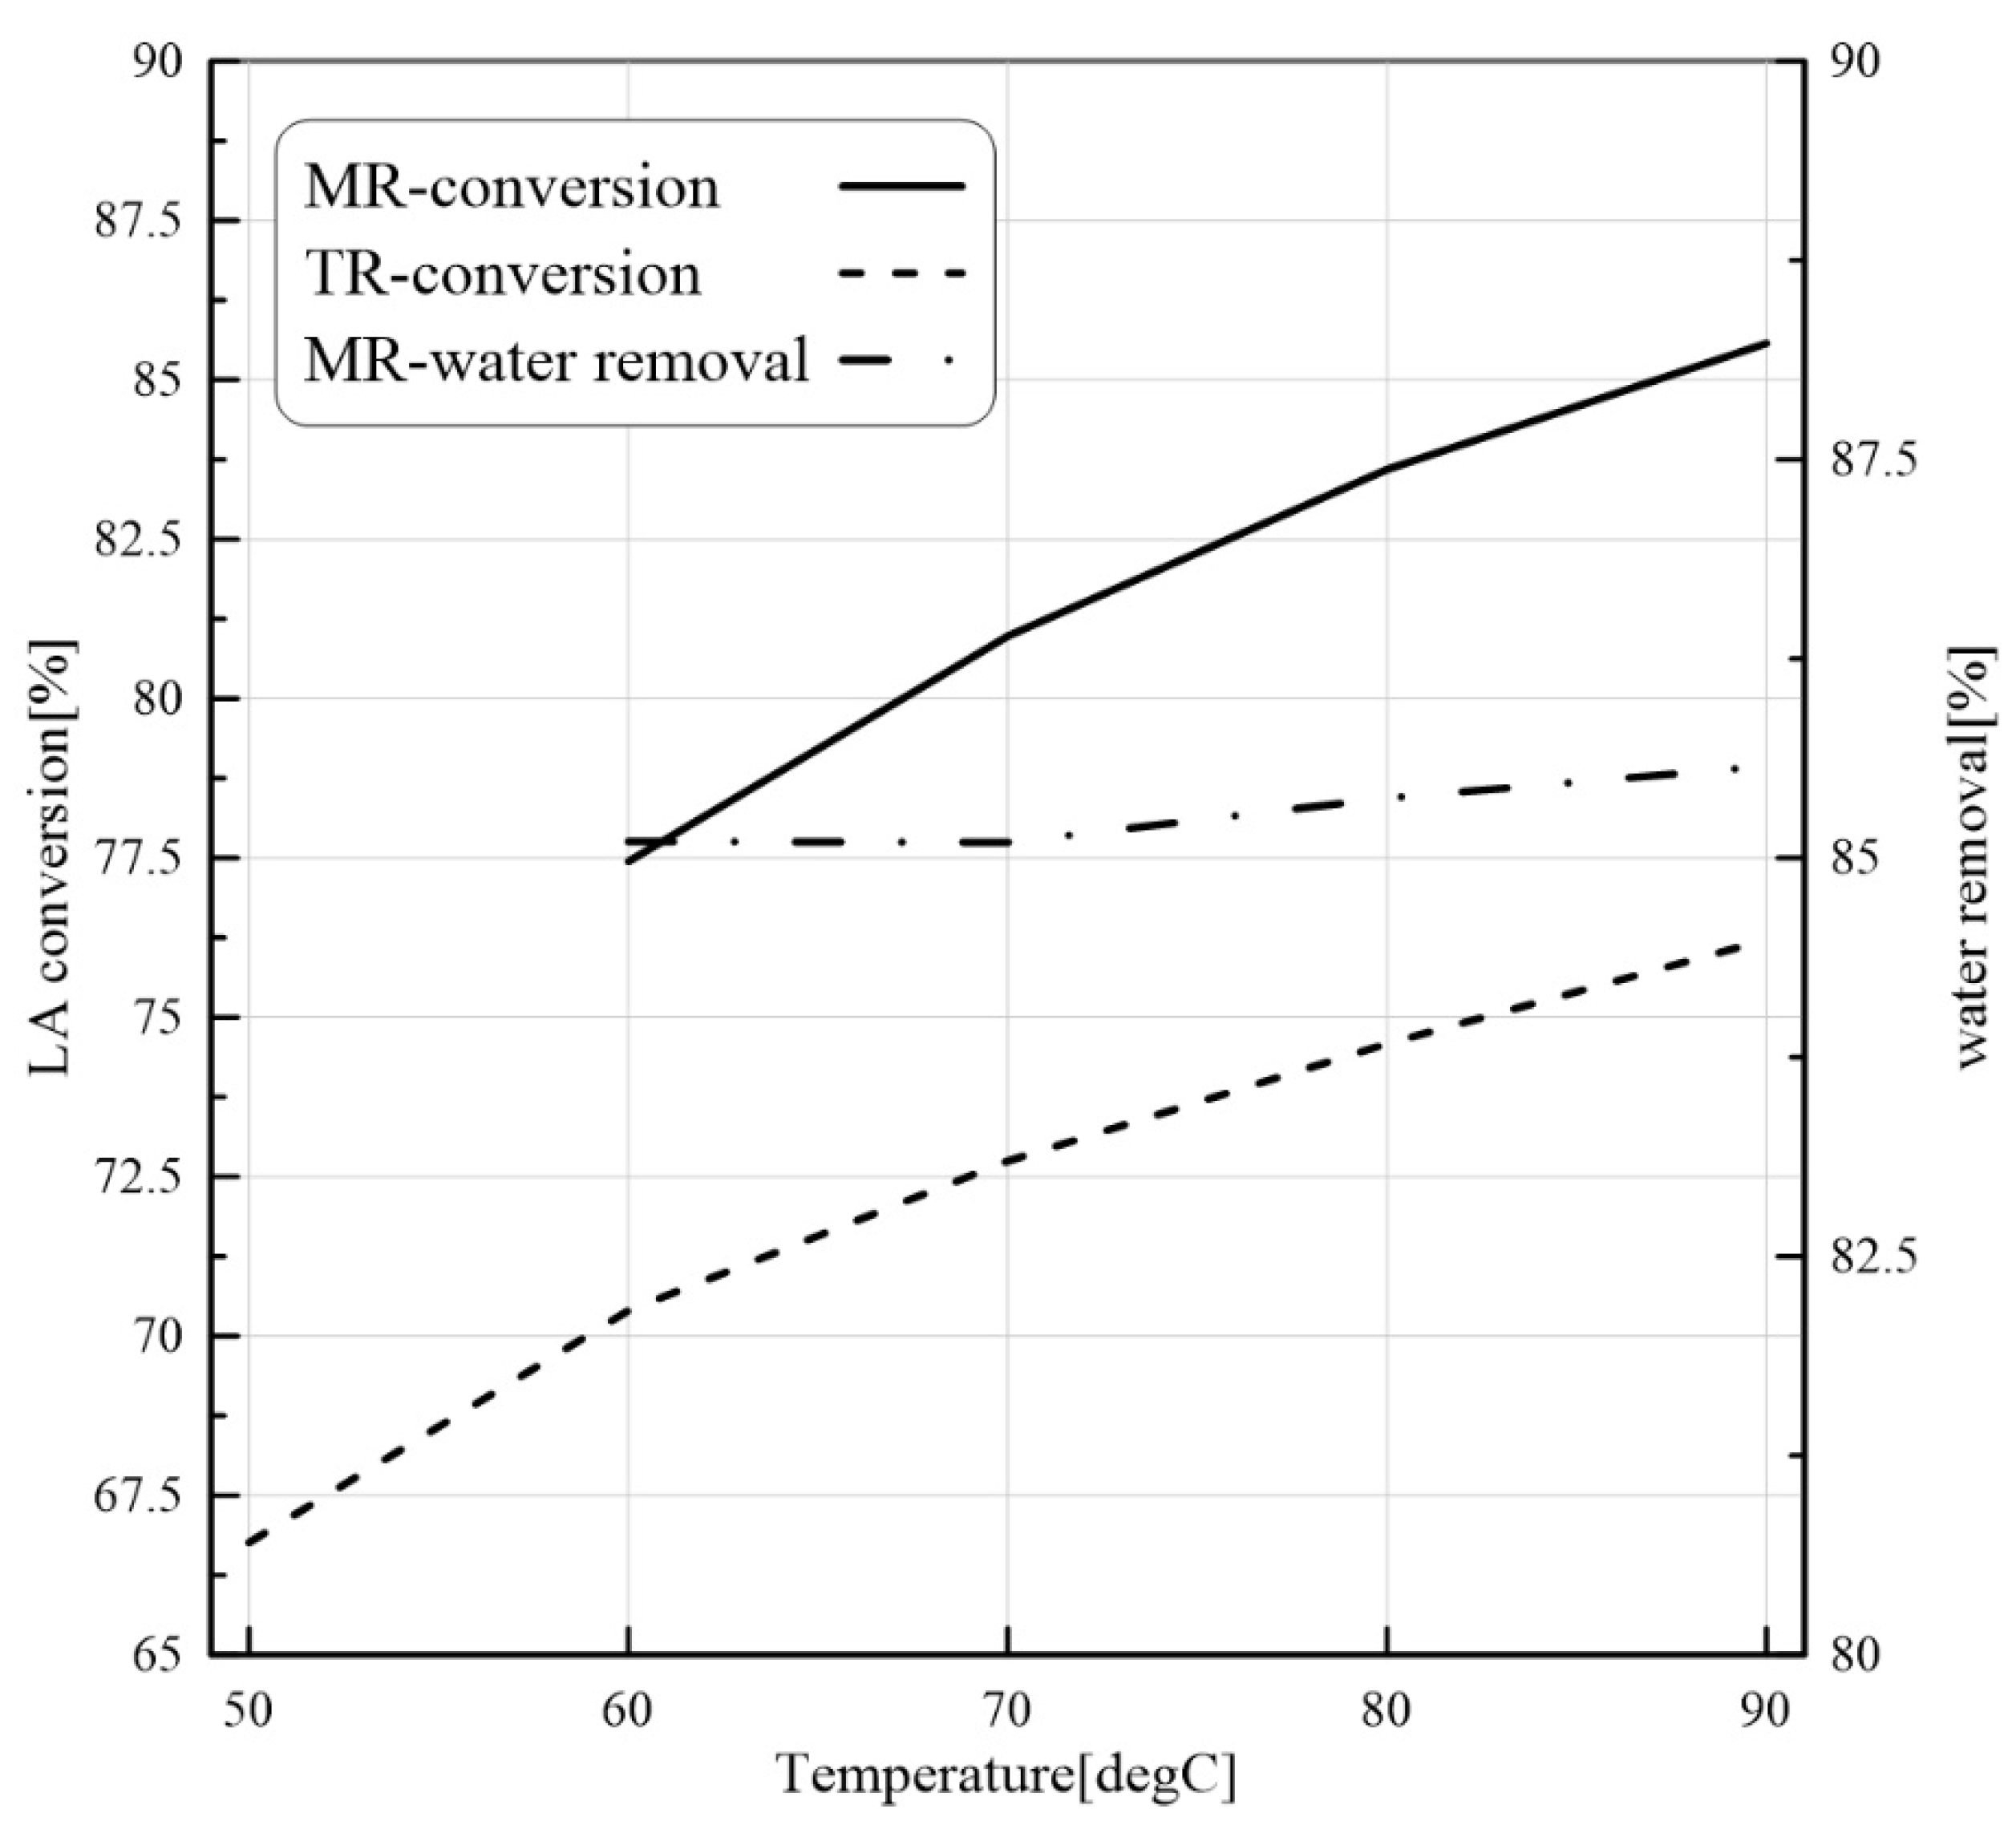
On the basis of reaction rate (Equation (11)) and H2O permeation flux (Table 1), which depends on the temperature through an Arrhenius-type equation, by raising the temperature, both LA conversion and H2O permeation flux increase. The prediction of CFD modeling in both MB-TR and MB-PMR as a function of the reaction temperature is shown in Figure 9.
LA conversion increases from 77.5% to 86% and H2O removal from 77.5% to 79% as the reaction temperature raises from 323 to 363 K. The increase in the H2O removal reveals that the effect of temperature on H2O permeation is more relevant than its effect on water production. On the other hand, due to a higher H2O removal at higher reaction temperatures, the difference between LA conversion in MB-PVMR and MB-TR results to be consequently larger.

4. Conclusions

In this theoretical work, LA-ESR reaction by PVMR use was studied for producing ethyl levulinate as a significant fuel additive. An isothermal and 2D CFD-based model was adopted to investigate the performance of multi-bed PVMR configuration in terms of LA conversion and H2O removal, comparing the results with an equivalent multi-bed TR. The simulation analysis was particularly focused on the effects of several parameters such as reaction temperature, feed molar ratio, feed flow rate, and catalyst loading on the reactors, and the simulations well matched the experimental literature data. The most important aspect of this work was that, under all the considered operating conditions, the performance of the MB-PVMR was always better than those of the equivalent MB-TR. Furthermore, the best simulation results were reached at 343 K, 2 bar, and feed molar ratio equal to 3, obtaining a levulinic acid conversion equal to 95.3% and 91.1% of water removal. As a further result, the CFD tool was capable of predicting the optimal conditions to operate the MB-PVMR in this work. It pointed out also the benefits and drawbacks of the MB-PVMR during ESR reaction, demonstrating how it may constitute a valid strategy for the scale-up of this technology and the future commercialization of PVMR systems in added-value ester production processes for developing fuel additive industries.
Author Contributions

Simulations and writing (M.G.); supervision, conceptualization, and editing (K.G.); writing and editing (E.J.); supervision and editing (A.I.). All authors have read and agreed to the published version of the manuscript.

Funding

This research received no external funding.

Institutional Review Board Statement

Not applicable.

Conflicts of Interest

The authors declare no conflict of interest.

Abbreviations and Nomenclature

A Membrane surface (m)
CFD Computational fluid dynamic
Ci Concentration of component i (mol/m3)
CH2O,permeateWater concentration in the permeate side
CH2O,retentateWater concentration in the permeate side
dcat Diameter of catalyst particle (m)
D Li Single-phase diffusion coefficients (m2/s)
D ei The effective diffusion in porous media(m2/s)
E1Activation energy (kJ/mol)
E2Activation energy (kJ/mol)
EtEthanol
EtLAEthyl levulinate
JH2OWater permeating flux (mol/m2/s)
J0,H2OWater permeability
KEquilibrium constant (-)
k1,0Rate constant ((m3/mol)2/s)
k2,0Rate constant ((m3/mol) (m3/kg)/s)
KbrPermeability (m2)
KrefEquilibrium cst (-)
LALevulinic acid
LA-ESRLivulinic acid esterification
MW i Molecular weight of component i (mol/g)
NOx Nitrogen oxides
PVPervaporation
PVA Poly(vinyl alcohol)
PVMR Pervaporation membrane reactor
riReaction rate of component i (mol/m3/s)
SiSink/source term of component i (kg/m3/s)
SOx Sulfur oxides
Tref Temperature ref (K)
u Velocity (m/s)
V Computational cell volume (m3)
Vi Molar volume at normal boiling point (cm3/mol)
W Weight of catalyst (g)
β F Forchheimer coefficient
H Enthalpy (kJ/mol)
ε Porosity (-)
μ Viscosity (cP)
µmixViscosity reaction mixture (cP)
ρ Density (kg/m3)
ρ cat Catalyst density (kg/m3)
τTortuosity
ϕAssociation factor (-)

References

  1. Unlu, D.; Ilgen, O.; Hilmioglu, N.D. Biodiesel additive ethyl levulinate synthesis by catalytic membrane: SO4-2/ZrO2 loaded hydroxyethyl cellulose. Chem. Eng. J. 2016, 302, 260–268. [Google Scholar] [CrossRef]
  2. Ji, Q.; Yu, X.; Yagoub, A.E.G.A.; Chen, L.; Mustapha, A.T.; Zhou, C. Enhancement of lignin removal and enzymolysis of sugarcane bagasse by ultrasound-assisted ethanol synergized deep eutectic solvent pretreatment. Renew. Energy 2021, 172, 304–316. [Google Scholar] [CrossRef]
  3. Shuit, S.H.; Tan, S.H. Esterification of palm fatty acid distillate with methanol via single-step pervaporation membrane reactor: A novel biodiesel production method. Energy Convers. Manag. 2019, 201, 112110. [Google Scholar] [CrossRef]
  4. Hajilary, N.; Rezakazemi, M.; Shirazian, S. Biofuel types and membrane separation. Environ. Chem. Lett. 2019, 17, 1–18. [Google Scholar] [CrossRef]
  5. Unlu, D.; Hilmioglu, N.D. Synthesis of ethyl levulinate as a fuel bioadditive by a novel catalytically active pervaporation membrane. Energy Fuels 2016, 302, 997–3003. [Google Scholar] [CrossRef]
  6. Novita, F.J.; Lee, H.Y.; Lee, M. Reactive distillation with pervaporation hybrid configuration for enhanced ethyl levulinate production. Chem. Eng. Sci. 2018, 190, 297–311. [Google Scholar] [CrossRef]
  7. Fernandes, D.R.; Rocha, A.S.; Mai, E.F.; Mota, C.J.; da Silva, V.T. Levulinic acid esterification with ethanol to ethyl levulinate production over solid acid catalysts. Appl. Catal. A Gen. 2012, 425, 199–204. [Google Scholar] [CrossRef]
  8. Unlu, D.; Ilgen, O.; Hilmioglu, N.D. Reactive separation system for effective upgrade of levulinic acid into ethyl levulinate. Chem. Eng. Res. Des. 2017, 118, 248–258. [Google Scholar] [CrossRef]
  9. Unlu, D.; Hilmioglu, N.D. Applicability of a TSA/ZrO2 catalytic membrane for the production of ethyl levulinate as raw material of gamma-valerolactone. Int. J. Hydrogen Energy 2017, 42, 21487–21494. [Google Scholar] [CrossRef]
  10. Quereshi, S.; Ahmad, E.; Pant, K.K.; Dutta, S. Synthesis and characterization of zirconia supported silicotungstic acid for ethyl levulinate production. Ind. Eng. Chem. Res. 2019, 58, 16045–16054. [Google Scholar] [CrossRef]
  11. Patil, C.R.; Niphadkar, P.S.; Bokade, V.V.; Joshi, P.N. Esterification of levulinic acid to ethyl levulinate over bimodal micro–mesoporous H/BEA zeolite derivatives. Catal. Commun. 2014, 43, 188–191. [Google Scholar] [CrossRef]
  12. Unlu, D.; Hilmioglu, N.D. Pervaporation catalytic membrane reactor application over functional chitosan membrane. J. Membr. Sci. 2018, 559, 138–147. [Google Scholar] [CrossRef]
  13. Zhang, W.; Na, S.; Li, W.; Xing, W. Kinetic modeling of pervaporation aided esterification of propionic acid and ethanol using T-type zeolite membrane. Ind. Eng. Chem. Res. 2015, 54, 4940–4946. [Google Scholar] [CrossRef]
  14. Zhang, W.; Su, X.; Hao, Z.; Qin, S.; Qing, W.; Xia, C. Pervaporation membrane reactor for producing hydroxylamine chloride via an oxime hydrolysis reaction. Ind. Eng. Chem. Res. 2015, 54, 100–107. [Google Scholar] [CrossRef]
  15. Constantino, D.S.; Faria, R.P.; Ribeiro, A.M.; Loureiro, J.M.; Rodrigues, A.E. Performance evaluation of pervaporation technology for process intensification of butyl acrylate synthesis. Ind. Eng. Chem. Res. 2017, 56, 13064–13074. [Google Scholar] [CrossRef]
  16. Sorribas, S.; Kudasheva, A.; Almendro, E.; Zornoza, B.; de la Iglesia, Ó.; Téllez, C.; Coronas, J. Pervaporation and membrane reactor performance of polyimide based mixed matrix membranes containing MOF HKUST-1. Chem. Eng. Sci. 2015, 124, 37–44. [Google Scholar] [CrossRef]
  17. Qing, W.; Chen, J.; Shi, X.; Wu, J.; Hu, J.; Zhang, W. Conversion enhancement for acetalization using a catalytically active membrane in a pervaporation membrane reactor. Chem. Eng. J. 2017, 313, 1396–1405. [Google Scholar] [CrossRef]
  18. Nigiz, F.U. A comparative study on the synthesis of ethyl propionate in a pervaporation membrane reactor. Chem. Eng. Process.-Process Intensif. 2018, 128, 173–179. [Google Scholar] [CrossRef]
  19. Gómez-García, M.A.; Dobrosz-Gomez, I.; Viana, W.O. Experimental assessment and simulation of isoamyl acetate production using a batch pervaporation membrane reactor. Chem. Eng. Process. Process Intensif. 2017, 122, 155–160. [Google Scholar] [CrossRef]
  20. Penkova, A.; Polotskaya, G.; Toikka, A. Pervaporation composite membranes for ethyl acetate production. Chem. Eng. Process. Process Intensif. 2015, 87, 81–87. [Google Scholar]
  21. Ghasemzadeh, K.; Ghahremani, M.; Amiri, T.Y.; Basile, A.; Iulianelli, A. Hydrogen production by silica membrane reactor during dehydrogenation of methylcyclohexane: CFD analysis. Int. J. Hydrogen Energy 2021, 46, 19768–19777. [Google Scholar] [CrossRef]
  22. Ghasemzadeh, K.; Ghahremani, M.; Amiri, T.Y.; Basile, A. Performance evaluation of PdAg membrane reactor in glycerol steam reforming process: Development of the CFD model. Int. J. Hydrogen Energy 2019, 44, 1000–1009. [Google Scholar] [CrossRef]
  23. Ghasemzadeh, K.; Harasi, N.J.; Iulianelli, A.; Basile, A. Theoretical evaluation of various configurations of silica membrane reactor in methanol steam reforming using CFD method. Int. J. Hydrogen Energy 2020, 45, 7354–7363. [Google Scholar] [CrossRef]
  24. Ghasemzadeh, K.; Harasi, J.N.; Amiri, T.Y.; Basile, A.; Iulianelli, A. Methanol steam reforming for hydrogen generation: A comparative modeling study between silica and Pd-based membrane reactors by CFD method. Fuel Process. Technol. 2020, 199, 106273. [Google Scholar] [CrossRef]
  25. Chen, W.H.; Tsai, C.W.; Lin, Y.L.; Chein, R.Y.; Yu, C.T. Reaction phenomena of high-temperature water gas shift reaction in a membrane reactor. Fuel 2020, 199, 358–371. [Google Scholar] [CrossRef]
  26. Liu, Q.; Zhang, Z.; Chen, H. Study on the coupling of esterification with pervaporation. J. Membr. Sci. 2001, 182, 173–181. [Google Scholar] [CrossRef]
  27. Russo, V.; Hrobar, V.; Mäki-Arvela, P.; Eränen, K.; Sandelin, F.; di Serio, M.; Salmi, T. Kinetics and modelling of levulinic acid esterification in batch and continuous reactors. Top. Catal. 2018, 61, 1856–1865. [Google Scholar] [CrossRef]
  28. Russo, V.; Rossano, C.; Salucci, E.; Tesser, R.; Salmi, T.; di Serio, M. Intraparticle diffusion model to determine the intrinsic kinetics of ethyl levulinate synthesis promoted by Amberlyst-15. Chem. Eng. Sci. 2020, 228, 115974. [Google Scholar] [CrossRef]
  29. Aniceto, J.P.S.; Zêzere, B.; Silva, C.M. Predictive models for the binary diffusion coefficient at infinite dilution in polar and nonpolar fluids. Materials 2021, 14, 542. [Google Scholar] [CrossRef]
Figure 1. Scheme of the simulated MB-PVMR during LA-ESR reaction.
Membranes 11 00635 g001
Figure 2. Effect of mesh number on the calculated LA conversion and water removal by CFD model (ET/LA:1.25, feed flow rate 7 mm3/s and T = 343 K, catalyst loading = 8.6 g).
Membranes 11 00635 g002
Figure 3. LA conversion versus reactor length for the MB-TR (feed flow rate: 16.7 (mm3/s), T = 333 K, Et/LA = 1:1, catalyst loading = 8.6 g) [27].
Membranes 11 00635 g003
Figure 4. Velocity contour (m/s) during LA-ESR reaction in the MB-PVMR: (a) graph of velocity distribution; (b) contour of velocity achieved by CFD simulation (at feed molar ration ET/LA = 1.25, feed flow rate = 7 mm3/s, T = 343 K and catalyst loading = 8.6 g).
Membranes 11 00635 g004
Figure 5. Mole fraction contours achieved by CFD simulation during LA-ESR reaction in MB-PVMR: (a) H2O mole fraction distribution; (b) LA mole fraction distribution simulation (at feed molar ration ET/LA = 1.25, feed flow rate = 7 mm3/s, T = 343 K and catalyst loading = 8.6 g).
Membranes 11 00635 g005
Figure 6. LA conversion for MB-PVMR and MB-TR and water removal for MB-PVMR versus feed molar ratio at feed flow rate = 7 mm3/s, T = 343 K, and catalyst loading = 8.6 g.
Membranes 11 00635 g006
Figure 7. LA conversion for MB-PVMR and MB-TR and water removal for MB-PVMR versus feed flow rate at ET/LA feed molar ratio = 1.25, T = 343 K, and catalyst loading = 8.6 g.
Membranes 11 00635 g007
Figure 8. LA conversion for MB-PVMR and MB-TR and water removal for MB-PVMR versus catalyst loading at feed molar ratio = 1.25, T = 343 K, and feed flow rate = 7 mm3/s.
Membranes 11 00635 g008
Figure 9. LA conversion for MB-PVMR and MB-TR and water removal for MB-PVMR versus T at ET/LA = 1.25, feed flow rate = 7 mm3/s, and catalyst loading = 8.6 g.
Membranes 11 00635 g009
Table 1. Governing equations at the CFD model.
RetentatePermeate
Continuity equation:
· ( ρ · u · ε ) = 0
Continuity equation:
· ( ρ · u ) = 0
Momentum equation:
ρ ε 2 ( ( u · ) u ε ) = · [ p I + μ ε 2 μ 3 ε ( u ) I ] + S
Momentum equation:
ρ ( u · ) u = · [ p r I + μ ( u + ( u ) ϑ r ) ]
Species equation:
u · c i = · [ ( D e i ) c i ] + R i + S i
Species equation:
· ( D i c i + u c i ) = 0
Table 2. Value of water permeating flux for PVA membrane at different temperatures [25].
Temperature (°C)J0,H2O (L/m2·h)
603.50
703.52
803.87
904.2
Table 3. Value of rate constant parameters used in the simulations of LA-ESR reaction [26,27].
ParameterNameValueUnits
H Enthalpy15.14kJ/mol
E1Activation energy32.51kJ/mol
E2Activation energy39.38kJ/mol
KrefEquilibrium const.3.18-
k1,0Rate const.5.74 × 10−14(m3/mol)2/s
k2,0Rate const.5.32 × 10−10(m3/mol) (m3/kg)/s
TrefTemperature ref.333K
Table 4. Numerical values of the coefficients used to calculate the density of each component.
CoefficientsLAEtEtLAH2O
Ai0.7541.650.5285.46
Bi0.2580.2760.2460.305
Ci738514666647
Di0.2200.2330.2860.081
Table 5. Coefficients used to calculate the viscosity of each component as a function of T.
CoefficientsLAEtEtLAH2O
Aμi−12.8737.874−1.3913−51.964
Bμi2295.7781.981034.83670.6
Cμi−0.043631−3.0418−1.48375.7331
Dμi000−5.3495 × 10⁻²⁹
Eμi00010
Table 6. Boundary conditions at the retentate and permeate sides.
PositionRetentate SidePermeate Side
Z = 0Inflow-
Z = LOutflowOutflow
R = red lineWater fluxWater flux
R = green line c r = 0 c r = 0
Table 7. The investigated operating conditions for the MB-PVMR and MB-TR during LA-ESR reaction.
Operating ParametersTemperature EffectFeed Flow Rate EffectEt/LACatalyst Loading
T (K)various343343343
Feed flow rate (mm3/s)7various77
Et/LA1.251.25various1.25
Catalyst loading (g)8.68.68.6various
Publisher’s Note: MDPI stays neutral with regard to jurisdictional claims in published maps and institutional affiliations.