
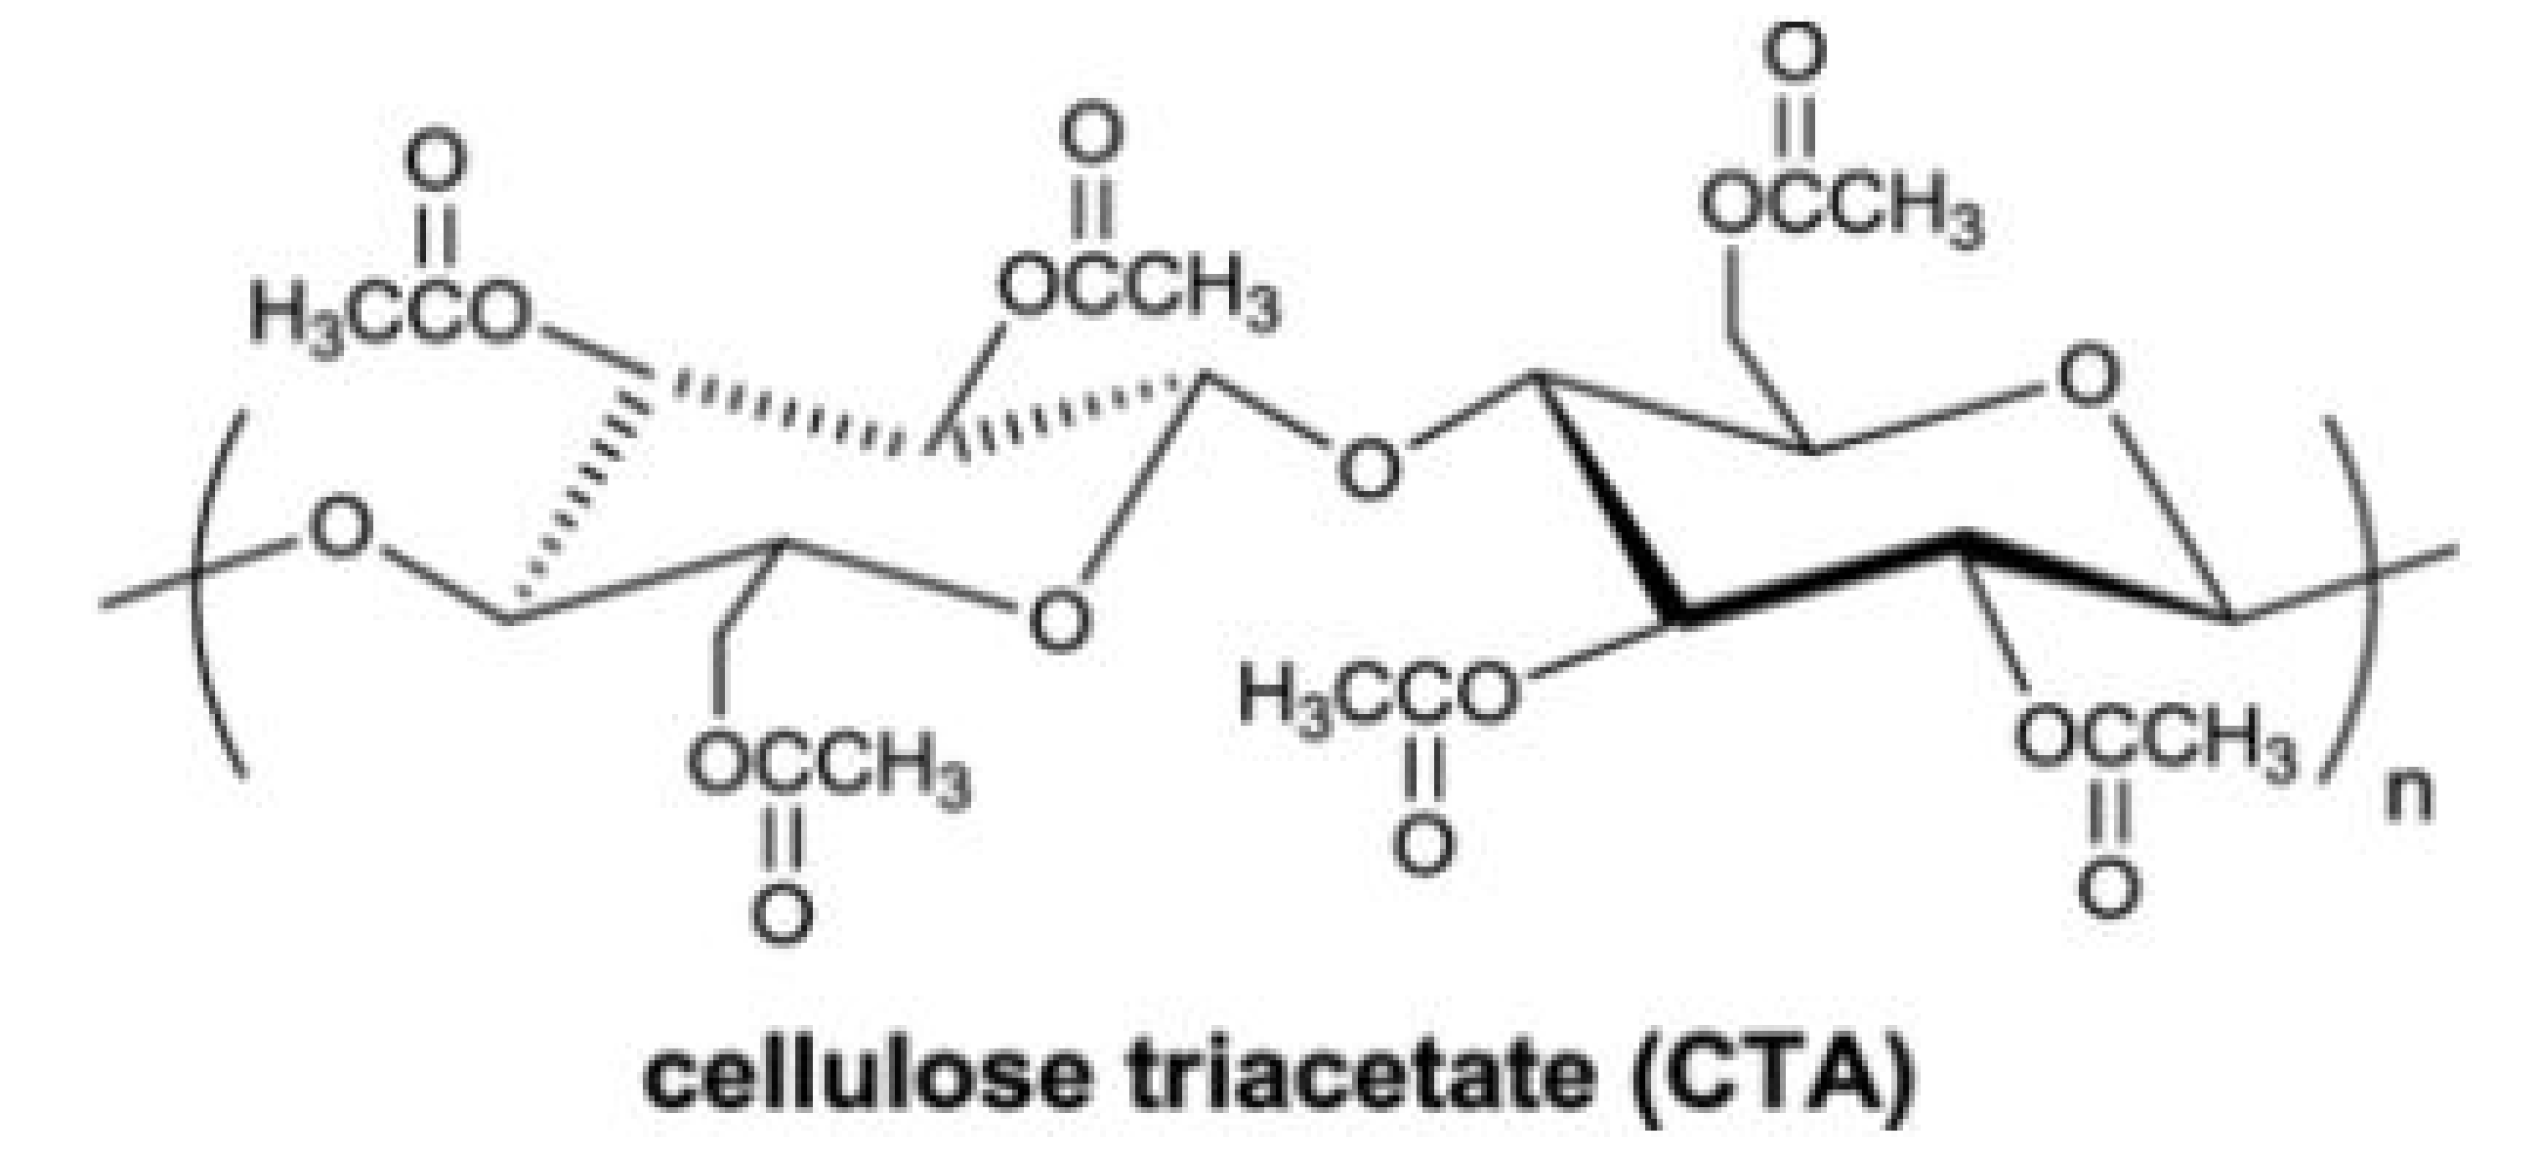
CeO2-Blended Cellulose Triacetate Mixed-Matrix Membranes for Selective CO2 Separation

 ,
,  , and
, and 
Abstract
:1. Introduction
2. Materials and Methods
2.1. Chemicals
2.2. Preparation of CeO2 Nanoparticles
2.3. Preparation of the CTA-CeO2 Mixed-Matrix Membrane
2.4. Material Characterization
2.5. Gas Sorption and Permeation Measurements
3. Results and Discussion
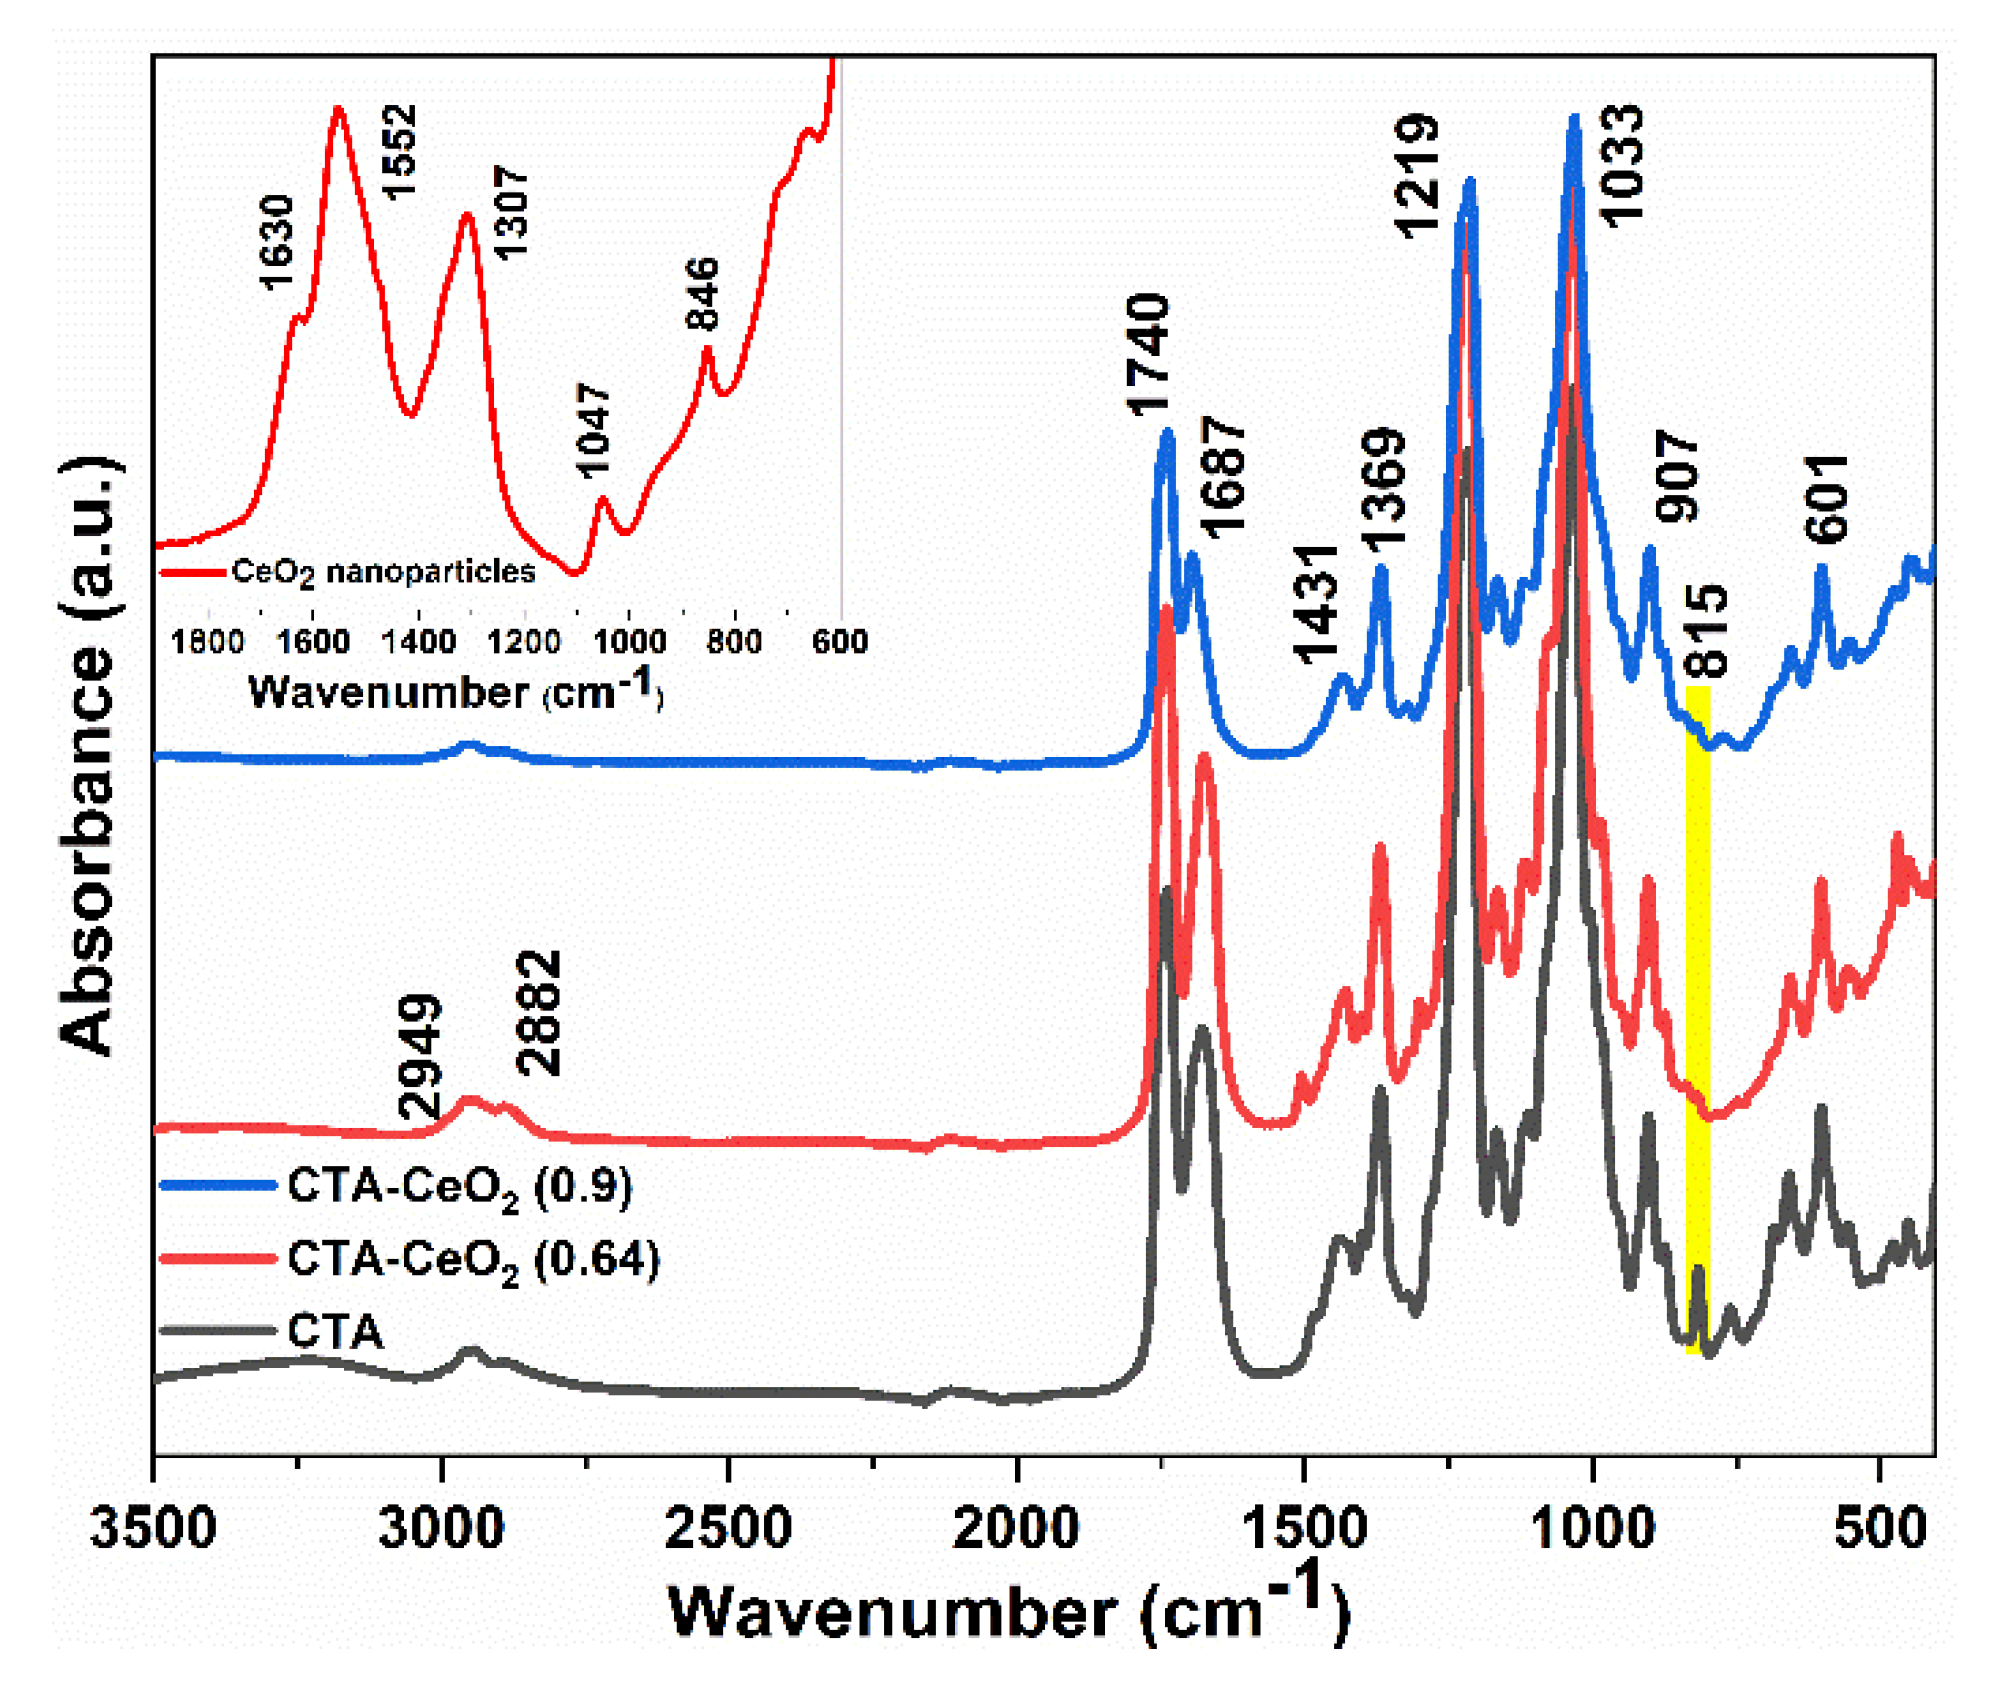
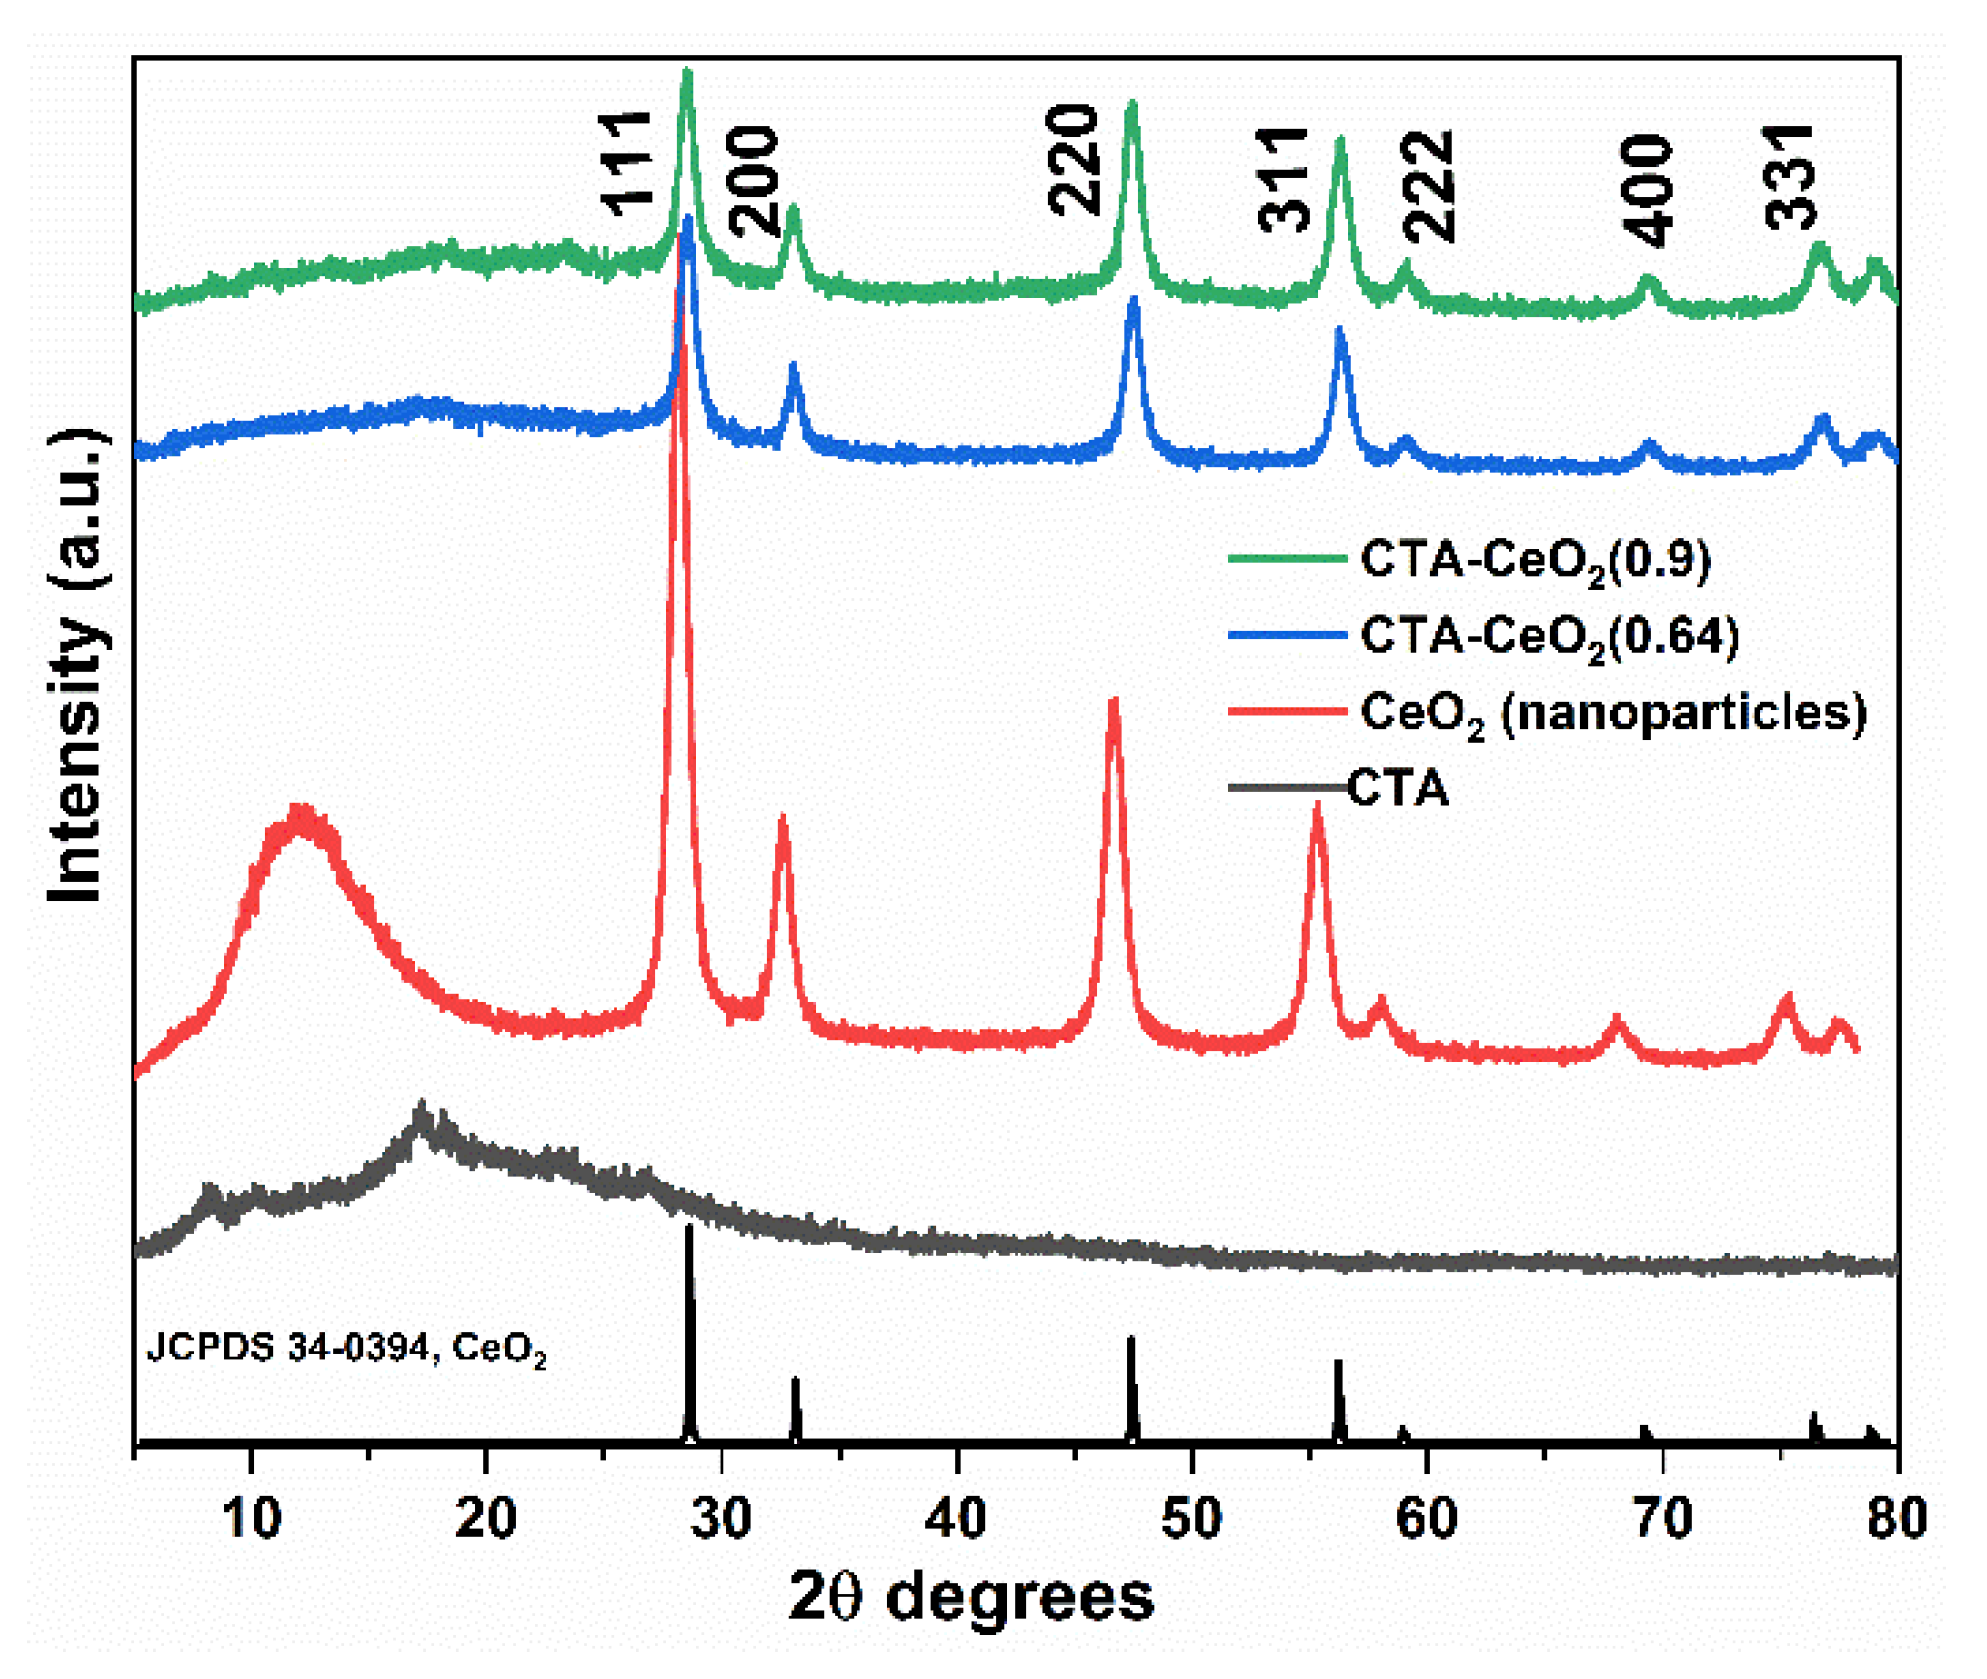
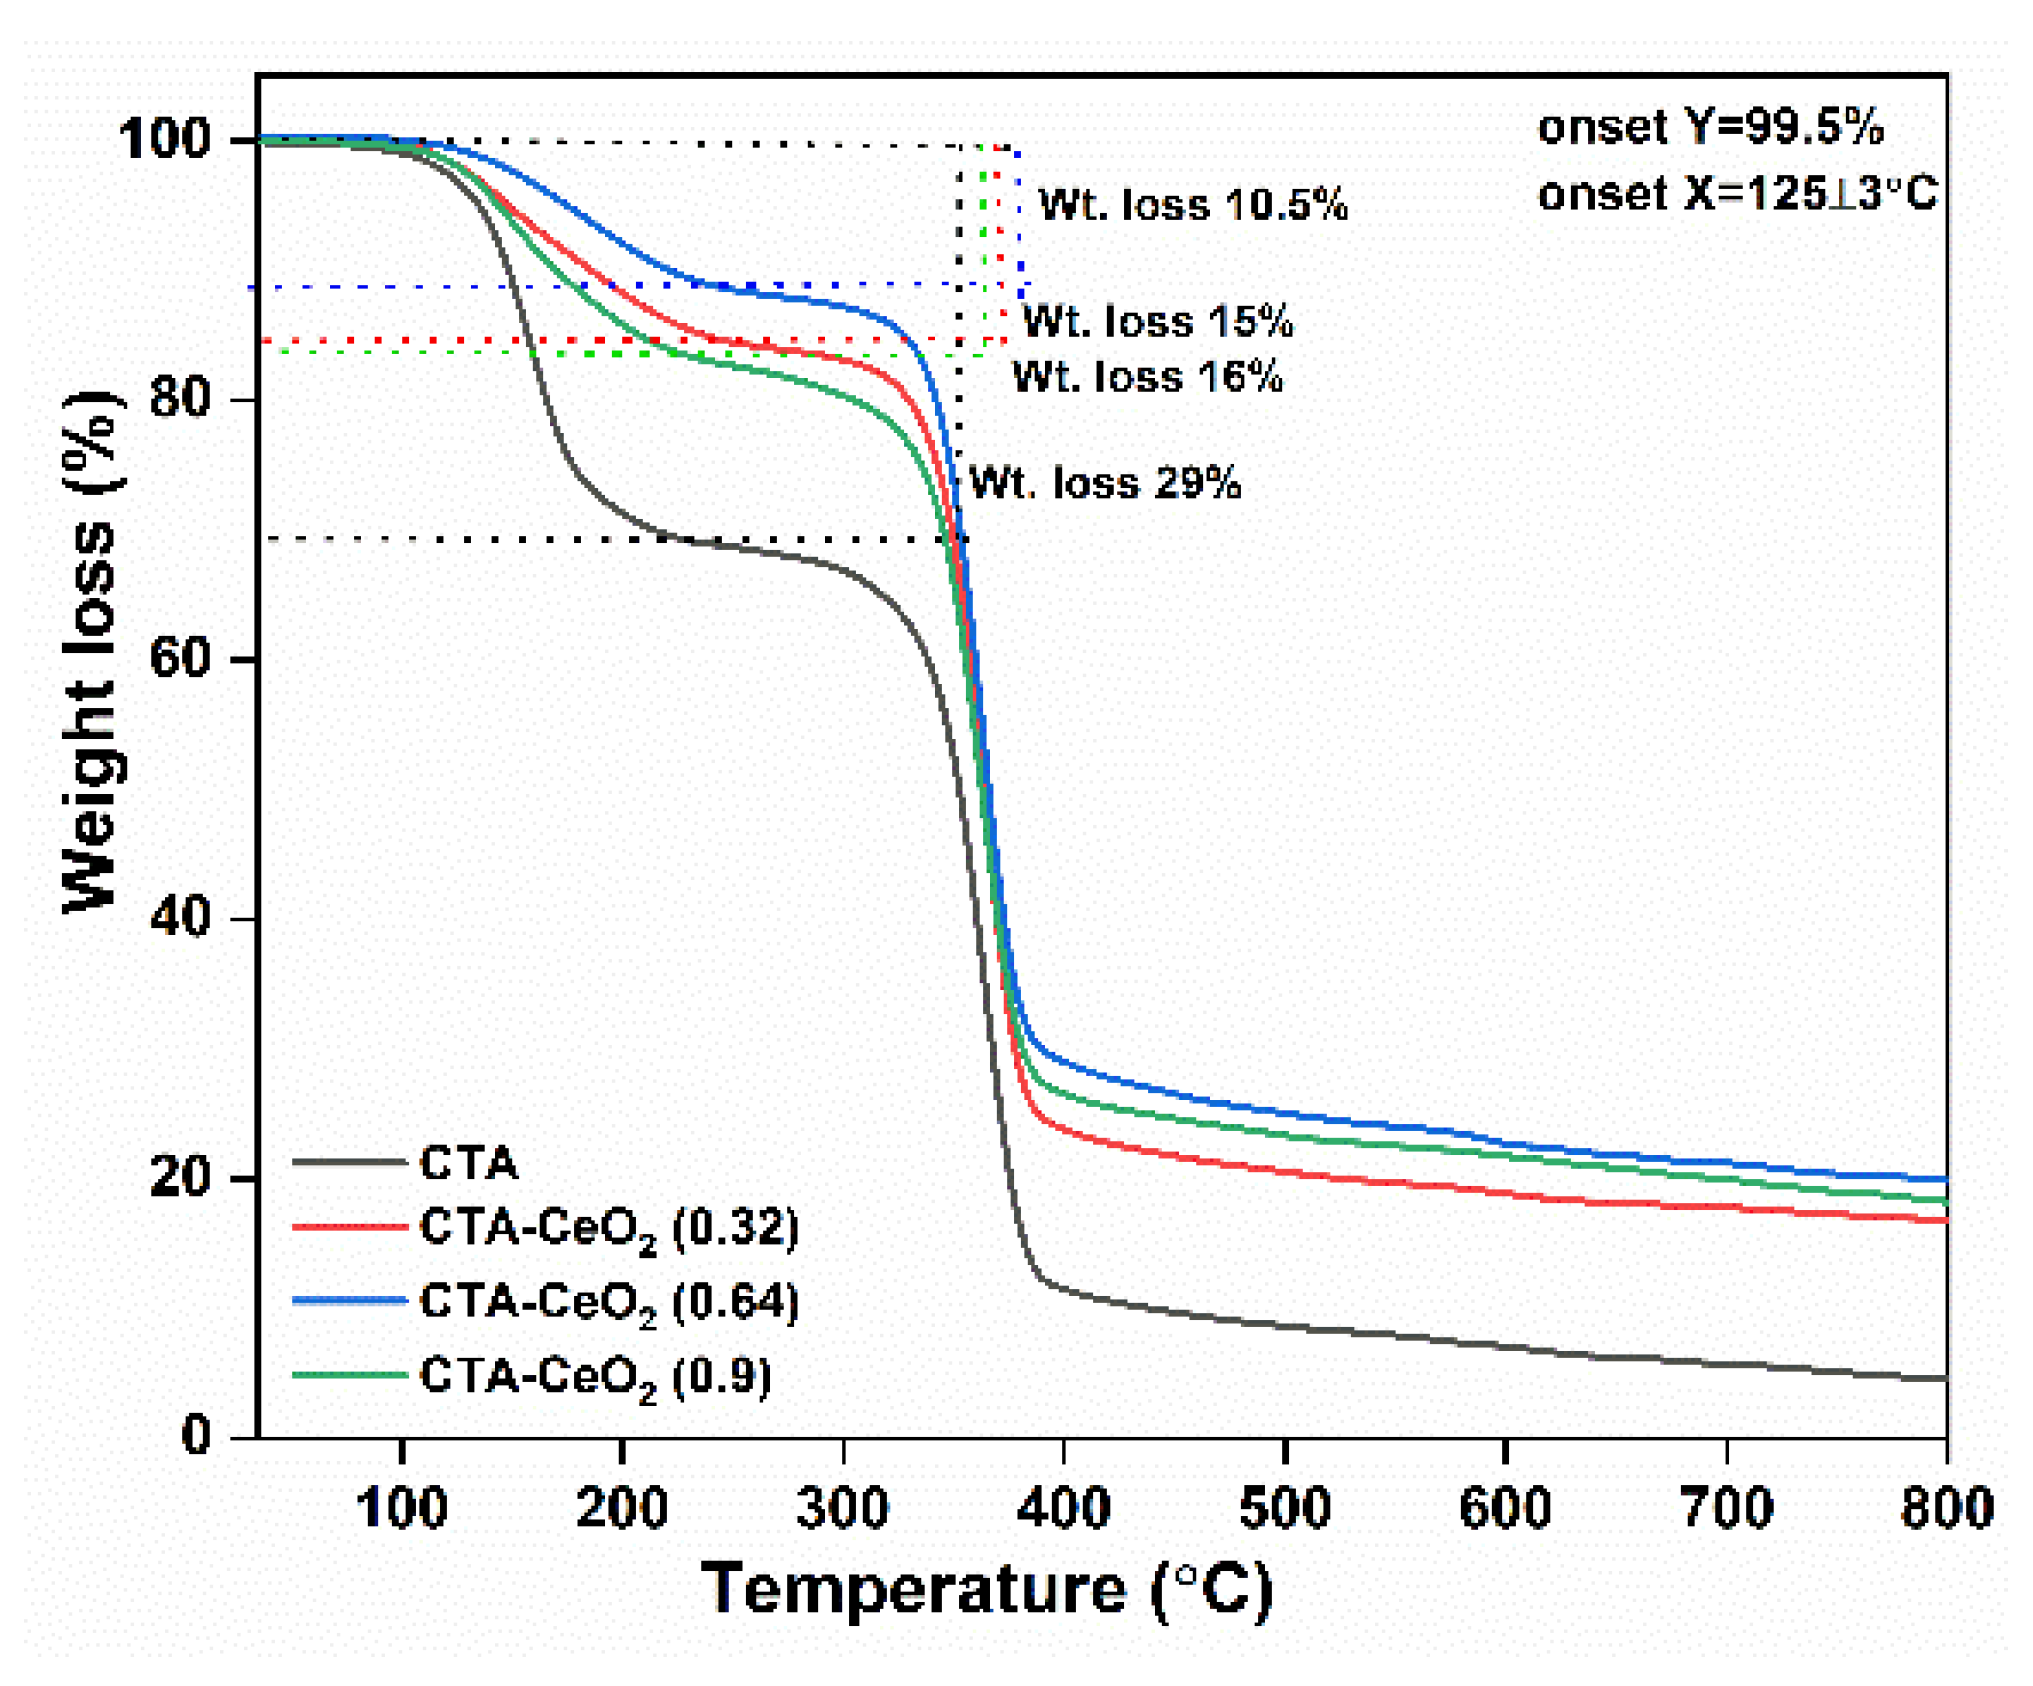
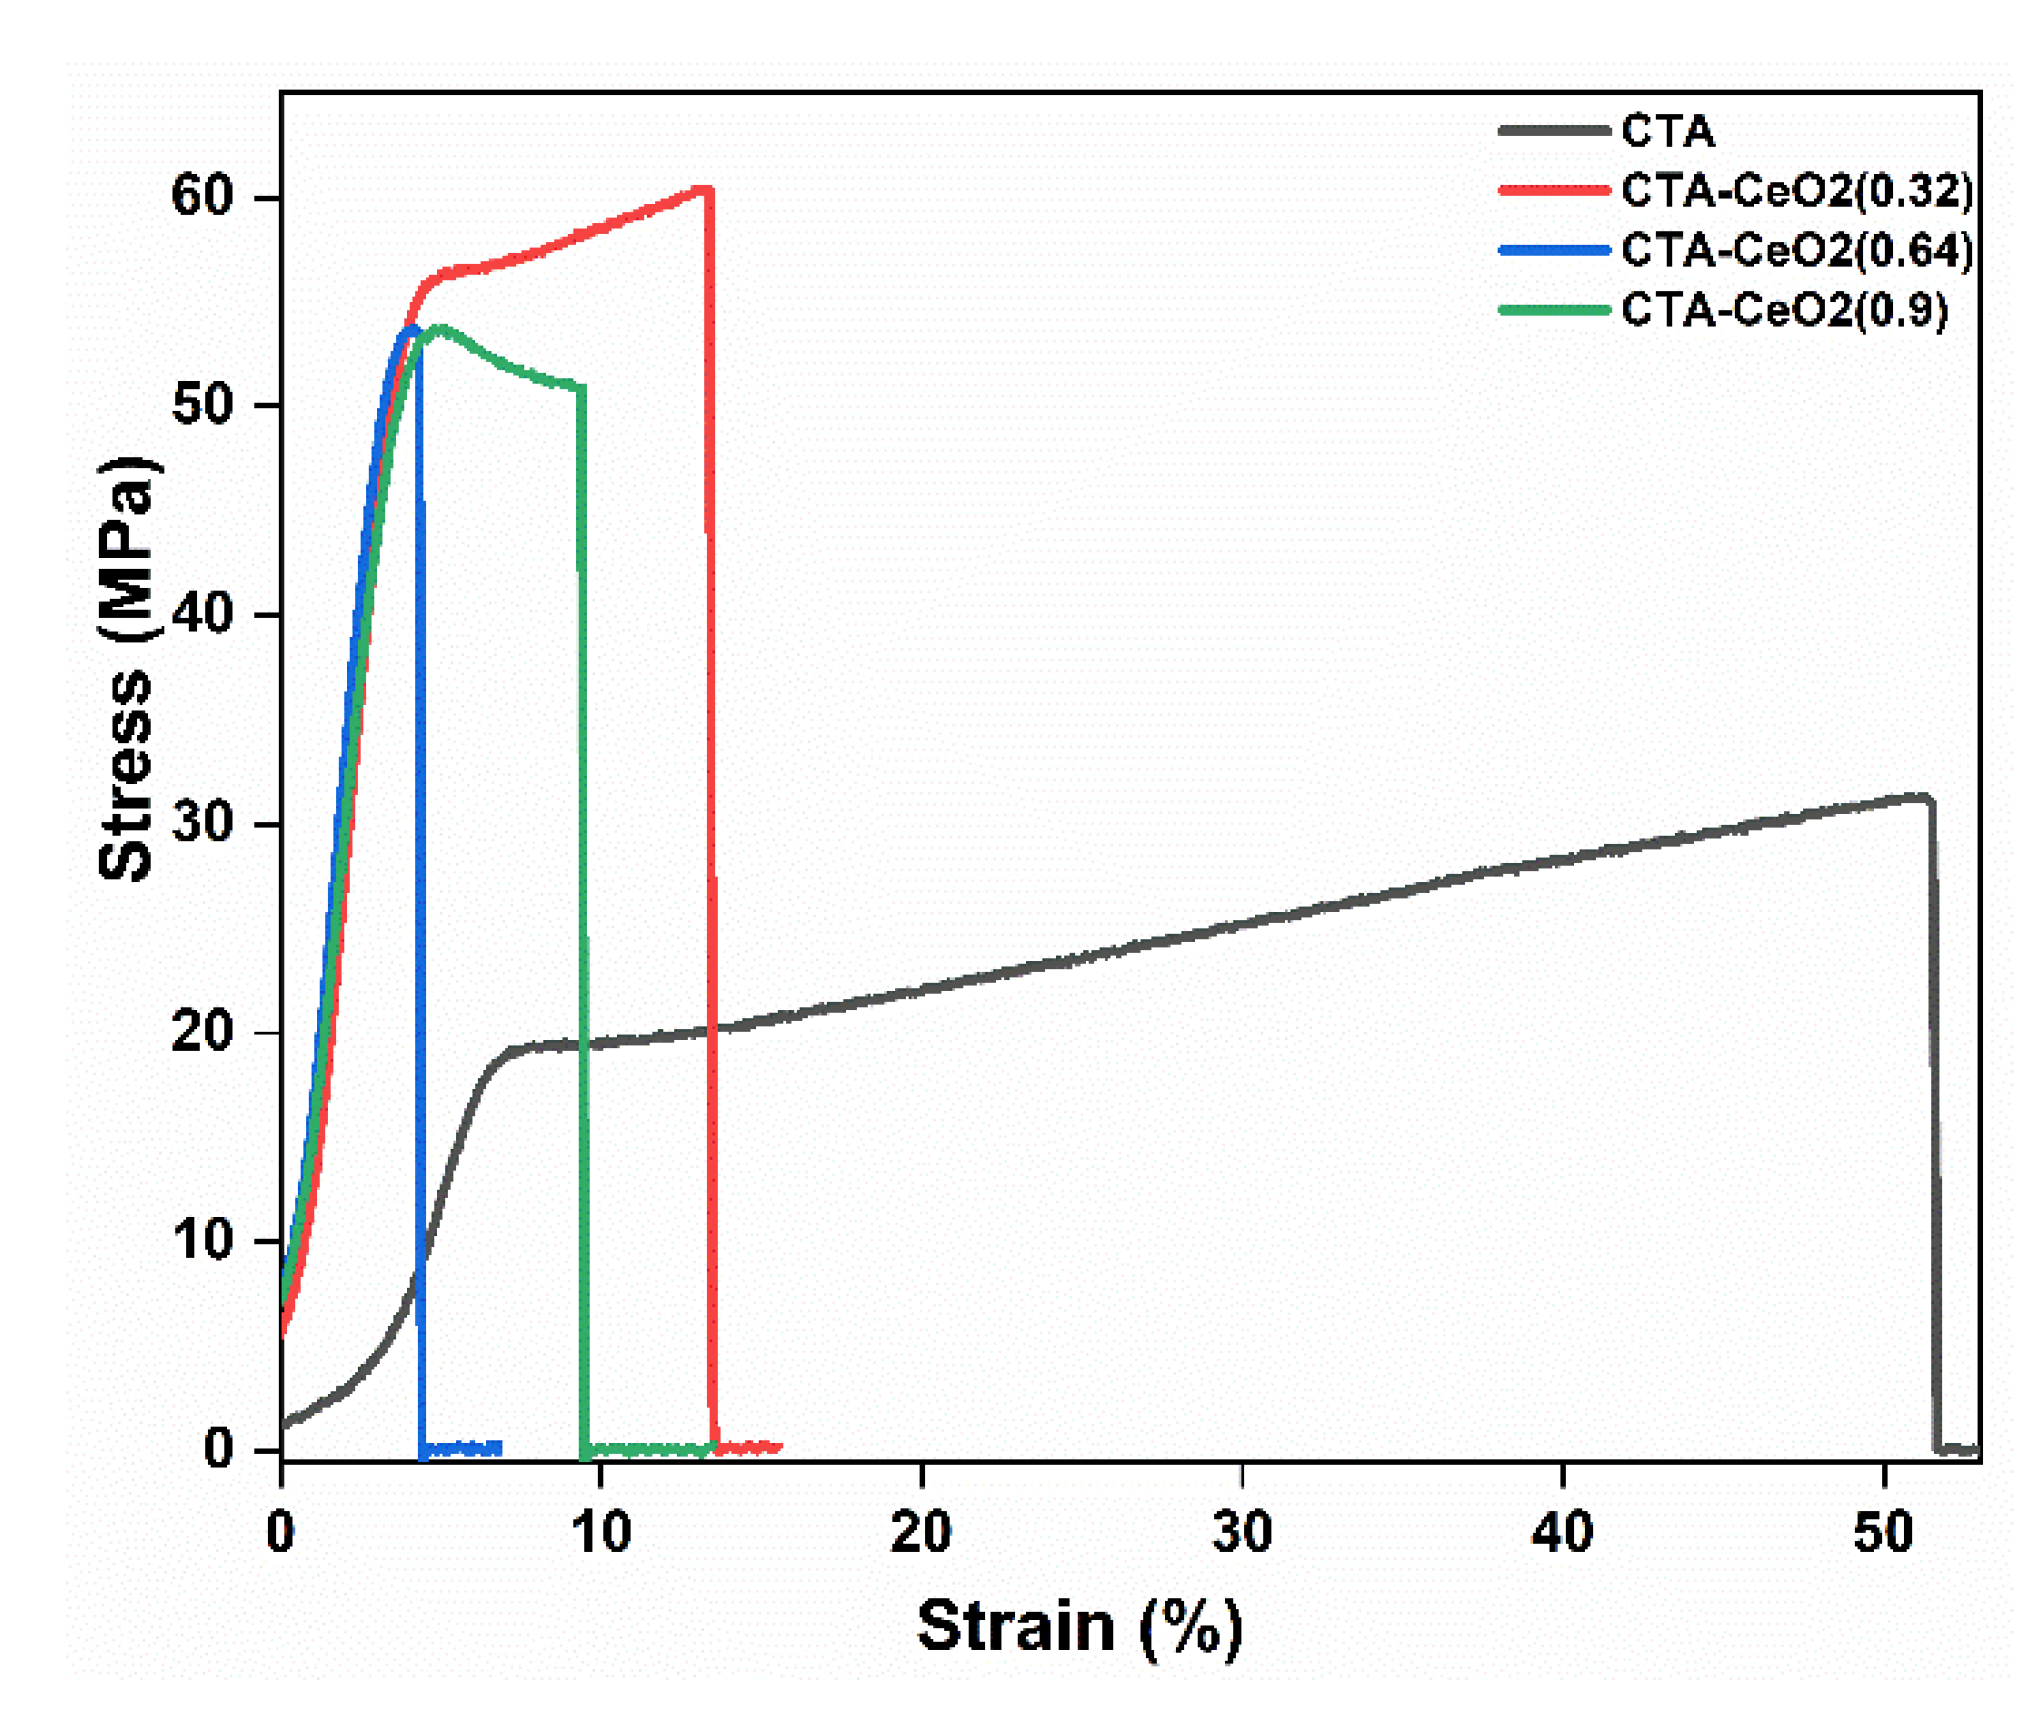
3.1. Physico-Chemical Analysis
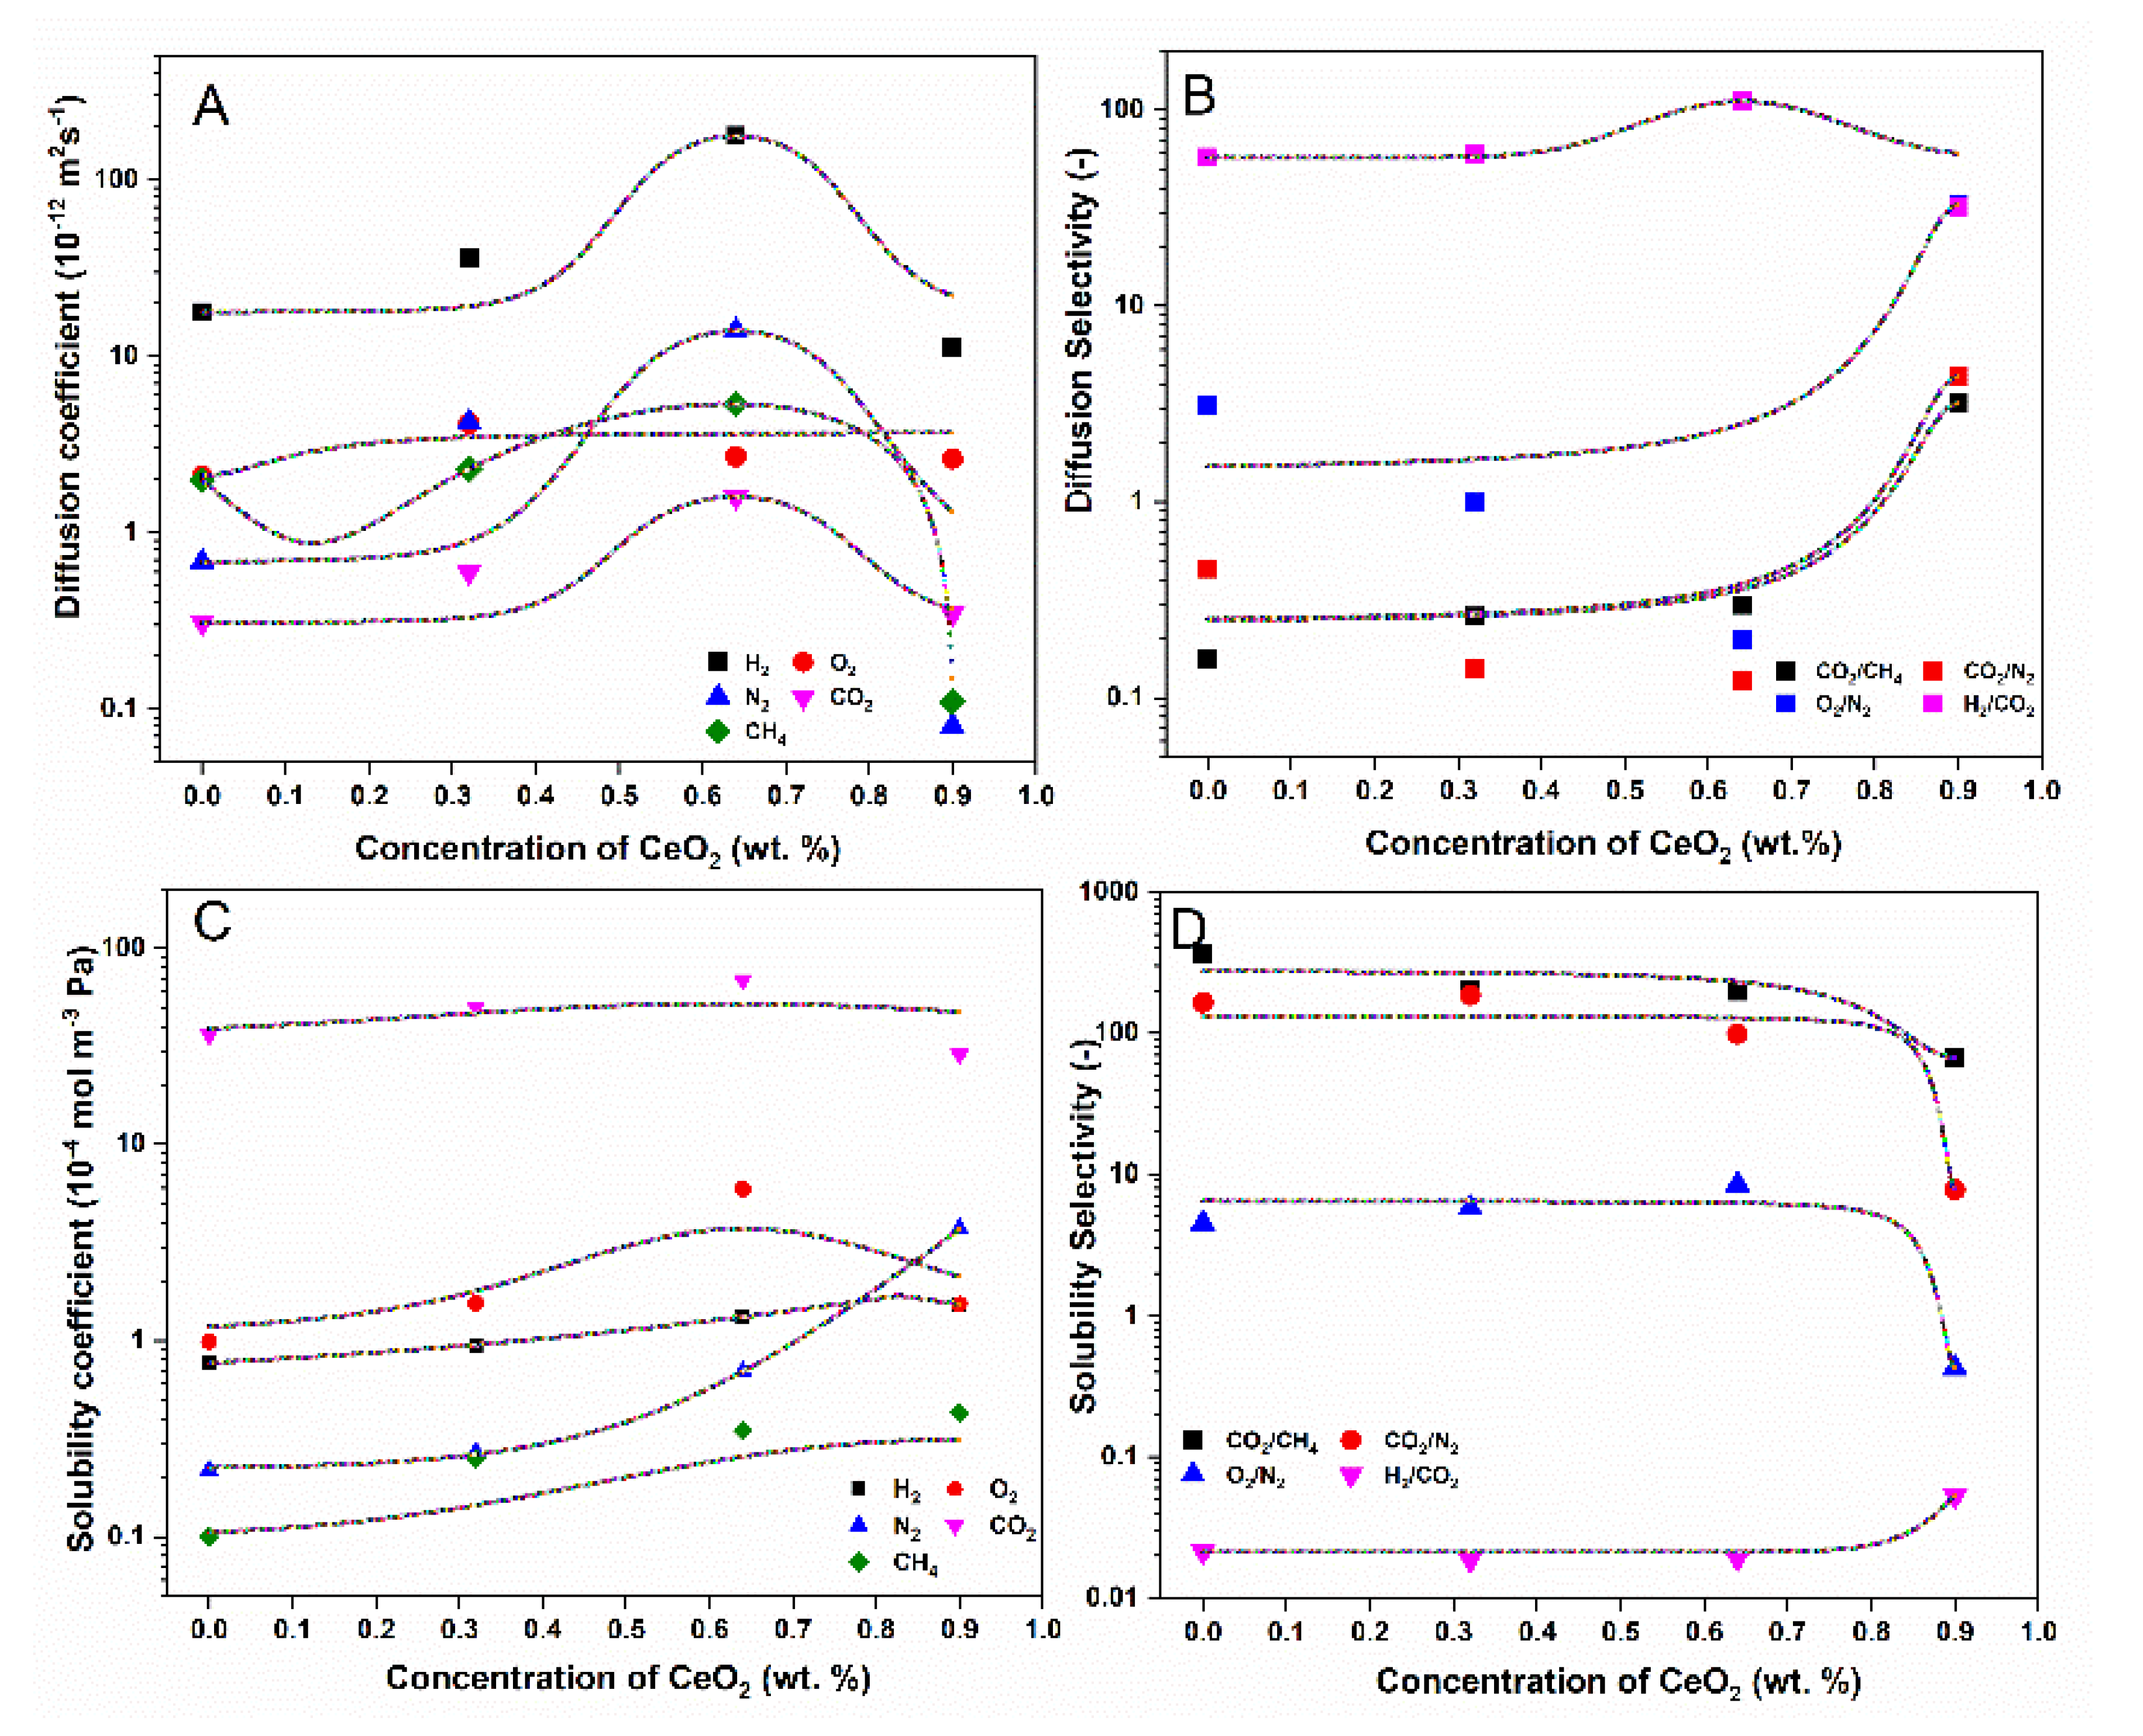
3.2. Gas Separation Performance of MMMs
4. Conclusions
Supplementary Materials
Author Contributions
Funding
Acknowledgments
Conflicts of Interest
References
- Althor, G.; Watson, J.E.M.; Fuller, R.A. Global mismatch between greenhouse gas emissions and the burden of climate change. Sci. Rep. 2016, 6, 20281. [Google Scholar] [CrossRef]
- Qiao, Z.; Zhao, S.; Sheng, M.; Wang, J.; Wang, S.; Wang, Z.; Zhong, C.; Guiver, M.D. Metal-induced ordered microporous polymers for fabricating large-area gas separation membranes. Nat. Mater. 2019, 18, 163–168. [Google Scholar] [CrossRef]
- Cheng, Y.; Zhai, L.; Tong, M.; Kundu, T.; Liu, G.; Ying, Y.; Dong, J.; Wang, Y.; Zhao, D. Selective gas permeation in mixed matrix membranes accelerated by hollow ionic covalent organic polymers. ACS Sustain. Chem. Eng. 2019, 7, 1564–1573. [Google Scholar] [CrossRef]
- Robeson, L.M. The upper bound revisited. J. Membr. Sci. 2008, 320, 390–400. [Google Scholar] [CrossRef]
- Sanders, D.F.; Smith, Z.P.; Guo, R.; Robeson, L.M.; McGrath, J.E.; Paul, D.R.; Freeman, B.D. Energy-efficient polymeric gas separation membranes for a sustainable future: A review. Polymer 2013, 54, 4729–4761. [Google Scholar] [CrossRef] [Green Version]
- Park, H.B.; Kamcev, J.; Robeson, L.M.; Elimelech, M.; Freeman, B.D. Maximizing the right stuff: The trade-off between membrane permeability and selectivity. Science 2017, 356, eaab0530. [Google Scholar] [CrossRef] [Green Version]
- Shi, F.; Sun, J.; Wang, J.; Liu, M.; Yan, Z.; Zhu, B.; Li, Y.; Cao, X. MXene versus graphene oxide: Investigation on the effects of 2D nanosheets in mixed matrix membranes for CO2 separation. J. Membr. Sci. 2021, 620, 118850. [Google Scholar] [CrossRef]
- Yin, H.; Alkaş, A.; Zhang, Y.; Zhang, Y.; Telfer, S.G. Mixed matrix membranes (MMMs) using an emerging metal-organic framework (MUF-15) for CO2 separation. J. Membr. Sci. 2020, 609, 118245. [Google Scholar] [CrossRef]
- Dong, G.; Li, H.; Chen, V. Challenges and opportunities for mixed-matrix membranes for gas separation. J. Mater. Chem. A 2013, 1, 4610–4630. [Google Scholar] [CrossRef]
- Zornoza, B.; Tellez, C.; Coronas, J.; Gascon, J.; Kapteijn, F. Metal organic framework based mixed matrix membranes: An increasingly important field of research with a large application potential. Microporous Mesoporous Mater. 2013, 166, 67–78. [Google Scholar] [CrossRef]
- Furukawa, H.; Cordova, K.E.; O’Keeffe, M.; Yaghi, O.M. The chemistry and applications of metal-organic frameworks. Science 2013, 341, 1230444. [Google Scholar] [CrossRef] [PubMed] [Green Version]
- Zhao, S.; Wang, Z.; Qiao, Z.; Wei, X.; Zhang, C.; Wang, J.; Wang, S. Gas separation membrane with CO2-facilitated transport highway constructed from amino carrier containing nanorods and macromolecules. J. Mater. Chem. A 2013, 1, 246–249. [Google Scholar] [CrossRef]
- Chung, T.-S.; Jiang, L.Y.; Li, Y.; Kulprathipanja, S. Mixed matrix membranes (MMMs) comprising organic polymers with dispersed inorganic fillers for gas separation. Prog. Polym. Sci. 2007, 32, 483–507. [Google Scholar] [CrossRef]
- Zhu, J.; Hou, J.; Uliana, A.; Zhang, Y.; Tian, M.; Van der Bruggen, B. The rapid emergence of two-dimensional nanomaterials for high-performance separation membranes. J. Mater. Chem. A 2018, 6, 3773–3792. [Google Scholar] [CrossRef]
- Denny, M.S.; Moreton, J.C.; Benz, L.; Cohen, S.M. Metal—Organic frameworks for membrane-based separations. Nat. Rev. Mater. 2016, 1, 16078. [Google Scholar] [CrossRef]
- Wong, K.C.; Goh, P.S.; Taniguchi, T.; Ismail, A.F.; Zahri, K. The role of geometrically different carbon-based fillers on the formation and gas separation performance of nanocomposite membranes. Carbon 2019, 149, 33–44. [Google Scholar] [CrossRef]
- Zagho, M.M.; Hassan, M.K.; Khraisheh, M.; Al-Maadeed, M.A.A.; Nazarenko, S. A review on recent advances in CO2 separation using zeolite and zeolite-like materials as adsorbents and fillers in mixed matrix membranes (MMMs). Chem. Eng. J. Adv. 2021, 6, 100091. [Google Scholar] [CrossRef]
- Zulhairun, A.K.; Ismail, A.F. The role of layered silicate loadings and their dispersion states on the gas separation performance of mixed matrix membrane. J. Membr. Sci. 2014, 468, 20–30. [Google Scholar] [CrossRef]
- Zulhairun, A.K.; Ismail, A.F.; Matsuura, T.; Abdullah, M.S.; Mustafa, A. Asymmetric mixed matrix membrane incorporating organically modified clay particle for gas separation. Chem. Eng. J. 2014, 241, 495–503. [Google Scholar] [CrossRef]
- Liang, C.-Y.; Uchytil, P.; Petrychkovych, R.; Lai, Y.-C.; Friess, K.; Sipek, M.; Mohan Reddy, M.; Suen, S.-Y. A comparison on gas separation between PES (polyethersulfone)/MMT (Na-montmorillonite) and PES/TiO2 mixed matrix membranes. Sep. Purif. Technol. 2012, 92, 57–63. [Google Scholar] [CrossRef]
- Wang, Z.; Tang, H.; Zhang, H.; Lei, M.; Chen, R.; Xiao, P.; Pan, M. Synthesis of nafion/CeO2 hybrid for chemically durable proton exchange membrane of fuel cell. J. Membr. Sci. 2012, 421–422, 201–210. [Google Scholar] [CrossRef]
- Weissbach, T.; Peckham, T.J.; Holdcroft, S. CeO2, ZrO2 and YSZ as mitigating additives against degradation of proton exchange membranes by free radicals. J. Membr. Sci. 2016, 498, 94–104. [Google Scholar] [CrossRef]
- Lakhotia, S.R.; Mukhopadhyay, M.; Kumari, P. Cerium oxide nanoparticles embedded thin-film nanocomposite nanofiltration membrane for water treatment. Sci. Rep. 2018, 8, 4976. [Google Scholar] [CrossRef]
- Costantino, F.; Cavaliere, E.; Gavioli, L.; Carzino, R.; Leoncino, L.; Brescia, R.; Athanassiou, A.; Fragouli, D. Photocatalytic activity of cellulose acetate nanoceria/Pt hybrid mats driven by visible light irradiation. Polymers 2021, 13, 912. [Google Scholar] [CrossRef]
- Gu, H.; Soucek, M.D. Preparation and characterization of monodisperse cerium oxide nanoparticles in hydrocarbon solvents. Chem. Mater. 2007, 19, 1103–1110. [Google Scholar] [CrossRef]
- Puleo, A.C.; Paul, D.R.; Kelley, S.S. The effect of degree of acetylation on gas sorption and transport behavior in cellulose acetate. J. Membr. Sci. 1989, 47, 301–332. [Google Scholar] [CrossRef]
- Ahmed, D.F.; Isawi, H.; Badway, N.A.; Elbayaa, A.A.; Shawky, H. Graphene oxide incorporated cellulose triacetate/cellulose acetate nanocomposite membranes for forward osmosis desalination. Arab. J. Chem. 2021, 14, 102995. [Google Scholar] [CrossRef]
- Lu, X.; Feng, X.; Yang, Y.; Jiang, J.; Cheng, W.; Liu, C.; Gopinadhan, M.; Osuji, C.O.; Ma, J.; Elimelech, M. Tuning the permselectivity of polymeric desalination membranes via control of polymer crystallite size. Nat. Commun. 2019, 10, 2347. [Google Scholar] [CrossRef]
- Jabbarzadeh, A.; Halfina, B. Unravelling the effects of size, volume fraction and shape of nanoparticle additives on crystallization of nanocomposite polymers. Nanoscale Adv. 2019, 1, 4704–4721. [Google Scholar] [CrossRef] [Green Version]
- Rui, N.; Zhang, X.; Zhang, F.; Liu, Z.; Cao, X.; Xie, Z.; Zou, R.; Senanayake, S.D.; Yang, Y.; Rodriguez, J.A.; et al. Highly active Ni/CeO2 catalyst for CO2 methanation: Preparation and characterization. Appl. Catal. B Environ. 2021, 282, 119581. [Google Scholar] [CrossRef]
- Friess, K.; Hynek, V.; Šípek, M.; Kujawski, W.M.; Vopička, O.; Zgažar, M.; Kujawski, M.W. Permeation and sorption properties of poly(ether-block-amide) membranes filled by two types of zeolites. Sep. Purif. Technol. 2011, 80, 418–427. [Google Scholar] [CrossRef]
- Vopička, O.; Friess, K.; Hynek, V.; Sysel, P.; Zgažar, M.; Šípek, M.; Pilnáček, K.; Lanč, M.; Jansen, J.C.; Mason, C.R.; et al. Equilibrium and transient sorption of vapours and gases in the polymer of intrinsic microporosity PIM-1. J. Membr. Sci. 2013, 434, 148–160. [Google Scholar] [CrossRef]
- Jansen, J.C.; Friess, K.; Drioli, E. Organic vapour transport in glassy perfluoropolymer membranes: A simple semi-quantitative approach to analyze clustering phenomena by time lag measurements. J. Membr. Sci. 2011, 367, 141–151. [Google Scholar] [CrossRef]
- Friess, K.; Jansen, J.C.; Bazzarelli, F.; Izák, P.; Jarmarová, V.; Kačírková, M.; Schauer, J.; Clarizia, G.; Bernardo, P. High ionic liquid content polymeric gel membranes: Correlation of membrane structure with gas and vapour transport properties. J. Membr. Sci. 2012, 415–416, 801–809. [Google Scholar] [CrossRef]
- Mei, Z.; Li, Y.; Fan, M.; Zhao, L.; Zhao, J. Effect of the interactions between Pt species and ceria on Pt/ceria catalysts for water gas shift: The XPS studies. Chem. Eng. J. 2015, 259, 293–302. [Google Scholar] [CrossRef]
- Xunwen, S.; Liqun, Z.; Weiping, L.; Huicong, L.; Hui, Y. The synthesis of monodispersed M-CeO2/SiO2 nanoparticles and formation of UV absorption coatings with them. RSC Adv. 2020, 10, 4554–4560. [Google Scholar] [CrossRef] [Green Version]
- Culica, M.E.; Chibac-Scutaru, A.L.; Melinte, V.; Coseri, S. Cellulose acetate incorporating organically functionalized CeO2 NPs: Efficient materials for UV filtering applications. Materials 2020, 13, 2955. [Google Scholar] [CrossRef]
- Jung, J.T.; Kim, J.F.; Wang, H.H.; di Nicolo, E.; Drioli, E.; Lee, Y.M. Understanding the non-solvent induced phase separation (NIPS) effect during the fabrication of microporous PVDF membranes via thermally induced phase separation (TIPS). J. Membr. Sci. 2016, 514, 250–263. [Google Scholar] [CrossRef]
- Amara, M.; Arous, O.; Smail, F.; Kerdjoudj, H.; Trari, M.; Bouguelia, A. An assembled poly-4-vinyl pyridine and cellulose triacetate membrane and Bi2S3 electrode for photoelectrochemical diffusion of metallic ions. J. Hazard. Mater. 2009, 169, 195–202. [Google Scholar] [CrossRef]
- Shen, Y.; Lua, A.C. Preparation and characterization of mixed matrix membranes based on poly(vinylidene fluoride) and zeolite 4A for gas separation. Polym. Eng. Sci. 2012, 52, 2106–2113. [Google Scholar] [CrossRef]
- Nabili, A.; Fattoum, A.; Brochier-Salon, M.-C.; Bras, J.; Elaloui, E. Synthesis of cellulose triacetate-I from microfibrillated date seeds cellulose (Phoenix dactylifera L.). Iran. Polym. J. 2017, 26, 137–147. [Google Scholar] [CrossRef]
- Číhal, P.; Vopička, O.; Lanč, M.; Kludský, M.; Velas, J.; Hrdlička, Z.; Michalcová, A.; Dendisová, M.; Friess, K. Poly(butylene succinate)-cellulose triacetate blends: Permeation, pervaporation, sorption and physical structure. Polym. Test. 2018, 65, 468–479. [Google Scholar] [CrossRef]
- Sedkaoui, Y.; Abdellaoui, N.; Arous, O.; Lounici, H.; Nasrallah, N.; Szymczyk, A. Elaboration and characterization of multilayer polymeric membranes: Effect of the chemical nature of polymers. J. Polym. Eng. 2021, 41, 127–136. [Google Scholar] [CrossRef]
- Shakeel, I.; Hussain, A.; Farrukh, S. Effect analysis of nickel ferrite (NiFe2O4) and titanium dioxide (TiO2) nanoparticles on CH4/CO2 gas permeation properties of cellulose acetate based mixed matrix membranes. J. Polym. Environ. 2019, 27, 1449–1464. [Google Scholar] [CrossRef]
- Ye, C.; Wu, X.; Wu, H.; Yang, L.; Ren, Y.; Wu, Y.; Liu, Y.; Guo, Z.; Zhao, R.; Jiang, Z. Incorporating nano-sized ZIF-67 to enhance selectivity of polymers of intrinsic microporosity membranes for biogas upgrading. Chem. Eng. Sci. 2020, 216, 115497. [Google Scholar] [CrossRef]
- Codou, A.; Moncel, M.; van Berkel, J.G.; Guigo, N.; Sbirrazzuoli, N. Glass transition dynamics and cooperativity length of poly(ethylene 2,5-furandicarboxylate) compared to poly(ethylene terephthalate). Phys. Chem. Chem. Phys. 2016, 18, 16647–16658. [Google Scholar] [CrossRef]
- Mallarino, S.; Chailan, J.F.; Vernet, J.L. Glass fibre sizing effect on dynamic mechanical properties of cyanate ester composites I. Single frequency investigations. Eur. Polym. J. 2005, 41, 1804–1811. [Google Scholar] [CrossRef]
- Turi, E. Thermal Characterization of Polymeric Materials; Elsevier Science: London, UK, 2012. [Google Scholar]
- Tiwari, S.K.; Hatui, G.; Oraon, R.; De Adhikari, A.; Nayak, G.C. Mixing sequence driven controlled dispersion of graphene oxide in PC/PMMA blend nanocomposite and its effect on thermo-mechanical properties. Curr. Appl. Phys. 2017, 17, 1158–1168. [Google Scholar] [CrossRef]
- Chae, D.W.; Nam, Y.W.; Wang, S.S.; Hong, S.M. Structures and Physical Properties of Multi-Walled Carbon Nanotube-Filled PVDF Thermoplastic Composites. Solid State Phenom. 2007, 124–126, 1117–1120. [Google Scholar] [CrossRef]
- Kanehashi, S.; Nagai, K. Analysis of dual-mode model parameters for gas sorption in glassy polymers. J. Membr. Sci. 2005, 253, 117–138. [Google Scholar] [CrossRef]
- Guggenheim, E.A. Application of Statistical Mechanics; Clarendon Press: Oxford, UK, 1966. [Google Scholar]
- He, Z.; Pinnau, I.; Morisato, A. Nanostructured poly(4-methyl-2-pentyne)/silica hybrid membranes for gas separation. Desalination 2002, 146, 11–15. [Google Scholar] [CrossRef]
- Sternstein, S.S.; Zhu, A.-J. Reinforcement mechanism of nanofilled polymer melts as elucidated by nonlinear viscoelastic behavior. Macromolecules 2002, 35, 7262–7273. [Google Scholar] [CrossRef]
- Bhole, Y.S.; Wanjale, S.D.; Kharul, U.K.; Jog, J.P. Assessing feasibility of polyarylate–clay nanocomposites towards improvement of gas selectivity. J. Membr. Sci. 2007, 306, 277–286. [Google Scholar] [CrossRef]
- Janakiram, S.; Ahmadi, M.; Dai, Z.; Ansaloni, L.; Deng, L. Performance of nanocomposite membranes containing 0D to 2D nanofillers for CO₂ separation: A review. Membranes 2018, 8, 24. [Google Scholar] [CrossRef] [Green Version]
- Hahn, K.R.; Iannuzzi, M.; Seitsonen, A.P.; Hutter, J. Coverage effect of the CO2 adsorption mechanisms on CeO2(111) by first principles analysis. J. Phys. Chem. C 2013, 117, 1701–1711. [Google Scholar] [CrossRef] [Green Version]
- Bos, A.; Pünt, I.G.M.; Wessling, M.; Strathmann, H. CO2-induced plasticization phenomena in glassy polymers. J. Membr. Sci. 1999, 155, 67–78. [Google Scholar] [CrossRef]
- Schweke, D.; Zalkind, S.; Attia, S.; Bloch, J. The Interaction of CO2 with CeO2powder explored by correlating adsorption and thermal desorption analyses. J. Phys. Chem. C 2018, 122, 9947–9957. [Google Scholar] [CrossRef]
- Senanayake, S.D.; Mullins, D.R. Redox pathways for HCOOH decomposition over CeO2 surfaces. J. Phys. Chem. C 2008, 112, 9744–9752. [Google Scholar] [CrossRef]
- Trovarelli, A. Catalytic properties of ceria and CeO2-containing materials. Catal. Rev. 1996, 38, 439–520. [Google Scholar] [CrossRef]


| # | Sample | wt.% of CTA | wt.% of CeO2 | wt.% of NMP |
|---|---|---|---|---|
| 1 | CTA | 5.75 | 0.0 | 94.25 |
| 2 | CTA-CeO2 (0.32) | 5.75 | 0.32 | 94.93 |
| 3 | CTA-CeO2 (0.64) | 5.75 | 0.64 | 93.61 |
| 4 | CTA-CeO2 (0.9) | 5.75 | 0.9 | 93.35 |
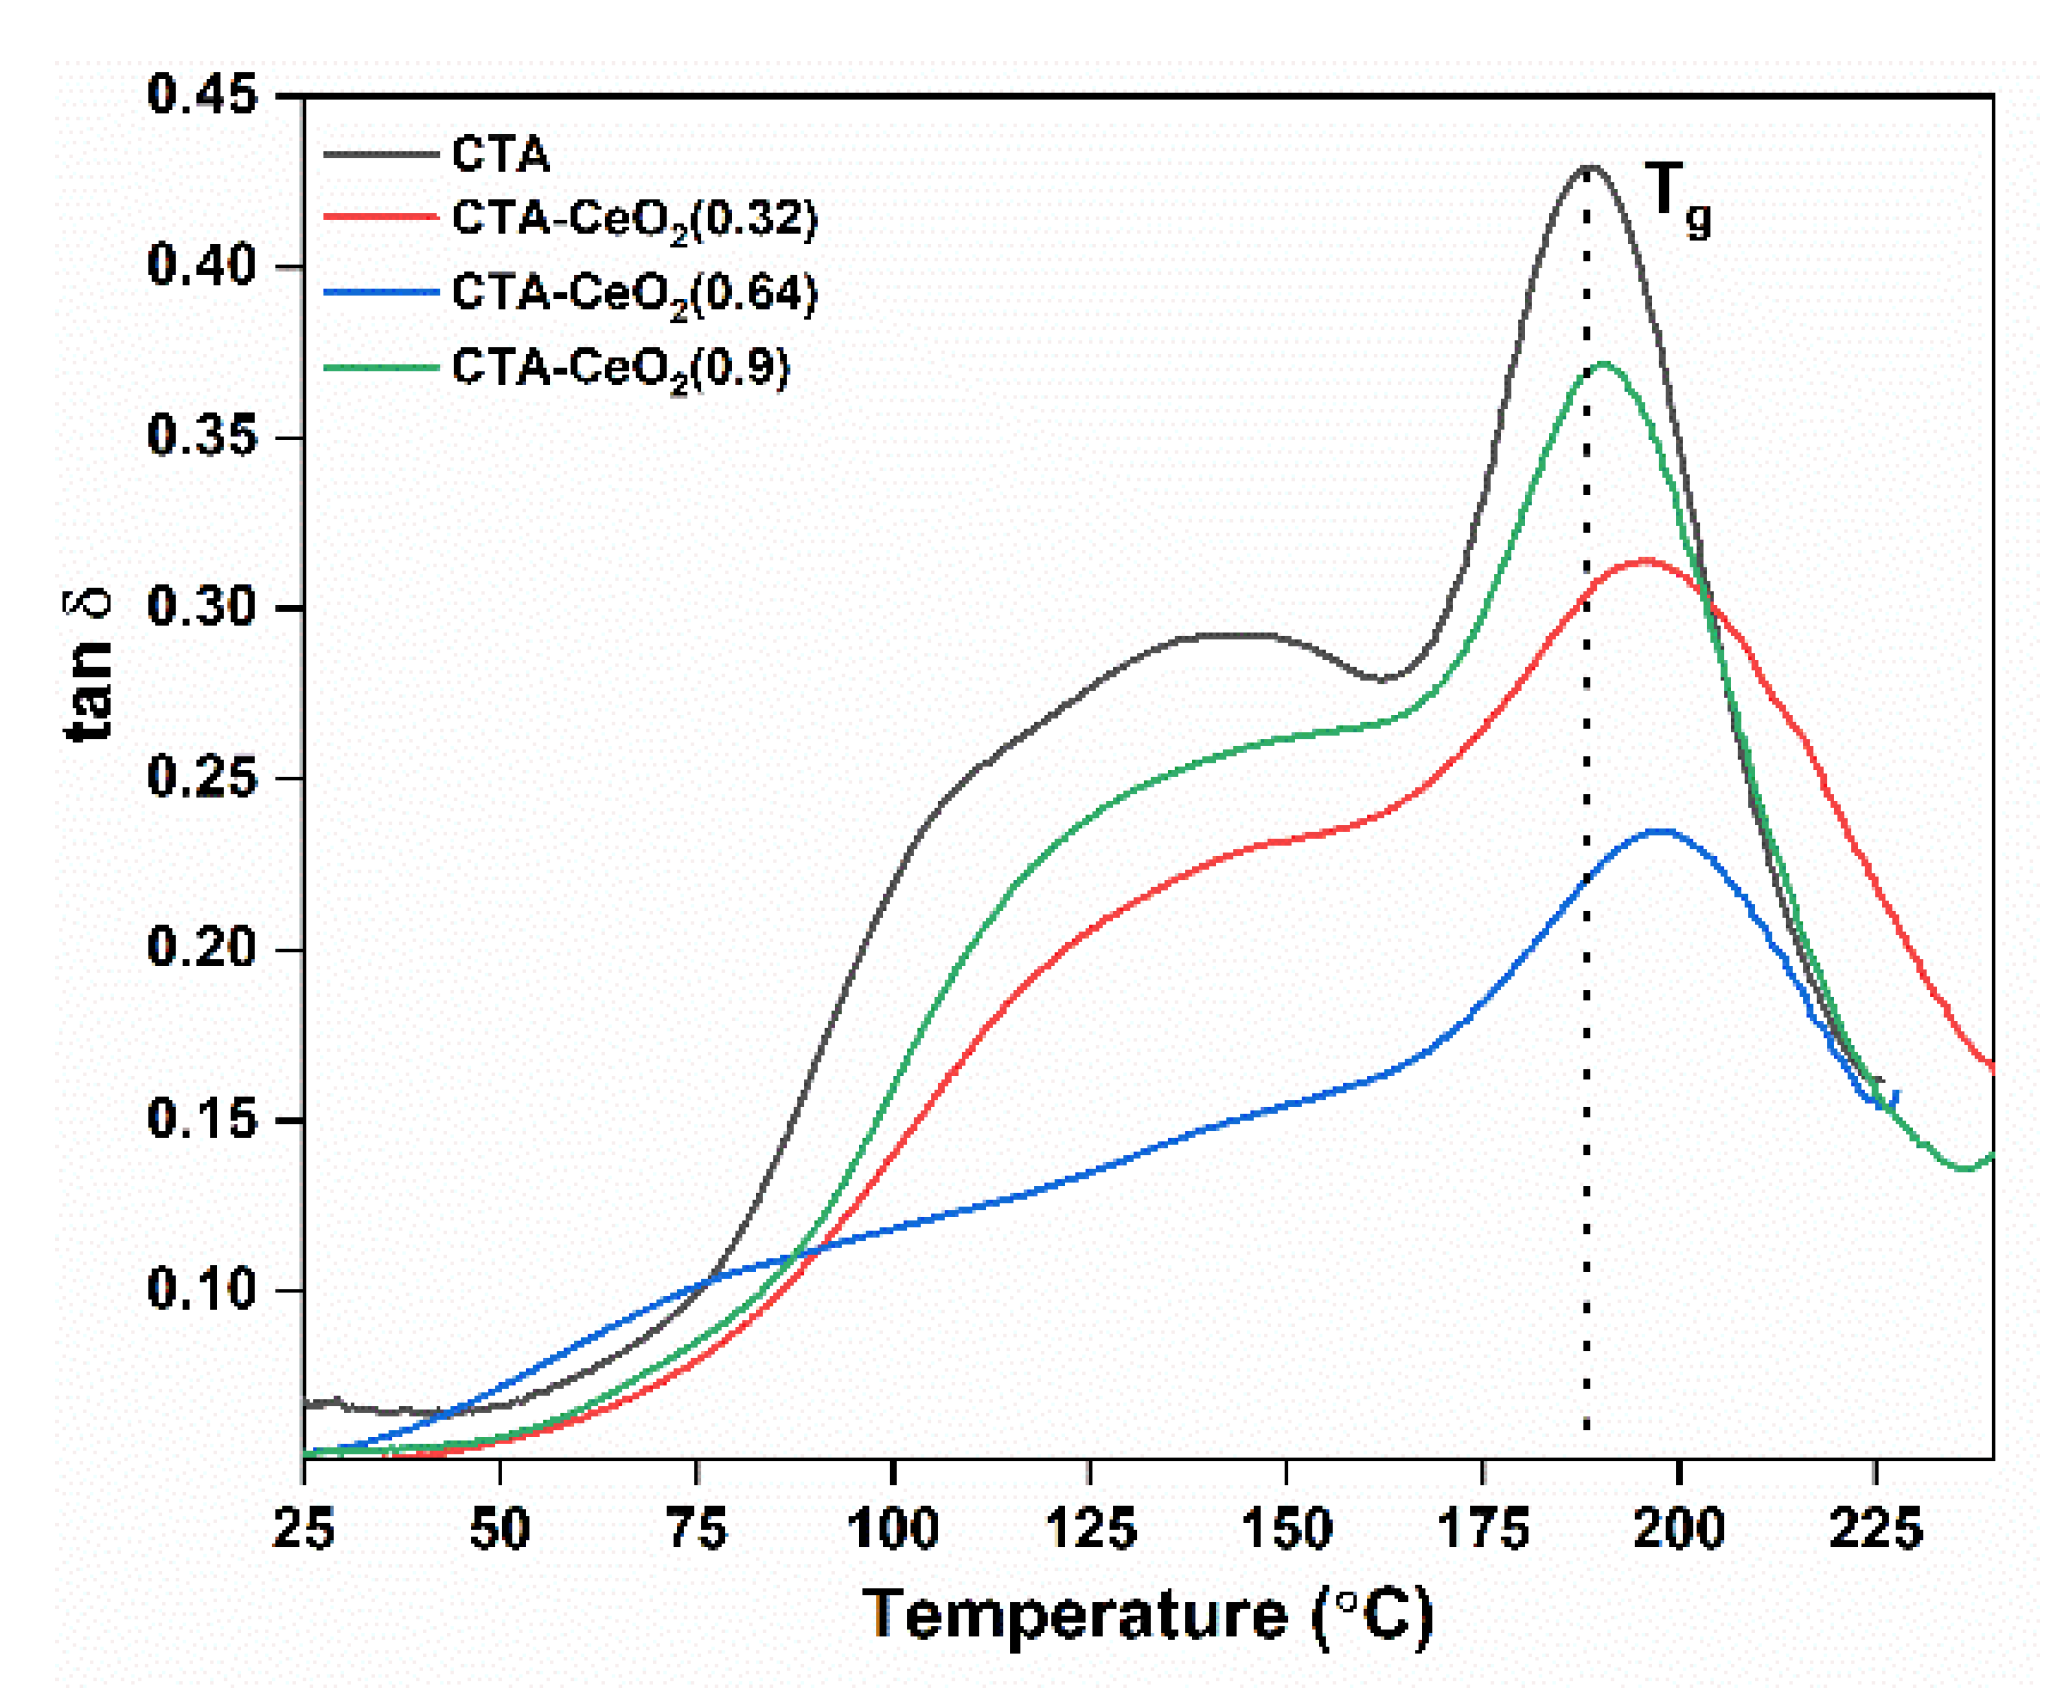
| Sample Code | Glass Transition Tempt (Tg) (°C) | Mechanical Properties (25 °C) | Surface Roughness | ||||
|---|---|---|---|---|---|---|---|
| Young’s Modulus (GPa) | Elongation Strain at Break (%) | Tensile Strength (MPa) | Arithmetic Mean Height Sa (µm) | Root-Mean-Square Height Sq (µm) | Maximum Height Sz (µm) | ||
| CTA | 188.5 | 1.24 | 51.29 | 31.09 | 0.033 | 0.040 | 0.57 |
| CTA-CeO2 (0.32) | 194.1 | 1.39 | 13.31 | 60.38 | 0.041 | 0.060 | 0.70 |
| CTA-CeO2 (0.64) | 197.3 | 1.62 | 4.71 | 53.75 | 0.077 | 0.095 | 0.77 |
| CTA-CeO2 (0.9) | 190.5 | 1.47 | 4.18 | 53.74 | 0.136 | 0.171 | 1.49 |
| Sample | Permeability (Barrer) | Selectivity | |||||||
|---|---|---|---|---|---|---|---|---|---|
| H2 | O2 | N2 | CO2 | CH4 | CO2/CH4 | CO2/N2 | O2/N2 | H2/CO2 | |
| CTA | 4.39 | 0.65 | 0.03 | 3.01 | 0.12 | 25.08 | 99.0 | 21.67 | 1.48 |
| CTA-CeO2 (0.32) | 7.2 | 0.68 | 0.35 | 6.89 | 0.28 | 24.61 | 19.69 | 1.94 | 1.04 |
| CTA-CeO2 (0.64) | 15.09 | 9.07 | 2.97 | 9.67 | 2.89 | 3.34 | 3.26 | 3.05 | 1.56 |
| CTA-CeO2 (0.9) | 5.19 | 0.43 | 0.02 | 2.66 | 0.03 | 88.67 | 133.0 | 21.50 | 1.95 |
| CTA-CeO2 (1.4) * | 4.9 | 0.89 | 0.04 | 3.56 | 0.18 | 19.78 | 89.0 | 21.25 | 1.38 |
Publisher’s Note: MDPI stays neutral with regard to jurisdictional claims in published maps and institutional affiliations. |
© 2021 by the authors. Licensee MDPI, Basel, Switzerland. This article is an open access article distributed under the terms and conditions of the Creative Commons Attribution (CC BY) license (https://creativecommons.org/licenses/by/4.0/).
Share and Cite
Regmi, C.; Ashtiani, S.; Sofer, Z.; Hrdlička, Z.; Průša, F.; Vopička, O.; Friess, K. CeO2-Blended Cellulose Triacetate Mixed-Matrix Membranes for Selective CO2 Separation. Membranes 2021, 11, 632. https://doi.org/10.3390/membranes11080632
Regmi C, Ashtiani S, Sofer Z, Hrdlička Z, Průša F, Vopička O, Friess K. CeO2-Blended Cellulose Triacetate Mixed-Matrix Membranes for Selective CO2 Separation. Membranes. 2021; 11(8):632. https://doi.org/10.3390/membranes11080632
Chicago/Turabian StyleRegmi, Chhabilal, Saeed Ashtiani, Zdeněk Sofer, Zdeněk Hrdlička, Filip Průša, Ondřej Vopička, and Karel Friess. 2021. "CeO2-Blended Cellulose Triacetate Mixed-Matrix Membranes for Selective CO2 Separation" Membranes 11, no. 8: 632. https://doi.org/10.3390/membranes11080632
APA StyleRegmi, C., Ashtiani, S., Sofer, Z., Hrdlička, Z., Průša, F., Vopička, O., & Friess, K. (2021). CeO2-Blended Cellulose Triacetate Mixed-Matrix Membranes for Selective CO2 Separation. Membranes, 11(8), 632. https://doi.org/10.3390/membranes11080632