
Validation of Prognostic Scores in Extracorporeal Life Support: A Multi-Centric Retrospective Study

 ,
, 
 , ,
, , 

Abstract
1. Introduction
2. Material & Methods
2.1. Study Population
2.2. Data Collection
2.3. Statistical Analyses
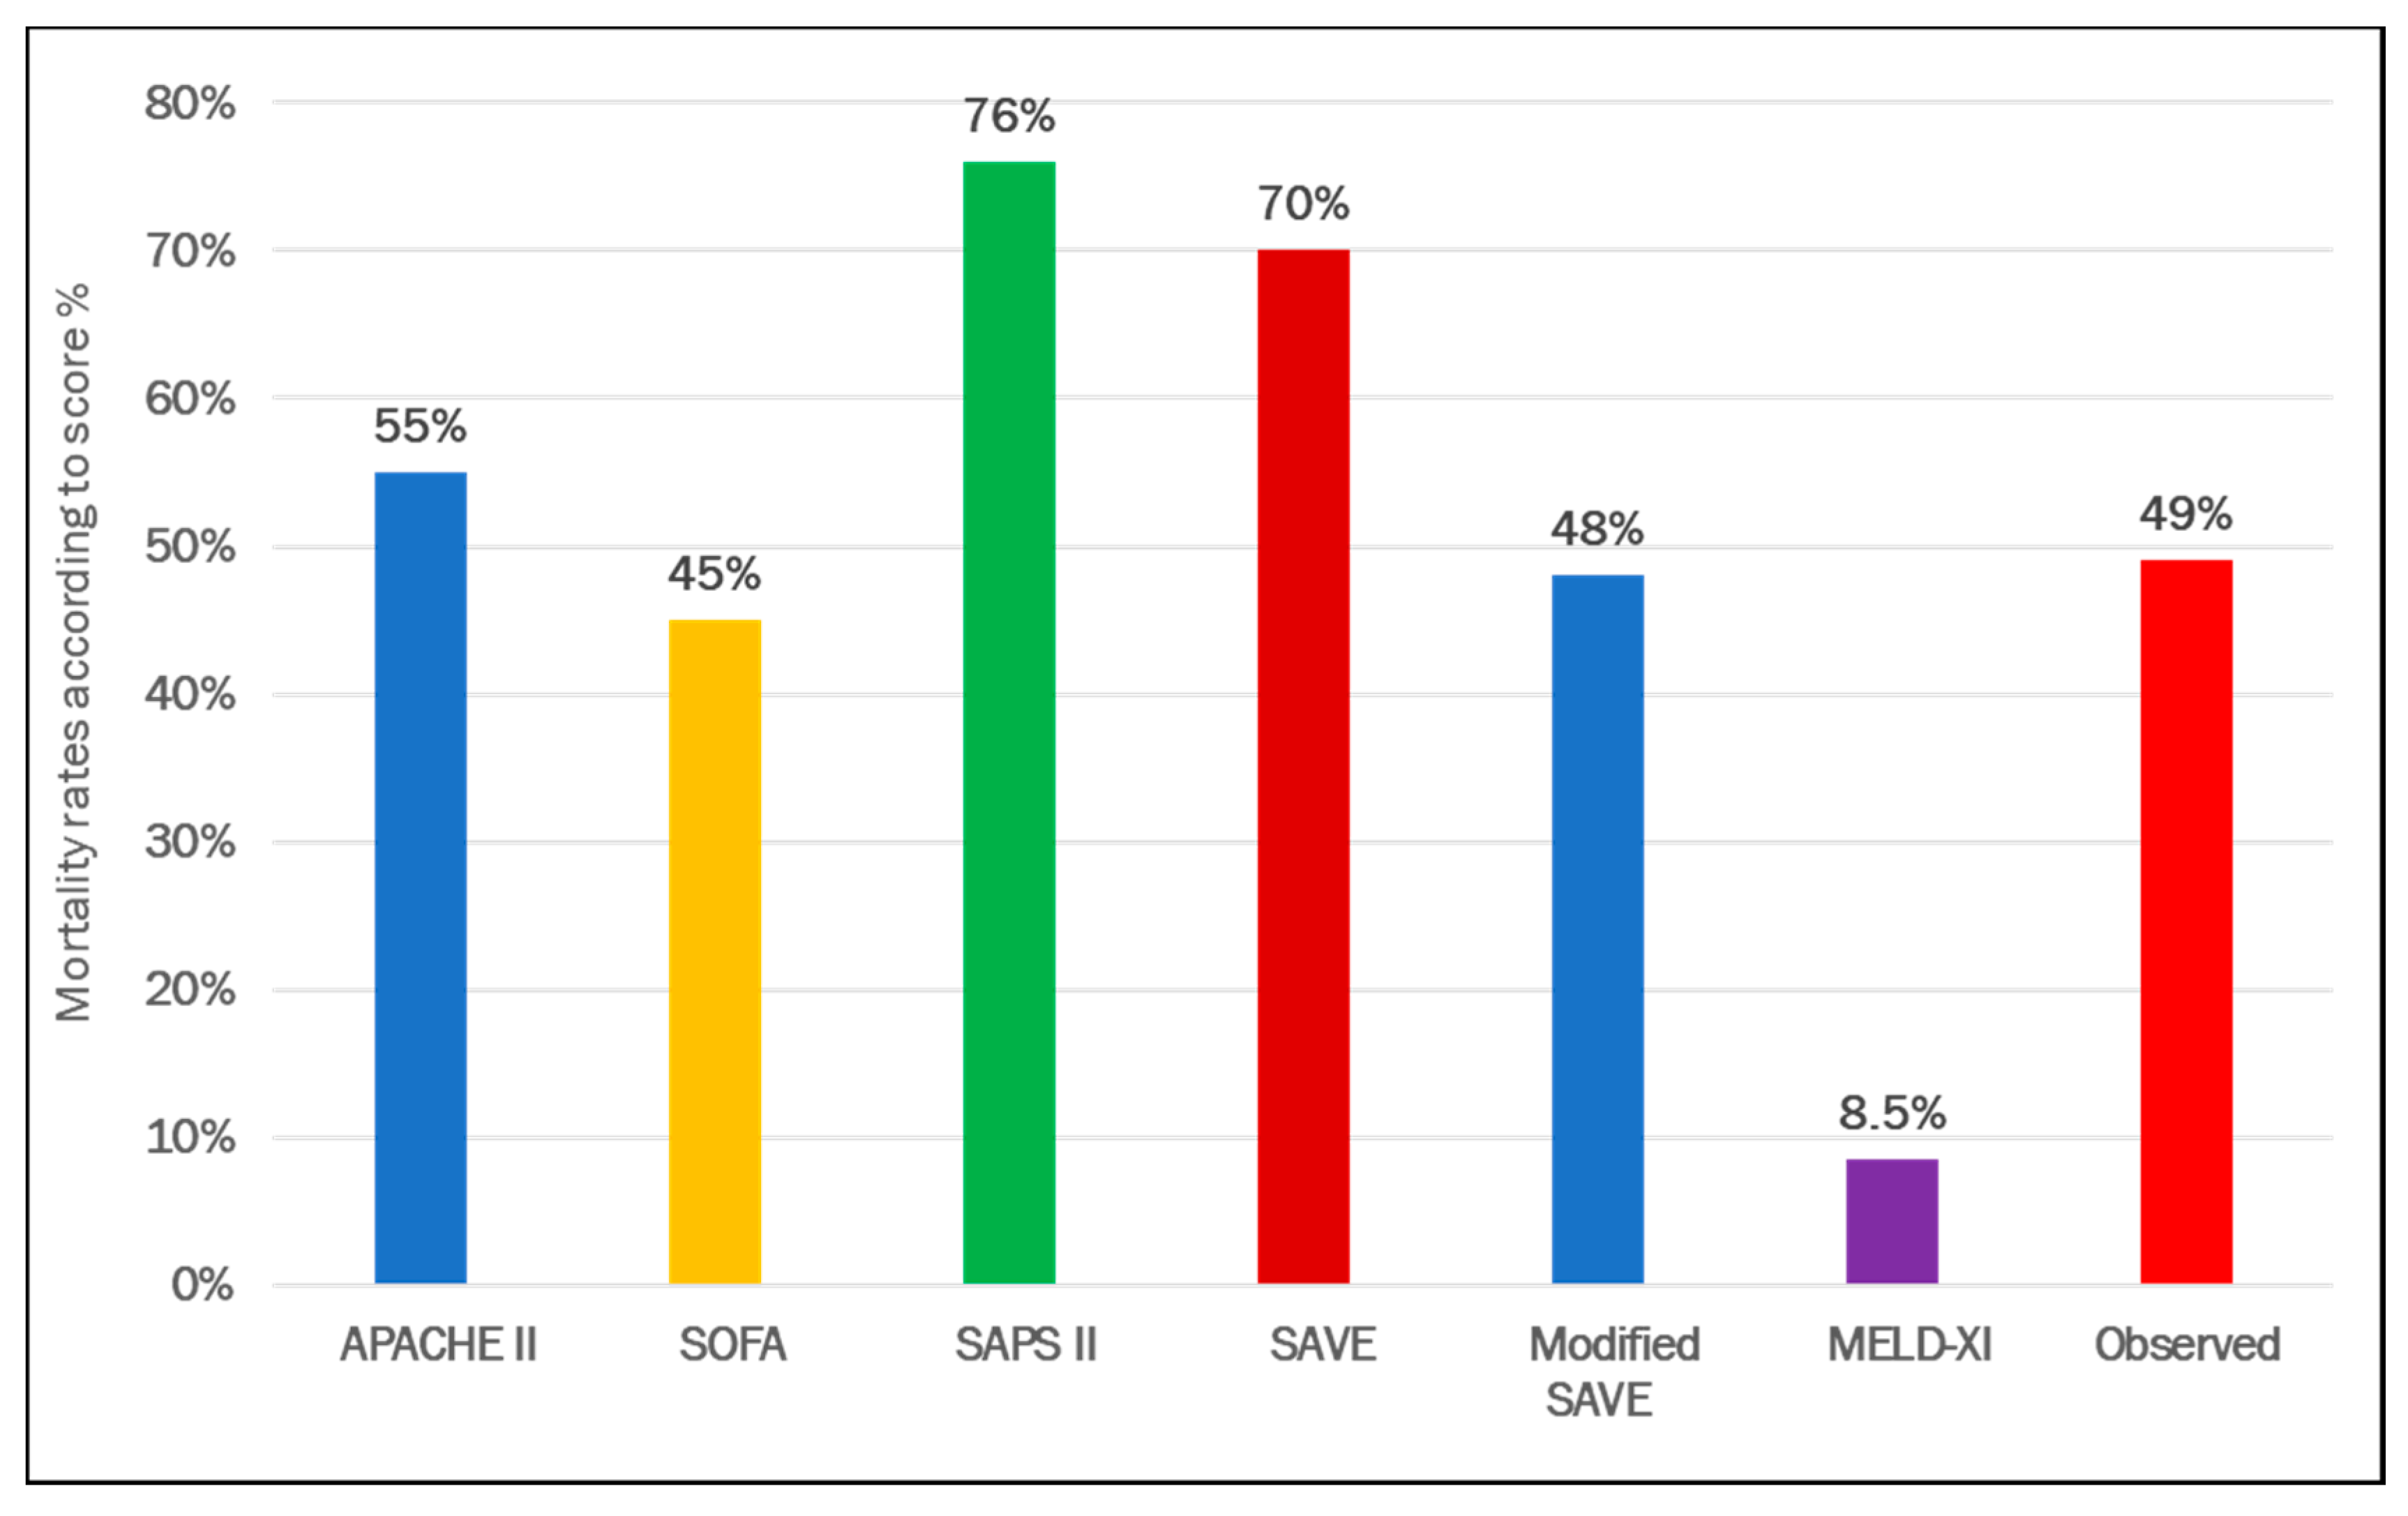
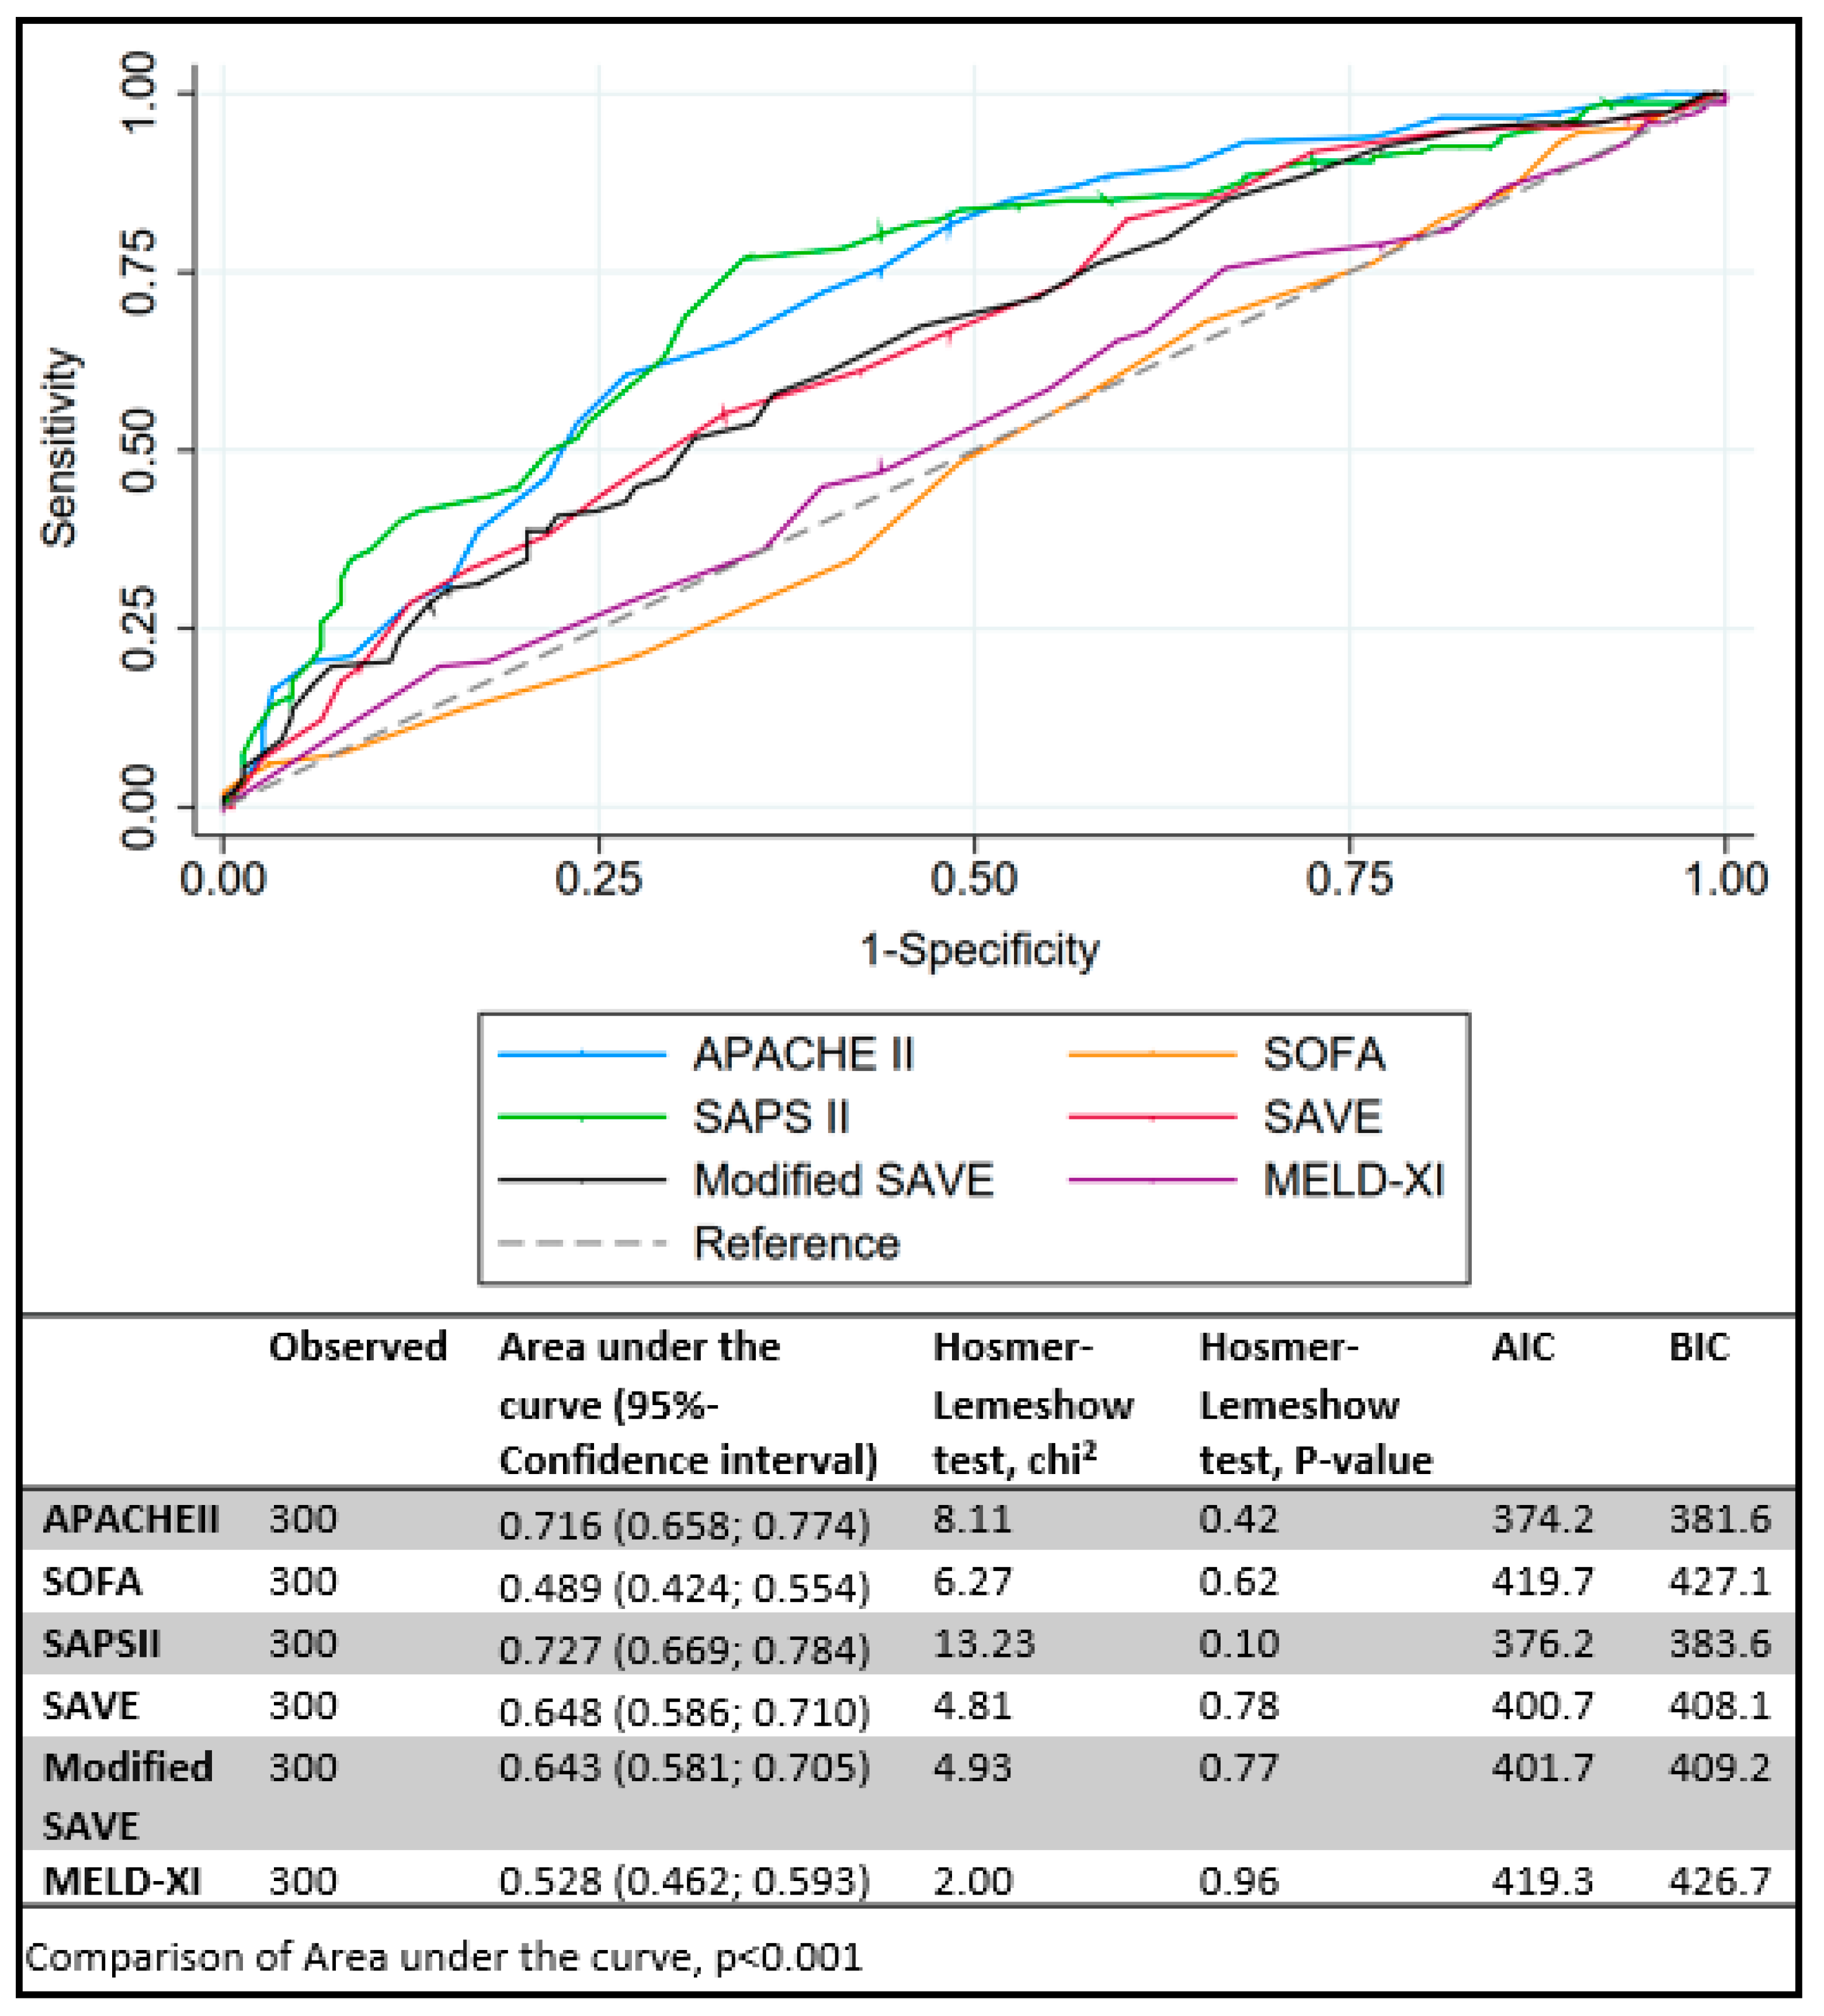
3. Results
3.1. VA ECMO Population
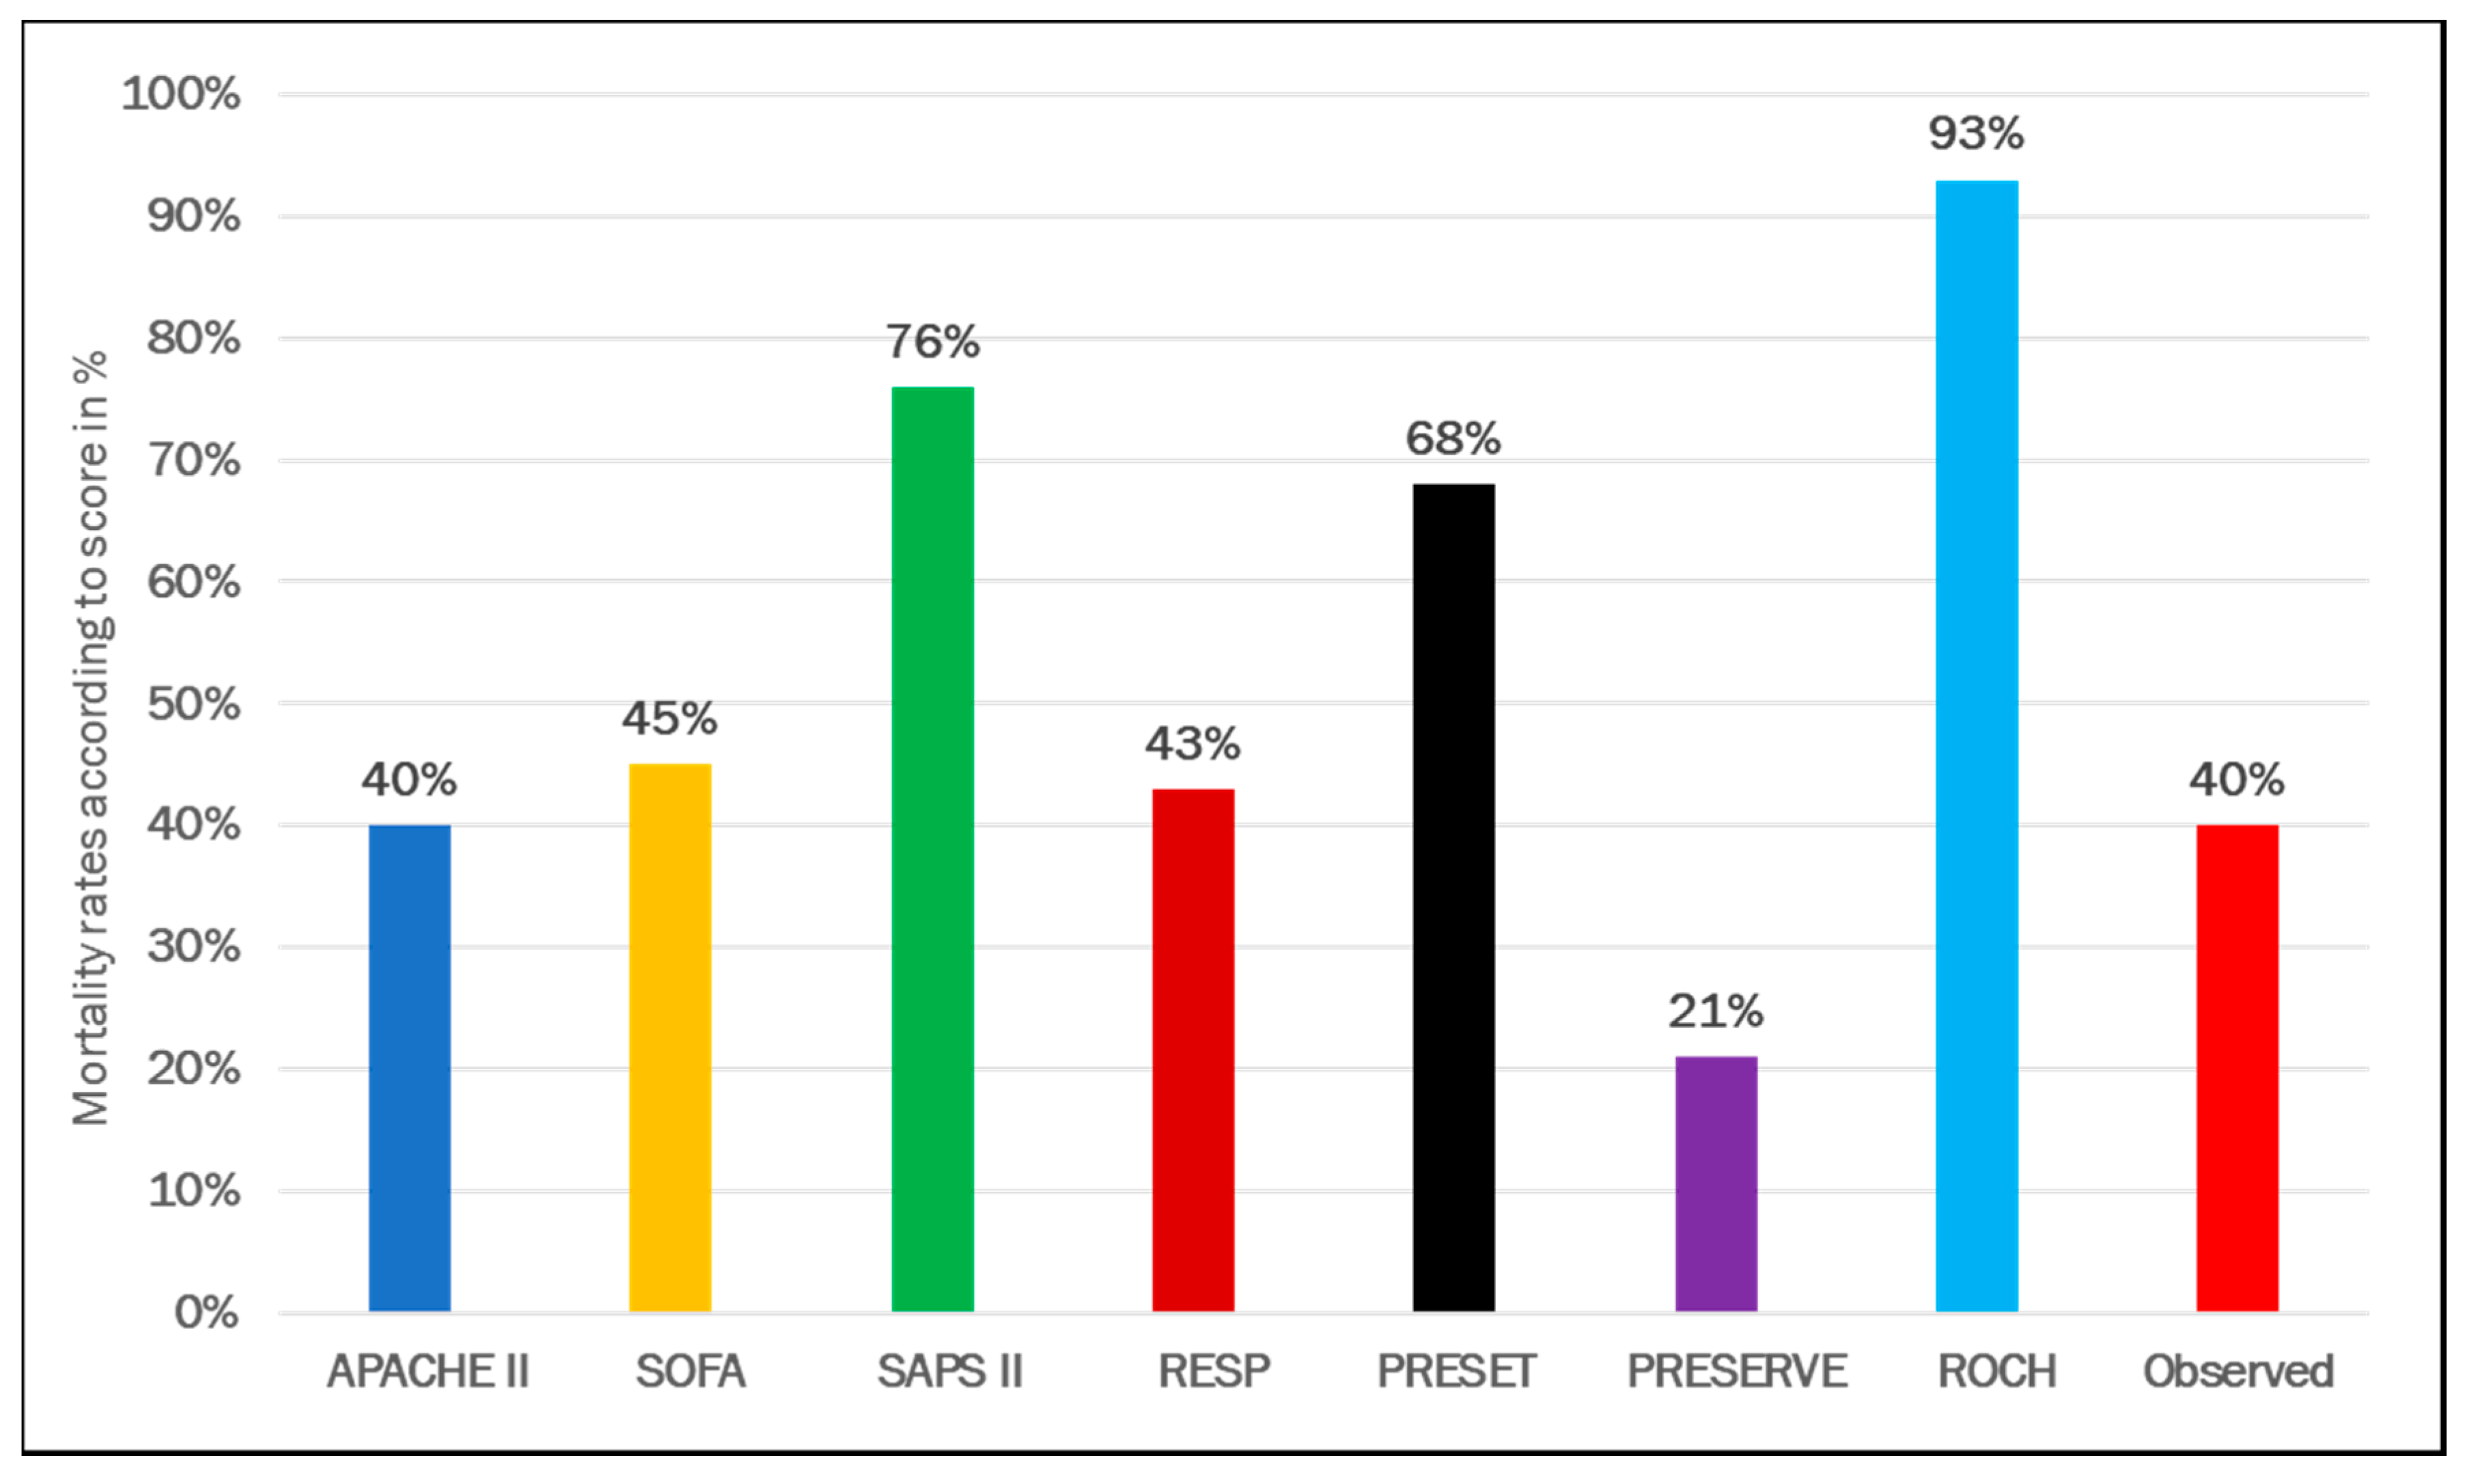
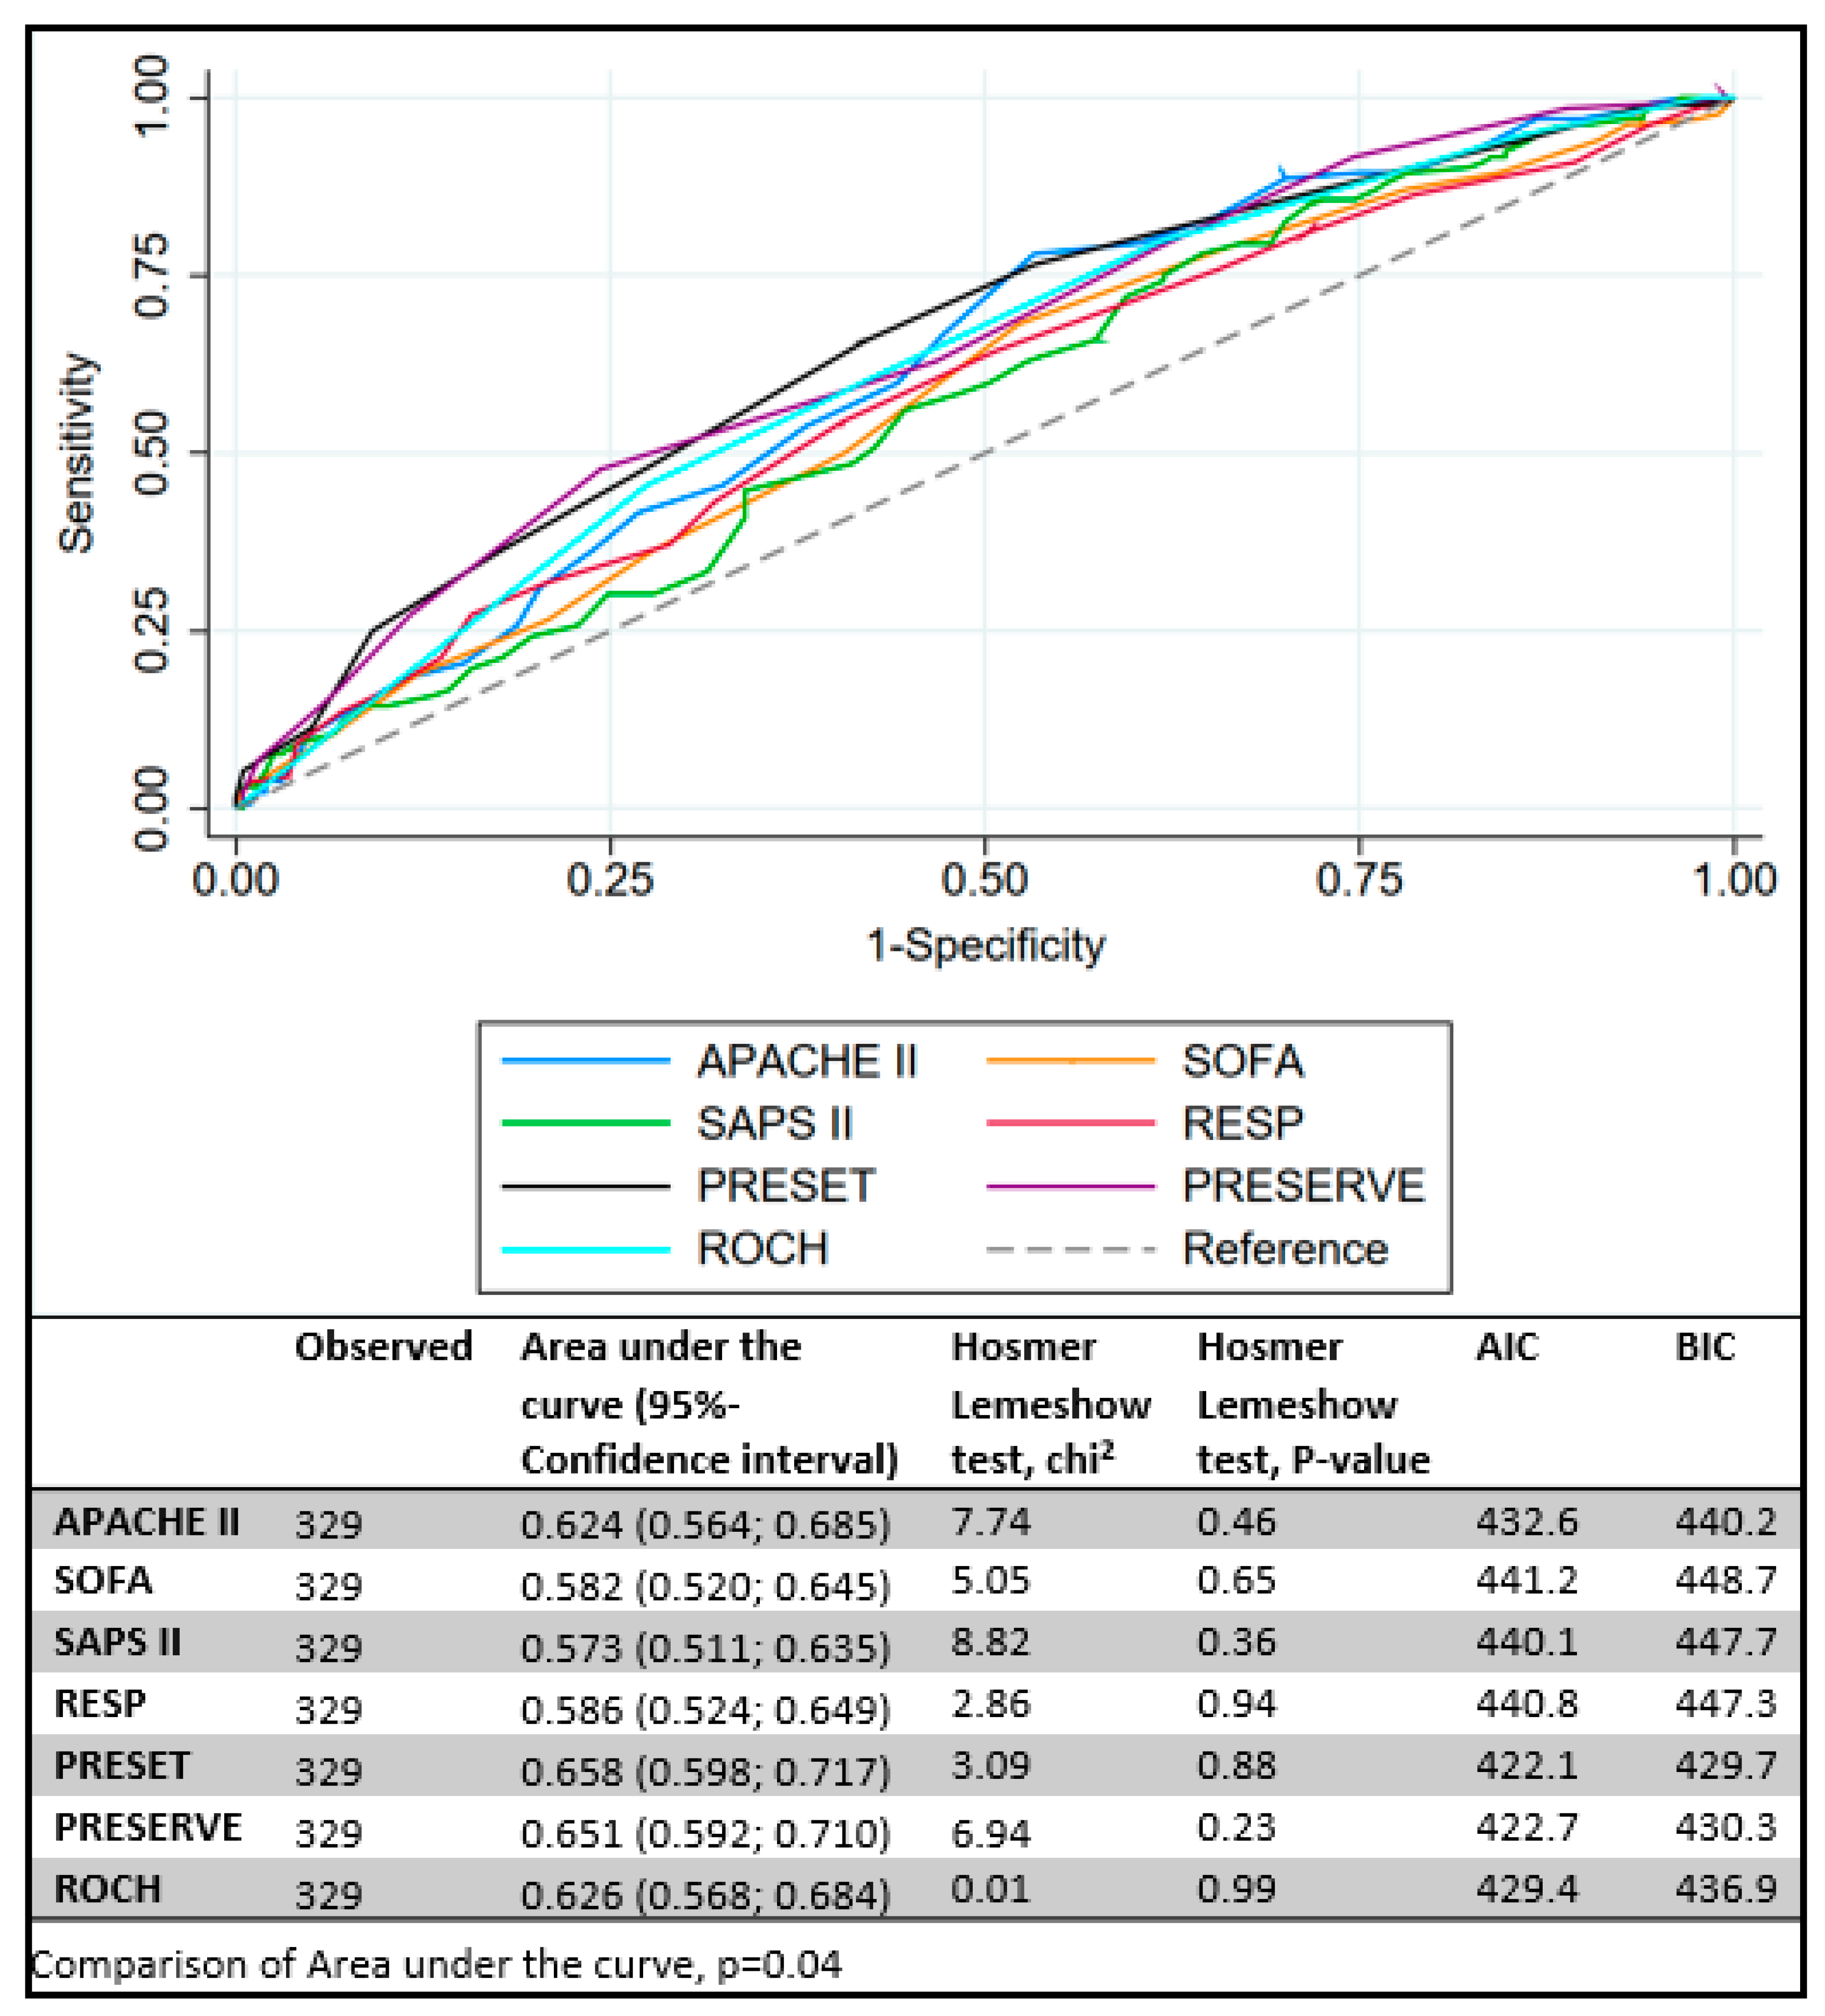
3.2. VV ECMO Population
4. Discussion
Limitations
5. Conclusions
Supplementary Materials
Author Contributions
Funding
Institutional Review Board Statement
Informed Consent Statement
Data Availability Statement
Acknowledgments
Conflicts of Interest
References
- Vincent, J.-L.; Moreno, R.; Takala, J.; Willatts, S.; De Mendonça, A.; Bruining, H.; Reinhart, C.K.; Suter, P.M.; Thijs, L.G. The SOFA (Sepsis-related Organ Failure Assessment) score to describe organ dysfunction/failure. Intensive Care Med. 1996, 22, 707–710. [Google Scholar] [CrossRef] [PubMed]
- Le Gall, J.R. A new Simplified Acute Physiology Score (SAPS II) based on a European/North American multicenter study. JAMA 1993, 270, 2957–2963. [Google Scholar] [CrossRef] [PubMed]
- Knaus, W.A.; Draper, E.A.; Wagner, D.P.; Zimmerman, J.E. APACHE II: A severity of disease classification system. Crit. Care Med. 1985, 13, 818–829. [Google Scholar] [CrossRef] [PubMed]
- Brogan, T.V.; Lequier, L.; Lorusso, R.; MacLaren, G.; Peek, G.J. Extracorporeal life support. In The ELSO Red Book, 5th ed.; Extracorporeal Life Support Organization: Ann Arbor, MI, USA, 2017; ISBN 0965675653. [Google Scholar]
- Schmidt, M.; Burrell, A.; Roberts, L.; Bailey, M.; Sheldrake, J.; Rycus, P.T.; Hodgson, C.; Scheinkestel, C.; Cooper, D.J.; Thiagarajan, R.R.; et al. Predicting survival after ECMO for refractory cardiogenic shock: The survival after veno-arterial-ECMO (SAVE)-score. Eur. Heart J. 2015, 36, 2246–2256. [Google Scholar] [CrossRef] [PubMed]
- Chen, W.-C.; Huang, K.-Y.; Yao, C.-W.; Wu, C.-F.; Liang, S.-J.; Li, C.-H.; Tu, C.-Y.; Chen, H.-J. The modified SAVE score: Predicting survival using urgent veno-arterial extracorporeal membrane oxygenation within 24 hours of arrival at the emergency department. Crit. Care 2016, 20, 1–7. [Google Scholar] [CrossRef] [PubMed]
- Heuman, D.M.; Mihas, A.A.; Habib, A.; Gilles, H.S.; Stravitz, R.T.; Sanyal, A.J.; Fisher, R.A. MELD-XI: A rational approach to “sickest first” liver transplantation in cirrhotic patients requiring anticoagulant therapy. Liver Transplant. 2006, 13, 30–37. [Google Scholar] [CrossRef] [PubMed]
- Schmidt, M.; Bailey, M.; Sheldrake, J.; Hodgson, C.; Aubron, C.; Rycus, P.T.; Scheinkestel, C.; Cooper, D.J.; Brodie, D.; Pellegrino, V.; et al. Predicting Survival after Extracorporeal Membrane Oxygenation for Severe Acute Respiratory Failure. The Respiratory Extracorporeal Membrane Oxygenation Survival Prediction (RESP) Score. Am. J. Respir. Crit. Care Med. 2014, 189, 1374–1382. [Google Scholar] [CrossRef] [PubMed]
- Schmidt, M.; Zogheib, E.; Rozé, H.; Repesse, X.; Lebreton, G.; Luyt, C.-E.; Trouillet, J.-L.; Bréchot, N.; Nieszkowska, A.; Dupont, H.; et al. The PRESERVE mortality risk score and analysis of long-term outcomes after extracorporeal membrane oxygenation for severe acute respiratory distress syndrome. Intensive Care Med. 2013, 39, 1704–1713. [Google Scholar] [CrossRef] [PubMed]
- Roch, A.; Hraiech, S.; Masson, E.; Grisoli, D.; Forel, J.-M.; Boucekine, M.; Morera, P.; Guervilly, C.; Adda, M.; Dizier, S.; et al. Outcome of acute respiratory distress syndrome patients treated with extracorporeal membrane oxygenation and brought to a referral center. Intensive Care Med. 2013, 40, 74–83. [Google Scholar] [CrossRef] [PubMed]
- Hilder, M.; Herbstreit, F.; Adamzik, M.; Beiderlinden, M.; Bürschen, M.; Peters, J.; Frey, U.H. Comparison of mortality prediction models in acute respiratory distress syndrome undergoing extracorporeal membrane oxygenation and development of a novel prediction score: The PREdiction of Survival on ECMO Therapy-Score (PRESET-Score). Crit. Care 2017, 21, 301. [Google Scholar] [CrossRef] [PubMed]
- Cucchiara, A.; Hosmer, D.; Lemeshow, S. Applied Logistic Regression. Technometrics 1992, 34, 358. [Google Scholar] [CrossRef]
- Delong, E.R.; Delong, D.M.; Clarke-Pearson, D.L. Comparing the Areas under Two or More Correlated Receiver Operating Characteristic Curves: A Nonparametric Approach. Biometrics 1988, 44, 837. [Google Scholar] [CrossRef] [PubMed]
- Ensor, J.; Snell, K.I.E.; Martin, E.C. PMCALPLOT: Stata Module to Produce Calibration Plot of Prediction Model Performance; EconPapers: Örebro, Sweden, 2020. [Google Scholar]
- Muscedere, J.; Waters, B.; Varambally, A.; Bagshaw, S.M.; Boyd, J.G.; Maslove, D.; Sibley, S.; Rockwood, K. The impact of frailty on intensive care unit outcomes: A systematic review and meta-analysis. Intensive Care Med. 2017, 43, 1105–1122. [Google Scholar] [CrossRef] [PubMed]
- Muller, G.; Flecher, E.; Lebreton, G.; Luyt, C.-E.; Trouillet, J.-L.; Bréchot, N.; Schmidt, M.; Mastroianni, C.; Chastre, J.; Leprince, P.; et al. The ENCOURAGE mortality risk score and analysis of long-term outcomes after VA-ECMO for acute myocardial infarction with cardiogenic shock. Intensive Care Med. 2016, 42, 370–378. [Google Scholar] [CrossRef] [PubMed]


| VA Total (n = 300) | VA Survivors (n = 153) | VA Non-Survivors (n = 147) | p-Value | |
|---|---|---|---|---|
| Demographics, vital signs & laboratory chemistry | ||||
| Age in years | 57 (46–65) | 56 (42–63) | 58 (47–65) | 0.05 |
| Weight in kg | 77 (70–90) | 78 (68–89) | 77 (70–90) | 0.946 |
| Female sex | 101 (33.7%) | 53 (34.6%) | 48 (32.7%) | 0.72 |
| Heart rate/min | 101 (82–120) | 106 (87–125) | 96 (80–119) | 0.059 |
| Mean arterial pressure in mmHg | 68 (57–80) | 70 (57–80) | 66 (56–80) | 0.345 |
| Glasgow Coma Scale | 3 (3–13) | 9 (3–15) | 3 (3–3) | <0.001 |
| Acute renal failure | 160 (53.3%) | 76 (49.7%) | 84 (57.1%) | 0.195 |
| Creatinine in mg/dL | 1.50 (1.04–2.18) | 1.50 (1.10–2.32) | 1.50 (1.00–2.07) | 0.66 |
| Temperature in °C | 36.5 (35.3–37.2) | 36.6 (35.5–37.4) | 36.4 (34.8–37.1) | 0.025 |
| Leucocytes/nL | 11.7 (7.9–16.9) | 11.8 (8.1–18.4) | 10.8 (7.5–16.0) | 0.116 |
| Platelets × 103/µL | 131.5 (83.0–196.8) | 125.0 (82.0–193.0) | 141.0 (83.0–205.0) | 0.695 |
| Cardiopulmonary resuscitation pre ECMO | 113 (37.7%) | 39 (25.5%) | 74 (50.3%) | <0.001 |
| Mechanical ventilation pre-ECMO for >7 days | 136 (45.3%) | 78 (51.0%) | 58 (39.5%) | 0.045 |
| Mechanical ventilatory settings | ||||
| Inspiratory pressure in cmH2O | 24 (20–32) | 25 (20–33) | 23 (20–32) | 0.20 |
| Blood gas analysis | ||||
| pH | 7.27 (6.70–7.69) | 7.30 (6.80–7.69) | 7.23 (6.70 –7.57) | <0.001 |
| PaO2 in mmHg | 77 (63–108) | 76 (64–100) | 80 (62–112) | 0.30 |
| PaO2/FiO2 in mmHg | 105 (67–193) | 100 (67–190) | 113 (67–202) | 0.34 |
| Bicarbonate in mmoL/L | 19 (14.2–22.1) | 20.4 (16.0–23.2) | 18 (13.0–21.1) | <0.001 |
| Lactate in mmoL/L | 5.3 (2.3–10.5) | 4.4 (1.9–8.4) | 7.1 (3.0–11.5) | 0.001 |
| VA Total (n = 300) | VA Survivors (n = 153, 51%) | VA Non-Survivors (n = 147, 49%) | p-Value | |
|---|---|---|---|---|
| Prediction scores | ||||
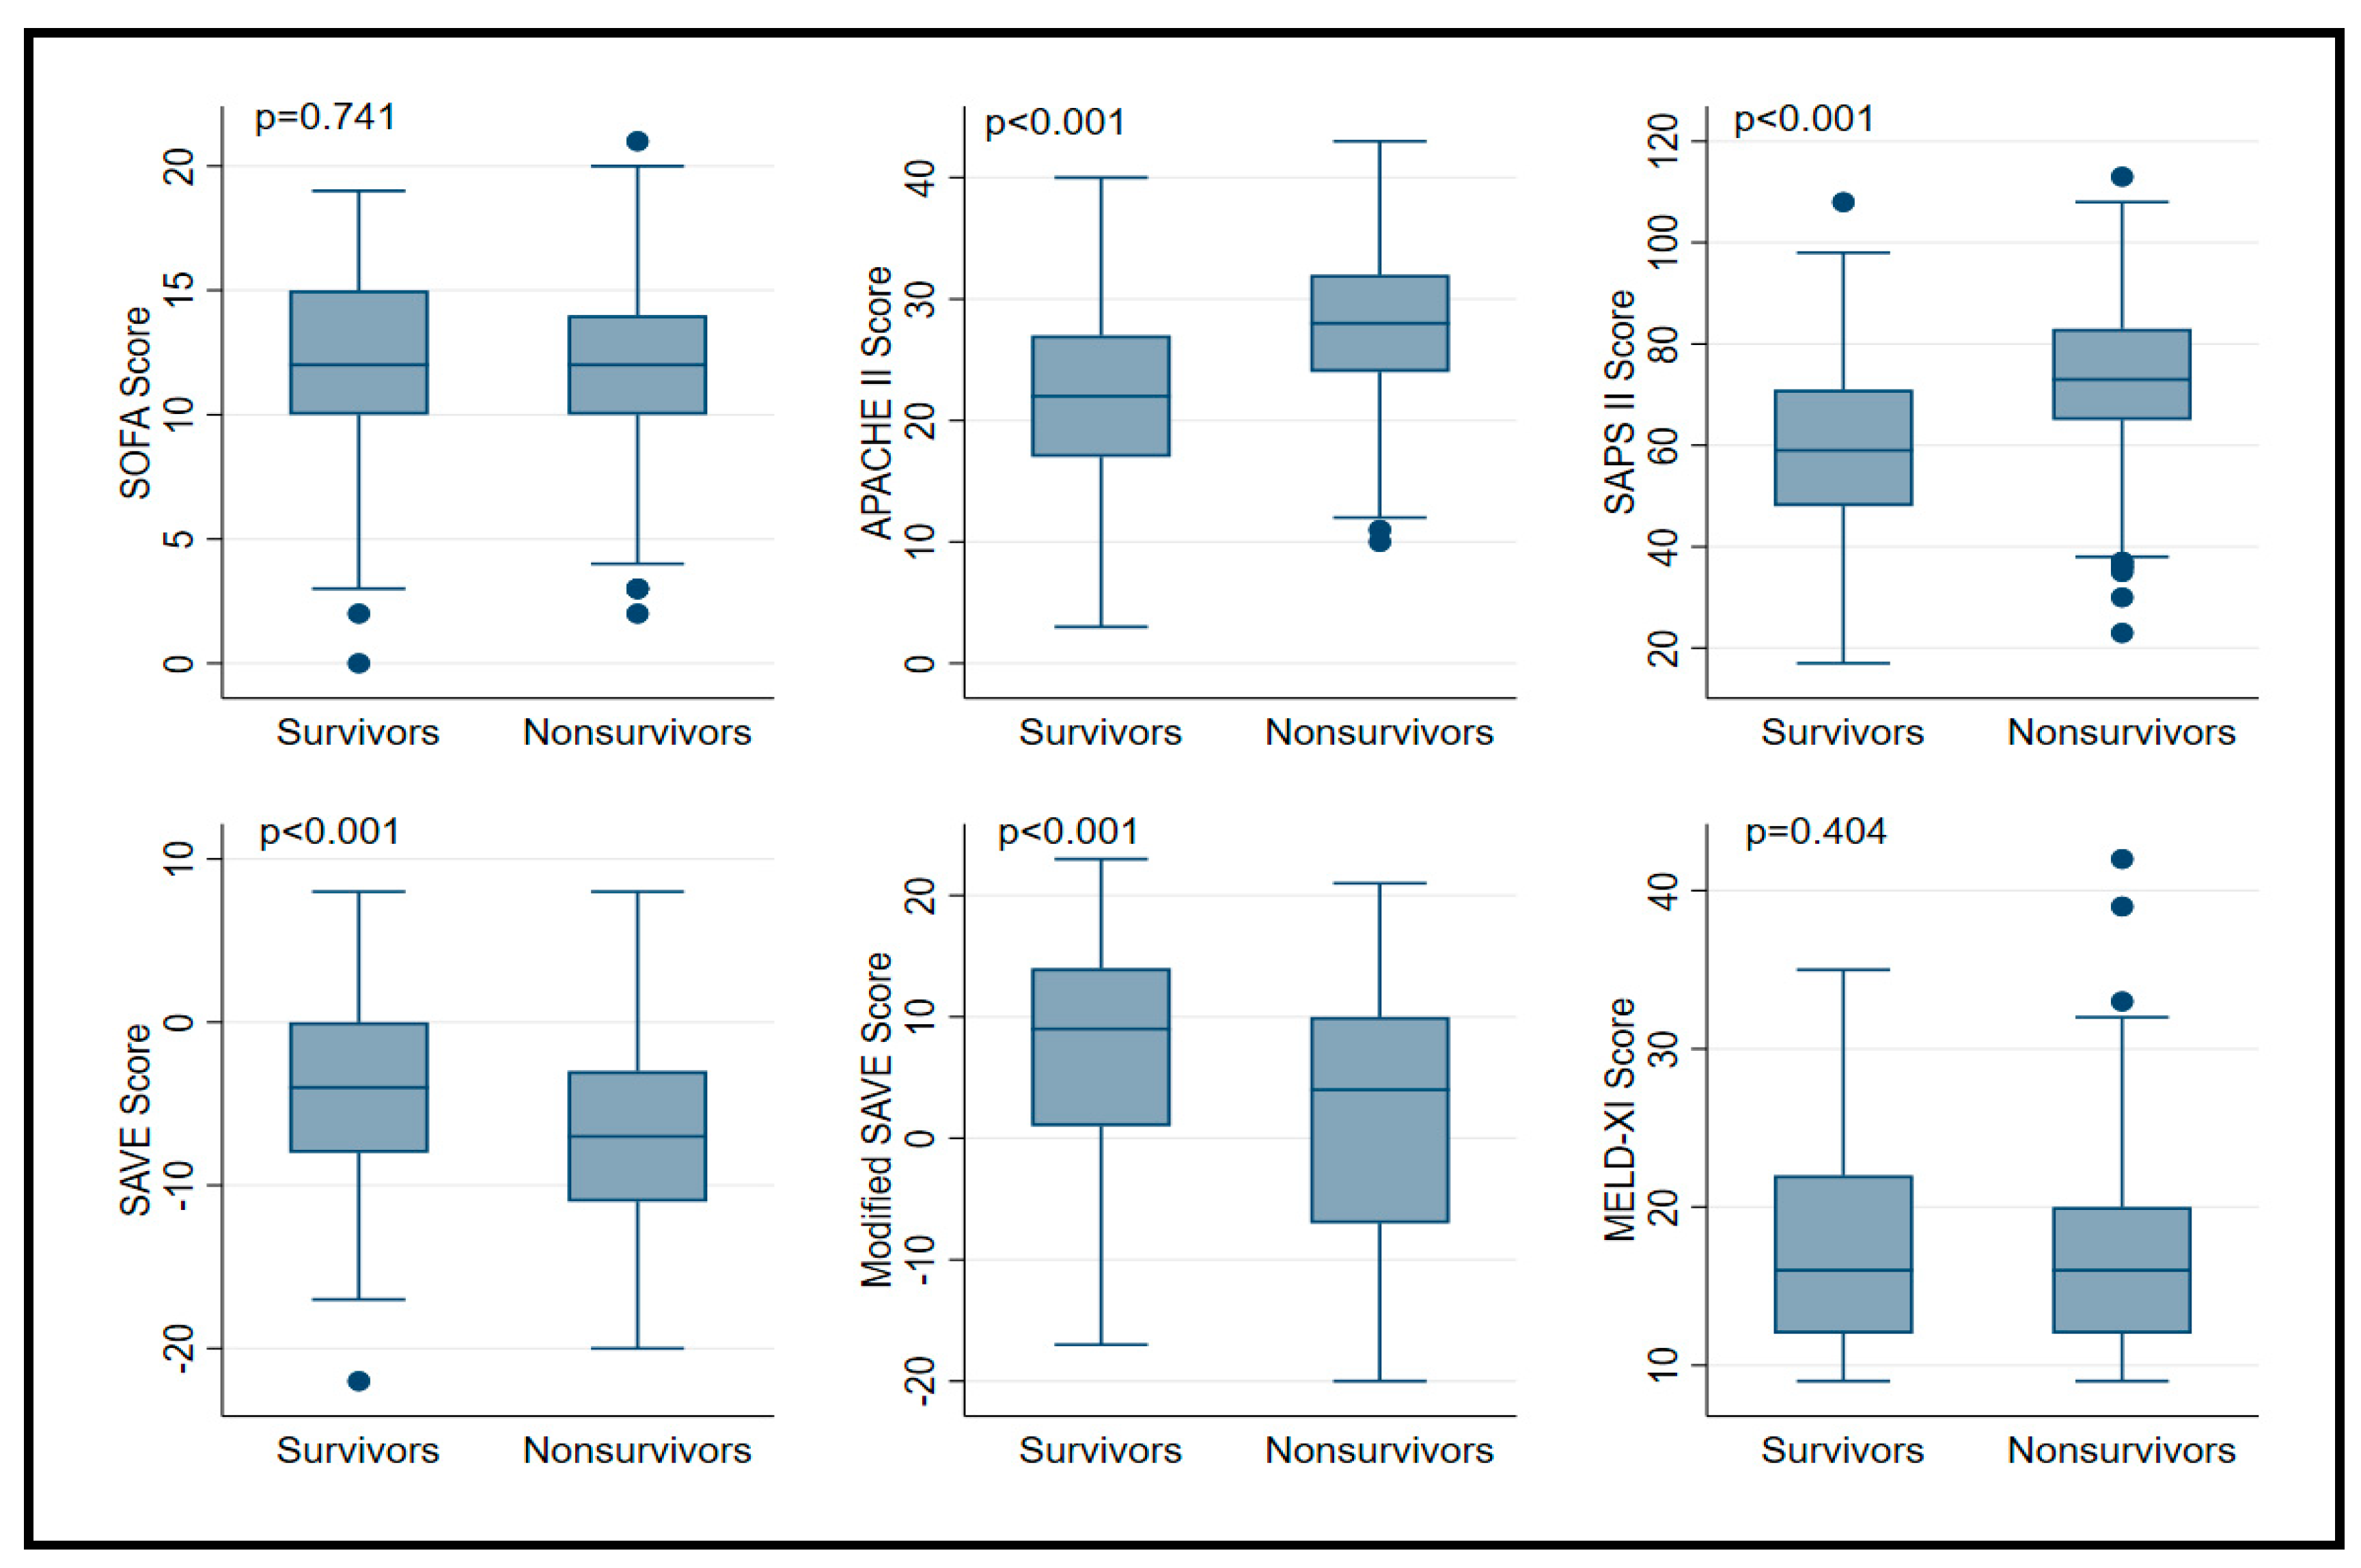
| SOFA a | 12 (10–14) | 12 (10–15) | 12 (10–14) | 0.74 |
| APACHE II b | 25 (19–30) | 22 (17–27) | 28 (24–32) | <0.001 |
| SAPS II b | 67 (55–78) | 59 (48–71) | 73 (65–83) | <0.001 |
| SAVE c | −6 (−9 to −2) | −4 (−8 to 0) | −7 (−11 to −3) | <0.001 |
| Modified SAVE c | 7.5 (−4–12) | 9 (1–14) | 4 (−7–10) | <0.001 |
| MELD-XI d | 16 (12–22) | 16 (12–22) | 16 (12–20) | 0.40 |
| VV Total (n = 329) | VV Survivors (n = 197) | VV Non-Survivors (n = 132) | p-Value | |
|---|---|---|---|---|
| Demographics, vital signs & laboratory chemistry | ||||
| Age in years | 53 (41–63) | 50 (39–62) | 56 (45–63) | 0.005 |
| Weight in kg | 80 (70–92) | 80 (70–98) | 80 (69–90) | 0.065 |
| Female sex | 108 (32.8%) | 64 (32.5%) | 44 (33.3%) | 0.87 |
| Heart rate/min | 105 (90–122.8) | 105 (90–122) | 110 (94–125) | 0.258 |
| Mean arterial pressure in mmHg | 71 (64–81) | 72 (63–84) | 68 (62–80) | 0.104 |
| Glasgow Coma Scale | 3 (3–12) | 3 (3–13) | 3 (3–11) | 0.074 |
| Acute renal failure | 112 (34.0%) | 59 (29.9%) | 53 (40.2%) | 0.056 |
| Creatinine in mg/dL | 1.15 (0.72–1.91) | 1.14 (0.74–1.96) | 1.23 (0.70–1.90) | 0.905 |
| Temperature in °C | 36.9 (36.2–37.5) | 37.0 (36.3–37.7) | 36.7 (36.0–37.3) | 0.013 |
| Leucocytes/nL | 12.8 (7.8–20.1) | 12.7 (7.2–20.0) | 13.1 (7.9–20.5) | 0.955 |
| Platelets × 103/µL | 156.5 (86.3–242.5) | 168.0 (109.5–247.5) | 138.0 (47.0–236.0) | 0.001 |
| Cardiopulmonary resuscitation pre ECMO | 30 (9.1%) | 12 (6.1%) | 18 (13.6%) | 0.02 |
| Mechanical ventilation pre-ECMO for >7 days | 89 (27.1%) | 46 (23.4%) | 43 (32.6%) | 0.065 |
| Mechanical ventilatory settings | ||||
| Inspiratory pressure in cmH2O | 35 (31–41) | 35 (31–40) | 35 (31–41) | 0.79 |
| PEEP in cmH2O | 12 (10–15) | 14 (10–16) | 12 (9–15) | 0.005 |
| Plateau pressure in cmH2O | 32 (29–36) | 32 (28–35) | 32 (30–36) | 0.55 |
| Prone positioning | 53 (16.2%) | 30 (15.2%) | 23 (17.7%) | 0.55 |
| Nitric oxide ventilation | 55 (16.7%) | 34 (17.3%) | 21 (15.9%) | 0.75 |
| Bicarbonate infusion pre ECMO | 46 (14.0%) | 26 (13.2%) | 20 (15.2%) | 0.62 |
| Neuromuscular blockage | 234 (71.1%) | 134 (68.0%) | 100 (75.8%) | 0.13 |
| Blood gas analysis | ||||
| pH | 7.32 (7.22–7.41) | 7.35 (7.23–7.42) | 7.31 (7.20–7.39) | 0.02 |
| PaO2 in mmHg | 62 (53–74) | 61 (53–74) | 63 (53–74) | 0.34 |
| PaO2/FiO2 in mmHg | 68 (55–98) | 66 (54–89) | 72 (56–107) | 0.13 |
| PaCO2 in mmHg | 54 (43–70) | 52 (42–68) | 58 (46–72) | 0.03 |
| Lactate in mmoL/L | 2.2 (1.4–4.0) | 2.0 (1.4–3.7) | 2.6 (1.6–4.5) | 0.01 |
| VV Total (n = 329) | VV Survivors (n = 197, 60%) | VV Non-Survivors (n = 132, 40%) | p-Value | |
|---|---|---|---|---|
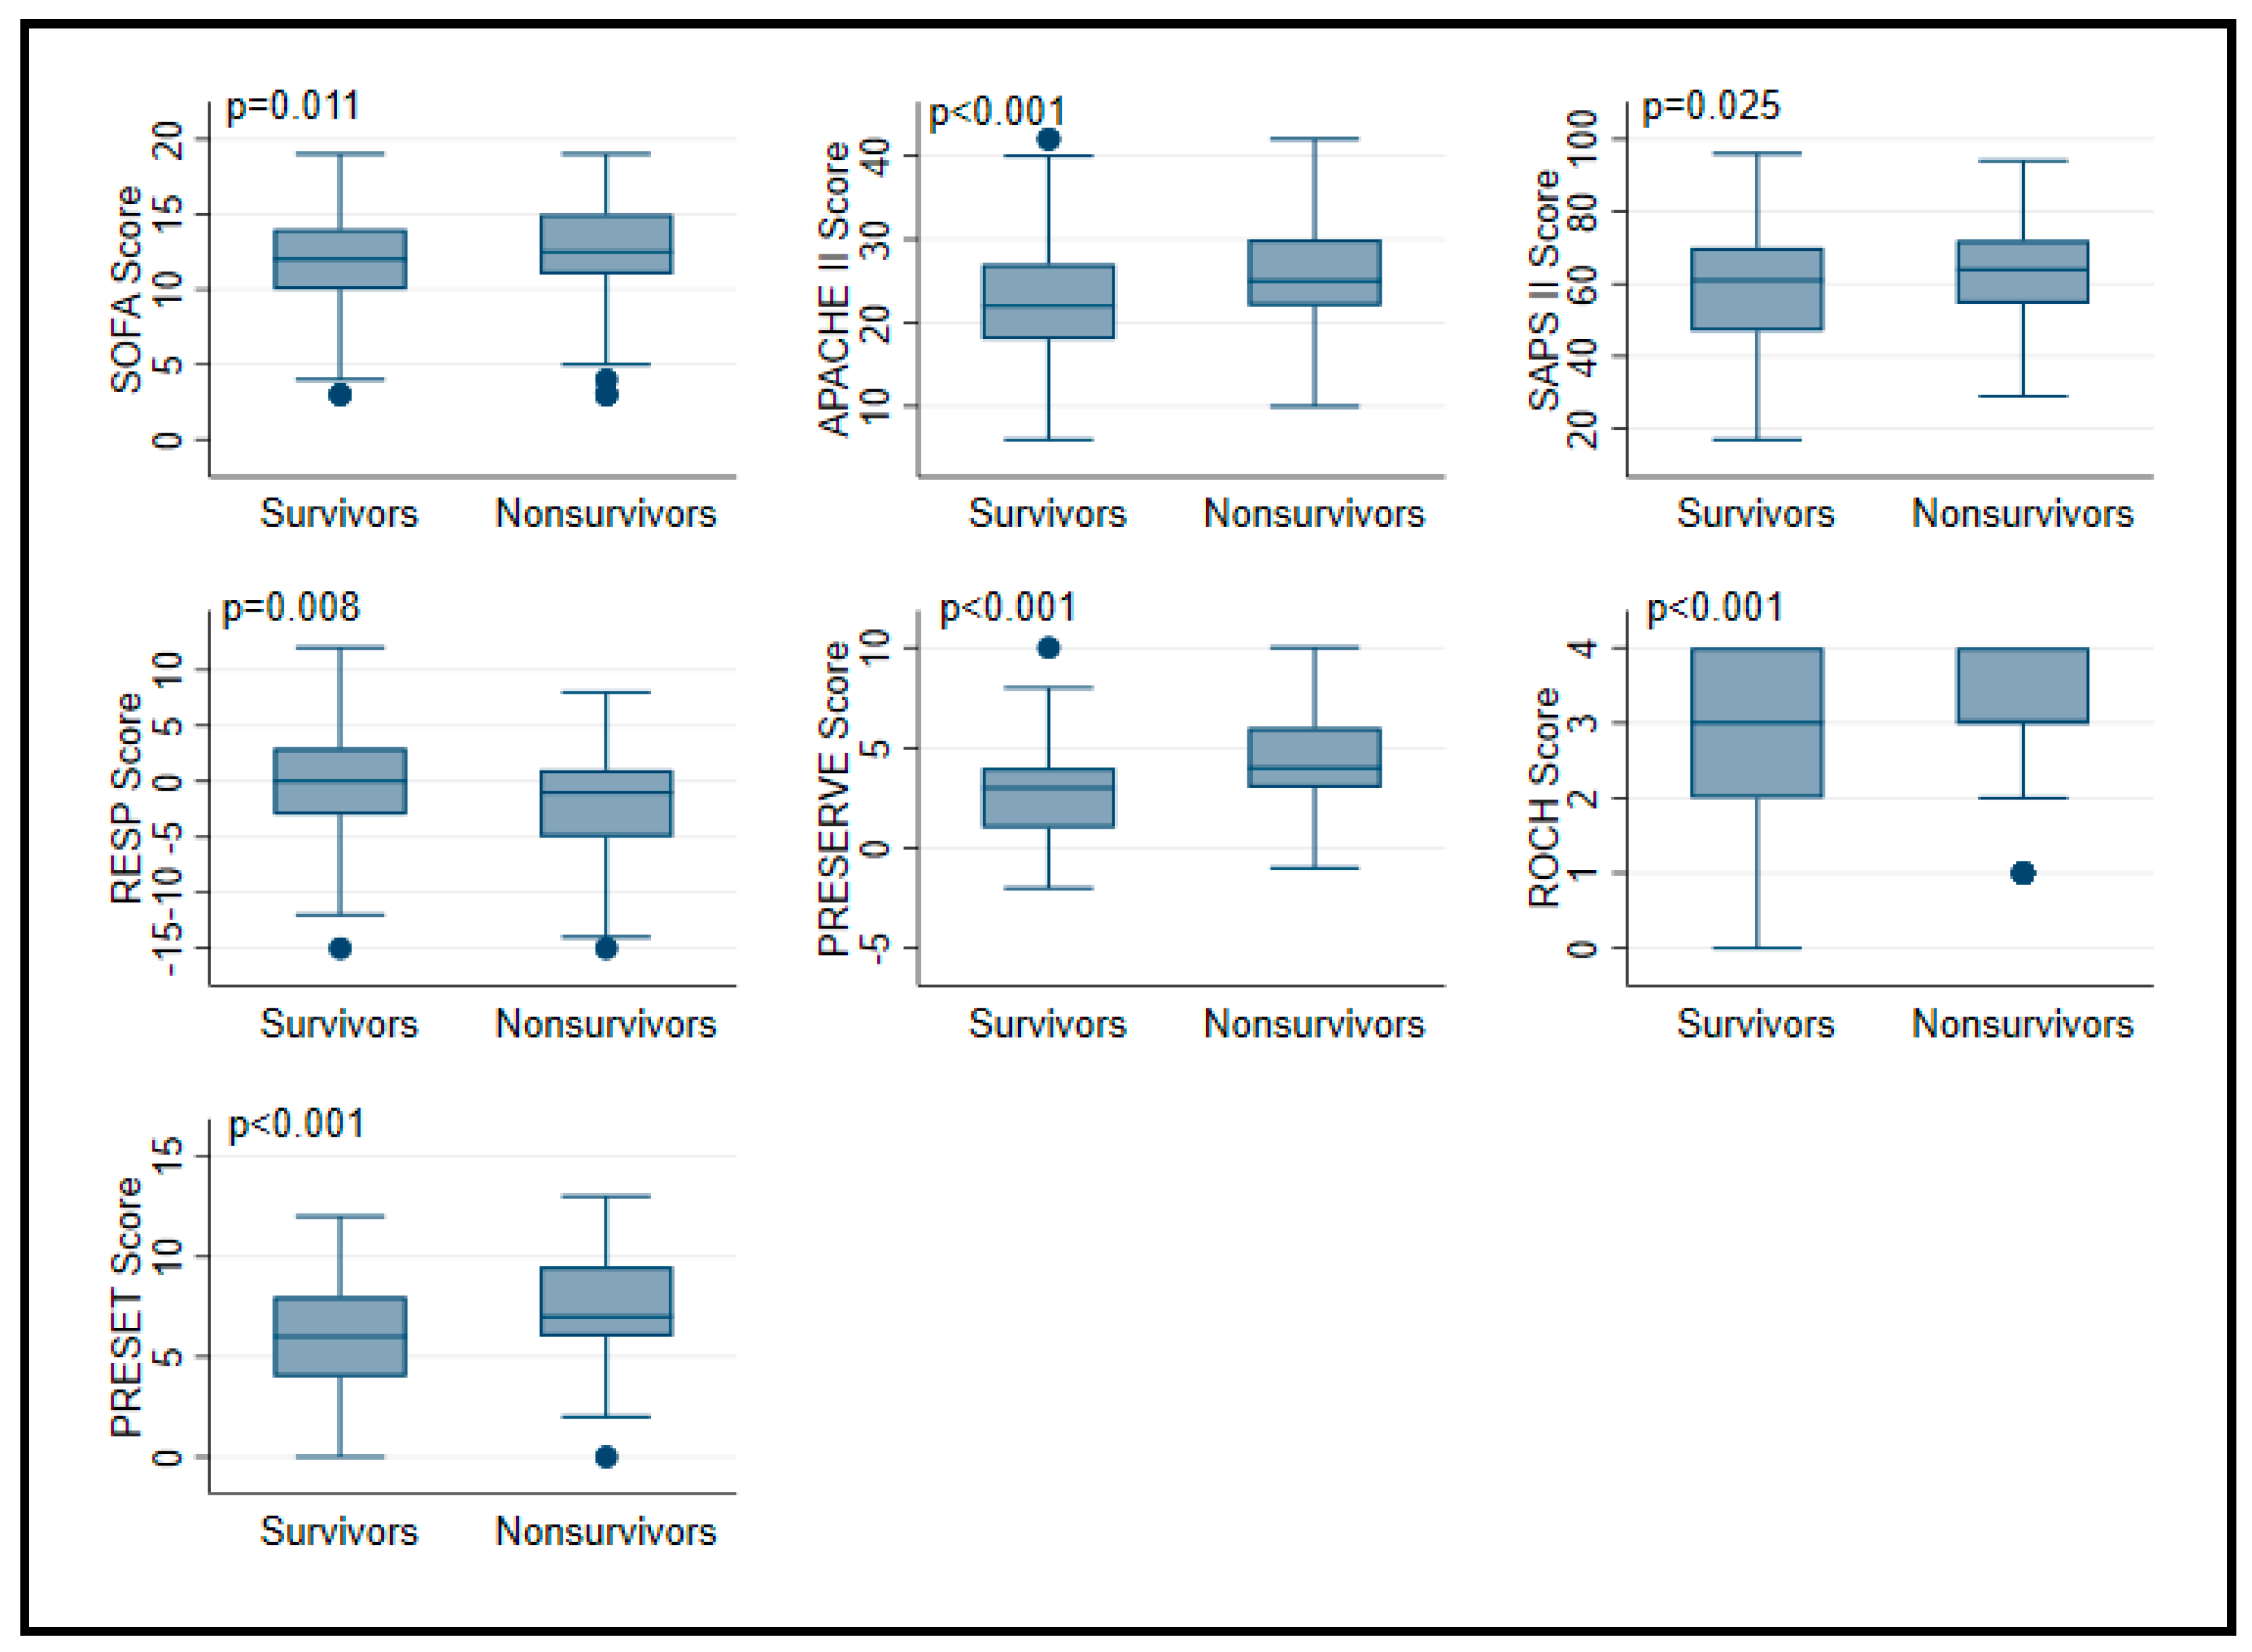
| SOFA a | 12 (10–14) | 12 (10–14) | 13 (11–15) | 0.011 |
| APACHE II b | 24 (19–28) | 22 (18–27) | 25 (22–30) | <0.001 |
| SAPS II b | 62 (51–71) | 61 (47–70) | 64 (55–72) | 0.025 |
| RESP c | 0 (−4–2) | 0 (−3–3) | −1 (−5–1) | 0.008 |
| PRESERVE d | 4 (2–5) | 3 (1–4) | 4 (3–6) | <0.001 |
| ROCH b | 3 (2–4) | 3 (2–4) | 3 (3–4) | <0.001 |
| PRESET a | 7 (5–9) | 6 (4–8) | 7 (6–10) | <0.001 |
Publisher’s Note: MDPI stays neutral with regard to jurisdictional claims in published maps and institutional affiliations. |
© 2021 by the authors. Licensee MDPI, Basel, Switzerland. This article is an open access article distributed under the terms and conditions of the Creative Commons Attribution (CC BY) license (http://creativecommons.org/licenses/by/4.0/).
Share and Cite
Fisser, C.; Rincon-Gutierrez, L.A.; Enger, T.B.; Taccone, F.S.; Broman, L.M.; Belliato, M.; Nobile, L.; Pappalardo, F.; Malfertheiner, M.V. Validation of Prognostic Scores in Extracorporeal Life Support: A Multi-Centric Retrospective Study. Membranes 2021, 11, 84. https://doi.org/10.3390/membranes11020084
Fisser C, Rincon-Gutierrez LA, Enger TB, Taccone FS, Broman LM, Belliato M, Nobile L, Pappalardo F, Malfertheiner MV. Validation of Prognostic Scores in Extracorporeal Life Support: A Multi-Centric Retrospective Study. Membranes. 2021; 11(2):84. https://doi.org/10.3390/membranes11020084
Chicago/Turabian StyleFisser, Christoph, Luis Alberto Rincon-Gutierrez, Tone Bull Enger, Fabio Silvio Taccone, Lars Mikael Broman, Mirko Belliato, Leda Nobile, Federico Pappalardo, and Maximilian V. Malfertheiner. 2021. "Validation of Prognostic Scores in Extracorporeal Life Support: A Multi-Centric Retrospective Study" Membranes 11, no. 2: 84. https://doi.org/10.3390/membranes11020084
APA StyleFisser, C., Rincon-Gutierrez, L. A., Enger, T. B., Taccone, F. S., Broman, L. M., Belliato, M., Nobile, L., Pappalardo, F., & Malfertheiner, M. V. (2021). Validation of Prognostic Scores in Extracorporeal Life Support: A Multi-Centric Retrospective Study. Membranes, 11(2), 84. https://doi.org/10.3390/membranes11020084