Abstract
CO2 enhanced oil recovery (CO2-EOR) technology is a competitive strategy to improve oil field economic returns and reduce greenhouse gas emissions. However, the arbitrary emissions or combustion of the associated gas, which mainly consists of CO2 and CH4, will cause the aggravation of the greenhouse effect and a huge waste of resources. In this paper, the high-performance facilitated transport multilayer composite membrane for CO2/CH4 separation was prepared by individually adjusting the membrane structure of each layer. The effect of test conditions on the CO2/CH4 separation performance was systematically investigated. The membrane exhibits high CO2 permeance of 3.451 × 10⁻⁷ mol·m−2·s−1·Pa−1 and CO2/CH4 selectivity of 62 at 298 K and 0.15 MPa feed gas pressure. The cost analysis was investigated by simulating the two-stage system. When the recovery rate and purity of CH4 are 98%, the minimum specific cost of separating CO2/CH4 (45/55 vol%) can be reduced to 0.046 $·Nm−3 CH4. The excellent short-to-mid-term stability indicates the great potential of large industrial application in the CH4 recovery and CO2 reinjection from oilfield associated gas.
1. Introduction
The energy and environmental crisis are the key issues for sustainable development in the world today. With the continuous progress of the economy and society, energy demand is increasing year by year. Compared with traditional fossil energy, the large-scale promotion of renewable energy such as wind energy, solar energy, and biomass energy is still facing greater difficulties. The contradiction between energy supply and demand has become more severe. Therefore, the production capacity of fossil energy needs to be expanded urgently [1].
Abundant low-permeability oil and gas resources are buried in petroliferous basins dominated by continental deposits [2]. According to incomplete statistics, Yanchang Oilfield is the second-largest low-permeability oilfield in China [3], with proven reserves of 1.12 × 10⁸ t and an oil-bearing area of 215.5 km2 [4]. However, most oil fields in this area are currently in the late stage of water-enhanced oil recovery. The high-water content and low pressure of the oil reservoirs lead to reduced oil production and poor production efficiency.
In recent years, CO2 enhanced oil recovery (CO2-EOR) technology has faced rapid development and has been widely used in many oil and gas fields in the world [5,6,7,8]. According to statistics, compared with other types of oil displacement technology, CO2-EOR could increase oil and gas recovery by 8–25% [9]. CO2 miscible flooding is a very effective way to improve oil recovery, which is achieved by injecting supercritical or liquid CO2 into the reservoir to reach the minimum miscibility pressure (MMP) and blended with crude oil [10]. Crude oil miscible with CO2 is greatly swelled, reducing its viscosity and interfacial tension, thereby improving the fluidity of crude oil [11]. In addition, the production pressure in the mining well can be also increased [12]. Therefore, the oil and gas recovery rate has been greatly improved. Besides, CO2-EOR technology is also an important way to realize carbon capture and storage (CCS) [13]. CO2-EOR technology can store CO2 gas geologically in oil and gas reservoirs for a long time, thus it can simultaneously realize the social benefits of CO2 storage and the economic benefits of CO2 flooding [5,14,15].
However, when CO2 is used to enhance oil recovery, a large amount of oilfield associated gas containing CO2 and light hydrocarbons (mainly CH4) will also be discharged [16]. The flow rate and CO2 content of the oilfield associated gas fluctuate greatly with time, which cannot be reinjected, stored, and utilized directly [17]. In the initial stage of CO2-EOR, the oilfield associated gas features a low flow rate, low concentration of CO2 (~5 vol%), and high concentration of CH4 (~75 vol%) [18]. While in the advanced stage of CO2-EOR, the CO2 content gradually increases, and finally stabilizes at 60~80 % [19]. Due to the high CO2 concentration, the oilfield associated gas cannot be directly burned. Direct emptying will cause a large amount of greenhouse gas emissions and a waste of resources, while reinjecting associated gas directly to enhance oil recovery does not meet the basic requirement that the minimum miscibility pressure must be lower than the reservoir pressure. In addition, the oilfield associated gas also exhibits obvious features of low pressure and considerable flux fluctuations. Thus, the traditional separation methods always require a lot of energy to increase the associated gas pressure, which is less economical. Therefore, it is necessary to develop a CO2 separation technology with low operating cost, high separation flexibility, and suitable for separating low-pressure mixed gas to realize the on-site separation of oilfield associated gas.
In this paper, a high-performance composite membrane for CO2 separation of oilfield associated gas was prepared by optimizing membrane structure layer by layer. The influence of feed gas humidity, temperature, composition, and pressure on membrane separation performance were further investigated to explore the optimal operating conditions of composite membranes. In addition, a secondary membrane separation process utilizing this membrane was simulated to obtain the lowest operating cost and ideal operating conditions.
2. Materials and Methods
2.1. Materials
Polydimethylsiloxane (PDMS) prepolymer was supplied from Shin-Etsu Chemical Co., Ltd. (Tokyo, Japan). Ethyl orthosilicate (TEOS, 99 %), dibutyltin dilaurate (DBD, 99 %), sodium polyacrylate (PAAS, Mw = 15 kDa), Poly (vinyl alcohol) 1799 (PVA 1799) and sodium dodecyl sulfate (SDS, AR) were purchased from Aladdin Reagent Co., Ltd. (Shanghai, China). N-heptane (98.5 %) was bought from Tianjin Bohua Chemical Reagents Co., Ltd. (Tianjin, China). Polyvinylamine (PVAm) was synthesized through radical polymerization according to our previous work [20]. Deionized water with a conductivity of less than 5 μS·cm−1 was prepared by reverse osmosis system. The polysulfone (PSf) ultrafiltration membrane with a molecular weight cut-off at 45 kDa was obtained from Jozzon Membrane Technology Co., Ltd. (Dongying, Shandong, China).
2.2. Methods
2.2.1. Preparation of Multilayer Composite Membranes
According to the previous work [21], the cross-linked PDMS was prepared by the cross-linking reaction of hydroxyl-terminated PDMS with TEOS under the catalysis of DBD at 308 K and saturated humidity. The gutter layer was prepared by the wet-dry combined coating method. That is, the cross-linked PDMS was coated with the wet coating thickness of 300 μm on the PSf ultrafiltration membrane that possesses no obvious water on the surface but abundant water in the internal pore channels, so that the PDMS solution could not infiltrate into the pore of PSf ultrafiltration membrane, avoiding the excessive drop in gas permeance.
The main component of the solution utilized for coating the selective layer is PVAm, while the remaining ingredients include 20 mol% PVA, 1 mol% PAAS, and 10 mol% SDS, which was shortened to PPPS in this paper. The additives in the PPPS solution were mainly used to enhance the CO2 separation ability and interlayer compatibility [22]. The PPPS/PDMS/PSf composite membranes were manufactured by coating PPPS solution directly on the dried PDMS gutter layer with a wet coating thickness of 150 μm. The wet membranes were placed and dried in a constant environment with the temperature and humidity of 303 K and 40 %RH respectively for subsequent tests.
2.2.2. Characterization
The cross-section topographies of the PDMS/PSf and PPPS/PDMS/PSf composite membranes were screened by scanning electron microscopy (SEM, Nova NanoSEM 430, FEI, Hillsboro, OR, USA). The functional groups of the membranes were evaluated by Fourier Transform Infrared (FTIR) spectroscopy (FTS-6000, Bio-Rad, Hercules, CA, USA). The CO2/CH4 mixed gas separation performance was estimated by the laboratory-made gas permeance analysis platform. As shown in Figure 1, the prepared CO2/CH4 mixed gases with different CO2 concentrations served as the feed gas flow into membrane cell at a set pressure. The CO2-rich penetrate gas driven by He was analyzed in the gas chromatograph (7890B, Agilent, Palo Alto, CA, USA) with a certain flow rate. The ratio of humidified gas (saturated) and dry gas in the feed gas can be controlled by adjusting the precision needle valve, thereby controlling the relative humidity of the feed gas. All error bars represented the standard errors of the performance of three membranes prepared under the same conditions.
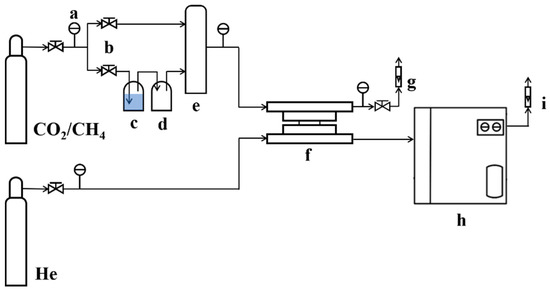
Figure 1.
Schematic diagram of the laboratory-made gas permeance analysis platform. The letters in Figure 1 represent: (a) high-precision pressure gauge; (b) high-precision needle valve; (c) humidification tank; (d) dehumidification tank; (e) buffer tank; (f) membrane cell; (g) mass flowmeter; (h) gas chromatography; (i) soap film gas meter.
2.2.3. Performance Assessment
The CO2/CH4 separation performance of the composite membranes was evaluated by two main parameters, permeance, and selectivity. Permeance indicates how fast the gas passes through the membrane, which can be calculated by the following formula:
where, Qi is defined as the flow rate of gas composition (CO2 or CH4) penetrating through the membrane at the steady-state, the unit of which used in this paper is mol·s−1·Pa−1; ∆pi stands for the partial pressure difference of the gas composition between the retentate and the permeate side of the membrane; A is the effective separation area of the membrane. Under ideal circumstances, the CO2/CH4 selectivity of the membrane is approximately equal to:
3. Results
3.1. Preparation of High-Performance CO2 Separation Composite Membrane
3.1.1. PDMS Gutter Layer
PDMS is the most widely used gutter layer material, the thickness of which is directly related to the gas permeability of the composite membrane [23,24]. The concentration of PDMS solution determines the thickness of the gutter layer. Therefore, in this section, the adjustment of the gutter layer thickness was achieved by fixing the wet coating thickness (300 μm) and changing the concentration of the cross-linked PDMS solution. To select the optimal PDMS concentration, the CO2/CH4 mixed gas (45/55 vol%) separation performance was examined at 298 K, saturated humidity and 0.15 MPa feed gas pressure after coating 0.15 wt% PPPS solution with a wet coating thickness of 150 μm on the prepared PDMS/PSf composite membranes.
The infrared spectrum of PDMS/PSf and PPPS/PDMS/PSf composite membranes were implemented to characterize the functional groups of both membranes. As presented in Figure 2, the absorption peaks at 690 cm−1 and 1100 cm−1 are the characteristic bands of Si-C and Si-O respectively, indicating the successful coating of PDMS on PSf substrate. However, due to the thin PPPS separation layer, the infrared spectrum of the PPPS/PDMS/PSf composite membrane contains all the absorption bands of PDMS. The absorption bands around 3300 cm−1–3000 cm−1 and 1670 cm−1 confirm the presence of –OH and –NH2, which proves the PPPS/PDMS/PSf composite membranes were successfully prepared.
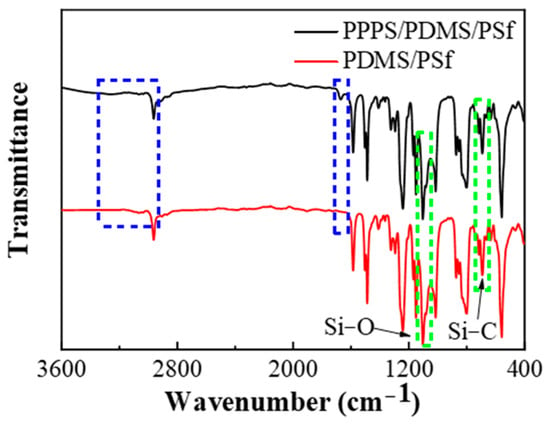
Figure 2.
The infrared spectrums of Polydimethylsiloxane (PDMS)/ polysulfone (PSf) and PPPS/PDMS/PSf composite membranes.
Figure 3 shows the cross-section topographies of the PPPS/PDMS/PSf composite membranes prepared based on the gutter layers with the PDMS concentration of 0.5–2.5 wt%. The continuous interfaces are clearly presented between the gutter layers and PSf substrate, indicating that the wet-dry combined coating method can effectively inhibit the pore penetration of PDMS in the polysulfone. The thickness of the composite membranes prepared by different PDMS concentrations were investigated further. As shown in Figure 3, with the increase of PDMS concentration, the thickness of PPPS/PDMS/PSf composite membranes increased from 161 nm to 364 nm.
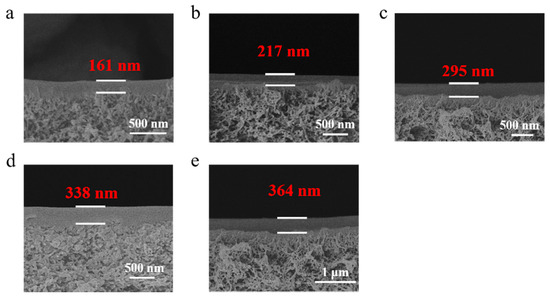
Figure 3.
The cross-section topographies of the PPPS/PDMS/PSf composite membranes with different PDMS concentrations. The letters a~e respectively represent the concentration of PDMS used in membranes: 0.5 wt% (a), 1.0 wt% (b), 1.5 wt% (c), 2.0 wt% (d), and 2.5 wt% (e). The wet coating thickness is 300 μm.
The CO2/CH4 (45/55 vol%) mixed gas separation performance of PPPS/PDMS/PSf composite membranes prepared from different PDMS concentrations is shown in Figure 4. The separation performance of the composite membranes increases first and then decreases with the increasing PDMS concentration. When the PDMS concentration reaches 1.5 wt%, the composite membrane possesses the best performance. The reasons are as follows. When the PDMS concentration is too low (≤1.0 wt%), the PDMS cannot completely cover the surface of the PSf substrate, which causes the PPPS solution to partially penetrating into the pores of the PSf substrate. According to the resistance model of the composite membrane, the total resistance of the composite membrane increases linearly with the increasing thickness of the polymer penetration area [25]. The incomplete membrane structure results in the fluctuating CO2 permeance and low CO2/CH4 selectivity. However, when the PDMS concentration increases to more than 2 wt%, the increasing thickness of the gutter layer increases the gas resistance, which reduces the gas permeance. Besides, the strong hydrophobicity of the prepared PDMS/PSf membranes affects the malleability of the PPPS solution, leading to the unevenness of the separation layer, and eventually increases the CH4 permeance. Thus, the CO2/CH4 selectivity was reduced.
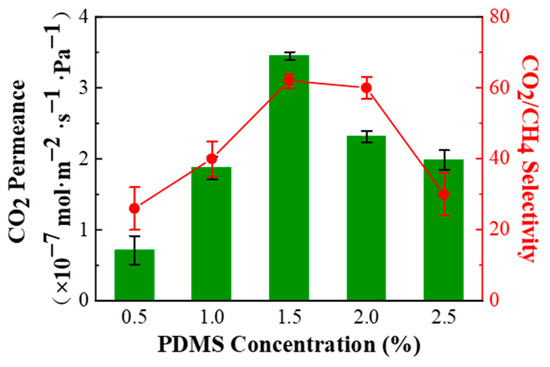
Figure 4.
Effect of different PDMS concentrations on the CO2/CH4 (45/55 vol%) mixed gas separation performance of PPPS/PDMS/PSf composite membrane. Test conditions: 298 K, saturated humidity, and 0.15 MPa.
3.1.2. PPPS Separation Layer
With hydrophilic PVAm as the main ingredient, the PPPS solution achieves excellent compatibility between the hydrophilic separation layer and the hydrophobic PDMS surface by the synergistic effect of the surfactant and thickener [22]. Based on the optimal PDMS concentration determined in Section 3.1.1, the effect of the PPPS concentration on the CO2/CH4 separation performance of the PPPS/PDMS/PSf composite membrane was further explored fixing the wet coating thickness (150 μm) and changing the concentration of the PPPS solution.
The cross-section topographies of the PPPS/PDMS/PSf composite membranes with the PPPS concentration between 0.05 wt% and 0.20 wt% were investigated by SEM. As shown in Figure 5, the thickness of the PPPS/PDMS/PSf composite membranes increases from 250 nm to 333 nm with the increasing PPPS concentration, which indicates that the separation layer is complete and thin.
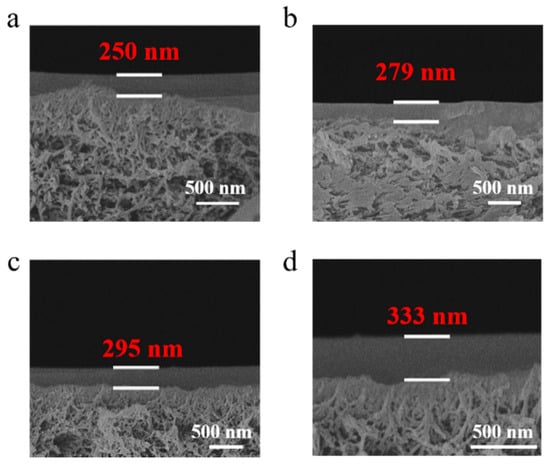
Figure 5.
The cross-section topographies of the PPPS/PDMS/PSf composite membranes with different PPPS concentrations. The letters a~d respectively represent the concentration of PPPS used in membranes: 0.05 wt% (a), 0.10 wt% (b), 0.15 wt% (c), and 0.20 wt% (d). The wet coating thickness is 150 μm.
Figure 6 depicts the CO2/CH4 (45/55 vol%) mixed gas separation performance of PPPS/PDMS/PSf composite membranes prepared from different PPPS concentrations. As the PPPS concentration increases, the CO2 permeance gradually decreases, while the CO2/CH4 selectivity gradually increases. When the PPPS concentration is at 0.15 wt%, the PPPS/PDMS/PSf membrane exhibits the best separation performance that the CO2 permeance of 3.451 × 10⁻⁷ mol·m−2·s−1·Pa−1 and CO2/CH4 selectivity of 62. This is mainly due to the following reasons. When the PPPS concentration is less than 0.10 wt%), due to the low viscosity, the PPPS solution can hardly form an intact separation layer, resulting in the formation of defects without gas selectivity. While the increasing PPPS solution (>0.15 wt%) thickens the separation layer, which increases the gas resistance through the membrane.
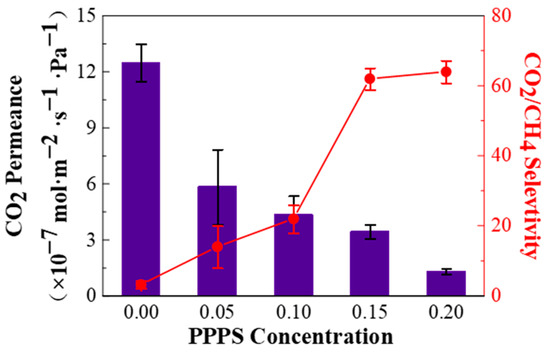
Figure 6.
Effect of different PPPS concentrations on the CO2/CH4 (45/55 vol%) mixed gas separation performance of PPPS/PDMS/PSf composite membrane. Test conditions: 298 K, saturated humidity, and 0.15 MPa.
3.2. Effect of Feed Gas Conditions on Separation Performance
3.2.1. Relative Humidity of the Feed Gas
The effect of the relative humidity of the feed gas on CO2/CH4 (45/55 vol%) separation performance of the PPPS/PDMS/PSf composite membrane was explored under 298 K and 0.15 MPa feed pressure. The relative humidity of the feed gas was adjusted by controlling the opening of the two high-precision needle valves.
As shown in Figure 7, with the increasing relative humidity of the feed gas, the CO2 permeance and CO2/CH4 selectivity of the PPPS/PDMS/PSf composite membrane also increase. This is due to the following two aspects. Firstly, PVAm with abundant primary amine groups, which is the dominance in the separation layer, can react specifically and reversibly with CO2 and promote the transfer of CO2 across the membrane. The mechanism of primary amine groups promoting CO2 transfer can be expressed as the following formula [26]:
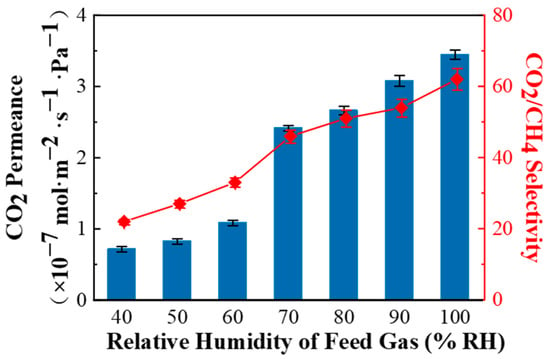
Figure 7.
Effect of relative humidity of feed gas on the CO2/CH4 (45/55 vol%) mixed gas separation performance of PPPS/PDMS/PSf composite membrane. Test conditions: 298 K and 0.15 MPa.
Due to a large number of active hydrogens, the primary amine groups can slowly react with CO2 without water. However, water can not only be used as reactants to participate in the CO2 facilitated transport, but also promote the ionization of primary amine groups and CO2, thereby accelerate the reversible reaction. Therefore, with the increasing relative humidity of feed gas, the positive effect of water on the reversible reaction improves, leading to an increase in CO2 permeance.
Secondly, water also promotes the CO2 adsorption on the membrane surface, while the adsorption capacity of CH4 on the membrane surface is reduced due to the competitive adsorption. Since CH4 penetrates through the solution-diffusion mechanism in the composite membrane, the permeation rate of CH4 will also decrease with the increase of relative humidity. Thirdly, as the relative humidity increases, PPPS with strong hydrophilic groups (amine and hydroxyl groups) adsorb and solve a lot of water, resulting in swelling and increase of the free volume of the composite membrane, and thus accelerate the permeance of CO2 and CH4 in the PPPS/PDMS/PSf composite membrane. Under the combined effect of the above, with the increasing relative humidity of the feed gas, CO2 permeance greatly increases while CH4 permeance slowly increases, which ultimately leads to an increase in the CO2/CH4 selectivity. Therefore, the PPPS/PDMS/PSf composite membranes are more suitable for use under high humidity conditions.
3.2.2. Temperature of the Feed Gas
The effect of the feed gas temperature on CO2/CH4 (45/55 vol%) separation performance of the PPPS/PDMS/PSf composite membrane was explored under saturated humidity and 0.15 MPa feed pressure. As shown in Figure 8, with the increasing feed gas temperature, the CO2 permeance of PPPS/PDMS/mPSf composite membrane gradually increases, and the CO2/CH4 selectivity reduces rapidly, which can be attributed to the following reasons.
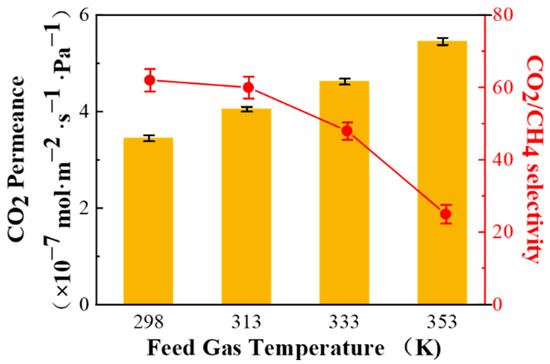
Figure 8.
Effect of the feed gas temperature on the CO2/CH4 (45/55 vol%) mixed gas separation performance of PPPS/PDMS/PSf composite membrane. Test conditions: saturated humidity and 0.15 MPa.
Firstly, the saturated vapor pressure increased with the feed gas temperature, which causes the increase of moisture content in the feed gas. As mentioned in Section 3.2.1, the increase of the water content in the feed gas strengthens the swelling degree and free volume of the composite membrane, resulting in an increase in the gas permeance. In addition, the increase of water content in the composite membrane also enhances the CO2 facilitated transport. Secondly, as the feed gas temperature increases, due to the exothermically reversible reaction between CO2 and primary amine groups, the reaction rate increases but the forward reaction equilibrium constant decreases, which is not conducive to the CO2 facilitated transport. Thirdly, the solution and diffusion process of CH4 adheres to Arrhenius’ law [27,28], thus the CH4 permeance increases significantly with the increasing feed gas temperature.
In summary, with the increscent feed gas temperature, the CO2 and CH4 permeance in the PPPS/PDMS/mPSf composite membrane are both confronted with an upward trend. However, due to the multiple factors analyzed above, the CO2 permeance could increases more slowly, which ultimately leads to a decline in the CO2/CH4 selectivity. Thus, the ideal operating temperature of the PPPS/PDMS/PSf composite membrane is at 298 K.
3.2.3. CO2 Concentration of the Feed Gas
As the CO2 concentration of the oilfield associated gas changes greatly during the entire life of the oilfield, thus, it is especially significant to make a comprehensive study of the effect of the feed gas CO2 concentration on the CO2/CH4 separation performance of the PPPS/PDMS/PSf composite membranes. As presented in Figure 9, with the increasing CO2 concentration, the CO2 permeance keeps dropping, while the CO2/CH4 selectivity constantly grows. The main reasons are as follows.
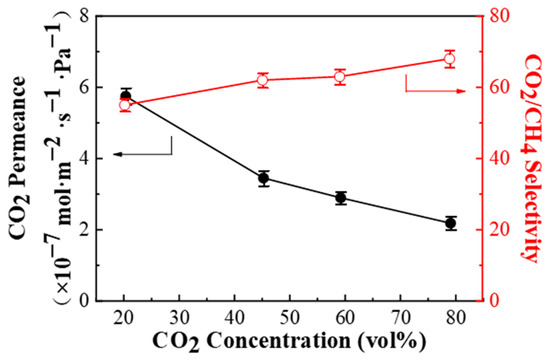
Figure 9.
Effect of the feed gas CO2 concentration on the CO2/CH4 mixed gas separation performance of PPPS/PDMS/PSf composite membrane. Test conditions: 298 K, saturated humidity, and 0.15 MPa.
According to the formula obtained by Zhang et al. [29], the CO2 permeance of the facilitated transport membranes can be defined by Formula (5).
where RA is the CO2 permeance, pA,0 is the CO2 partial pressure of the feed gas, DA and DAX are the diffusion coefficients of CO2 and CO2-carrier complexes respectively, l is the thickness of the membrane, HA is the Henry coefficient of CO2, K is the equilibrium constant of the reversible reaction between CO2 and the carrier, CT is the total concentration of the carrier. Therefore, the growing CO2 partial pressure in the feed gas leading to the contribution of facilitated transport to the total CO2 permeance decline. As for CH4, on the one hand, the solubility coefficient and diffusion coefficient of CH4 in the membrane decrease with the falling CH4 partial pressure [30]. On the other hand, due to the competitive adsorption, the amount of CH4 adsorbed on the membrane surface tends to downward with the increase of the CO2 partial pressure. To sum up, as the CO2 partial pressure in the feed gas increases, the CO2 permeance of the PPPS/PDMS/PSf facilitated transport membrane keeps decreasing, while the CH4 permeance drops faster, leading to the CO2/CH4 selectivity showing an upward trend.
3.2.4. Pressure of the Feed Gas
To further examine the effect of feed gas pressure on CO2/CH4 (45/55 vol%) separation performance, the PPPS/PDMS/PSf composite membrane was tested at a feed pressure of 0.15~1.8 MPa. As shown in Figure 10, the CO2 permeance and CO2/CH4 selectivity decrease rapidly with increasing feed gas pressure, which is mainly due to the following reasons. First of all, PVAm is a typical material mainly utilized in facilitated transport membrane, thus the PPPS/PDMS/PSf composite membrane displays the representative characteristics of facilitated transport, that is, CO2 permeance decreases with increasing CO2 partial pressure [29,31]. In addition, CH4 penetrates through the composite membrane by solution-diffusion mechanism, causing the CH4 permeance to be almost unchanged. Therefore, the CO2/CH4 selectivity decreases as the feed gas pressure increases.
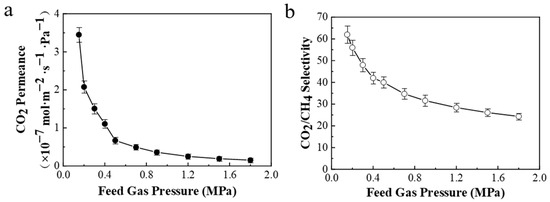
Figure 10.
Effect of the feed gas pressure on the CO2/CH4 mixed gas separation performance of PPPS/PDMS/PSf composite membrane. (a), the pressure-dependent CO2 permeance of the PPPS/PDMS/PSf membrane. (b), the correspond-ing CO2/CH4 selectivity of the PPPS/PDMS/PSf membrane varying with feed pressure. Test conditions: 298 K and saturated humidity.
3.3. Separation Process Simulation under Actual Working Conditions
3.3.1. System and Simulation Condition Setting
To investigate the industrial potential of the PPPS/PDMS/PSf composite membranes, a two-stage membrane process was designed for the CO2 separation and CH4 recovery from the oilfield associated gas, which is the most economical separation process in the case of high product purity and recovery [32,33,34]. In this simulation, the CH4 purity (98 vol%) and CH4 recovery rate (98%) were chosen as the separation requirements [35,36]. The feed pressure of the two-stage membrane process was optimized when the gas composition of raw gas was 45 vol% CO2 and 55 vol% CH4.
The two-stage membrane separation process is shown in Figure 11. The flow rate of raw gas is set as 1000 Nm3·h−1, and the pressure is 0.15 MPa (absolute pressure, the same below). After being compressed by the compressor, the raw gas encountered with the recycle gas was separated by the 1st-stage membrane. The retentate gas (CH4 concentration at 98 vol%) from the 1st-stage was stored for further purification, while the permeate gas was recompressed and divided by the 2nd-stage membrane into the recycle gas and the penetrate gas rich in CO2. The feed pressures of the 1st- and 2nd-stages are in the range of 0.3~1.5 MPa, and the pressures on the permeate side are set as 0.1 MPa.
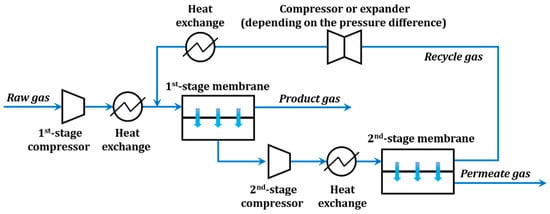
Figure 11.
Schematic diagram of a two-stage membrane process.
The gas separation process was described by the cross-flow model [37,38] and computed by MATLAB software, according to previous work [39,40]. Detailed information on the mathematical model is provided in S2 (Supplementary Information).
3.3.2. Simulation of the Total Membrane Area and Specific Electricity Consumption
The total membrane area required to complete the set conditions was simulated by adjusting the feed pressure of the 1st-stage membrane and the 2nd-stage membrane separately. As shown in Figure 12a, with the increase of the 1st-stage feed pressure, the total membrane area decreases significantly, while the 2nd-stage feeding pressure has little influence on the total membrane area. The reason is that the gas processing capacity of the 1st-stage membrane process is much higher than that of the 2nd-stage. With the increasing feed gas in the 1st-stage, the gas flux per membrane area also increases significantly, thus the membrane area decreases dramatically.
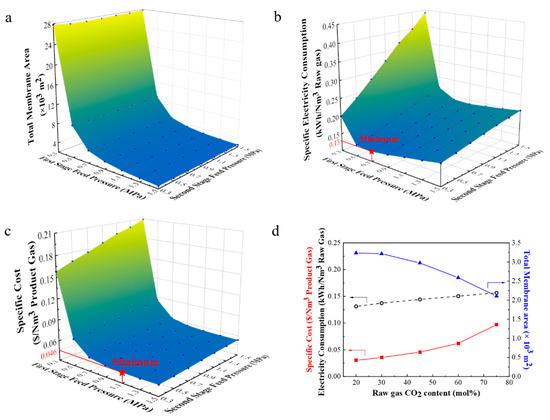
Figure 12.
Simulation results of a two-stage membrane separation process using PPPS/PDMS/PSf composite membranes. Impact of the 1st- and 2nd-stage feed pressures on the total membrane area (a), the specific electricity consumption (b), and the specific cost (c). (d) Impact of CO2 concentration on the specific cost, the specific electricity consumption, and the total membrane area, when the 1st- and 2nd-stage feed pressures are 1.1 and 0.3 MPa respectively.
However, although the increase in the feed pressure can reduce the membrane area, the energy consumption to compress the gas is relatively increased. As shown in Figure 12b, when the 1st-stage feed pressure is fixed, with the increasing 2nd-stage feed pressure, the specific electricity consumption of the compressor increases. When fixing the 2nd-stage feed pressure, the increasing 1st-stage feed pressure leads to the specific electricity consumption first decreasing and then increasing. Therefore, when the 1st- and 2nd-stage feed pressures are 0.7 MPa and 0.3 MPa respectively, the minimum specific electricity consumption can be reduced to 0.13 kWh/Nm3 raw gas.
3.3.3. Simulation of the Effect of CO2 Concentration on Specific Cost
The specific cost of the two-stage process using PPPS/PDMS/PSf composite membranes was calculated mainly referring to the method mentioned in the previous papers [39,41]. The system operation time was set as 8000 h per year. The membrane module cost was considered as 50 $·m−2 [36], the referenced fixed investment cost was selected as 394,000$ per 2000 m2 membranes [42] and the electricity cost was consulted as 0.1 $·kWh−1 [32,43]. In brief, the total annual cost is the sum of the investment cost, the cost for annual operating and maintenance, and energy cost. Detailed information on the economic evaluation is provided in S3 (Supplementary Information).
As presented in Figure 12c, when the raw gas was fixed as 45 vol% CO2 and 55 vol% CH4, the minimum specific cost can be reduced to 0.046 $·Nm−3 CH4 with the 1st- and 2nd-stage pressures of 1.1 MPa and 0.3 MPa, respectively. Compared with the 2nd-stage feed pressure, the 1st-stage feed pressure exerts a greater influence on the specific cost, for the 1st-stage feed pressure affects the total membrane area more obviously.
However, CO2 concentration varies greatly in the life of oilfield associated gas. Based on the above pressures, the specific cost was further simulated by changing the CO2 concentration. As shown in Figure 12d, with the increase of CO2 concentration in the raw gas, the required membrane area gradually decreases. Simultaneously, the product flow rate (98 vol% CH4) declines, but the flow rate of the gas that needs to be compressed increasingly augment. Thus, when CO2 concentration is at 20 vol%, the specific cost is 0.030 $·Nm−3 CH4, while when CO2 concentration reaches up to 75 vol%, the specific cost gradually rises to 0.097 $·Nm−3 CH4.
3.4. Short-to-Mid-Term Stability of PPPS/PDMS/PSf Composite Membrane
The PPPS/PDMS/PSf composite was continuously tested at 298 K, saturated humidity, and 0.15 MPa of the feed gas pressure for 70 h to verify the short-to-mid-term CO2/CH4 separation performance. As shown in Figure 13, the short-to-mid-term stability test was divided into three stages. The feed gas in the first 30 h consisted of 45 vol% CO2 and 55 vol% CH4 (stage A). At the 30th hour, the feed gas was replaced with the mixed gas containing 79 vol% CO2 and 21 vol% CH4 (stage B). Then at the 50th hour, it was restored to the mixed gas same with stage A (stage C). In the three stages of A, B, and C, the PPPS/PDMS/PSf composite membrane maintained stable CO2/CH4 separation performance, indicating that the composite membrane exhibited excellent short-to-mid-term stability.
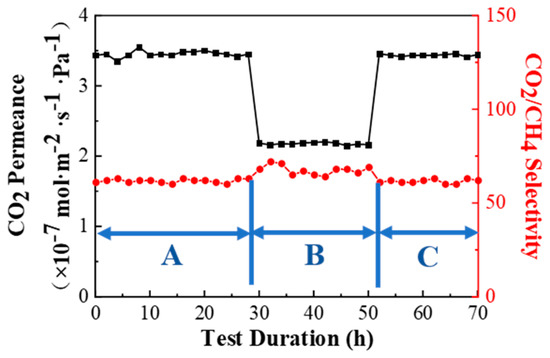
Figure 13.
Short-to-mid-term stability of PPPS/PDMS/PSf composite membrane. Test conditions: 298 K, saturated humidity, and 0.15 MPa.
3.5. Performance Comparison of PPPS/PDMS/PSf Membrane with the Commercial and Reported Membranes
Table 1 exhibited some commercial and reported membranes for CO2/CH4 separation. Compared with other membranes, the PPPS/PDMS/PSf membrane displays acceptable CO2 permeance and excellent CO2/CH4 selectivity, which has great potential for large-scale application in CO2 reuse and CH4 recovery in oilfield associated gas.

Table 1.
Performance comparison with other commercial and reported membranes.
4. Conclusions
Compared with traditional separation methods such as cryogenic rectification and adsorption, the membrane separation process features operation flexibility, ease of scale-up, no phase change, and no need for regeneration. The membrane separation system is feasible to be designed as an integrated skid-mounted structure, which is convenient for transportation and movement in the remote wilderness. Therefore, membrane separation possesses obvious advantages in CO2 reuse and CH4 recovery in oilfield associated gas.
In this paper, the PPPS/PDMS/PSf composite membrane with proper thickness and defect-free composite layers was successfully prepared by 1.5 wt% PDMS and 0.15 wt% PPPS, which exhibited high CO2 permeance of 3.451 × 10⁻⁷ mol·m−2·s−1·Pa−1 and CO2/CH4 selectivity of 62 at 298 K, saturated humidity and 0.15 MPa. The two-stage membrane separation process using PPPS/PDMS/PSf composite membranes was simulated by adjusting the feed gas CO2 concentration and pressure. When the 1st- and 2nd-stage pressures are 1.1 MPa and 0.3 MPa respectively, the minimum specific cost of the two-stage membrane separation process using the PPPS/PDMS/PSf composite membranes to separate CO2/CH4 (45/55 vol%) mixed gas can be controlled within 0.046 $·Nm−3 CH4. In addition, the PPPS/PDMS/PSf composite membrane shown outstanding short-to-mid-term stability, indicating the potential of industrial application in CO2 reuse and CH4 recovery in oilfield associated gas.
Supplementary Materials
The following are available online at https://www.mdpi.com/2077-0375/11/2/118/s1.
Author Contributions
Conceptualization, C.Z. and M.S.; methodology, M.S.; software, Q.L.; validation, Z.W.; formal analysis, C.Z. and Y.H.; investigation, M.S.; resources, C.Z.; data curation, Y.Y. and Y.H.; writing—original draft preparation, Y.Y. and Q.L.; writing—review and editing, C.Z. and M.S.; visualization, Y.Y. and Y.K.; supervision, Z.W. and X.Z.; project administration, Y.K., X.S. and T.W.; funding acquisition, X.Z. and Z.W. All authors have read and agreed to the published version of the manuscript.
Funding
This research was supported by the National Key R&D Program of China (No. 2017YFB0603400), and the National Natural Science Foundation of China (No. 21938007, No. 21436009).
Institutional Review Board Statement
Not applicable.
Informed Consent Statement
Not applicable.
Data Availability Statement
The data presented in this study are available in the article and the supplementary material.
Conflicts of Interest
The authors declare no conflict of interest.
References
- Azzolina, N.A.; Peck, W.D.; Hamling, J.A.; Gorecki, C.D.; Ayash, S.C.; Doll, T.E.; Nakles, D.V.; Melzer, L.S. How green is my oil? A detailed look at greenhouse gas accounting for CO2-enhanced oil recovery (CO2-EOR) sites. Int. J. Greenh. Gas Control 2016, 51, 369–379. [Google Scholar] [CrossRef]
- Ren, B.; Zhang, L.; Huang, H.; Ren, S.; Chen, G.; Zhang, H. Performance evaluation and mechanisms study of near-miscible CO2 flooding in a tight oil reservoir of Jilin Oilfield China. J. Nat. Gas Sci. Eng. 2015, 27, 1796–1805. [Google Scholar] [CrossRef]
- Wang, X.; Zeng, F.; Gao, R.; Zhao, X.; Hao, S.; Liang, Q.; Jiang, S. Cleaner coal and greener oil production: An integrated CCUS approach in Yanchang Petroleum Group. Int. J. Greenh. Gas Control 2017, 62, 13–22. [Google Scholar] [CrossRef]
- He, L.; Shen, P.; Liao, X.; Li, F.; Gao, Q.; Wang, Z. Potential evaluation of CO2 EOR and sequestration in Yanchang oilfield. J. Energy Inst. 2016, 89, 215–221. [Google Scholar] [CrossRef]
- Wang, H.; Ma, J.; Li, L.; Jia, L.; Tan, M.; Cui, S.; Zhang, Y.; Qu, Z. Time-lapse Seismic Analysis for Gao89 Area of CO2-EOR Project in SINOPEC Shengli Oilfield, China. Energy Procedia 2017, 114, 3980–3988. [Google Scholar] [CrossRef]
- Lv, G.; Li, Q.; Wang, S.; Li, X. Key techniques of reservoir engineering and injection–production process for CO2 flooding in China’s SINOPEC Shengli Oilfield. J. CO2 Util. 2015, 11, 31–40. [Google Scholar] [CrossRef]
- Qin, J.; Han, H.; Liu, X. Application and enlightenment of carbon dioxide flooding in the United States of America. Pet. Explor. Dev. 2015, 42, 232–240. [Google Scholar] [CrossRef]
- Alvarado, V.; Manrique, E. Enhanced Oil Recovery: An Update Review. Energies 2010, 3, 1529–1575. [Google Scholar] [CrossRef]
- Cao, M.; Gu, Y. Temperature effects on the phase behaviour, mutual interactions and oil recovery of a light crude oil–CO2 system. Fluid Phase Equilibria 2013, 356, 78–89. [Google Scholar] [CrossRef]
- Cao, M.; Gu, Y. Oil recovery mechanisms and asphaltene precipitation phenomenon in immiscible and miscible CO2 flooding processes. Fuel 2013, 109, 157–166. [Google Scholar] [CrossRef]
- Zhang, N.; Yin, M.; Wei, M.; Bai, B. Identification of CO2 sequestration opportunities: CO2 miscible flooding guidelines. Fuel 2019, 241, 459–467. [Google Scholar] [CrossRef]
- Du, F.; Nojabaei, B. A Review of Gas Injection in Shale Reservoirs: Enhanced Oil/Gas Recovery Approaches and Greenhouse Gas Control. Energies 2019, 12, 2355. [Google Scholar] [CrossRef]
- Mac Dowell, N.; Fennell, P.S.; Shah, N.; Maitland, G.C. The role of CO2 capture and utilization in mitigating climate change. Nat. Clim. Chang. 2017, 7, 243–249. [Google Scholar] [CrossRef]
- Jia, B.; Tsau, J.-S.; Barati, R. A review of the current progress of CO2 injection EOR and carbon storage in shale oil reservoirs. Fuel 2019, 236, 404–427. [Google Scholar] [CrossRef]
- Alcalde, J.; Flude, S.; Wilkinson, M.; Johnson, G.; Edlmann, K.; Bond, C.E.; Scott, V.; Gilfillan, S.M.V.; Ogaya, X.; Haszeldine, R.S. Estimating geological CO2 storage security to deliver on climate mitigation. Nat. Commun. 2018, 9, 2201. [Google Scholar] [CrossRef] [PubMed]
- Liu, B.; Zhang, M.; Wang, T.; Jia, W. Process simulation of CO2 capture from CO2-EOR associated petroleum gas with aqueous MEA and MDEA solvents. Energy Sci. Eng. 2019, 7, 663–675. [Google Scholar] [CrossRef]
- Okazaki, J.; Hasegawa, H.; Chikamatsu, N.; Yajima, K.; Shimizu, K.; Niino, M. DDR-type zeolite membrane: A novel CO2 separation technology for enhanced oil recovery. Sep. Purif. Technol. 2019, 218, 200–205. [Google Scholar] [CrossRef]
- Liu, B.; Yang, X.; Wang, T.; Zhang, M.; Chiang, P.-C. CO2 Separation by Using a Three-stage Membrane Process. Aerosol Air Qual. Res. 2019, 19, 2917–2928. [Google Scholar] [CrossRef]
- Liu, B.; Yang, X.; Chiang, P.-C.; Wang, T. Energy Consumption Analysis of Cryogenic-membrane Hybrid Process for CO2 Capture from CO2-EOR Extraction Gas. Aerosol Air Qual. Res. 2020, 20, 820–832. [Google Scholar] [CrossRef]
- Yuan, S.; Wang, Z.; Qiao, Z.; Wang, M.; Wang, J.; Wang, S. Improvement of CO2/N2 separation characteristics of polyvinylamine by modifying with ethylenediamine. J. Membr. Sci. 2011, 378, 425–437. [Google Scholar] [CrossRef]
- Dong, S.; Wang, Z.; Sheng, M.; Qiao, Z.; Wang, J. Scaling up of defect-free flat membrane with ultra-high gas permeance used for intermediate layer of multi-layer composite membrane and oxygen enrichment. Sep. Purif. Technol. 2020, 239, 116580. [Google Scholar] [CrossRef]
- Dong, S.; Wang, Z.; Sheng, M.; Qiao, Z.; Wang, J. High-performance multi-layer composite membrane with enhanced interlayer compatibility and surface crosslinking for CO2 separation. J. Membr. Sci. 2020, 610, 118221. [Google Scholar] [CrossRef]
- Yave, W.; Car, A.; Wind, J.; Peinemann, K.-V. Nanometric thin film membranes manufactured on square meter scale: Ultra-thin films for CO2capture. Nanotechnology 2010, 21, 395301. [Google Scholar] [CrossRef] [PubMed]
- Chen, H.Z.; Thong, Z.; Li, P.; Chung, T.-S. High performance composite hollow fiber membranes for CO2/H2 and CO2/N2 separation. Int. J. Hydrog. Energy 2014, 39, 5043–5053. [Google Scholar] [CrossRef]
- Henis, J.M.S.; Tripodi, M.K. Composite hollow fiber membranes for gas separation: The resistance model approach. J. Membr. Sci. 1981, 8, 233–246. [Google Scholar] [CrossRef]
- Xu, R.; Wang, Z.; Wang, M.; Qiao, Z.; Wang, J. High nanoparticles loadings mixed matrix membranes via chemical bridging-crosslinking for CO2 separation. J. Membr. Sci. 2019, 573, 455–464. [Google Scholar] [CrossRef]
- Lin, H.Q.; Freeman, B.D.; Kalakkunnath, S.; Kalika, D.S. Effect of copolymer composition, temperature, and carbon dioxide fugacity on pure- and mixed-gas permeability in poly(ethylene glycol)-based materials: Free volume interpretation. J. Membr. Sci. 2007, 291, 131–139. [Google Scholar] [CrossRef]
- Car, A.; Stropnik, C.; Yave, W.; Peinemann, K.-V. Pebax®/polyethylene glycol blend thin film composite membranes for CO2 separation: Performance with mixed gases. Sep. Purif. Technol. 2008, 62, 110–117. [Google Scholar] [CrossRef]
- Zhang, C.; Wang, Z.; Cai, Y.; Yi, C.; Yang, D.; Yuan, S. Investigation of gas permeation behavior in facilitated transport membranes: Relationship between gas permeance and partial pressure. Chem. Eng. J. 2013, 225, 744–751. [Google Scholar] [CrossRef]
- Kagramanov, G.G.; Gurkin, V.N.; Farnosova, E.N. Effect of Gas Solubility on Efficiency of Membrane Processes with Separation of He/CH4 and CO2/CH4 Mixtures as an Example. Membr. Membr. Technol. 2020, 2, 244–250. [Google Scholar] [CrossRef]
- Li, S.; Wang, Z.; Yu, X.; Wang, J.; Wang, S. High-performance membranes with multi-permselectivity for CO2 separation. Adv. Mater. 2012, 24, 3196–3200. [Google Scholar] [CrossRef]
- Scholz, M.; Alders, M.; Lohaus, T.; Wessling, M. Structural optimization of membrane-based biogas upgrading processes. J. Membr. Sci. 2015, 474, 1–10. [Google Scholar] [CrossRef]
- Zhao, L.; Riensche, E.; Blum, L.; Stolten, D. Multi-stage gas separation membrane processes used in post-combustion capture: Energetic and economic analyses. J. Membr. Sci. 2010, 359, 160–172. [Google Scholar] [CrossRef]
- Gabrielli, P.; Gazzani, M.; Mazzotti, M. On the optimal design of membrane-based gas separation processes. J. Membr. Sci. 2017, 526, 118–130. [Google Scholar] [CrossRef]
- Baker, R.W.; Lokhandwala, K. Natural Gas Processing with Membranes: An Overview. Ind. Eng. Chem. Res. 2008, 47, 2109–2121. [Google Scholar] [CrossRef]
- He, X.; Chu, Y.; Lindbråthen, A.; Hillestad, M.; Hägg, M.-B. Carbon molecular sieve membranes for biogas upgrading: Techno-economic feasibility analysis. J. Clean. Prod. 2018, 194, 584–593. [Google Scholar] [CrossRef]
- Weller, S.; Steiner, W. Separation of Gases by Fractional Permeation Through Membranes. J. Appl. Phys. 1950, 21, 279–283. [Google Scholar] [CrossRef]
- Shindo, Y.; Hakuta, T.; Yoshitome, H.; Inoue, H. Calculation Methods for Multicomponent Gas Separation by Permeation. Sep. Sci. Technol. 1985, 20, 445–459. [Google Scholar] [CrossRef]
- Xu, J.; Wang, Z.; Qiao, Z.; Wu, H.; Dong, S.; Zhao, S.; Wang, J. Post-combustion CO2 capture with membrane process: Practical membrane performance and appropriate pressure. J. Membr. Sci. 2019, 581, 195–213. [Google Scholar] [CrossRef]
- Yuan, Y.; Qiao, Z.; Xu, J.; Wang, J.; Zhao, S.; Cao, X.; Wang, Z.; Guiver, M.D. Mixed matrix membranes for CO2 separations by incorporating microporous polymer framework fillers with amine-rich nanochannels. J. Membr. Sci. 2021, 620, 118923. [Google Scholar] [CrossRef]
- Arias, A.M.; Mussati, M.C.; Mores, P.L.; Scenna, N.J.; Caballero, J.A.; Mussati, S.F. Optimization of multi-stage membrane systems for CO 2 capture from flue gas. Int. J. Greenh. Gas Control 2016, 53, 371–390. [Google Scholar] [CrossRef]
- Qiao, Z.; Wang, Z.; Zhang, C.; Yuan, S.; Zhu, Y.; Wang, J.; Wang, S. PVAm-PIP/PS Composite Membrane with High Performance for CO2/N2Separation. Aiche J. 2013, 59, 215–228. [Google Scholar] [CrossRef]
- Bounaceur, R.; Berger, E.; Pfister, M.; Ramirez Santos, A.A.; Favre, E. Rigorous variable permeability modelling and process simulation for the design of polymeric membrane gas separation units: MEMSIC simulation tool. J. Membr. Sci. 2017, 523, 77–91. [Google Scholar] [CrossRef]
- Brinkmann, T.; Lillepärg, J.; Notzke, H.; Pohlmann, J.; Shishatskiy, S.; Wind, J.; Wolff, T. Development of CO2 Selective Poly(Ethylene Oxide)-Based Membranes: From Laboratory to Pilot Plant Scale. Engineering 2017, 3, 485–493. [Google Scholar] [CrossRef]
- Esposito, E.; Clarizia, G.; Bernardo, P.; Jansen, J.C.; Sedláková, Z.; Izák, P.; Curcio, S.; Cindio, B.d.; Tasselli, F. Pebax®/PAN hollow fiber membranes for CO2/CH4 separation. Chem. Eng. Process. Process Intensif. 2015, 94, 53–61. [Google Scholar] [CrossRef]
- Kim, S.; Han, S.H.; Lee, Y.M. Thermally rearranged (TR) polybenzoxazole hollow fiber membranes for CO2 capture. J. Membr. Sci. 2012, 403–404, 169–178. [Google Scholar] [CrossRef]
- Kim, S.; Hou, J.; Wang, Y.; Ou, R.; Simon, G.P.; Seong, J.G.; Lee, Y.M.; Wang, H. Highly permeable thermally rearranged polymer composite membranes with a graphene oxide scaffold for gas separation. J. Mater. Chem. A 2018, 6, 7668–7674. [Google Scholar] [CrossRef]
- Aliyev, E.M.; Khan, M.M.; Nabiyev, A.M.; Alosmanov, R.M.; Bunyad-zadeh, I.A.; Shishatskiy, S.; Filiz, V. Covalently Modified Graphene Oxide and Polymer of Intrinsic Microporosity (PIM-1) in Mixed Matrix Thin-Film Composite Membranes. Nanoscale Res. Lett. 2018, 13, 359. [Google Scholar] [CrossRef]
- Sun, J.; Li, Q.; Chen, G.; Duan, J.; Liu, G.; Jin, W. MOF-801 incorporated PEBA mixed-matrix composite membranes for CO2 capture. Sep. Purif. Technol. 2019, 217, 229–239. [Google Scholar] [CrossRef]
Publisher’s Note: MDPI stays neutral with regard to jurisdictional claims in published maps and institutional affiliations. |
© 2021 by the authors. Licensee MDPI, Basel, Switzerland. This article is an open access article distributed under the terms and conditions of the Creative Commons Attribution (CC BY) license (http://creativecommons.org/licenses/by/4.0/).