Abstract
Membrane technology has gained much ground in water and wastewater treatment over the past couple of decades. This is timely, as the world explores smart, eco-friendly, and cheap water and wastewater treatment technologies in its quest to make potable water and sanitation commonplace in all parts of the world. Against this background, this study investigated forward osmosis (FO) in the removal of salts (chlorides, sulphates, and carbonates) and organics (chemical oxygen demand (COD), turbidity, total suspended solids (TSS), and color) from a synthetic municipal wastewater (MWW), mimicking secondary-treated industrial wastewater, at very low feed and draw solution flow rates (0.16 and 0.14 L/min respectively), using 70 g/L NaCl solution as the draw solution. The results obtained showed an average of 97.67% rejection of SO42− and CO32− while Cl− was found to enrich the feed solution (FS). An average removal of 88.92% was achieved for the organics. A permeation flux of 5.06 L/m2.h was obtained. The kinetics of the ions transport was studied, and was found to fit the second-order kinetic model, with Pearson’s R-values of 0.998 and 0.974 for Cl− and CO32− respectively. The study proves FO as a potential technology to desalinate saline MWW.
1. Introduction
Municipalities transport and treat large volumes of wastewater daily. It is reported that about 380 billion cubic meters of wastewater is produced annually worldwide [1]. In South Africa alone, approximately 7589 mega liters of wastewater is transported throughout the municipal sewers everyday [2]. These figures indicate the pressure placed on treatment facilities to ensure proper treatment and disposal of wastewater. Over the years, improvement in wastewater treatment in general became imperative because of environmental effects of wastewater discharge, the need for alternative source of water through wastewater treatment for reuse and the long-term effects of some specific constituents (like n-nitrosodimethylamine (NDMA), pesticides and phenolic compounds) of the wastewater causing neuroendocrine and mutagenic effects on aquatic life [3,4].
Characteristically, municipal wastewater (MWW) consists of a variety of contaminants. Because of its intrinsic nature of having different sources, municipal wastewater is highly complex and an efficient ready-to-go treatment method is still a challenge to arrive at. Specifically, inconsistent salt concentrations in MWW are reported from sources such as tanneries, textile industries, food processing, petroleum processing, and the chloroalkali chemical industries among other sources, which are destinations to at least 30 million tons of salt (NaCl) annually [5,6,7].
Many treatment methods have been utilized at different stages of MWW treatment for discharge and reuse. These include, but not limited to, conventional filtration processes, coagulation-flocculation, sedimentation, and biological treatment methods [8]. Advanced treatment methods include membrane processes and advanced oxidation processes. For the best part, most MWW treatment facilities employ sand and membrane filtration, chlorination and UV disinfection with the aim of removing turbidity, pathogens, and nutrients [3]. These processes, however, do not remove dissolved salts from the wastewater streams and these end up in the environment causing devastating effects on the aquatic system, agricultural lands, surface and ground water, and downstream water treatment facilities [9,10].
In a study conducted by Khong, et al. [11], it was observed that salinization of the Mekong River Delta due to different naturogenic and anthropic activities caused significant reduction in agricultural production and farm income in Vietnam leading to about 30% reduction in crop yield. In the same vein, exposure of agricultural lands to saline waters has been associated with long-term soil sodification, ground water salinization, and ion toxicity in plants, affecting the entire plant physiology and consequently leading to ill plant health [12,13]. Again, the ripple effects of salinization of ground water, due to a series of activities including inefficient wastewater treatment and discharge, on children were studied and found to have serious cognitive impairment consequences on them [14]. In the aquatic community, increasing salinity of fresh water bodies due to both natural and human activities has been identified as altering the growth and biochemical constituents of micro algae, amphibians, and other freshwater adapted species and this has dire consequences on the food chain within the aquatic ecosystem [15,16].
Desalination processes span from seawater and brackish water, to wastewater. The desalination process used is mainly dependent on the salinity of the feed being treated. In most cases, thermal desalination techniques like multistage flash (MSF) evaporation, and membrane processes like reverse osmosis (RO), nano filtration (NF) and electrodialysis are employed for reclamation of water through desalination [17]. These processes, however, are energy intensive, making reclaimed water expensive.
In recent times, forward osmosis (FO), a potential energy saving desalination process, is being explored to optimize water recovery through simultaneous desalination and wastewater treatment. FO is an equilibrium-based, osmotically driven membrane separation process that has been used in several applications including concentration of specific feed streams, recovery of valuable nutrients, dilution of concentrated streams and desalination [18]. Table 1 shows some applications of FO.

Table 1.
Applications of forward osmosis in treatment of different wastewater streams. Adapted from [17].
Unlike the pressure-driven membrane processes, FO utilizes the difference in concentration of two solutions to cause the movement of water molecules from one point to the other. A draw solution (DS), which is the more concentrated solution, draws water from the feed solution (FS) across a semi-permeable membrane. Typical of the FO process, the DS soon becomes diluted and re-concentration of the DS is done to recycle the draw solutes as well as recover purified water [17,25,26]. The recovery and re-concentration process mainly depends on the type of DS used. This may include nanofiltration and/or reverse osmosis for salt-based draw solutes, thermal separation for gases and volatile compounds, or magnetic separation for magnetic nano-particles [27,28].
Aside from the advantages of the flexibility of operation, easy fouling reversal and energy utilization that FO brings, the process, including the reconstitution of DS, serves as a multi-barrier in rejecting salts and other contaminants [29,30]. The FO process also provides a viable option for seawater desalination when fertilizers such as NH4H2PO4, (NH4)2HPO4, Ca(NO3)2, and (NH4)2SO4 are used as draw solutions. When these DS (fertilizers) become diluted, they can be directly applied to crops without further treatment [31].
The main challenges with FO include the production of a suitable membrane for large-scale application of the process. A suitable FO membrane should have high permeability for water and low reverse solute flux (RSF). Also, it should be thin, mechanically strong, and able to resist internal concentration polarization (ICP). In this vein, much research has been conducted to improve FO membrane properties to enhance the process. FO membrane modifications have shown the potential of reducing ICP, fouling, and improving water flux [32,33]. Other forms of improvement of the FO process are in the membrane module development and draw solute improvement to reduce reverse solute flux. On the subject of FO, most studies have focused mainly on the concentration of FS with the aim of volume reduction for discharge or for resource recovery [34,35,36,37,38], at relatively high DS and FS flow rates (>1 L/min).
This study looked at the removal and feed concentration kinetics of chlorides, sulphates, and carbonates from municipal wastewater using 70 g/L NaCl as the draw solution at very low FS and DS flow rates (0.16 and 0.14 L/m, respectively). These salts are known to have negative effects on the environment when they get above the disposable limits. Again, their presence in reclaimed water causes scale and corrosion in pipes and water channels. In addition, chemical oxygen demand (COD), color, turbidity, and total suspended solids (TSS) were also monitored, as they form an integral part of MWW. The experiment holistically looked at the FO process from the determination of pure water flux to flux recovery through membrane cleaning. Each run was conducted in the continuous dilution mode for 6 h. To cater for repeatability, the experiment was conducted in triplicates. The concentrations of the targeted salts as well as conductivity of the system were monitored on an hourly basis. The permeate from this process can be recovered using reverse osmosis, which can also reconstitute the DS.
2. Materials and Methods
The set-up mainly consisted of two peristaltic pumps (Blue-White Industries, Huntington Beach, CA, USA) for circulation of FS and DS, a membrane test cell, flat sheet cellulose triacetate (CTA) membrane and two 5 L Duran bottles, used as feed and draw solution tanks.
2.1. CTA Membrane
CTA membrane with embedded support (Sterlitech, Kent, WA, USA), with properties given in Table 2, was used in this experiment. The membrane came as a square sheet of dimension 30.5 × 30.5 cm packed in 1% sodium metabisulfite water solution. Before use, the membrane was cut into the required dimension of 9 × 25 cm (effective membrane area of 0.0225 m2) and thoroughly rinsed with deionized (DI) water. It was then soaked in DI water overnight before use.
Table 2.
Properties of forward osmosis (FO) membrane used in this study.
The membrane test cell comprised of two PVC blocks of dimensions 35 cm × 15 cm × 6 cm, between which was sandwiched the CTA FO membrane and a plastic seal to avoid leakage. Rubber tubing was fitted onto nozzles that connected the test cell to the draw and feed solution tanks and the peristaltic pumps. Figure 1 shows the process flow diagram (PFD) of the setup. The feed and draw solutions were continuously stirred to enhance homogeneity, using two independent magnetic stirrers (Favorit, Selangor, Malaysia).
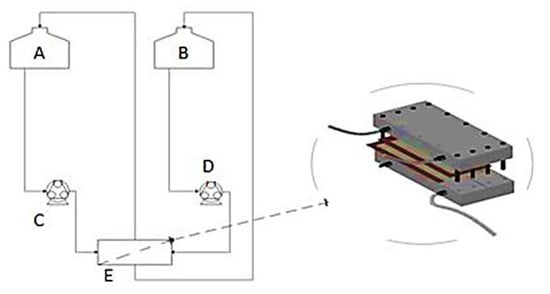
Figure 1.
Process flow diagram (PFD) for FO process showing major equipment used: A = FS tank (5 L), B = DS tank (5 L), C = FS circulation pump, D = DS circulation pump, E = flat sheet membrane test cell.
Feed for the experiment was simulated to mimic municipal wastewater having its main source from industry [39]. Table 3 shows the composition of the feed. All chemicals were of analytical grade and were homogeneously dissolved in 10 L deionized (DI) water (ELGA PURELAB Option-Q water deionizer, UK) at room temperature (20 ± 2 °C). The DS was prepared by dissolving 70 g NaCl (Sigma Aldrich, JHB, Malaysia), (osmotic pressure of 58.162 atm [31]) in 1 L DI water.
Table 3.
Composition of simulated municipal wastewater, spiked with Cl−, SO42−, and CO32− salts [39].
2.2. Process Description
The feed tank was filled with the feed solution (Table 4 shows the physicochemical parameters) to the 4.5 L mark while the draw solution tank was filled to the 1.5 L mark with the DS. The DS configuration adopted was the continuous dilution method, in which the draw solution was allowed to be diluted with water drawn from the feed for the entire duration of the experiment [19]. The membrane was oriented such that the active layer faced the feed solution. Counter current flow of DS and FS was used in this experiment [40,41]. FS and DS flow rates were maintained at 0.16 L/min (maximum flow rate of the pump) and 0.14 L/min (90% discharge rate of pump) respectively. The experiment took place at room temperature (20 ± 2 °C).
Table 4.
Physicochemical characteristics of simulated municipal wastewater (MWW).
Effluent analysis was performed using Oakton EcoTestr™ pH1 Waterproof Pocket Tester for pH, HI98703-02, Turbidity meter (Hanna Instruments, Woonsocket, RI, USA) for turbidity and HI98130 pH&EC (Hanna Instruments, Woonsocket, RI, USA) for conductivity. COD, TSS, color, chlorides, carbonates, and sulfates were analyzed using DR 3900 Photometer (HACH, Loveland, CO, USA). All analyses were done in triplicates.
The set-up was left to run for 6 h after which component rejection, permeate flux, and reverse solute flux were determined according to the following formulas.
Since the permeate diluted the DS, the dilution factor (Df) was calculated as follows [42];
where Vf,DS is the final volume of the DS and Vp is the volume of permeate.
where C0 and Cf are initial and final concentrations of the targeted component in the FS and DS, respectively, and Df is the dilution factor.
Volume of permeate was determined by taking the difference between the initial and final volumes of the draw solution.
where Cf and C0 have their usual meanings and V0 and Vf are the initial and final volumes of the FS respectively, A is the effective membrane area (m2), and t is the time (h).
2.3. Determination of Pure Water Flux
In order to assess flux decline and flux recoverability (after membrane cleaning), virgin membranes were subjected to an integrity test to determine the pure water flux. To this effect, three tests were conducted at the same conditions; 3 L of DI water was used as the feed solution while 1 L of 1 M NaCl solution was used as the draw solution [43]. The tests were conducted at room temperature (20 ± 2 °C). Each test lasted for 6 h.
2.4. Membrane Cleaning and Water Flux Recovery
The membrane was physically cleaned after each run. This was achieved by manually rubbing the membrane surface with fingers thoroughly under running water. After the second run, chemical cleaning was performed. First, DI waster was circulated at both FS and DS channels for 30 min. This was followed by 0.1% HCl solution circulated for 60 min. Further flushing was done using DI water to take away traces of the HCl solution.
Water flux recovery (WFR) was determined after the third (final) run according to Equation (5) [44];
where, Jc is the flux after membrane cleaning and J0 is the pure water flux.
WFR = (Jc/J0) × 100
3. Results and Discussion
3.1. Pure Water Flux
Table 5 presents the values obtained for the pure water flux (PWF). An average of 5.62 L/m2 h was achieved for all three runs. These values give an idea of the membrane’s performance in terms of permeation flux and serves as a benchmark to measure the efficiency of the membrane cleaning.
Table 5.
Pure water flux.
3.2. Permeation Flux
Water flux for the three runs is presented in Figure 2. Flux decline is apparent in the second and third runs most likely because of membrane fouling. A slight increase in flux in run 3 may be due to membrane cleaning performed after the second run. A combination of physical and chemical cleaning recovered 89% of flux. This was slightly above the performance of the physical cleaning alone, which was performed after run 1 with flux recovery of 82%.
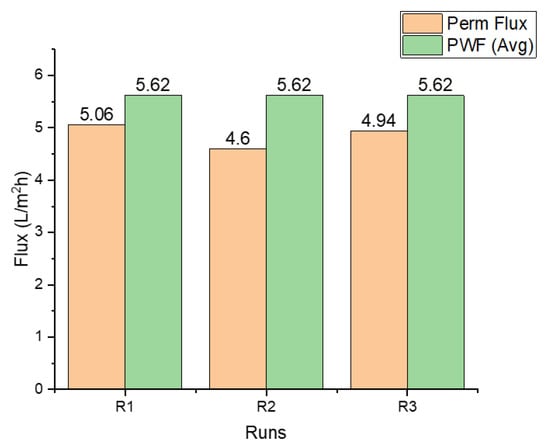
Figure 2.
Permeate flux for each run (determined after 6 h), compared with the average pure water flux.
Reverse salt flux (RSF) for the three runs is recorded in Table 6. Run 2 recorded the highest RSF, a significant increase from that of run 1. This could be due to accumulation of Cl− ions within the membrane pores during the first run. This value decreased to 0.042 g/m2h after the third run because of the effectiveness of the chemical cleaning performed.
Table 6.
Reverse salt flux (of Cl−) for each run, determined after 6 h of experimental run.
3.3. Rejection Efficiency of Membrane
The ion rejection efficiency of the FO membrane is shown in Figure 3. There was 100% rejection of SO42− in all runs, an average of 95.34 ± 0.74% rejection of CO32− in all runs, and an average of 18.41 ± 0.58% Cl− enrichment of the FS in all runs.
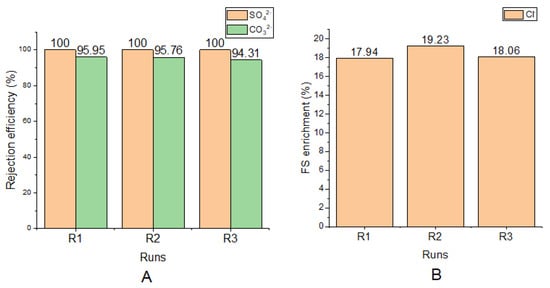
Figure 3.
(A) SO42− and CO32− rejection efficiencies for each run; (B) Cl− enrichment of FS (from DS) for each run.
The rejection efficiencies of the organic components (COD, TSS, color, and turbidity) are shown in Table 7 below.
Table 7.
Removal efficiencies for the organic components of simulated MWW.
The principal property of membranes used in separation applications is the ability to control the permeation of other species. For asymmetric FO membranes, this control is linked with the intrinsic membrane properties—water permeability (A), solute permeability (B), and the structural parameter of the support layer (S) [45]. In an experiment by Roest [46], which characterized the CTA membranes (the same used in this study), the A-value was found to be 1.4 LMH/bar, B-value was 0.74 µm/s, and S-value to be 1020 ± 60 µm.
With a solute permeation coefficient (B-value) of 0.74 µm/s, permeation of the solutes is highly limited. In addition to this, the mean pore size of the membrane, 0.74 nm [42] makes movement of solutes across the membrane extra restricted, especially for the divalent ions (SO42− and CO32−) which have hydration radiuses larger than the mean pore size of the membrane. Another important factor known to play a role in rejection of solutes in membranes is the electrostatic interaction between the membrane and the solutes. At an approximate pH value of 4, the CTA membrane is isoelectric, above which the membrane becomes slightly negatively charged [42]. The working pH in this study was 6.7. This most likely may have triggered the negative nature of the membrane leading to the repulsion of the solutes. Combinations of these factors explain the rejection efficiencies listed in Table 7.
For all runs, Cl−, enriched the FS. This accounts for the negative values of 17.94, 19.23, and 18.06 that were recorded. These represent an increase in concentration of Cl− in the FS. This movement of the Cl− is due the chemical potential gradient between FS and DS, a phenomenon known as the reverse solute flux. When concentrations of solutes in the DS is higher than that of the FS, a backward movement of the solutes is triggered [47]. In this study, using 70 g/L NaCl as the draw solution makes available more Cl− in the DS than in the FS. This was responsible for the backward movement. Again, the univalent nature of the Cl− makes their penetration through the membrane easy.
3.4. Kinetic Studies of Cl−, SO42−, and CO32− in FS
During FO, a lot of movement takes place in the system. The dynamics of the system depends on the process parameters like concentration, temperature, pH, and their changes with time. The kinetics of the targeted ions (Cl−, SO42−, and CO32−) in the FS was studied. This was achieved by the hourly monitoring of the concentration of these ions and the pH of the FS. The pH was found to be fairly constant, within the range 6.3–6.8, with an average of 6.62. The experiment was conducted at room temperature (20 ± 2 °C).
The change in concentration per hour was modelled according to second-order kinetics and was found to fit the model perfectly. The second order relates the concentration and time by Equation (6).
The graphical representations, vs. t, of the kinetics is shown in Figure 4. In most cases, as the FO process proceeds, concentrated species in the FS is expected to reduce, as this depicts movement across the membrane.
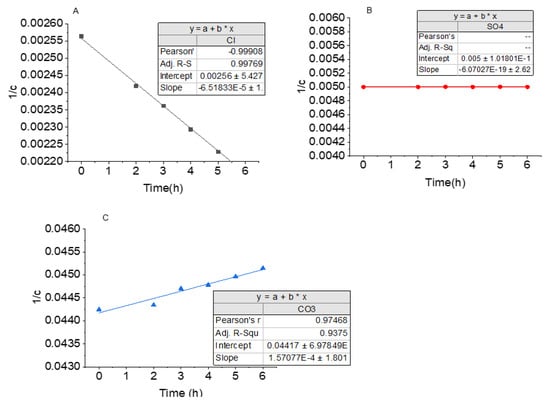
Figure 4.
Second-order kinetic model for target ions, in the feed solution. (A) Negative slope due to steady increase in Cl− concentration with time; (B) SO42− concentration remains the same in FS throughout the experiment; (C) CO32- concentration decreased with time, accounting for the positive slope.
The change in concentration of Cl− with time is shown in Figure 4A. As time, t, increased, decreased almost linearly. Concentration of Cl− was observed to be increasing in the FS as time elapsed. This is an indication of enrichment of Cl− in the system and thus accounts for the negative rate constant (−6.518 × 10⁻⁵). The Pearson’s R-value of 0.998 was obtained, indicating the fitness of the model to the second-order kinetic model. With this, the concentration of the Cl− in the feed can be predicted at a given time. Similar observations were made by other authors [37,48] in FO experiments using NaCl solution as the draw solution.
Change in concentration of CO32− over time is shown in Figure 4C. The positive rate constant (1.5707 × 10⁻⁴) depicts a reduction in concentration of CO32− with time. This reduction was, however, minimal, indicating a good rejection of the CO32− by the membrane. The Pearson’s R-value of 0.975, shows a good fitness to the second-order model, and can be used to predict CO32− concentration in the system at any given time. The trend of CO32− rejection/movement agrees with the rejection of divalent ions in the FO process observed by other authors [49,50].
Unlike the Cl− and CO32−, the graph of vs. t, for SO42− shows a straight line at a constant value of 0.005 (Figure 4B). This shows neither a reduction nor increase in the concentration of the SO42−, which is an indication of a total rejection of SO42− by the membrane. SO42− and CO32− were similarly rejected in FO in previous studies [51].
A comparison of some previous studies of the application of FO in MWW desalination and treatment with the results of this study is shown in Table 8. In most cases, organic contaminant rejection was at least 70%, while salts rejection was above 90%, making this study consistent with results of previous studies [45,46,47].
Table 8.
Comparative studies on FO desalination of MWW by other authors and this study.
4. Conclusions and Recommendations
In this study, simulated MWW, mimicking effluent from industrial processes was desalinated using forward osmosis. The study demonstrated that FO remains a promising desalination technique worth further exploration. This was shown in the efficiency of the removal of contaminants for, both salts and the organics from the MWW. Membrane properties, size exclusion, and electrostatic interaction played a vital role in the rejection of contaminants while osmotic pressure gradient drove the movement of water through the membrane. The kinetics study showed the behavior of the ions in solution as time proceeded. Knowledge of the kinetics coupled with the membrane parameters gives a clearer understanding of the rejection efficiency of the FO process for this study. The permeate from this process can be recovered using RO or NF. There is, however, need for further research in dealing with reverse solute flux which is a major challenge with the FO process.
Author Contributions
Conceptualization E.O.E. and E.K.T.; methodology, E.O.E., E.K.T., and D.A.-S.; validation, E.O.E., E.K.T., and S.R.; formal analysis, E.O.E. and E.K.T.; resources, S.R. and G.A.-D.; writing—original draft preparation, E.O.E.; writing—review and editing, E.K.T., G.A.-D., S.R., and D.A.-S.; supervision, S.R.; project administration, E.K.T. All authors have read and agreed to the published version of the manuscript.
Funding
There is no funding for this research.
Institutional Review Board Statement
Not applicable.
Informed Consent Statement
Not applicable.
Data Availability Statement
Not applicable.
Acknowledgments
The authors are thankful to the Department of Chemical Engineering (DUT), Green Engineering and Sustainability Research Group and FFS Refiners for their support. Also, the Research and Postgraduate Support Directorate of Durban University of Technology, South Africa for their commitment towards the article processing charges.
Conflicts of Interest
The authors declare no conflict of interest.
References
- Qadir, M.; Smakhtin, V. World Drains Away Valuable Energy, Nutirents & Water in Fast-Growing Wastewater Streams. Available online: http://www.ipsnews.net/2020/02/world-drains-away-valuable-energy-nutrients-water-fast-growing-wastewater-streams/ (accessed on 8 September 2020).
- SAICE. Infrastructure Report Card for South Africa; South African Institution of Civil Engineers: Midrand, South Africa, 2011. [Google Scholar]
- Rueda-Márquez, J.J.; Levchuk, I.; Manzano, M.; Sillanpää, M. Toxicity Reduction of Industrial and Municipal Wastewater by Advanced Oxidation Processes (Photo-Fenton, UVC/H2O2, Electro-Fenton and Galvanic Fenton): A Review. Catalysts 2020, 10, 612. [Google Scholar] [CrossRef]
- Tchobanoglous, G.; Burton, F.L.; Stensel, H. Wastewater engineering. Management 1991, 7, 1–4. [Google Scholar]
- Lefebvre, O.; Moletta, R. Treatment of organic pollution in industrial saline wastewater: A literature review. Water Res. 2006, 40, 3671–3682. [Google Scholar] [CrossRef]
- Navada, S.; Vadstein, O.; Gaumet, F.; Tveten, A.-K.; Spanu, C.; Mikkelsen, Ø.; Kolarevic, J. Biofilms remember: Osmotic stress priming as a microbial management strategy for improving salinity acclimation in nitrifying biofilms. Water Res. 2020, 176, 115732. [Google Scholar] [CrossRef] [PubMed]
- Navada, S.; Sebastianpillai, M.; Kolarevic, J.; Fossmark, R.O.; Tveten, A.-K.; Gaumet, F.; Mikkelsen, Ø.; Vadstein, O. A salty start: Brackish water start-up as a microbial management strategy for nitrifying bioreactors with variable salinity. Sci. Total. Environ. 2020, 739, 139934. [Google Scholar] [CrossRef] [PubMed]
- Li, H.; Wu, S.; Yang, C. Performance and Biomass Characteristics of SBRs Treating High-Salinity Wastewater at Presence of Anionic Surfactants. Int. J. Environ. Res. Public Health 2020, 17, 2689. [Google Scholar] [CrossRef]
- Ching, Y.C.; Redzwan, G. Biological Treatment of Fish Processing Saline Wastewater for Reuse as Liquid Fertilizer. Sustainability 2017, 9, 1062. [Google Scholar] [CrossRef]
- Bilińska, L.; Blus, K.; Gmurek, M.; Żyłła, R.; Ledakowicz, S. Brine Recycling from Industrial Textile Wastewater Treated by Ozone. By-Products Accumulation. Part 2: Scaling-Up. Water 2019, 11, 233. [Google Scholar] [CrossRef]
- Khong, T.D.; Loch, A.; Young, M.D. Perceptions and responses to rising salinity intrusion in the Mekong River Delta: What drives a long-term community-based strategy? Sci. Total Environ. 2020, 711, 134759. [Google Scholar] [CrossRef]
- Kondash, A.J.; Redmon, J.H.; Lambertini, E.; Feinstein, L.; Weinthal, E.; Cabrales, L.; Vengosh, A. The impact of using low-saline oilfield produced water for irrigation on water and soil quality in California. Sci. Total Environ. 2020, 733, 139392. [Google Scholar] [CrossRef]
- Xu, J.; Liu, Y.; Zhu, C.; Jia, H.; Tian, C.Y.; Ma, H.; Lv, G.H. NaCl Improves Suaeda salsa Aniline Tolerance in Wastewater. Sustainability 2020, 12, 7457. [Google Scholar] [CrossRef]
- Akter, S. Impact of drinking water salinity on children’s education: Empirical evidence from coastal Bangladesh. Sci. Total Environ. 2019, 690, 1331–1341. [Google Scholar] [CrossRef]
- Al-Enazi, N.M. Salinization and wastewater effects on the growth and some cell contents of Scenedesmus bijugatus. Saudi J. Biol. Sci. 2020, 27, 1773–1780. [Google Scholar] [CrossRef]
- Tornabene, B.J.; Breuner, C.W.; Hossack, B.R. Relative Toxicity and Sublethal Effects of NaCl and Energy-Related Saline Wastewaters on Prairie Amphibians. Aquat. Toxicol. 2020, 228, 105626. [Google Scholar] [CrossRef]
- Ezugbe, E.O.; Rathilal, S. Membrane Technologies in Wastewater Treatment: A Review. Membranes 2020, 10, 89. [Google Scholar] [CrossRef]
- Haupt, A.; Lerch, A. Forward Osmosis Application in Manufacturing Industries: A Short Review. Membranes 2018, 8, 47. [Google Scholar] [CrossRef] [PubMed]
- Ferrari, F.; Pijuan, M.; Rodriguez-Roda, I.; Blandin, G. Exploring Submerged Forward Osmosis for Water Recovery and Pre-Concentration of Wastewater before Anaerobic Digestion: A Pilot Scale Study. Membranes 2019, 9, 97. [Google Scholar] [CrossRef] [PubMed]
- Kumar, R.; Pal, P. A novel forward osmosis-nano filtration integrated system for coke-oven wastewater reclamation. Chem. Eng. Res. Des. 2015, 100, 542–553. [Google Scholar] [CrossRef]
- Zhao, S.; Minier-Matar, J.; Chou, S.; Wang, R.; Fane, A.G.; Adham, S. Gas field produced/process water treatment using forward osmosis hollow fiber membrane: Membrane fouling and chemical cleaning. Desalination 2017, 402, 143–151. [Google Scholar] [CrossRef]
- Thiruvenkatachari, R.; Francis, M.; Cunnington, M.; Su, S. Application of integrated forward and reverse osmosis for coal mine wastewater desalination. Sep. Purif. Technol. 2016, 163, 181–188. [Google Scholar] [CrossRef]
- Lutchmiah, K.; Cornelissen, E.R.; Harmsen, D.J.H.; Post, J.W.; Lampi, K.; Ramaekers, H.; Rietveld, L.C.; Roest, K. Water recovery from sewage using forward osmosis. Water Sci. Technol. 2011, 64, 1443–1449. [Google Scholar] [CrossRef]
- Li, J.; Hou, D.; Li, K.; Zhang, Y.; Wang, J.; Zhang, X. Domestic wastewater treatment by forward osmo-sis-membrane distillation (FO-MD) integrated system. Water Sci. Technol. 2018, 77, 1514–1523. [Google Scholar] [CrossRef]
- Eyvaz, M.; Arslan, S.; İmer, D.; Yüksel, E.; Koyuncu, İ. Forward Osmosis Membranes–A Review: Part I. In Osmotically Driven Membrane Processes-Approach, Development and Current Status; IntechOpen: London, UK, 2018. [Google Scholar]
- EO, E.; Rathilal, S.; Ishwarlall, S.; Tetteh, K. Removal of Cl−, SO42− and CO32− Salts from Oil Refinery Effluent Using Forward Osmosis. In Proceedings of the 18th JOHANNESBURG International Conference on Science, Engineering, Technology & Waste Management (SETWM-20), Johannesburg, South Africa, 16–17 November 2020. [Google Scholar]
- Luo, H.; Wang, Q.; Zhang, T.C.; Tao, T.; Zhou, A.; Chen, L.; Bie, X. A review on the recovery methods of draw solutes in forward osmosis. J. Water Process. Eng. 2014, 4, 212–223. [Google Scholar] [CrossRef]
- Chekli, L.; Phuntsho, S.; Shon, H.; Vigneswaran, S.; Kandasamy, J.; Chanan, A. A review of draw solutes in forward osmosis process and their use in modern applications. Desalination Water Treat. 2012, 43, 167–184. [Google Scholar] [CrossRef]
- Cath, T.; Childress, A.; Elimelech, M. Forward osmosis: Principles, applications, and recent developments. J. Membr. Sci. 2006, 281, 70–87. [Google Scholar] [CrossRef]
- Wang, Y.-N.; Goh, K.; Li, X.; Setiawan, L.; Wang, R. Membranes and processes for forward osmosis-based desalination: Recent advances and future prospects. Desalination 2018, 434, 81–99. [Google Scholar] [CrossRef]
- Mogashane, T.; Maree, J.; Nyamutswa, N.; Vogel, J.; Mujuru, M.; Mphahlele-Makgwane, M. Evaluation of Forward Os-mosis for Treatment of Sodium sulphate Rich Brine. In Proceedings of the 18th JOHANNESBURG Int’l Conference on Science, Engineering, Technology & Waste Management (SETWM-20), Johannesburg, South Africa, 16–17 November 2020. [Google Scholar]
- Li, J.; Wang, Q.; Deng, L.; Kou, X.; Tang, Q.; Hu, Y. Fabrication and characterization of carbon nanotubes-based porous composite forward osmosis membrane: Flux performance, separation mechanism, and potential application. J. Membr. Sci. 2020, 604, 118050. [Google Scholar] [CrossRef]
- Zhou, Z.; Hu, Y.; Wang, Q.; Mi, B. Carbon nanotube-supported polyamide membrane with minimized internal concen-tration polarization for both aqueous and organic solvent forward osmosis process. J. Membr. Sci. 2020, 611, 118273. [Google Scholar] [CrossRef]
- Holloway, R.W.; Childress, A.E.; Dennett, K.E.; Cath, T.Y. Forward osmosis for concentration of anaerobic digester cen-trate. Water Res. 2007, 41, 4005–4014. [Google Scholar] [CrossRef] [PubMed]
- Roy, D.; Rahni, M.; Pierre, P.; Yargeau, V. Forward osmosis for the concentration and reuse of process saline wastewater. Chem. Eng. J. 2016, 287, 277–284. [Google Scholar] [CrossRef]
- Şeker, M.; Buyuksari, E.; Topcu, S.; Sesli, D.; Celebi, D.; Keskinler, B.; Aydiner, C. Effect of process parameters on flux for whey concentration with NH3/CO2 in forward osmosis. Food Bioprod. Process. 2017, 105, 64–76. [Google Scholar] [CrossRef]
- Nikiema, B.C.W.-Y.; Ito, R.; Guizani, M.; Funamizu, N. Estimation of Water Flux and Solute Movement during the Concentration Process of Hydrolysed Urine by Forward Osmosis. J. Water Environ. Technol. 2017, 15, 163–173. [Google Scholar] [CrossRef][Green Version]
- Chandrasekhar, J.; Raghavarao, K.S.M.S. Separation and Concentration of Anthocyanins from Jamun: An Integrated Process. Chem. Eng. Commun. 2014, 202, 1368–1379. [Google Scholar] [CrossRef]
- Kweinor Tetteh, E. Nitrate Recycling from Centrate as a Strategy to Mitigate Odour Release. Master’s Thesis, University of Valladolid, Valladolid, Spain, 2017. [Google Scholar]
- Cath, T.Y.; Drewes, J.E.; Lundin, C.D. A novel hybrid forward osmosis process for drinking water augmentation using impaired water and saline water sources. In Proceedings of the 24th Annual WateReuse Symposium, Seattle, WA, USA, 13–16 September 2009; WateReuse Association: Alexandria, VA, USA, 2009. [Google Scholar]
- Cath, T.Y.; Hancock, N.T.; Lundin, C.D.; Hoppe-Jones, C.; Drewes, J.E. A multi-barrier osmotic dilution process for sim-ultaneous desalination and purification of impaired water. J. Membr. Sci. 2010, 362, 417–426. [Google Scholar] [CrossRef]
- Alturki, A.A.; McDonald, J.A.; Khan, S.J.; Price, W.E.; Nghiem, L.D.; Elimelech, M. Removal of trace organic contaminants by the forward osmosis process. Sep. Purif. Technol. 2013, 103, 258–266. [Google Scholar] [CrossRef]
- Cath, T.Y.; Elimelech, M.; McCutcheon, J.R.; McGinnis, R.L.; Achilli, A.; Anastasio, D.; Brady, A.R.; Childress, A.E.; Farr, I.V.; Hancock, N.T.; et al. Standard Methodology for Evaluating Membrane Performance in Osmotically Driven Membrane Processes. Desalination 2013, 312, 31–38. [Google Scholar] [CrossRef]
- Schäfer, A.; Andritsos, N.; Karabelas, A.J.; Hoek, E.; Schneider, R.; Nyström, M. Fouling in Nanofiltration; Elsevier: Amsterdam, The Netherlands, 2004. [Google Scholar]
- Tiraferri, A.; Yip, N.Y.; Phillip, W.A.; Schiffman, J.D.; Elimelech, M. Relating performance of thin-film composite forward osmosis membranes to support layer formation and structure. J. Membr. Sci. 2011, 367, 340–352. [Google Scholar] [CrossRef]
- Roest, D. Characterization and Performance Evaluation of Commercially Available Membranes in Forward Osmosis. Master’s Thesis, Eindhoven University of Technology, Eindhoven, The Netherlands, 2017. [Google Scholar]
- Nagy, E. (Ed.) Chapter 17–Forward Osmosis. In Basic Equations of Mass Transport through a Membrane Layer, 2nd ed.; Elsevier: Amsterdam, The Netherlands, 2019; pp. 447–456. [Google Scholar] [CrossRef]
- Zhang, J.; She, Q.; Chang, V.W.C.; Tang, C.Y.; Webster, R.D. Mining Nutrients (N, K, P) from Urban Source-Separated Urine by Forward Osmosis Dewatering. Environ. Sci. Technol. 2014, 48, 3386–3394. [Google Scholar] [CrossRef]
- Mahto, A.; Kanakaraj, A.; Meena, R.; Kamali, M.; Nataraj, S.K.; Aminabhavi, T.M. Forward Osmosis for Industrial Effluents Treatment—Sustainability Considerations. Sep. Purif. Technol. 2021, 117568. [Google Scholar] [CrossRef]
- You, S.; Lu, J.; Tang, C.Y.; Wang, X. Rejection of heavy metals in acidic wastewater by a novel thin-film inorganic forward osmosis membrane. Chem. Eng. J. 2017, 320, 532–538. [Google Scholar] [CrossRef]
- Martinetti, C.R.; Childress, A.E.; Cath, T.Y. High recovery of concentrated RO brines using forward osmosis and membrane distillation. J. Membr. Sci. 2009, 331, 31–39. [Google Scholar] [CrossRef]
- Xue, W.; Tobino, T.; Nakajima, F.; Yamamoto, K. Seawater-driven forward osmosis for enriching nitrogen and phosphorous in treated municipal wastewater: Effect of membrane properties and feed solution chemistry. Water Res. 2015, 69, 120–130. [Google Scholar] [CrossRef]
- Zhang, X.; Ning, Z.; Wang, D.K.; Da Costa, J.C.D.; Da Costa, J.C.D. Processing municipal wastewaters by forward osmosis using CTA membrane. J. Membr. Sci. 2014, 468, 269–275. [Google Scholar] [CrossRef]
- Nguyen, N.C.; Chen, S.-S.; Yang, H.-Y.; Hau, N.T. Application of forward osmosis on dewatering of high nutrient sludge. Bioresour. Technol. 2013, 132, 224–229. [Google Scholar] [CrossRef] [PubMed]
Publisher’s Note: MDPI stays neutral with regard to jurisdictional claims in published maps and institutional affiliations. |
© 2021 by the authors. Licensee MDPI, Basel, Switzerland. This article is an open access article distributed under the terms and conditions of the Creative Commons Attribution (CC BY) license (http://creativecommons.org/licenses/by/4.0/).