
Mathematical Modeling of the Effect of Pulsed Electric Field on the Specific Permselectivity of Ion-Exchange Membranes


Abstract
:1. Introduction
- -
- Reduction of concentration polarization. Relaxation of the concentration profile occurs at the membrane surface during the pause lapse. The concentrations of ion species resume partially or completely to the initial values;
- -
- Intensification of electroconvection at overlimiting current regimes, which in addition to the increase in mass transfer helps to wash out the scale and foulant components from the membrane surface;
- -
- Reduction of water splitting (pH values at which some components can precipitate are not reached).
2. Experimental Results
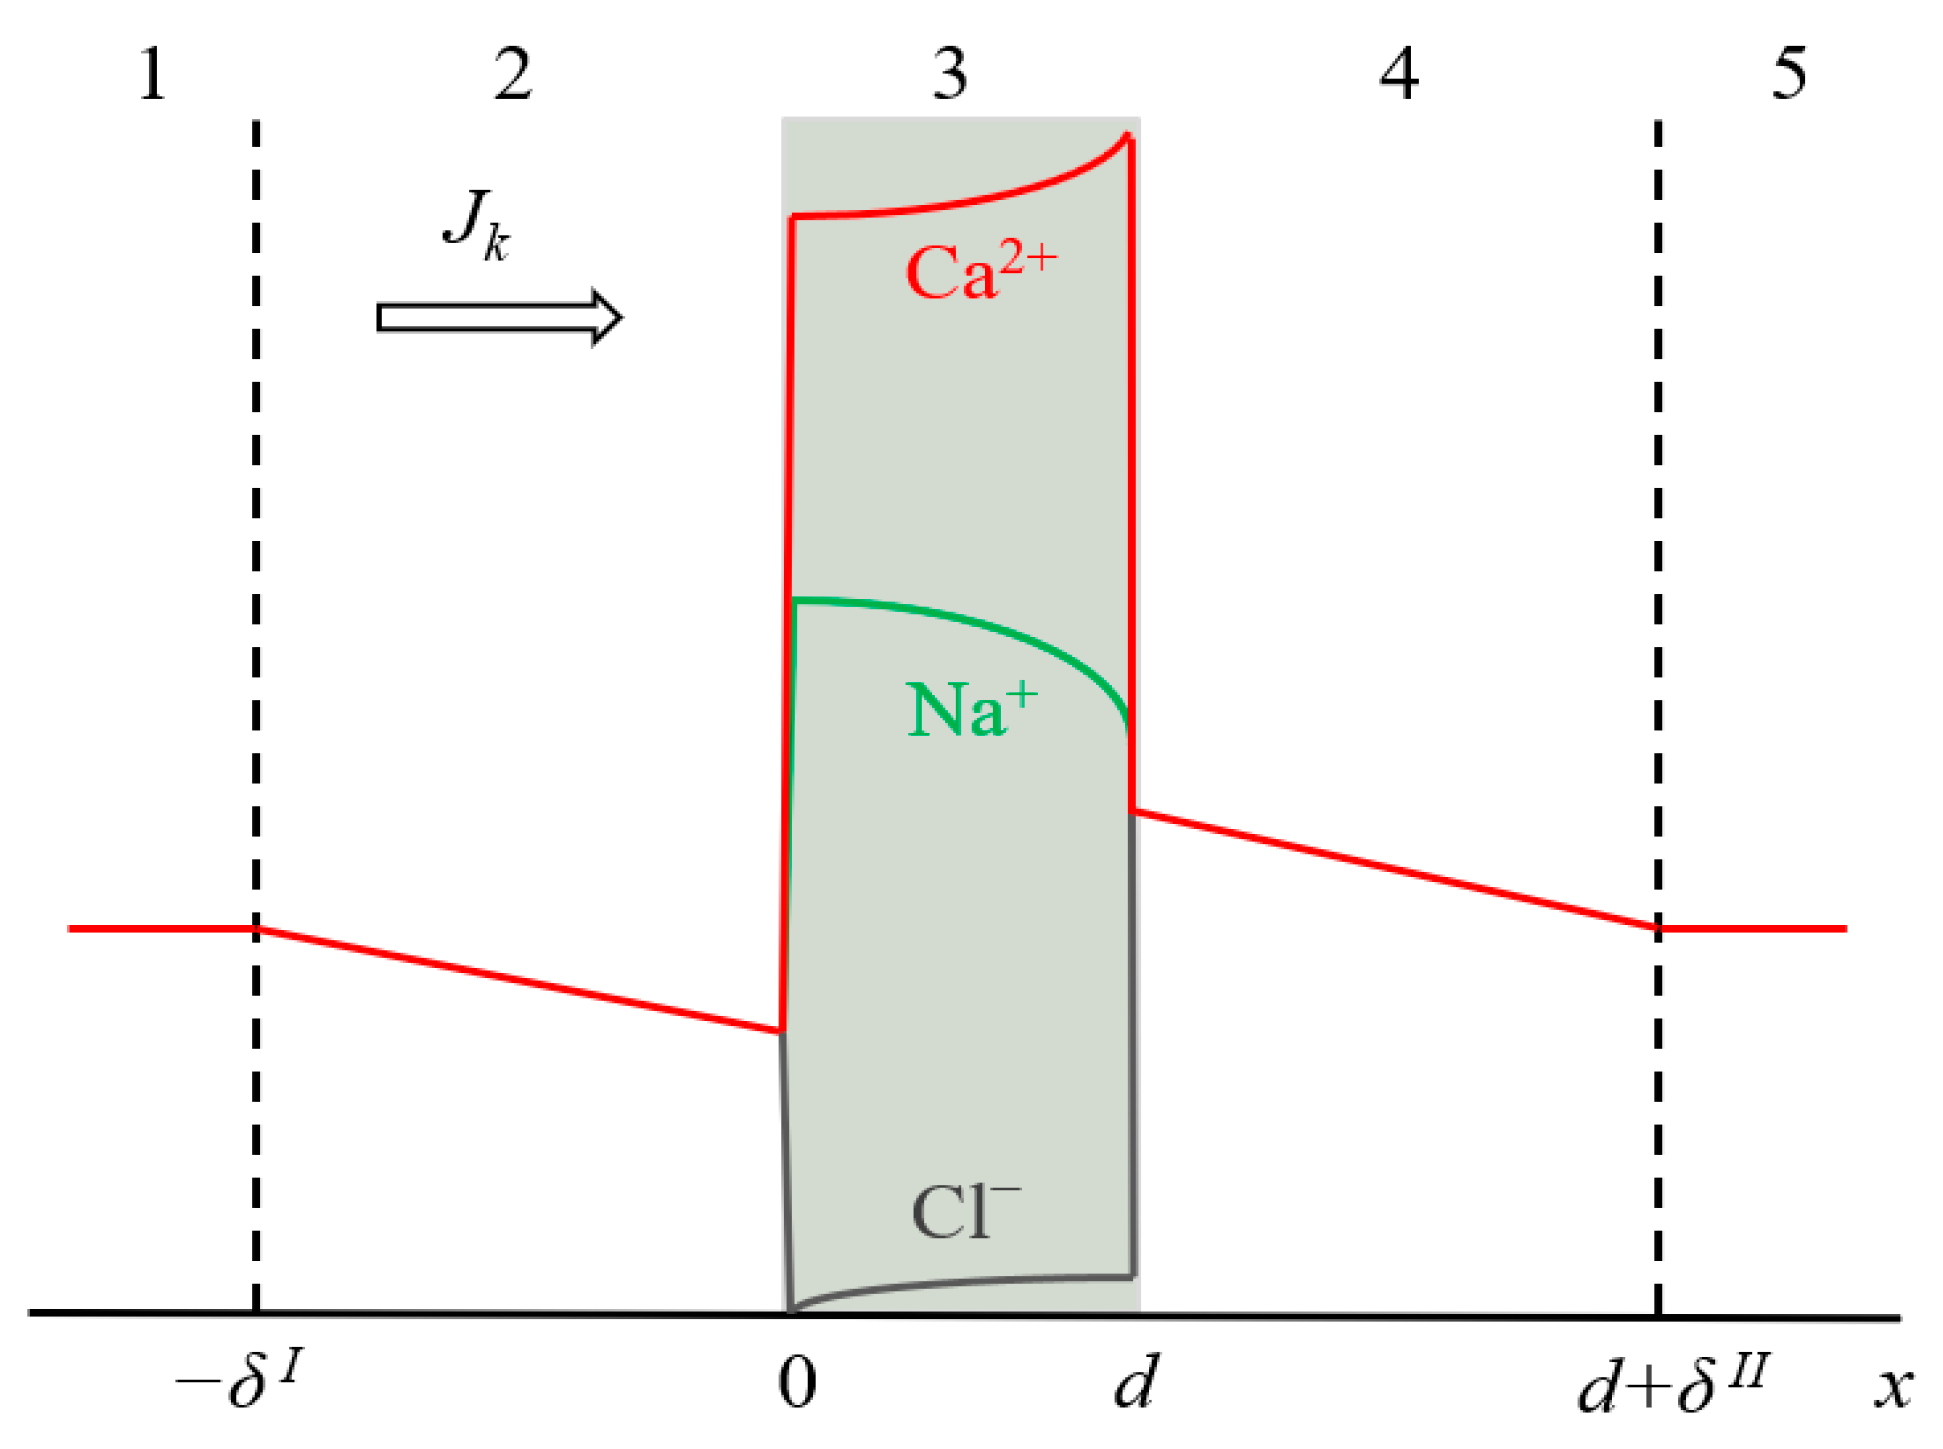
3. Theoretical Part
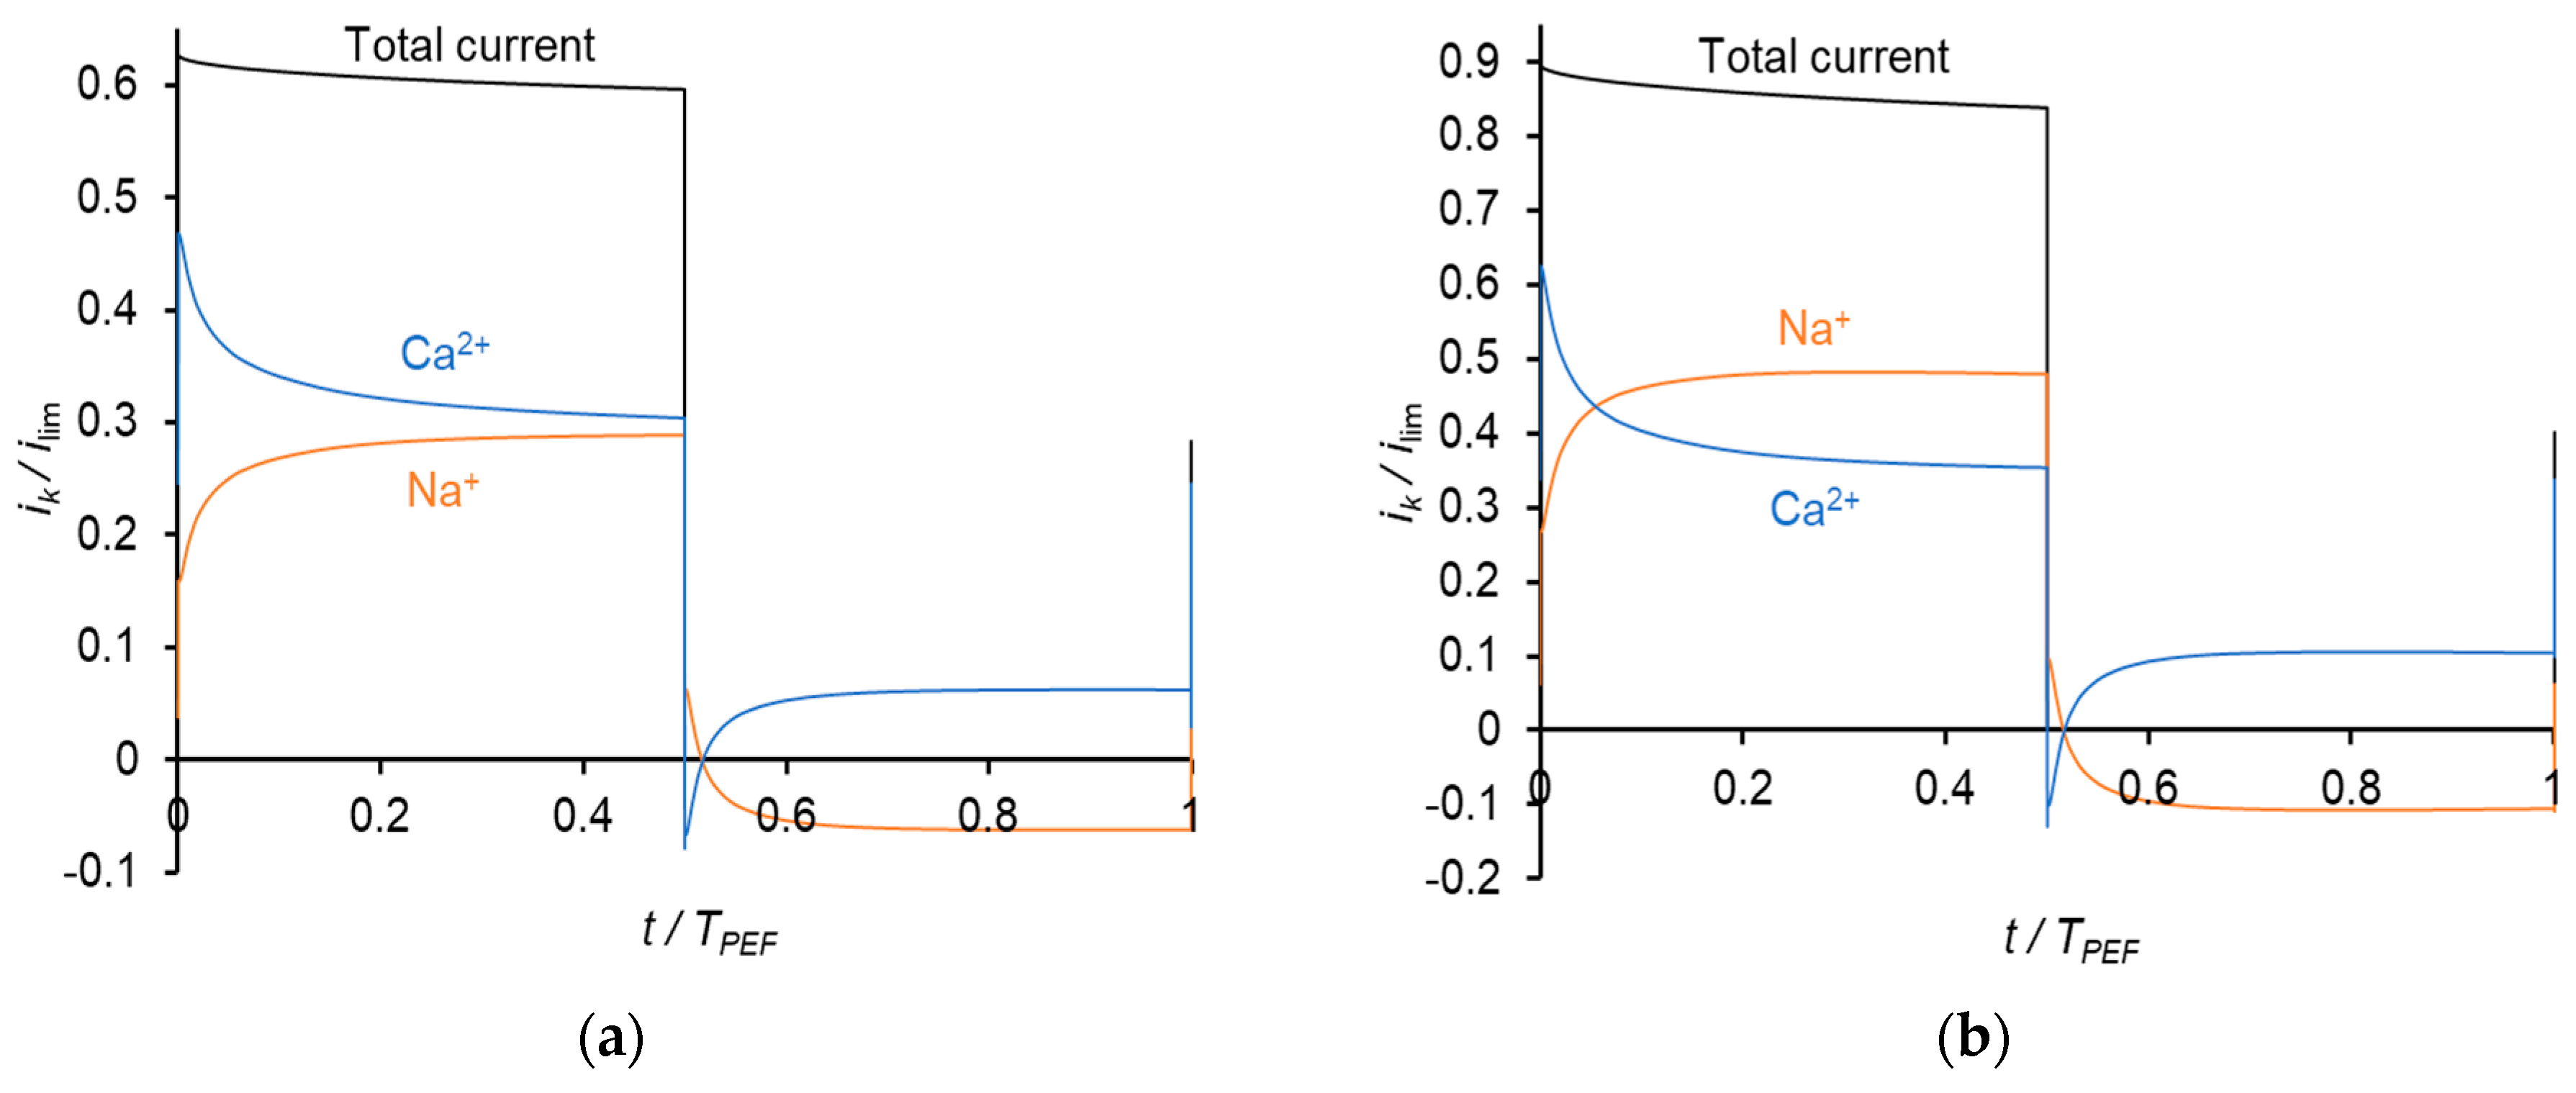
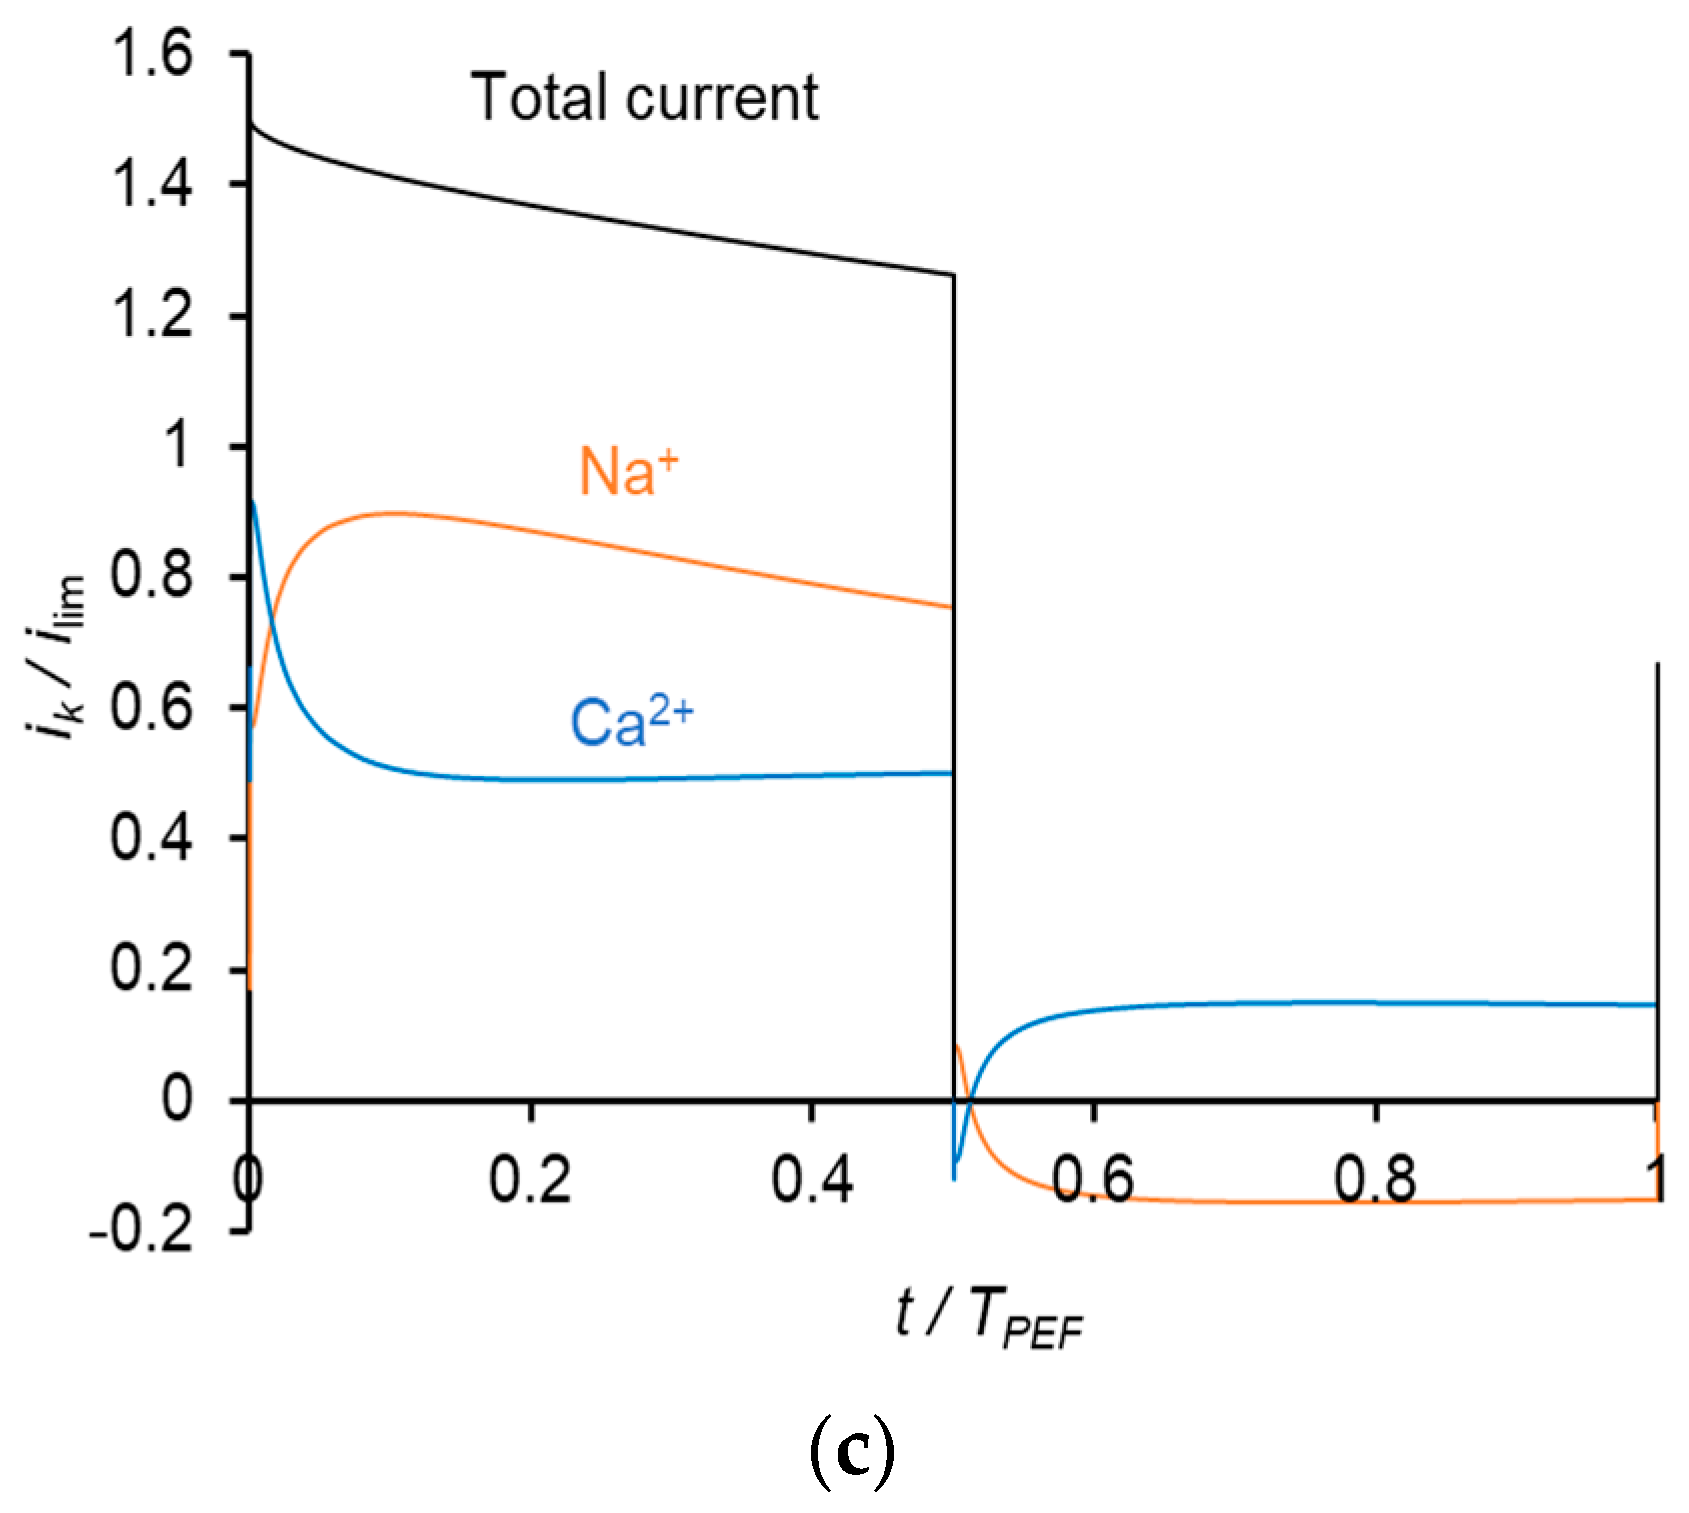
4. Results and Discussions
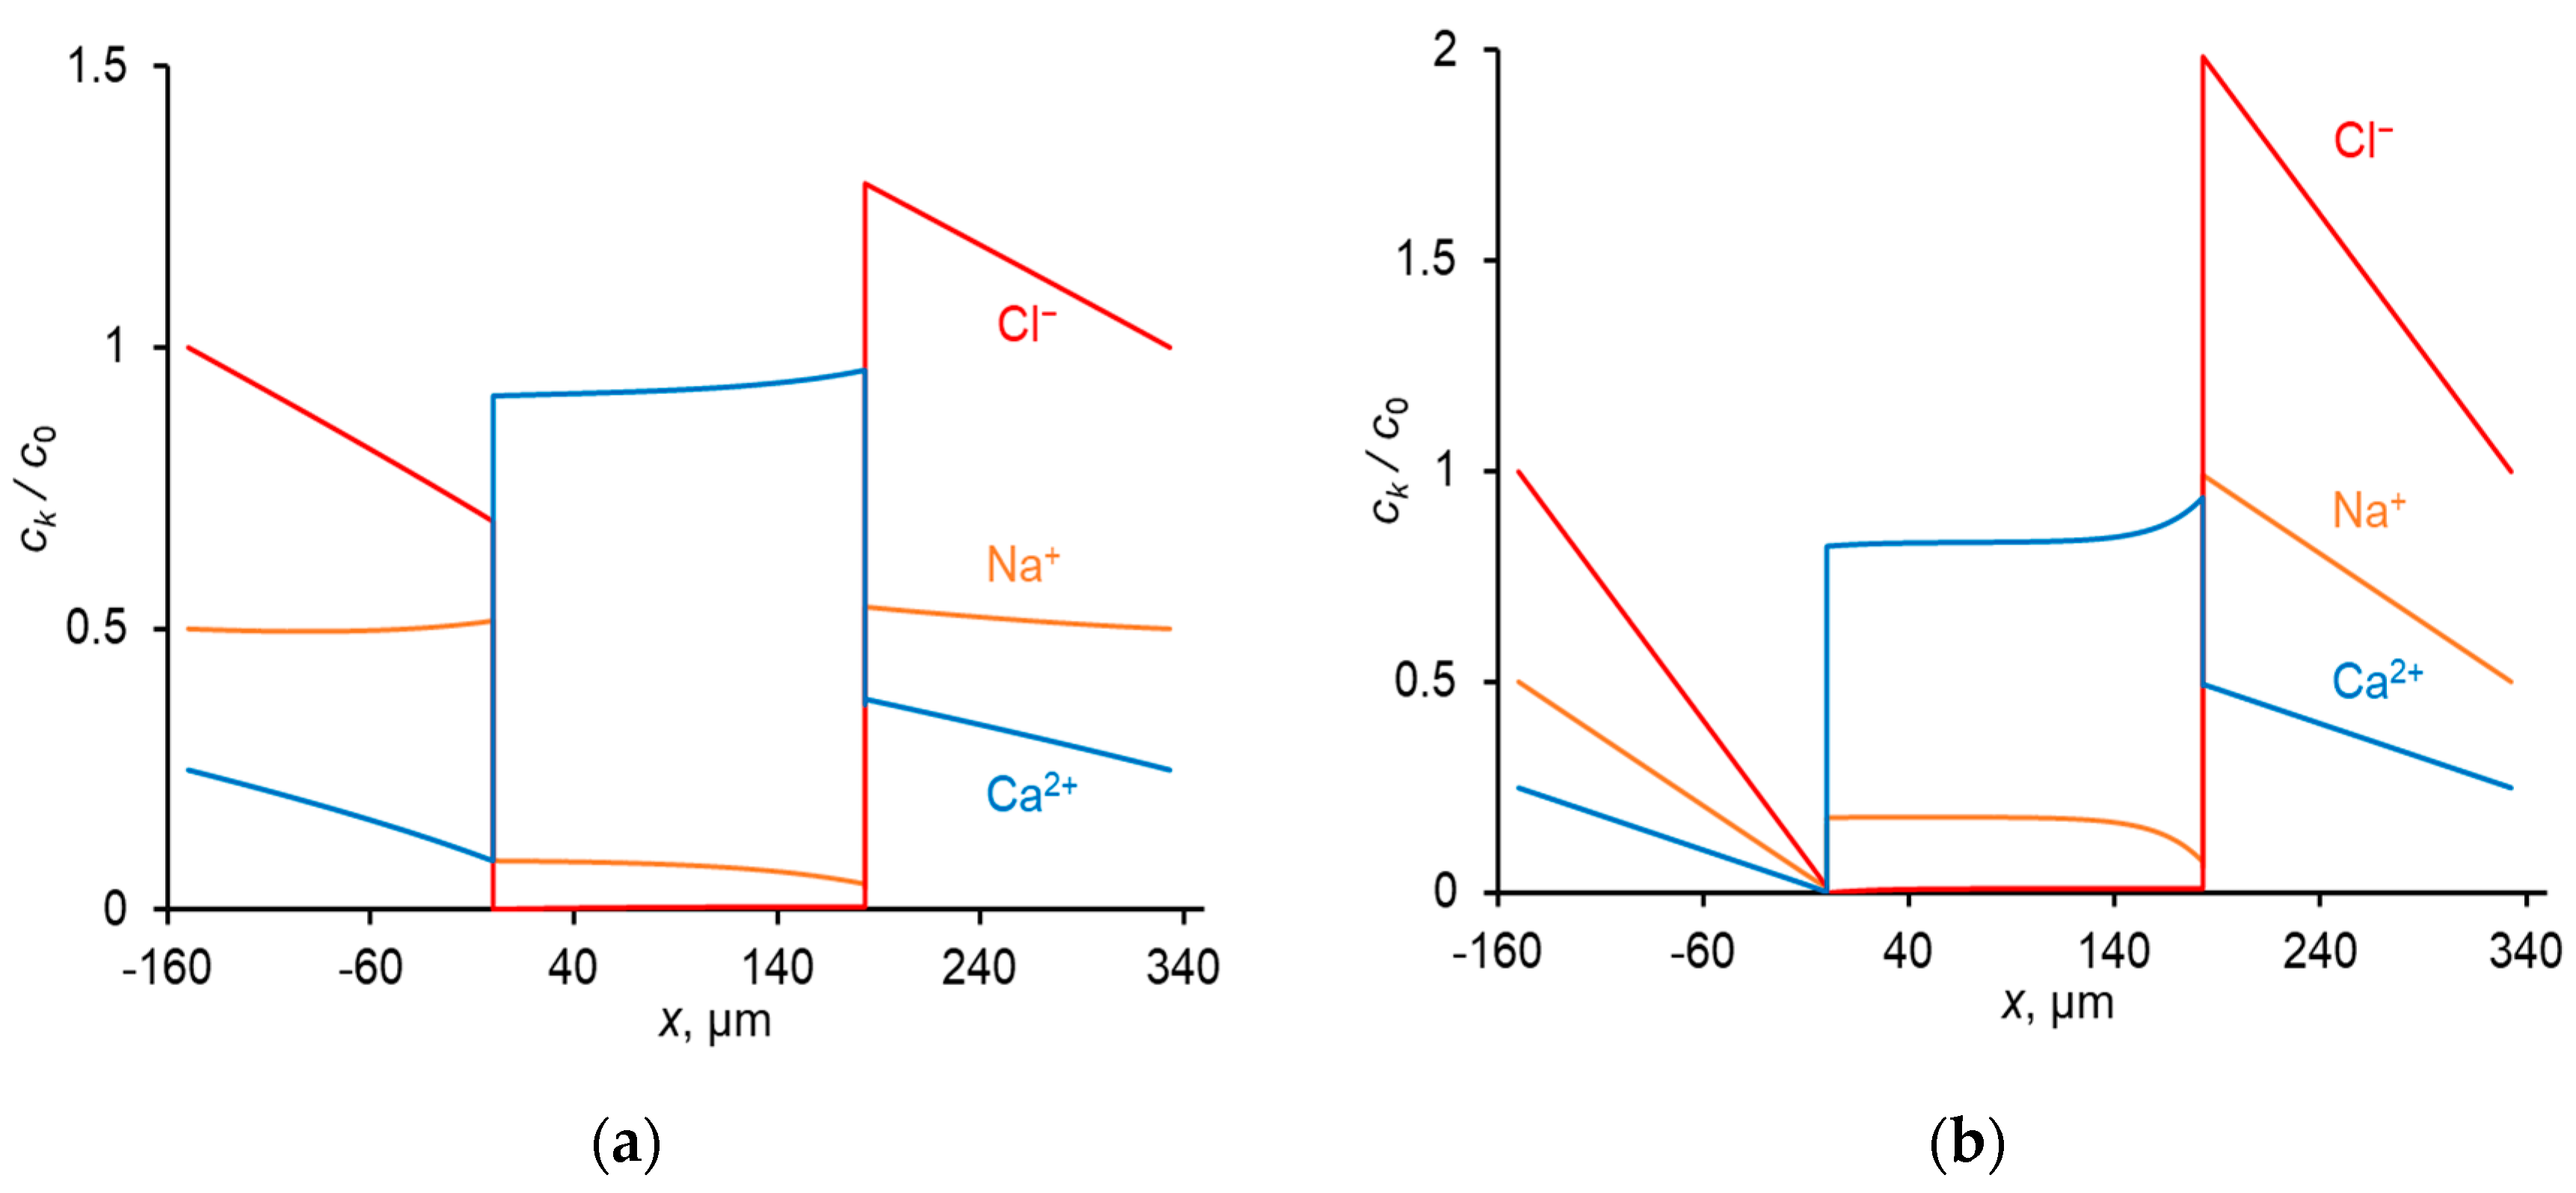
4.1. CC Mode
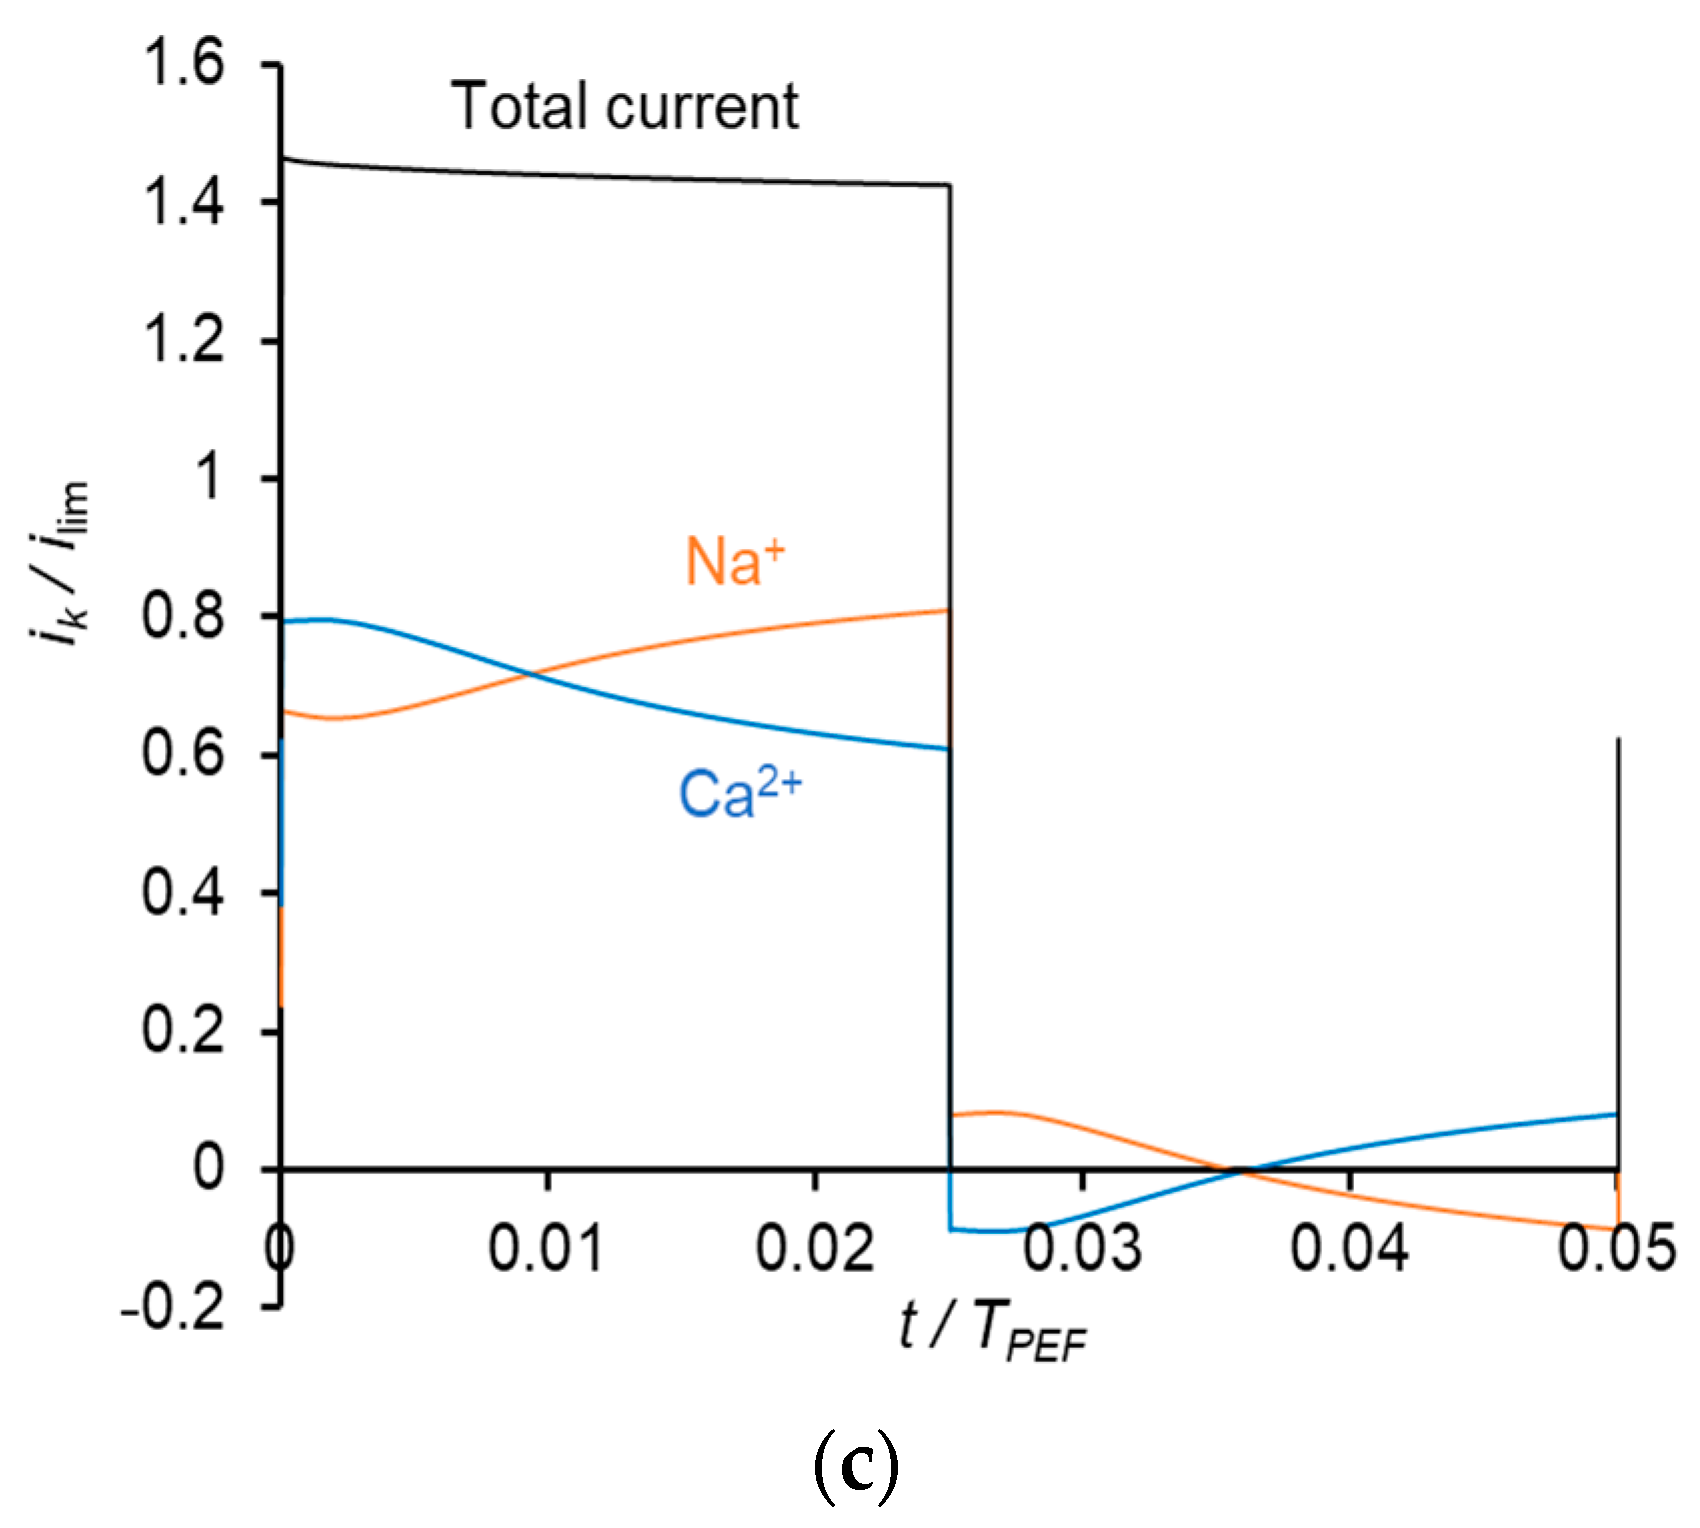
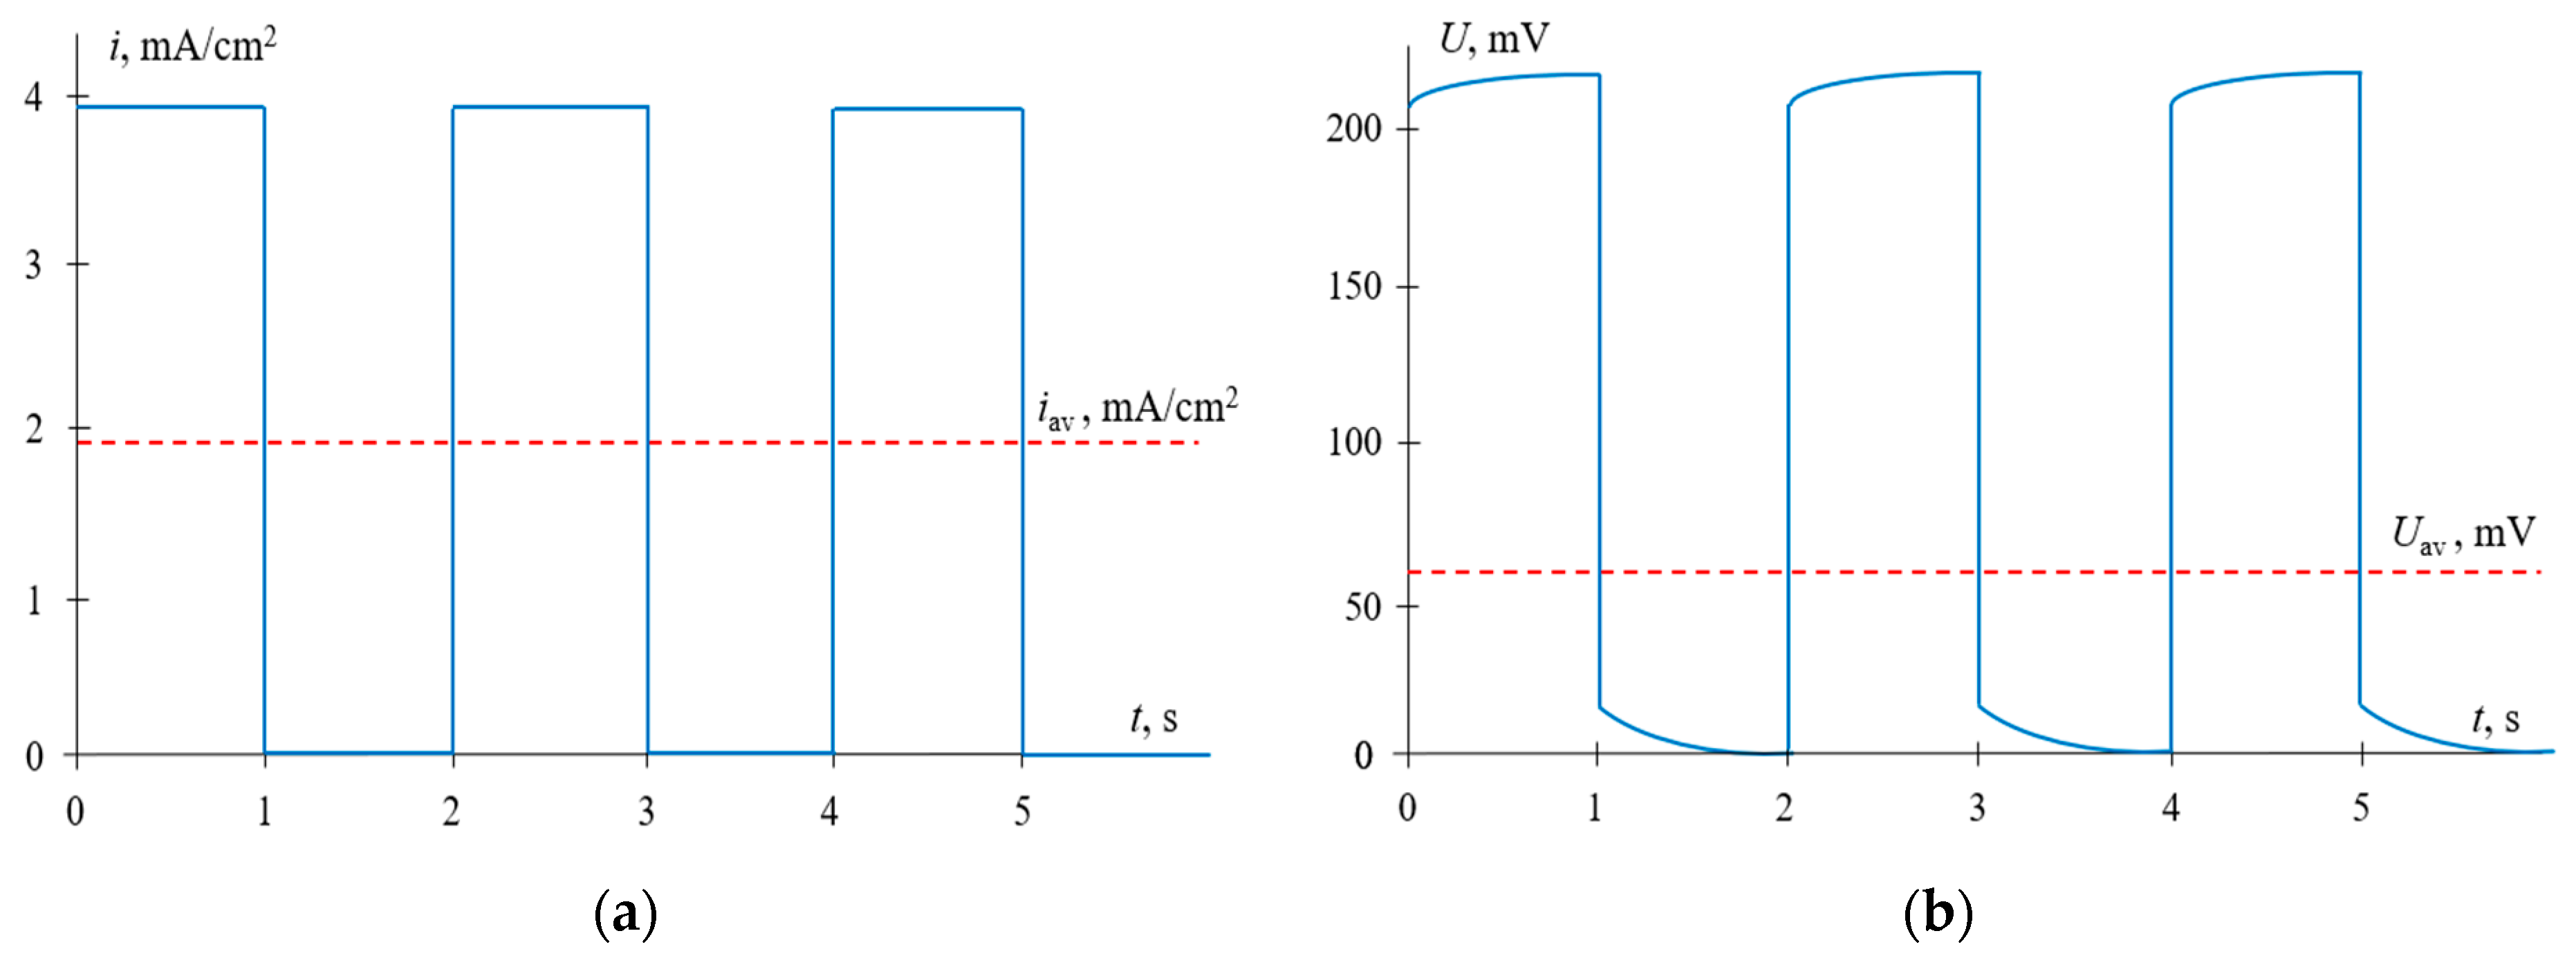
4.2. PEF Mode (Current Pulses)
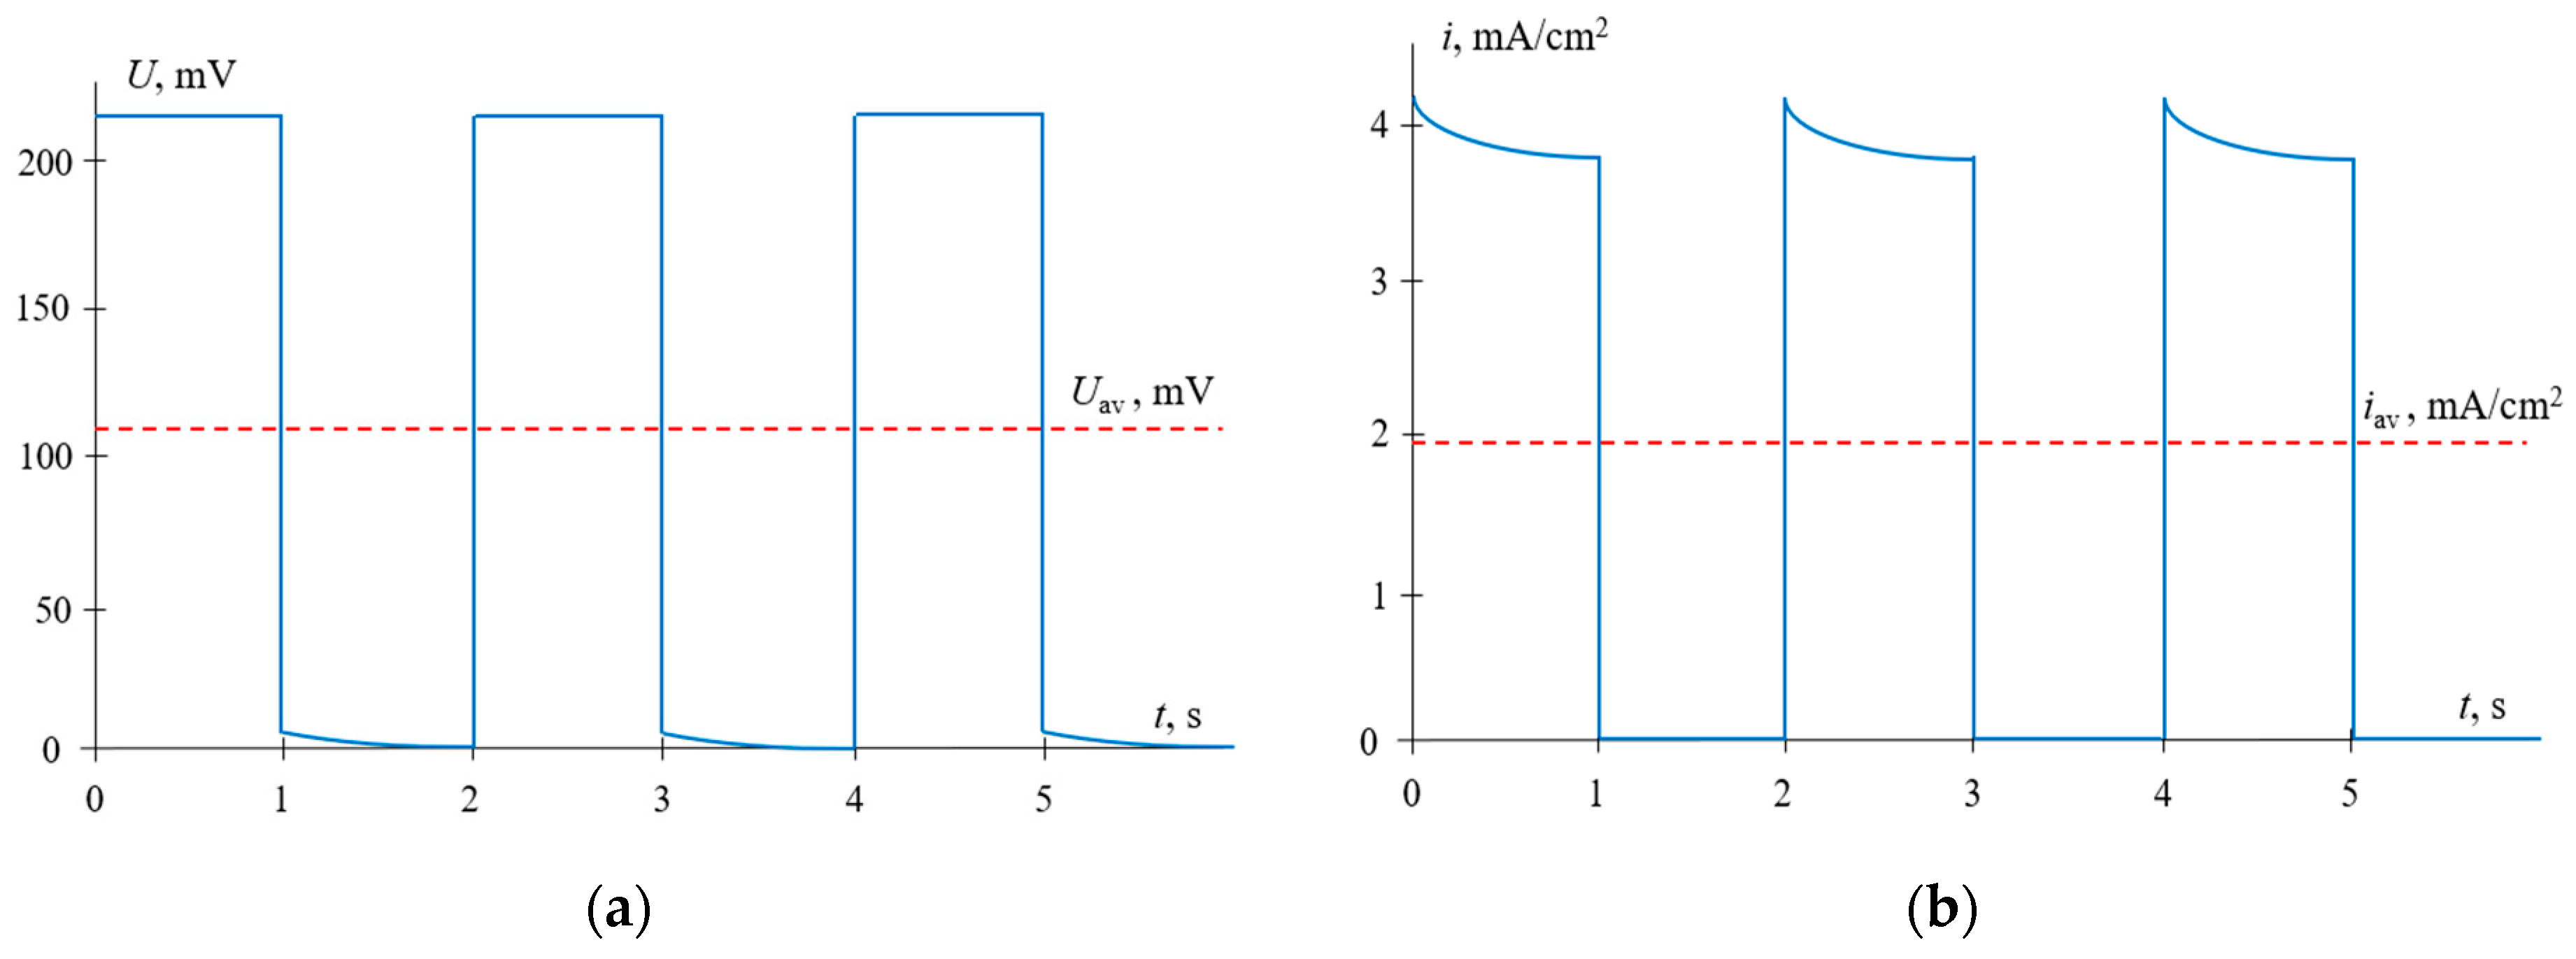
4.3. PEF Mode (Voltage Pulses)
5. Conclusions
Author Contributions
Funding
Institutional Review Board Statement
Informed Consent Statement
Conflicts of Interest
Nomenclature
| Abbreviations | |
| CC | Continuous current |
| DBL | Diffusion boundary layer |
| DD | Degree of desalination |
| ED | Electrodialysis |
| PEF | Pulsed electric field |
| PVC | Polyvinyl chloride |
| Symbols | |
| ck | Concentration of ion k |
| ck0 | Concentration of ion k in the bulk solution |
| d | Membrane thickness |
| Dk | Diffusion coefficient of ion k in the solution |
| Diffusion coefficient of ion k in the membrane | |
| E | Electric field strength |
| f | Frequency |
| F | Faraday constant |
| i | Current density |
| ik | Partial current density of ion k |
| ilim | Limiting current density |
| Jk | Flux density of ion k |
| KN | Nikolsky’s constant |
| Exchange capacity of the membrane | |
| R | Universal gas constant |
| t | Time |
| T | Absolute temperature |
| Tk | Effective transport number of ion k in membrane |
| Uav | Average voltage |
| Upulse | Voltage, applied during the pulse |
| zk | Charge number of ion k |
| zm | Charge of fixed ions in the membrane |
| Greek symbols | |
| Duty cycle | |
| Activity coefficient of ion k in the solution | |
| Activity coefficient of ion k in the membrane | |
| , | Thickness of the depleted and enriches diffusion boundary layers, respectively |
| Solution relative permittivity | |
| Vacuum permittivity | |
| Ratio of the degree of desalination by ion k to the total degree of desalination | |
| Electric potential | |
References
- Strathmann, H. Electrodialysis, a mature technology with a multitude of new applications. Desalination 2010, 264, 268–288. [Google Scholar] [CrossRef]
- Ran, J.; Wu, L.; He, Y.; Yang, Z.; Wang, Y.; Jiang, C.; Ge, L.; Bakangura, E.; Xu, T. Ion exchange membranes: New developments and applications. J. Memb. Sci. 2017, 522, 267–291. [Google Scholar] [CrossRef]
- Campione, A.; Gurreri, L.; Ciofalo, M.; Micale, G.; Tamburini, A.; Cipollina, A. Electrodialysis for water desalination: A critical assessment of recent developments on process fundamentals, models and applications. Desalination 2018, 434, 121–160. [Google Scholar] [CrossRef]
- Apel, P.Y.; Bobreshova, O.V.; Volkov, A.V.; Volkov, V.V.; Nikonenko, V.V.; Stenina, I.A.; Filippov, A.N.; Yampolskii, Y.P.; Yaroslavtsev, A.B. Prospects of Membrane Science Development. Membr. Membr. Technol. 2019, 1, 45–63. [Google Scholar] [CrossRef] [Green Version]
- Mishchuk, N.A.; Koopal, L.K.; Gonzalez-Caballero, F. Intensification of electrodialysis by applying a non-stationary electric field. Colloids Surfaces A Physicochem. Eng. Asp. 2001, 176, 195–212. [Google Scholar] [CrossRef]
- Uzdenova, A.; Urtenov, M. Potentiodynamic and galvanodynamic regimes of mass transfer in flow-through electrodialysis membrane systems: Numerical simulation of electroconvection and current-voltage curve. Membranes 2020, 10, 49. [Google Scholar] [CrossRef] [PubMed] [Green Version]
- Mikhaylin, S.; Nikonenko, V.; Pourcelly, G.; Bazinet, L. Intensification of demineralization process and decrease in scaling by application of pulsed electric field with short pulse/pause conditions. J. Memb. Sci. 2014, 468, 389–399. [Google Scholar] [CrossRef]
- Malek, P.; Ortiz, J.M.; Richards, B.S.; Schäfer, A.I. Electrodialytic removal of NaCl from water: Impacts of using pulsed electric potential on ion transport and water dissociation phenomena. J. Memb. Sci. 2013, 435, 99–109. [Google Scholar] [CrossRef] [Green Version]
- Zabolotskii, V.I.; Shel’deshov, N.V.; Gnusin, N.P. Dissociation of Water Molecules in Systems with Ion-exchange Membranes. Russ. Chem. Rev. 1988, 57, 801–808. [Google Scholar] [CrossRef]
- Simons, R. Strong electric field effects on proton transfer between membrane-bound amines and water. Nature 1979, 280, 824–826. [Google Scholar] [CrossRef]
- Andreeva, M.A.; Gil, V.V.; Pismenskaya, N.D.; Dammak, L.; Kononenko, N.A.; Larchet, C.; Grande, D.; Nikonenko, V.V. Mitigation of membrane scaling in electrodialysis by electroconvection enhancement, pH adjustment and pulsed electric field application. J. Memb. Sci. 2018, 549, 129–140. [Google Scholar] [CrossRef]
- Asraf-Snir, M.; Gilron, J.; Oren, Y. Gypsum scaling of anion exchange membranes in electrodialysis. J. Memb. Sci. 2016, 520, 176–186. [Google Scholar] [CrossRef]
- Mikhaylin, S.; Bazinet, L. Fouling on ion-exchange membranes: Classification, characterization and strategies of prevention and control. Adv. Colloid Interface Sci. 2016, 229, 34–56. [Google Scholar] [CrossRef]
- Mishchuk, N.A.; Verbich, S.V.; Gonzales-Caballero, F. Concentration Polarization and Specific Selectivity of Membranes in Pulse Mode. Colloid J. 2001, 63, 586–595. [Google Scholar] [CrossRef]
- Dufton, G.; Mikhaylin, S.; Gaaloul, S.; Bazinet, L. Systematic study of the impact of pulsed electric field parameters (Pulse/pause duration and frequency) on ED performances during acid whey treatment. Membranes 2020, 10, 14. [Google Scholar] [CrossRef] [Green Version]
- Sistat, P.; Huguet, P.; Ruiz, B.; Pourcelly, G.; Mareev, S.A.; Nikonenko, V.V. Effect of pulsed electric field on electrodialysis of a NaCl solution in sub-limiting current regime. Electrochim. Acta 2015, 164, 267–280. [Google Scholar] [CrossRef]
- Lemay, N.; Mikhaylin, S.; Mareev, S.; Pismenskaya, N.; Nikonenko, V.; Bazinet, L. How demineralization duration by electrodialysis under high frequency pulsed electric field can be the same as in continuous current condition and that for better performances? J. Memb. Sci. 2020, 603, 117878. [Google Scholar] [CrossRef]
- Mikhaylin, S.; Nikonenko, V.; Pismenskaya, N.; Pourcelly, G.; Choi, S.; Kwon, H.J.; Han, J.; Bazinet, L. How physico-chemical and surface properties of cation-exchange membrane affect membrane scaling and electroconvective vortices: Influence on performance of electrodialysis with pulsed electric field. Desalination 2016, 393, 102–114. [Google Scholar] [CrossRef]
- Nichka, V.S.; Geoffroy, T.R.; Nikonenko, V.; Bazinet, L. Impacts of flow rate and pulsed electric field current mode on protein fouling formation during bipolar membrane electroacidification of skim milk. Membranes 2020, 10, 200. [Google Scholar] [CrossRef] [PubMed]
- Gao, Q.; Li, Z.; Lei, C.; Fu, R.; Wang, W.; Li, Q.; Liu, Z. Application of pulsed electric field in antifouling treatment of sodium gluconate mother liquor by electrodialysis. Materials 2020, 13, 2501. [Google Scholar] [CrossRef]
- Dufton, G.; Mikhaylin, S.; Gaaloul, S.; Bazinet, L. Positive impact of pulsed electric field on lactic acid removal, demineralization and membrane scaling during acid whey electrodialysis. Int. J. Mol. Sci. 2019, 20, 797. [Google Scholar] [CrossRef] [PubMed] [Green Version]
- Moya, A.A.; Moleón, J.A. Application of the network simulation method to study the electrical response of ion-exchange membrane systems to pulsed electric fields. Desalination 2011, 265, 49–53. [Google Scholar] [CrossRef]
- Uzdenova, A.M.; Kovalenko, A.V.; Urtenov, M.K.; Nikonenko, V.V. Effect of electroconvection during pulsed electric field electrodialysis. Numerical experiments. Electrochem. Commun. 2015, 51, 1–5. [Google Scholar] [CrossRef]
- Rubinstein, I.; Zaltzman, B.; Kedem, O. Electric fields in and around ion-exchange membranes. J. Memb. Sci. 1997, 125, 17–21. [Google Scholar] [CrossRef]
- Butylskii, D.; Moroz, I.; Tsygurina, K.; Mareev, S. Effect of surface inhomogeneity of ion-exchange membranes on the mass transfer efficiency in pulsed electric field modes. Membranes 2020, 10, 40. [Google Scholar] [CrossRef] [Green Version]
- Zyryanova, S.V.; Butyl’skii, D.Y.; Mareev, S.A.; Pis’menskaya, N.D.; Nikonenko, V.V.; Pourcelly, G. Effect of Parameters of Pulsed Electric Field on Average Current Density through Nafion 438 Membrane in Electrodialysis Cell. Russ. J. Electrochem. 2018, 54, 775–781. [Google Scholar] [CrossRef]
- Lemay, N.; Mikhaylin, S.; Bazinet, L. Voltage spike and electroconvective vortices generation during electrodialysis under pulsed electric field: Impact on demineralization process efficiency and energy consumption. Innov. Food Sci. Emerg. Technol. 2019, 52, 221–231. [Google Scholar] [CrossRef]
- Cifuentes-Araya, N.; Pourcelly, G.; Bazinet, L. Impact of pulsed electric field on electrodialysis process performance and membrane fouling during consecutive demineralization of a model salt solution containing a high magnesium/calcium ratio. J. Colloid Interface Sci. 2011, 361, 79–89. [Google Scholar] [CrossRef] [PubMed]
- Lee, H.J.; Moon, S.H.; Tsai, S.P. Effects of pulsed electric fields on membrane fouling in electrodialysis of NaC1 solution containing humate. Sep. Purif. Technol. 2002, 27, 89–95. [Google Scholar] [CrossRef]
- Cifuentes-Araya, N.; Astudillo-Castro, C.; Bazinet, L. Mechanisms of mineral membrane fouling growth modulated by pulsed modes of current during electrodialysis: Evidences of water splitting implications in the appearance of the amorphous phases of magnesium hydroxide and calcium carbonate. J. Colloid Interface Sci. 2014, 426, 221–234. [Google Scholar] [CrossRef]
- Park, H.B.; Kamcev, J.; Robeson, L.M.; Elimelech, M.; Freeman, B.D. Maximizing the right stuff: The trade-off between membrane permeability and selectivity. Science 2017, 356, 1138–1148. [Google Scholar] [CrossRef] [Green Version]
- Wang, P.; Wang, M.; Liu, F.; Ding, S.; Wang, X.; Du, G.; Liu, J.; Apel, P.; Kluth, P.; Trautmann, C.; et al. Ultrafast ion sieving using nanoporous polymeric membranes. Nat. Commun. 2018, 9. [Google Scholar] [CrossRef] [Green Version]
- Martí-Calatayud, M.C.; García-Gabaldón, M.; Pérez-Herranz, V. Study of the effects of the applied current regime and the concentration of chromic acid on the transport of Ni2+ ions through Nafion 117 membranes. J. Memb. Sci. 2012, 392–393, 137–149. [Google Scholar] [CrossRef]
- Golubenko, D.V.; Karavanova, Y.A.; Melnikov, S.S.; Achoh, A.R.; Pourcelly, G.; Yaroslavtsev, A.B. An approach to increase the permselectivity and mono-valent ion selectivity of cation-exchange membranes by introduction of amorphous zirconium phosphate nanoparticles. J. Memb. Sci. 2018, 563, 777–784. [Google Scholar] [CrossRef]
- Zabolotsky, V.I.; Manzanares, J.A.; Nikonenko, V.V.; Lebedev, K.A.; Lovtsov, E.G. Space charge effect on competitive ion transport through ion-exchange membranes. Desalination 2002, 147, 387–392. [Google Scholar] [CrossRef]
- Mizutani, Y.; Yamane, R.; Ihara, H.; Motomura, H. Studies of Ion Exchange Membranes. XVI. The Preparation of Ion Exchange Membranes by the “Paste Method.”. Bull. Chem. Soc. Jpn. 1963, 36, 361–366. [Google Scholar] [CrossRef] [Green Version]
- Doi, S.; Yasukawa, M.; Kakihana, Y.; Higa, M. Alkali attack on anion exchange membranes with PVC backing and binder: Effect on performance and correlation between them. J. Memb. Sci. 2019, 573, 85–96. [Google Scholar] [CrossRef]
- Hori, Y.; Nakatani, T.; Mizutani, Y. Morphology of ion exchange membranes. Microscopy 1986, 35, 220–226. [Google Scholar] [CrossRef]
- Pismenskaya, N.D.; Nikonenko, V.V.; Melnik, N.A.; Shevtsova, K.A.; Belova, E.I.; Pourcelly, G.; Cot, D.; Dammak, L.; Larchet, C. Evolution with time of hydrophobicity and microrelief of a cation-exchange membrane surface and its impact on overlimiting mass transfer. J. Phys. Chem. B 2012, 116, 2145–2161. [Google Scholar] [CrossRef] [PubMed]
- Sarapulova, V.V.; Titorova, V.D.; Nikonenko, V.V.; Pismenskaya, N.D. Transport Characteristics of Homogeneous and Heterogeneous Ion-Exchange Membranes in Sodium Chloride, Calcium Chloride, and Sodium Sulfate Solutions. Membr. Membr. Technol. 2019, 1, 168–182. [Google Scholar] [CrossRef]
- Moya, A.A. Electrochemical impedance of ion-exchange membranes in ternary solutions with two counterions. J. Phys. Chem. C 2014, 118, 2539–2553. [Google Scholar] [CrossRef]
- Uzdenova, A.; Kovalenko, A.; Urtenov, M.; Nikonenko, V. 1D mathematical modelling of non-stationary ion transfer in the diffusion layer adjacent to an ion-exchange membrane in galvanostatic mode. Membranes 2018, 8, 84. [Google Scholar] [CrossRef] [Green Version]
- Scholz, F. Nikolsky’s ion exchange theory versus Baucke’s dissociation mechanism of the glass electrode. J. Solid State Electrochem. 2011, 15, 67–68. [Google Scholar] [CrossRef]
- Sillanpää, M.; Shestakova, M. Emerging and Combined Electrochemical Methods; Elsevier: Amsterdam, The Netherlands, 2017; ISBN 9780128114636. [Google Scholar]
- Helfferich, F.G. Ion Exchange; Dover Publications: New York, NY, USA, 1995. [Google Scholar]
- Titorova, V.D.; Mareev, S.A.; Gorobchenko, A.D.; Gil, V.V.; Nikonenko, V.V.; Sabbatovskii, K.G.; Pismenskaya, N.D. Effect of current-induced coion transfer on the shape of chronopotentiograms of cation-exchange membranes. J. Memb. Sci. 2021, 119036. [Google Scholar] [CrossRef]
- Nikonenko, V.V.; Zabolotskii, V.I.; Gnusin, N.P. Effect of stationary external electric fields on ion-exchange membrane selectivity. Sov. Electrochem. 1980, 16, 472–479. [Google Scholar]
- Sata, T. Studies on ion exchange membranes with permselectivity for specific ions in electrodialysis. J. Memb. Sci. 1994, 93, 117–135. [Google Scholar] [CrossRef]
- Shaposhnik, V.A.; Vasil’eva, V.I.; Praslov, D.B. Concentration fields of solutions under electrodialysis with ion-exchange membranes. J. Memb. Sci. 1995, 101, 23–30. [Google Scholar] [CrossRef]
- Vasil’eva, V.I.; Shaposhnik, V.A.; Grigorchuk, O.V.; Malykhin, M.D. Electrodialysis kinetics by laser interferometry. Russ. J. Electrochem. 2002, 38, 846–852. [Google Scholar] [CrossRef]
- Martí-Calatayud, M.C.; Sancho-Cirer Poczatek, M.; Pérez-Herranz, V. Trade-Off between Operating Time and Energy Consumption in Pulsed Electric Field Electrodialysis: A Comprehensive Simulation Study. Membranes 2021, 11, 43. [Google Scholar] [CrossRef]


| Total DD | ED Mode | K+ | Na+ | Ca2+ | Mg2+ |
|---|---|---|---|---|---|
| 30% i/ilim ≈ 0.6 | CC mode | 1.3 | 0.57 | 0.67 | 0.57 |
| PEF mode, 1 s: 1 s | 1.3 | 0.17 | 1.0 | 0.88 | |
| 60% i/ilim ≈ 1.5 | CC mode | 1.2 | 0.90 | 0.67 | 0.58 |
| PEF mode, 1 s: 1 s | 1.2 | 0.61 | 0.87 | 0.83 |
| Name | Value | Description |
|---|---|---|
| c0 | 0.02 mol/L | Bulk solution concentration |
| 1.64 mol/L | Exchange capacity of the membrane | |
| DNa | 1.33 × 10⁻⁹ m2/s | Ion diffusion coefficients in the solution |
| DCa | 7.96 × 10⁻¹⁰ m2/s | |
| DCl | 2.04 × 10⁻⁹ m2/s | |
| 1.07 × 10⁻¹⁰ m2/s | Ion diffusion coefficients in the membrane | |
| 4.93 × 10⁻¹² m2/s | ||
| 10−11 m2/s | ||
| 1 | Ion activity coefficients in the membrane | |
| 0.05 | ||
| 1 | ||
| δI | 150 μm | Depleted diffusion layer thickness |
| δII | 150 μm | Enriched diffusion layer thickness |
| d | 180 μm | Membrane thickness |
| KN | 4.5 | Nikolsky’s constant |
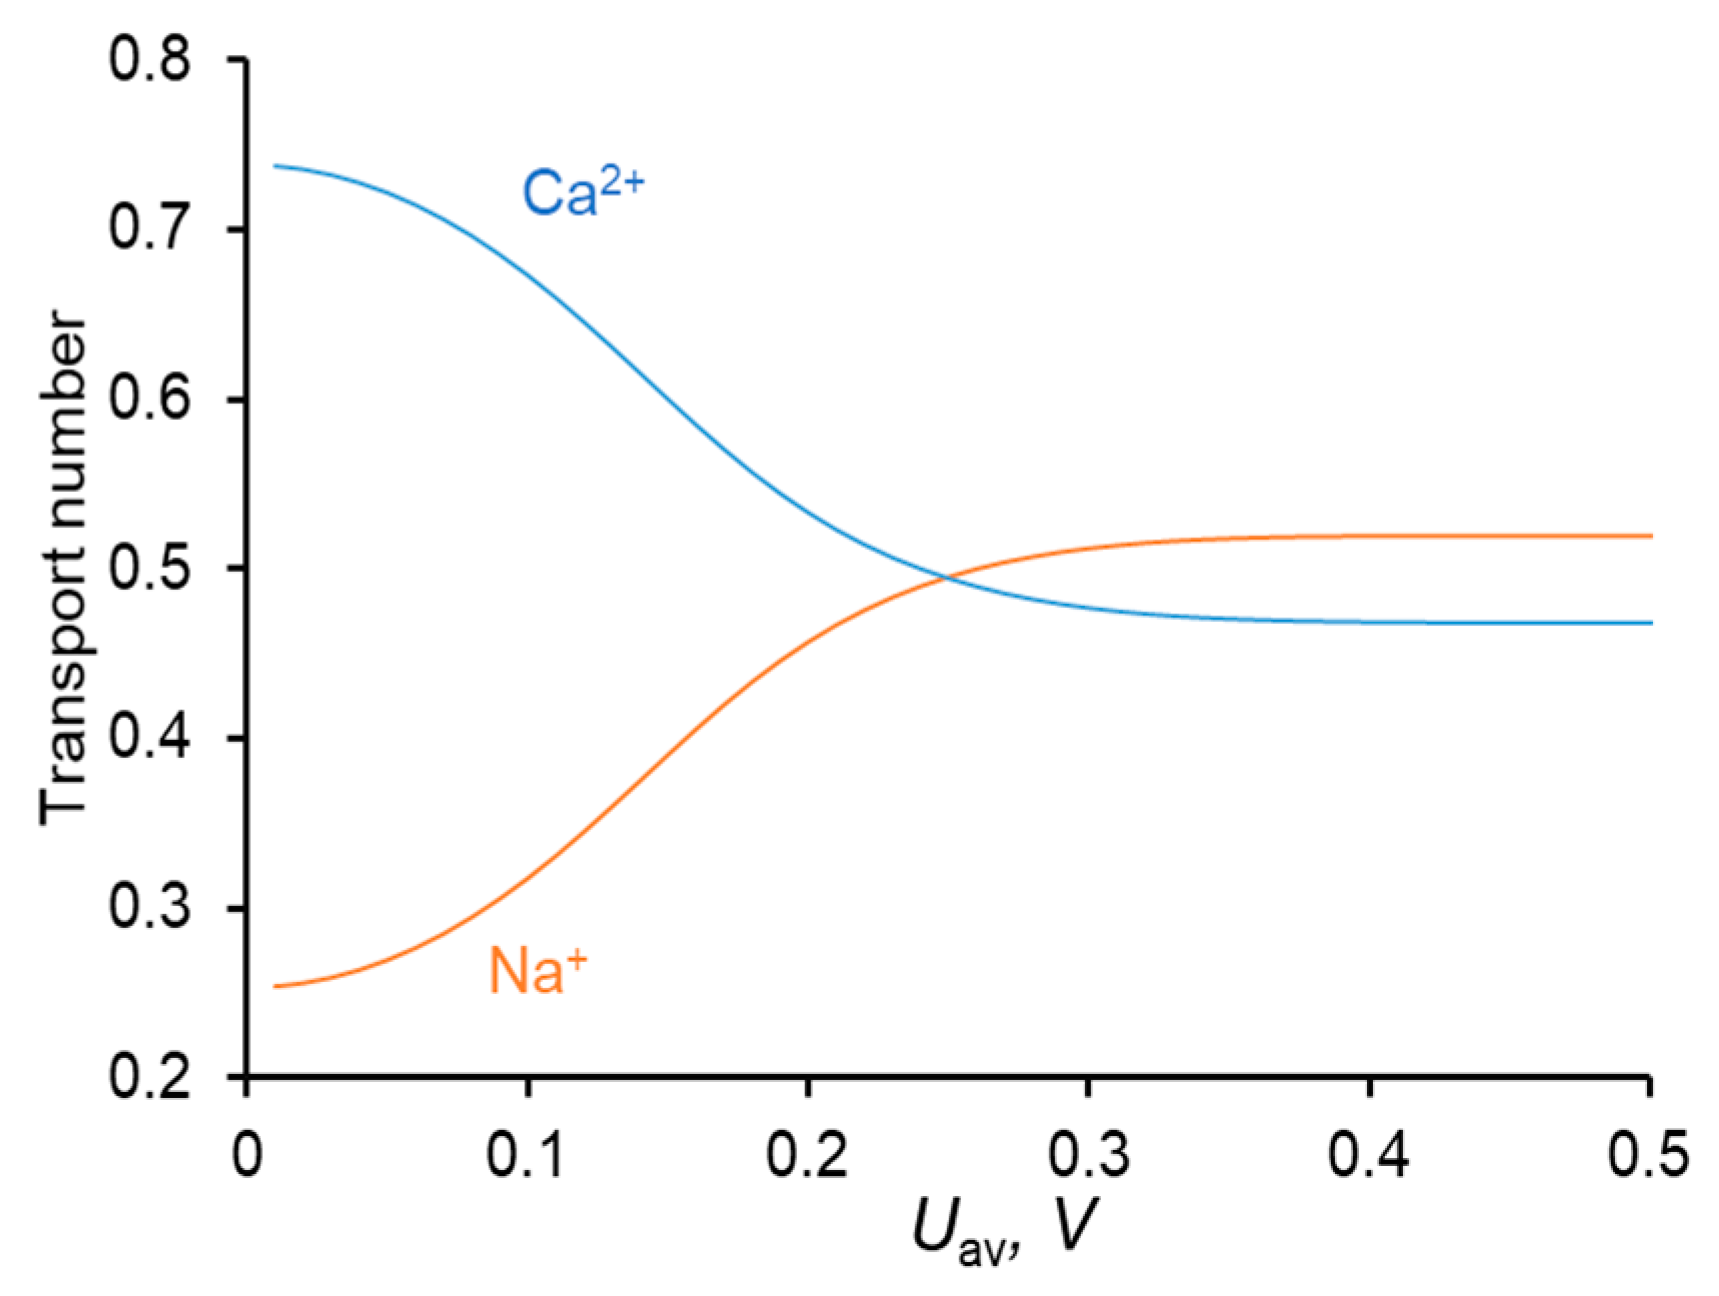
| Uav, mV | iav/ilim | TCa:TNa | TCl | ||||||
|---|---|---|---|---|---|---|---|---|---|
| f = 0 | f = 0.5 | f = 10 | f = 0 | f = 0.5 | f = 10 | f = 0 | f = 0.5 | f = 10 | |
| 111 | 0.3 | 0.303 | 0.307 | 0.646:0.345 | 0.629:0.363 | 0.639:0.352 | 0.0092 | 0.0085 | 0.0085 |
| 150 | 0.4 | 0.428 | 0.437 | 0.593:0.398 | 0.559:0.432 | 0.569:0.422 | 0.0093 | 0.0086 | 0.0086 |
| 238 | 0.65 | 0.678 | 0.720 | 0.501:0.490 | 0.485:0.506 | 0.482:0.508 | 0.0098 | 0.0092 | 0.0094 |
Publisher’s Note: MDPI stays neutral with regard to jurisdictional claims in published maps and institutional affiliations. |
© 2021 by the authors. Licensee MDPI, Basel, Switzerland. This article is an open access article distributed under the terms and conditions of the Creative Commons Attribution (CC BY) license (http://creativecommons.org/licenses/by/4.0/).
Share and Cite
Gorobchenko, A.; Mareev, S.; Nikonenko, V. Mathematical Modeling of the Effect of Pulsed Electric Field on the Specific Permselectivity of Ion-Exchange Membranes. Membranes 2021, 11, 115. https://doi.org/10.3390/membranes11020115
Gorobchenko A, Mareev S, Nikonenko V. Mathematical Modeling of the Effect of Pulsed Electric Field on the Specific Permselectivity of Ion-Exchange Membranes. Membranes. 2021; 11(2):115. https://doi.org/10.3390/membranes11020115
Chicago/Turabian StyleGorobchenko, Andrey, Semyon Mareev, and Victor Nikonenko. 2021. "Mathematical Modeling of the Effect of Pulsed Electric Field on the Specific Permselectivity of Ion-Exchange Membranes" Membranes 11, no. 2: 115. https://doi.org/10.3390/membranes11020115
APA StyleGorobchenko, A., Mareev, S., & Nikonenko, V. (2021). Mathematical Modeling of the Effect of Pulsed Electric Field on the Specific Permselectivity of Ion-Exchange Membranes. Membranes, 11(2), 115. https://doi.org/10.3390/membranes11020115