3.1. Influence of Copper Ions in Aquaculture Wastewater on DDM Filtration Performance
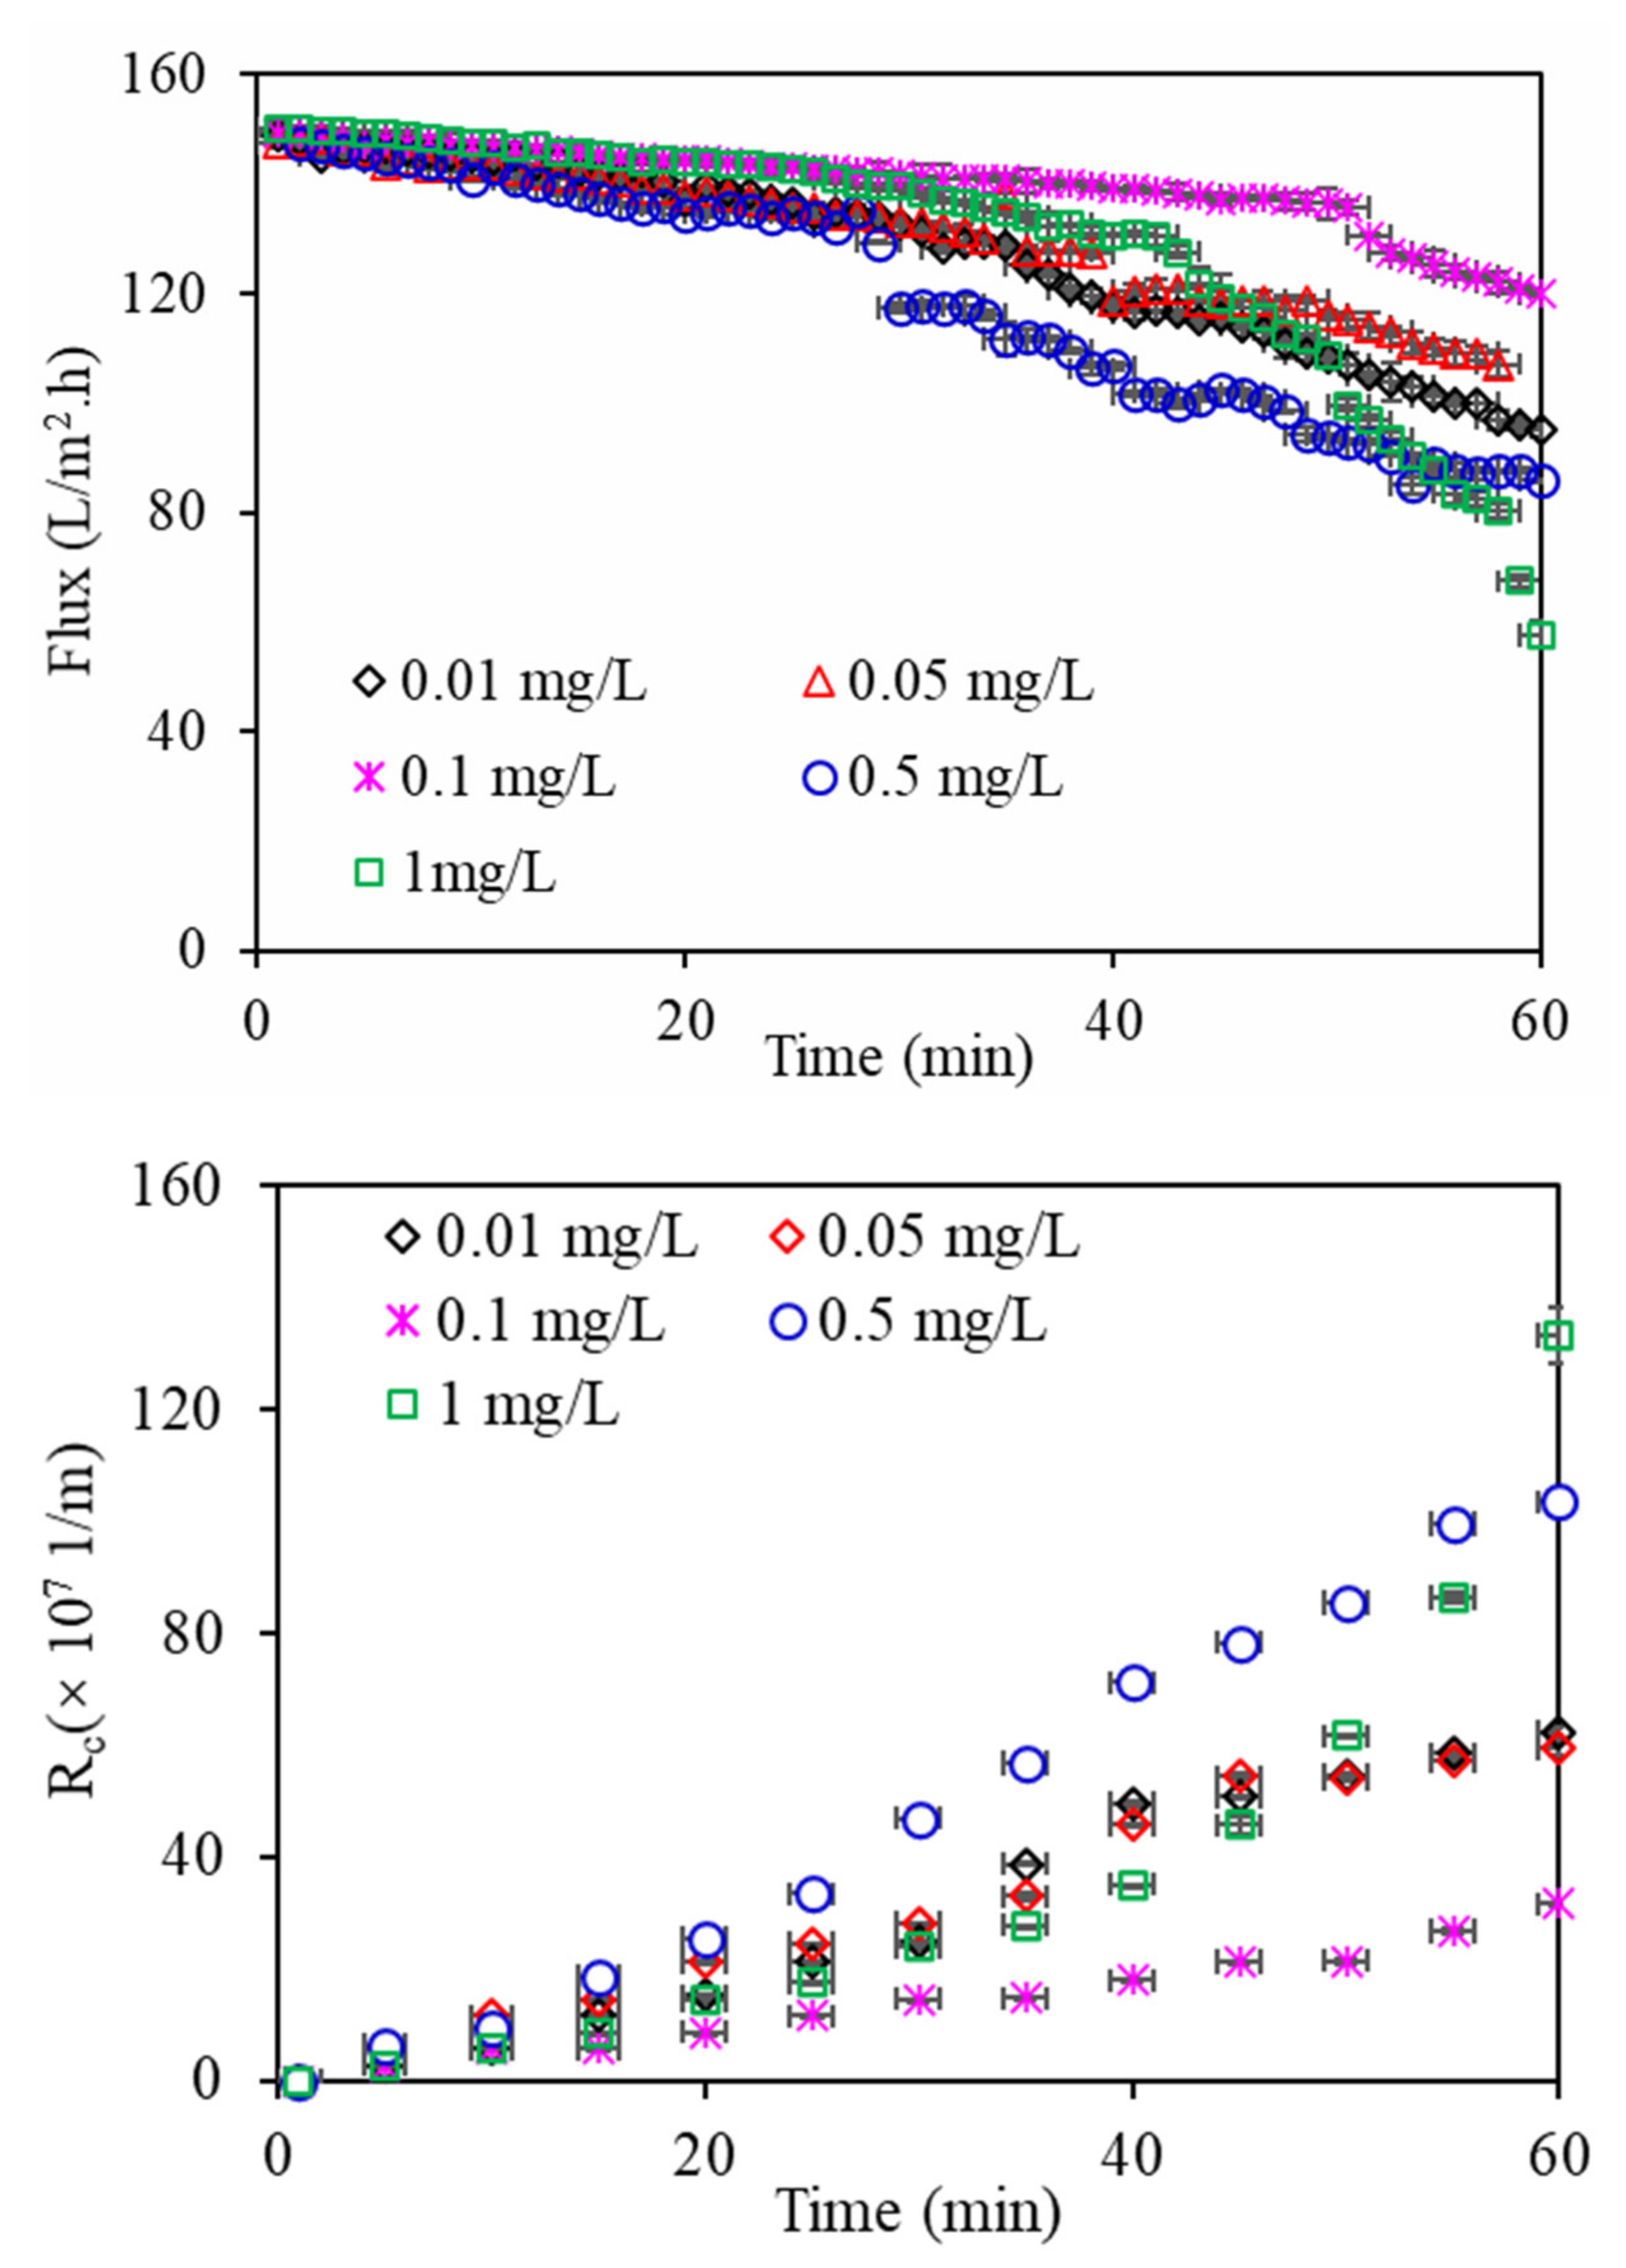
Figure 2 shows the filtration flux changes in the DDM by algae under various copper concentrations. All the filtration flux values of algae declined slowly in the primary filtration process and then rapidly, which can be explained by increased blockage and adjustment of the DDM pore size; however, with increasing filtration time, the algae particles that were bigger than the membrane pore size gradually accumulated on the membrane surface and constituted the algae layer, leading to a significant decrease in filtration flux. In addition, the filtration flux of the DDM changed significantly for all the algae under various copper concentrations. Algae exposed to 0.1 mg/L Cu
2+ had the smallest decline in filtration flux, whereas the filtration flux declined severely with increasing copper concentration, especially at Cu
2+ 1 mg/L, which can be interpretated as the presence of copper ions in aquaculture wastewater influencing microalgal growth during the algal purification of aquaculture wastewater (
Figure S1). It had been accepted that the first flux decrease is related to pore blockage, while the second flux decline is mainly related to cake formation. Algae exposed to 1 mg/L Cu
2+ had the most serious decline, which can be explained that algae exposed to 0.1 mg/L Cu
2+ might form a tighter cake layer on the membrane surface, resulting in higher resistance due to its higher macro molecular organics in EOM. The characteristics of released EOM can also be changed simultaneously, thereby altering their DDM fouling behaviours. Huang et al. investigated the ultrafiltration (UF) fouling behaviour of algal EOM and intracellular organic matter (IOM) of
Microcystis aeruginosa when using UF to treat algae-laden water, and found that both EOM and IOM induced the most serious reductions in filtration flux at the lowest copper concentration of 0.01 μmol/L, followed by EOM at high copper concentrations of 0.3 and 0.1 μmol/L [
21]. This result was slightly different from our observation, which might be explained by the concentration of copper ions as well as the types of algae, membrane and water utilized. Notably, since the algae died in the aquaculture wastewater containing a high copper concentration of 5 mg/L, the filtration flux of algae exposed to 5 mg/L copper was not investigated.
The R
c changes in algae solutions under various copper concentrations were also investigated (
Figure 2). Similar to the flux changes, algae exposed to 0.1 mg/L Cu
2+ had the lowest R
c, followed by 0.05, 0.01, 0.5, and 1 mg/L Cu
2+, indicating that the DDM fouling behaviour can also be affected by the copper concentration in aquaculture wastewater. A relatively high copper ion concentration in aquaculture wastewater causes serious filtration fluxes and a high R
c value, whereas a lower R
c value and decreases in fouling and filtration flux would be induced when algae are present at low copper concentrations. Previous research suggested that R
c can be separated into thickness-increase resistance and compaction resistance [
22]. The support membrane used in this study had an average aperture of 200–300 mesh, equal to a pore size of 75 mm; therefore, the filtration resistance of the support mesh could be ignored, while the thickness of DDM was much thicker than the cake layer formed by algae on the membrane. The discrepancies of R
c thus originate either from the thickness-increase resistance in the primary filtration process and/or the compaction resistance when the shear force was greater than the drag force for large particle surfaces. Notably, since there were great discrepancies between the experimental R
c values on the membrane surface and the hydraulic resistance calculated by the Kozeny–Carman equation according to previous research [
23], the filtration process using new osmotic pressure theory needs to be further investigated.
Moreover, it was found that during the whole dewatering process, no membrane fractures occurred for any of the algae under various copper concentrations (
Figure S2), which was in contrast with the results of Chu et al. [
22], suggesting that the cylindrical sintered PE filter tube used in this study is much more superior in stability as a support than the stainless steel support mesh, as previous research indicated.
3.3. Organic Removal of EOM under Various Copper Concentrations by DDM
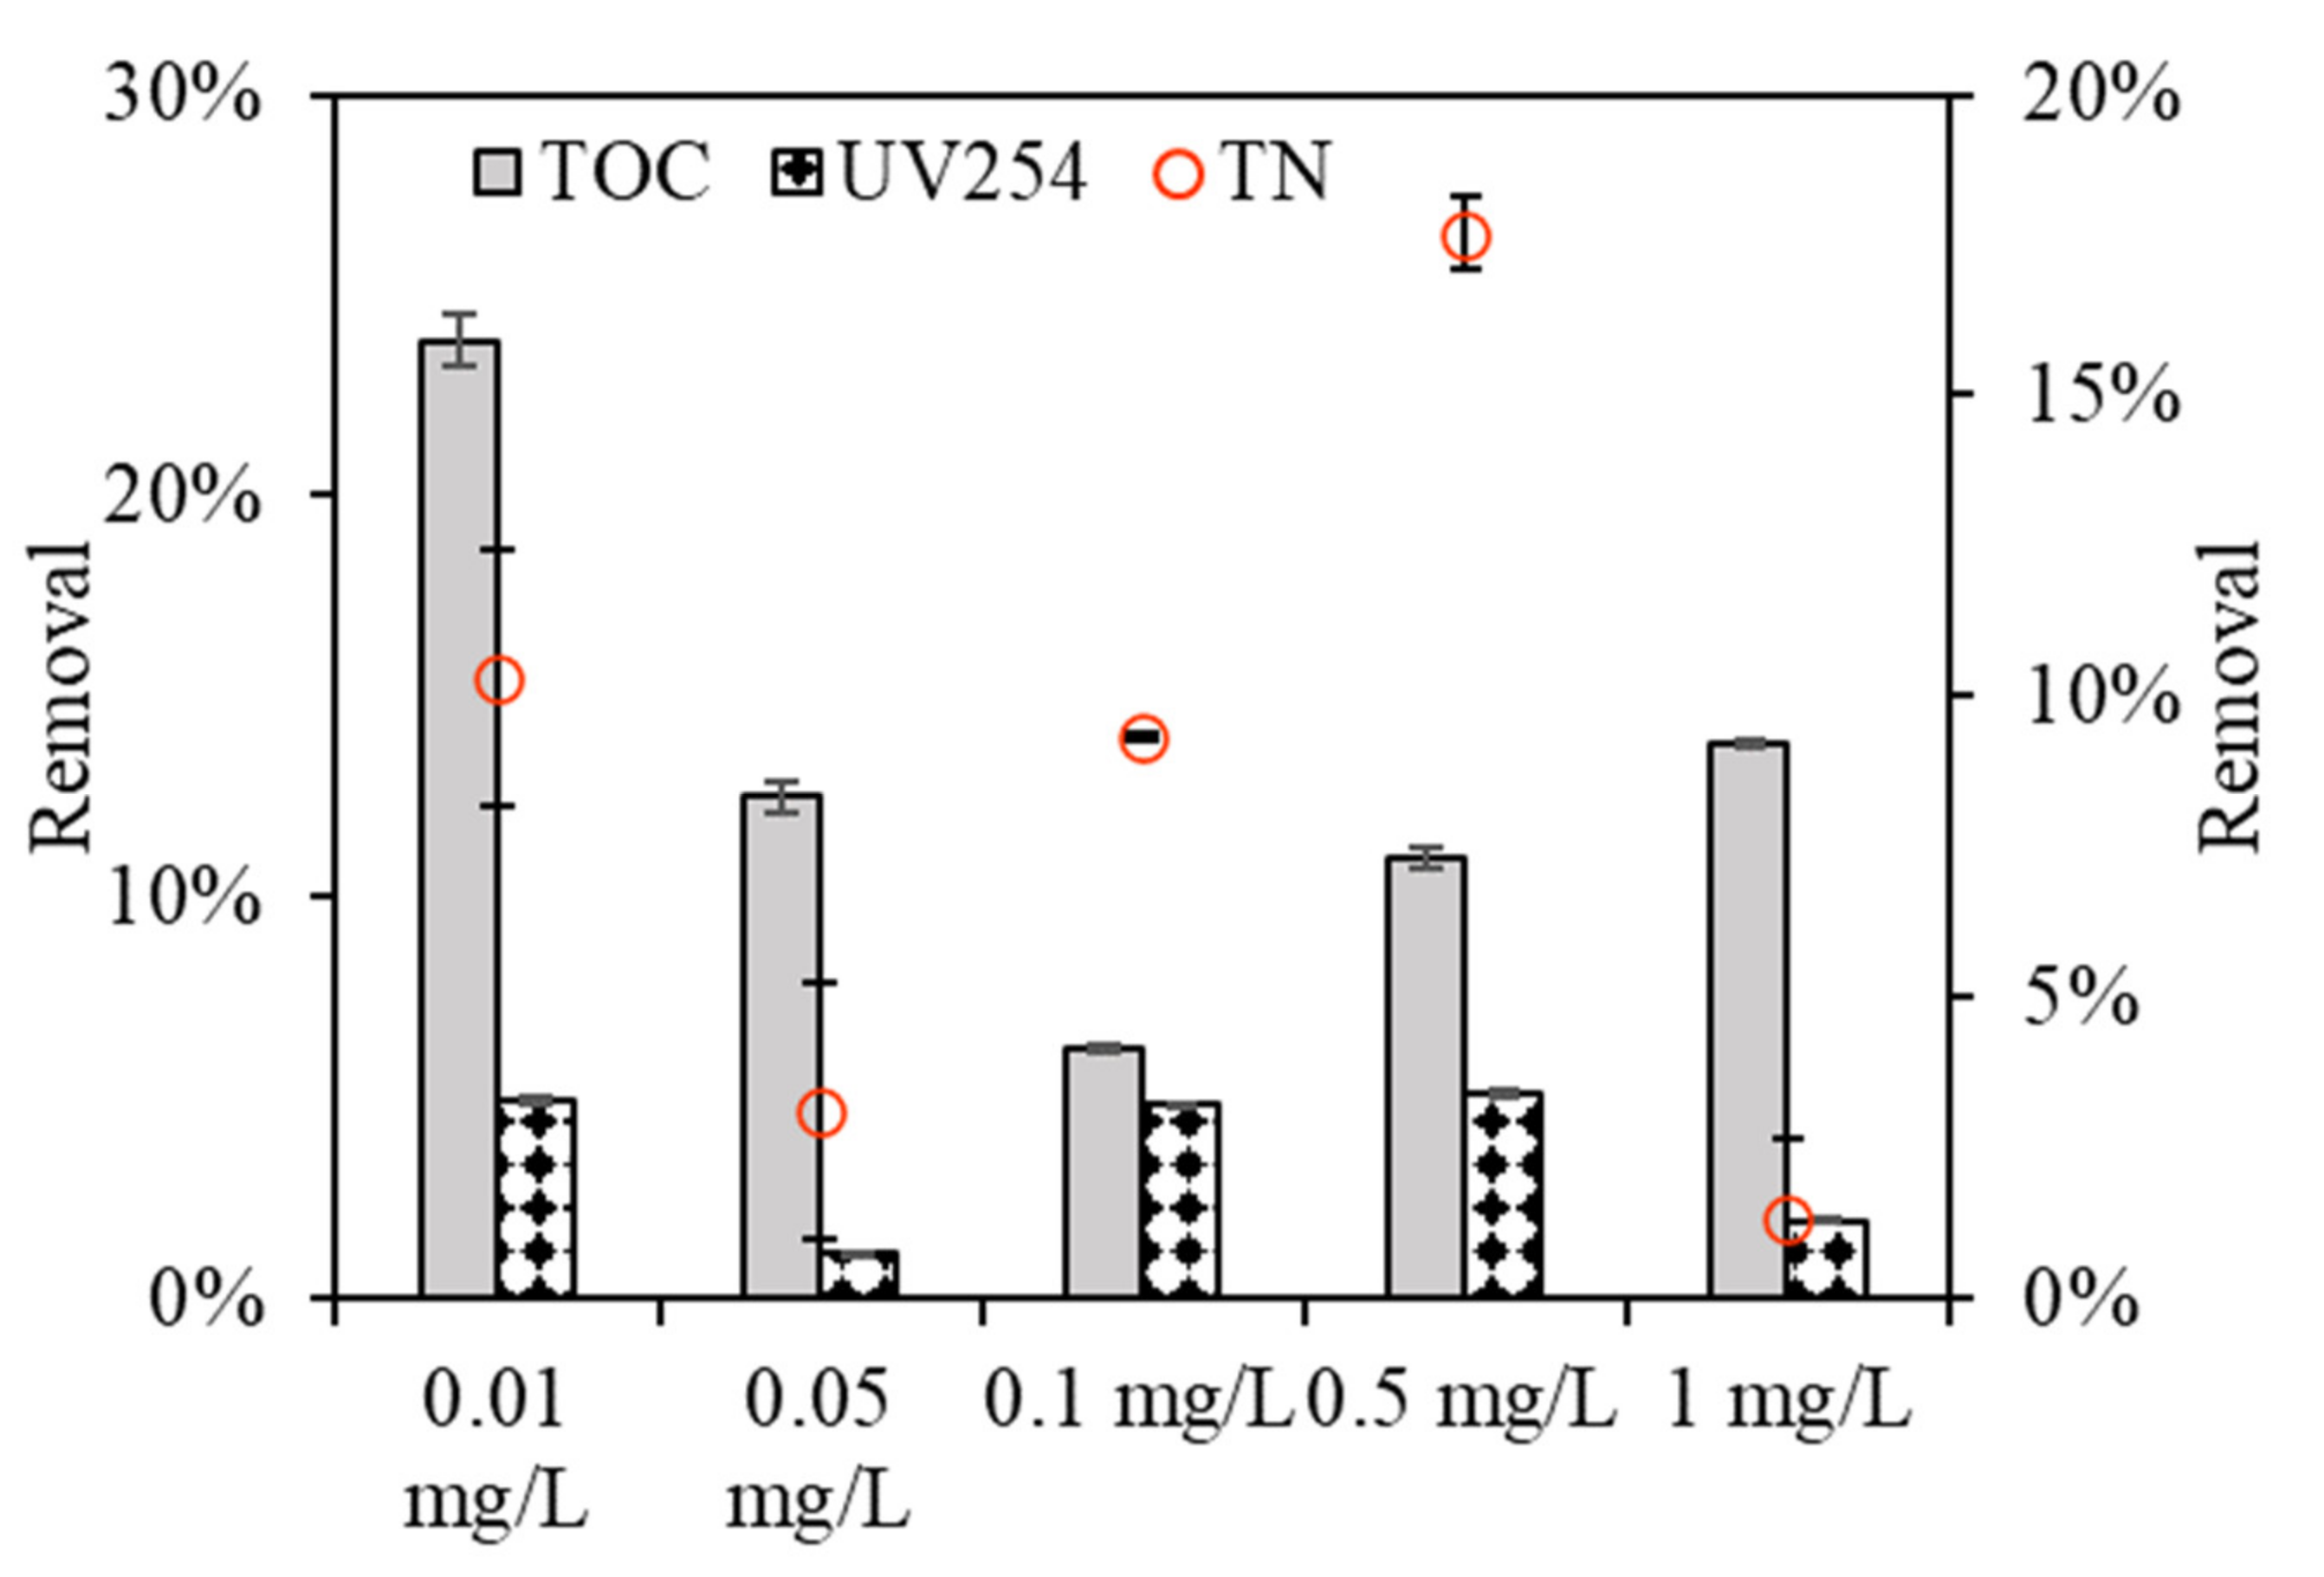
Figure 4 depicts the organic rejection of algae by the DDM with various copper concentrations. Algae exposed to 0.1 mg/L copper had relatively low TOC removals, with removal efficiencies of 6.21%, compared to removal efficiencies of 23.88%, 12.5%, and 10.96%, and 13.84% for algae exposed to 0.01, 0.05, and 0.5 and 1 mg/L copper, respectively, which had some discrepancies with their DDM filtration fluxes (
Figure 2). This phenomenon can explained be the fact that the support membrane used in this study had an average aperture of 200–300 mesh, equal to a pore size of 75 mm, despite the diatomite layer and algae layer which form during DDM dewatering, as only part of the macro-organic matter can be rejected, whereas most of the organics permeated (please see
Table S1 in the supporting information), and the rejection rate was low. Notably, all the UV
254 rejections were lower for EOM than TOC removals under various copper concentrations, and the relatively low UV
254 reduction by DDM filtration suggests that UV-absorbing organics are much more difficult to reject using DDMs.
From the TN rejections during DDM filtration, it was found that DDM exhibited high nitrogen removal when algae was exposed to a low copper concentration of 0.01 mg/L; however, the removal efficiency decreased with increasing copper concentration, and the removal efficiency was 9.5%, 5.2%, 1.2%, 0.6%, and 2.7% for algae exposed to 0.01, 0.05, 0.1, 0.5, and 1 mg/L copper, respectively, implying that DDM filtration also had extremely different TN rejection rates when algae was exposed to various copper concentrations. Zhang et al. investigated the structure and effect of dynamic membranes in a dynamic membrane bioreactor and found that the average TN removal rate was 6% [
26]. The diversity of TN rejections by DDM filtration lies in the rejections of algae and associated organic matter, thus leading to the variation in inorganic matter retention.
3.4. Analysis of EOM Characteristics during Aquaculture Wastewater Purification
Bound and dissolved EOM released by algae are considered the main causes of membrane fouling, and filterability declines as the EOM content increases [
27].
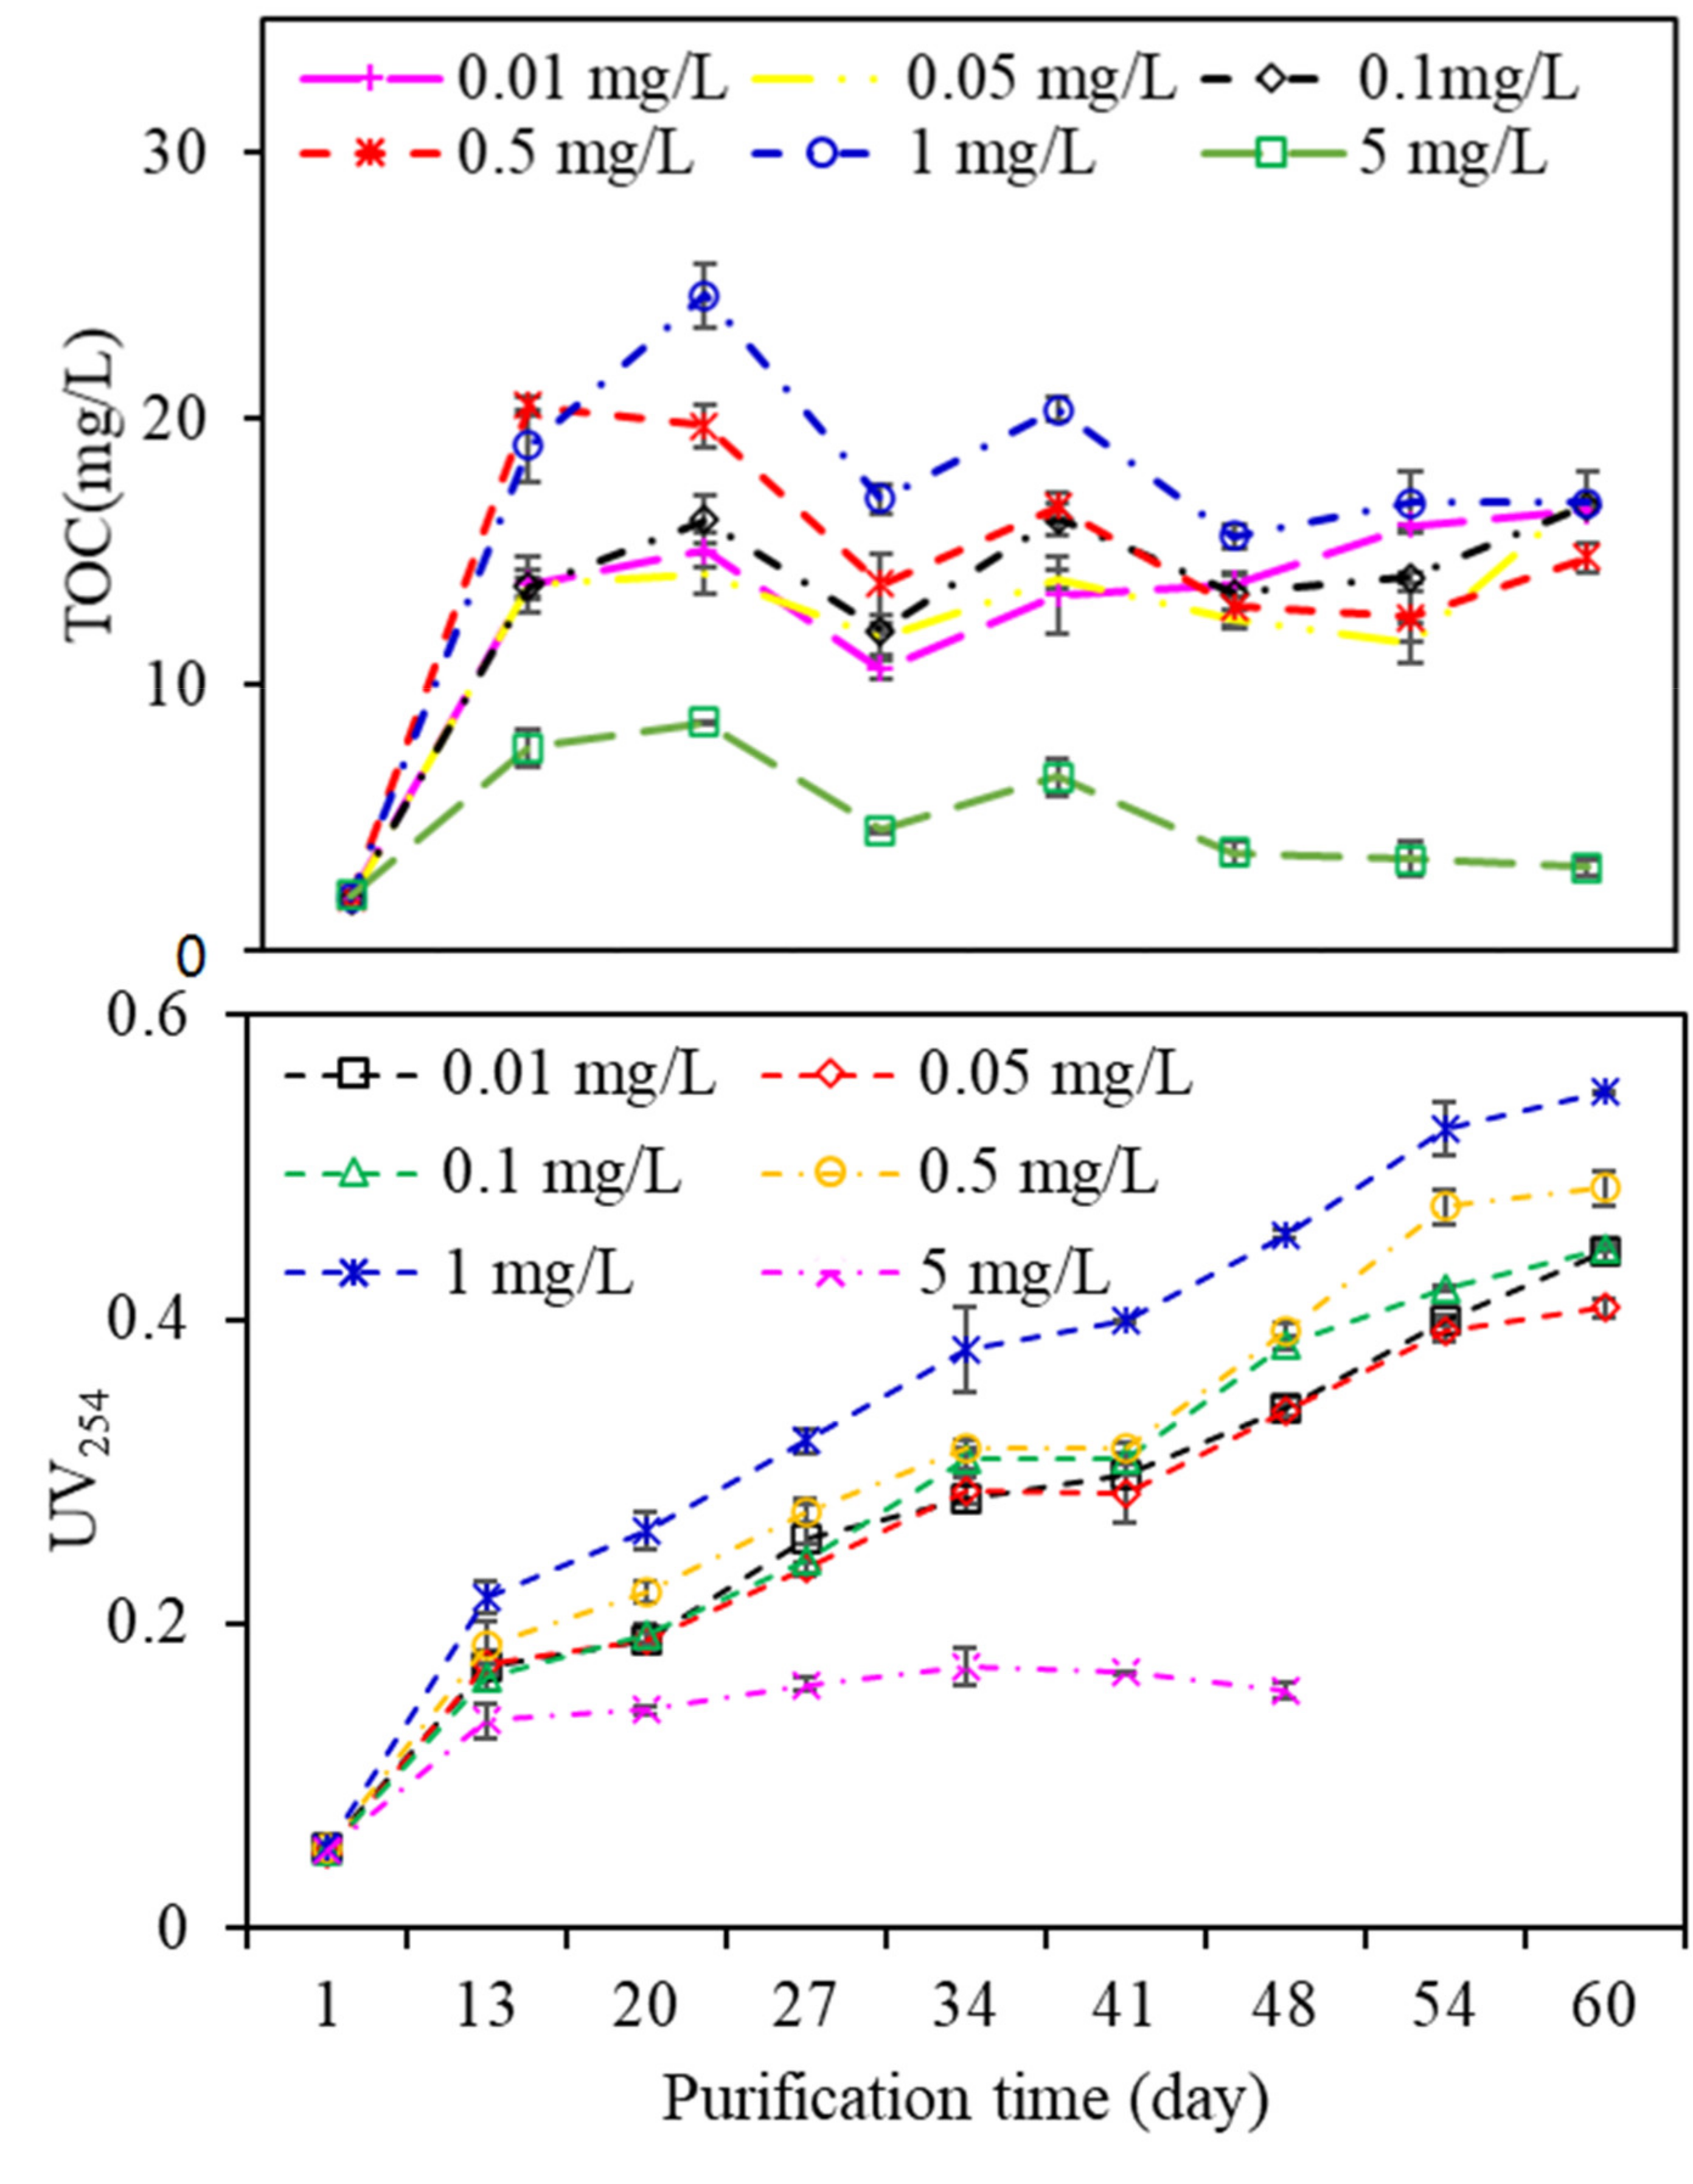
Figure 5 shows the fluctuations in TOC and UV
254 during the wastewater purification process. All the TOC and UV
254 values increased gradually, except for that of algae exposed to 5 mg/L copper, while there were great fluctuations in TOC and UV
254 values among EOM from algae exposed to other copper concentrations. EOM with 1 mg/L copper exposure had the highest TOC content during the purification process, followed by 0.5, 0.1, 0.05, and 0.01 mg/L copper, which was extremely different from that of algal growth in
Figure S1; that is, algae exposed to a low copper concentration (0.01 mg/L) had the highest growth rate, whereas the algal growth gradually decreased with increasing copper concentrations, especially when the copper concentration reached 5 mg/L, at which the algae died after growing for a period of time. This phenomenon can be explained by the fact that microscale copper ions are vital for algae metabolism, but are toxic at high concentrations. Since copper ions are a strong inhibitor of cell metabolism, during long-term resistance, algae have established a series of adaptive mechanisms, such as combining with heavy metals through extracellular components, synthesizing metal-binding proteins or polypeptides, and combining with relevant ligands in algal cells [
28]. EOM exposed to 1 mg/L copper had the highest UV
254 value, whereas the lowest UV
254 value occurred in the EOM subjected to 0.01 mg/L copper, suggesting that although a high copper concentration in aquaculture wastewater did not facilitate the growth of algae, the total organic matter as well as UV-absorbing substances are preferably released during the algal purification process, which subsequently leads to the observed influence on DDM filtration.
As shown in
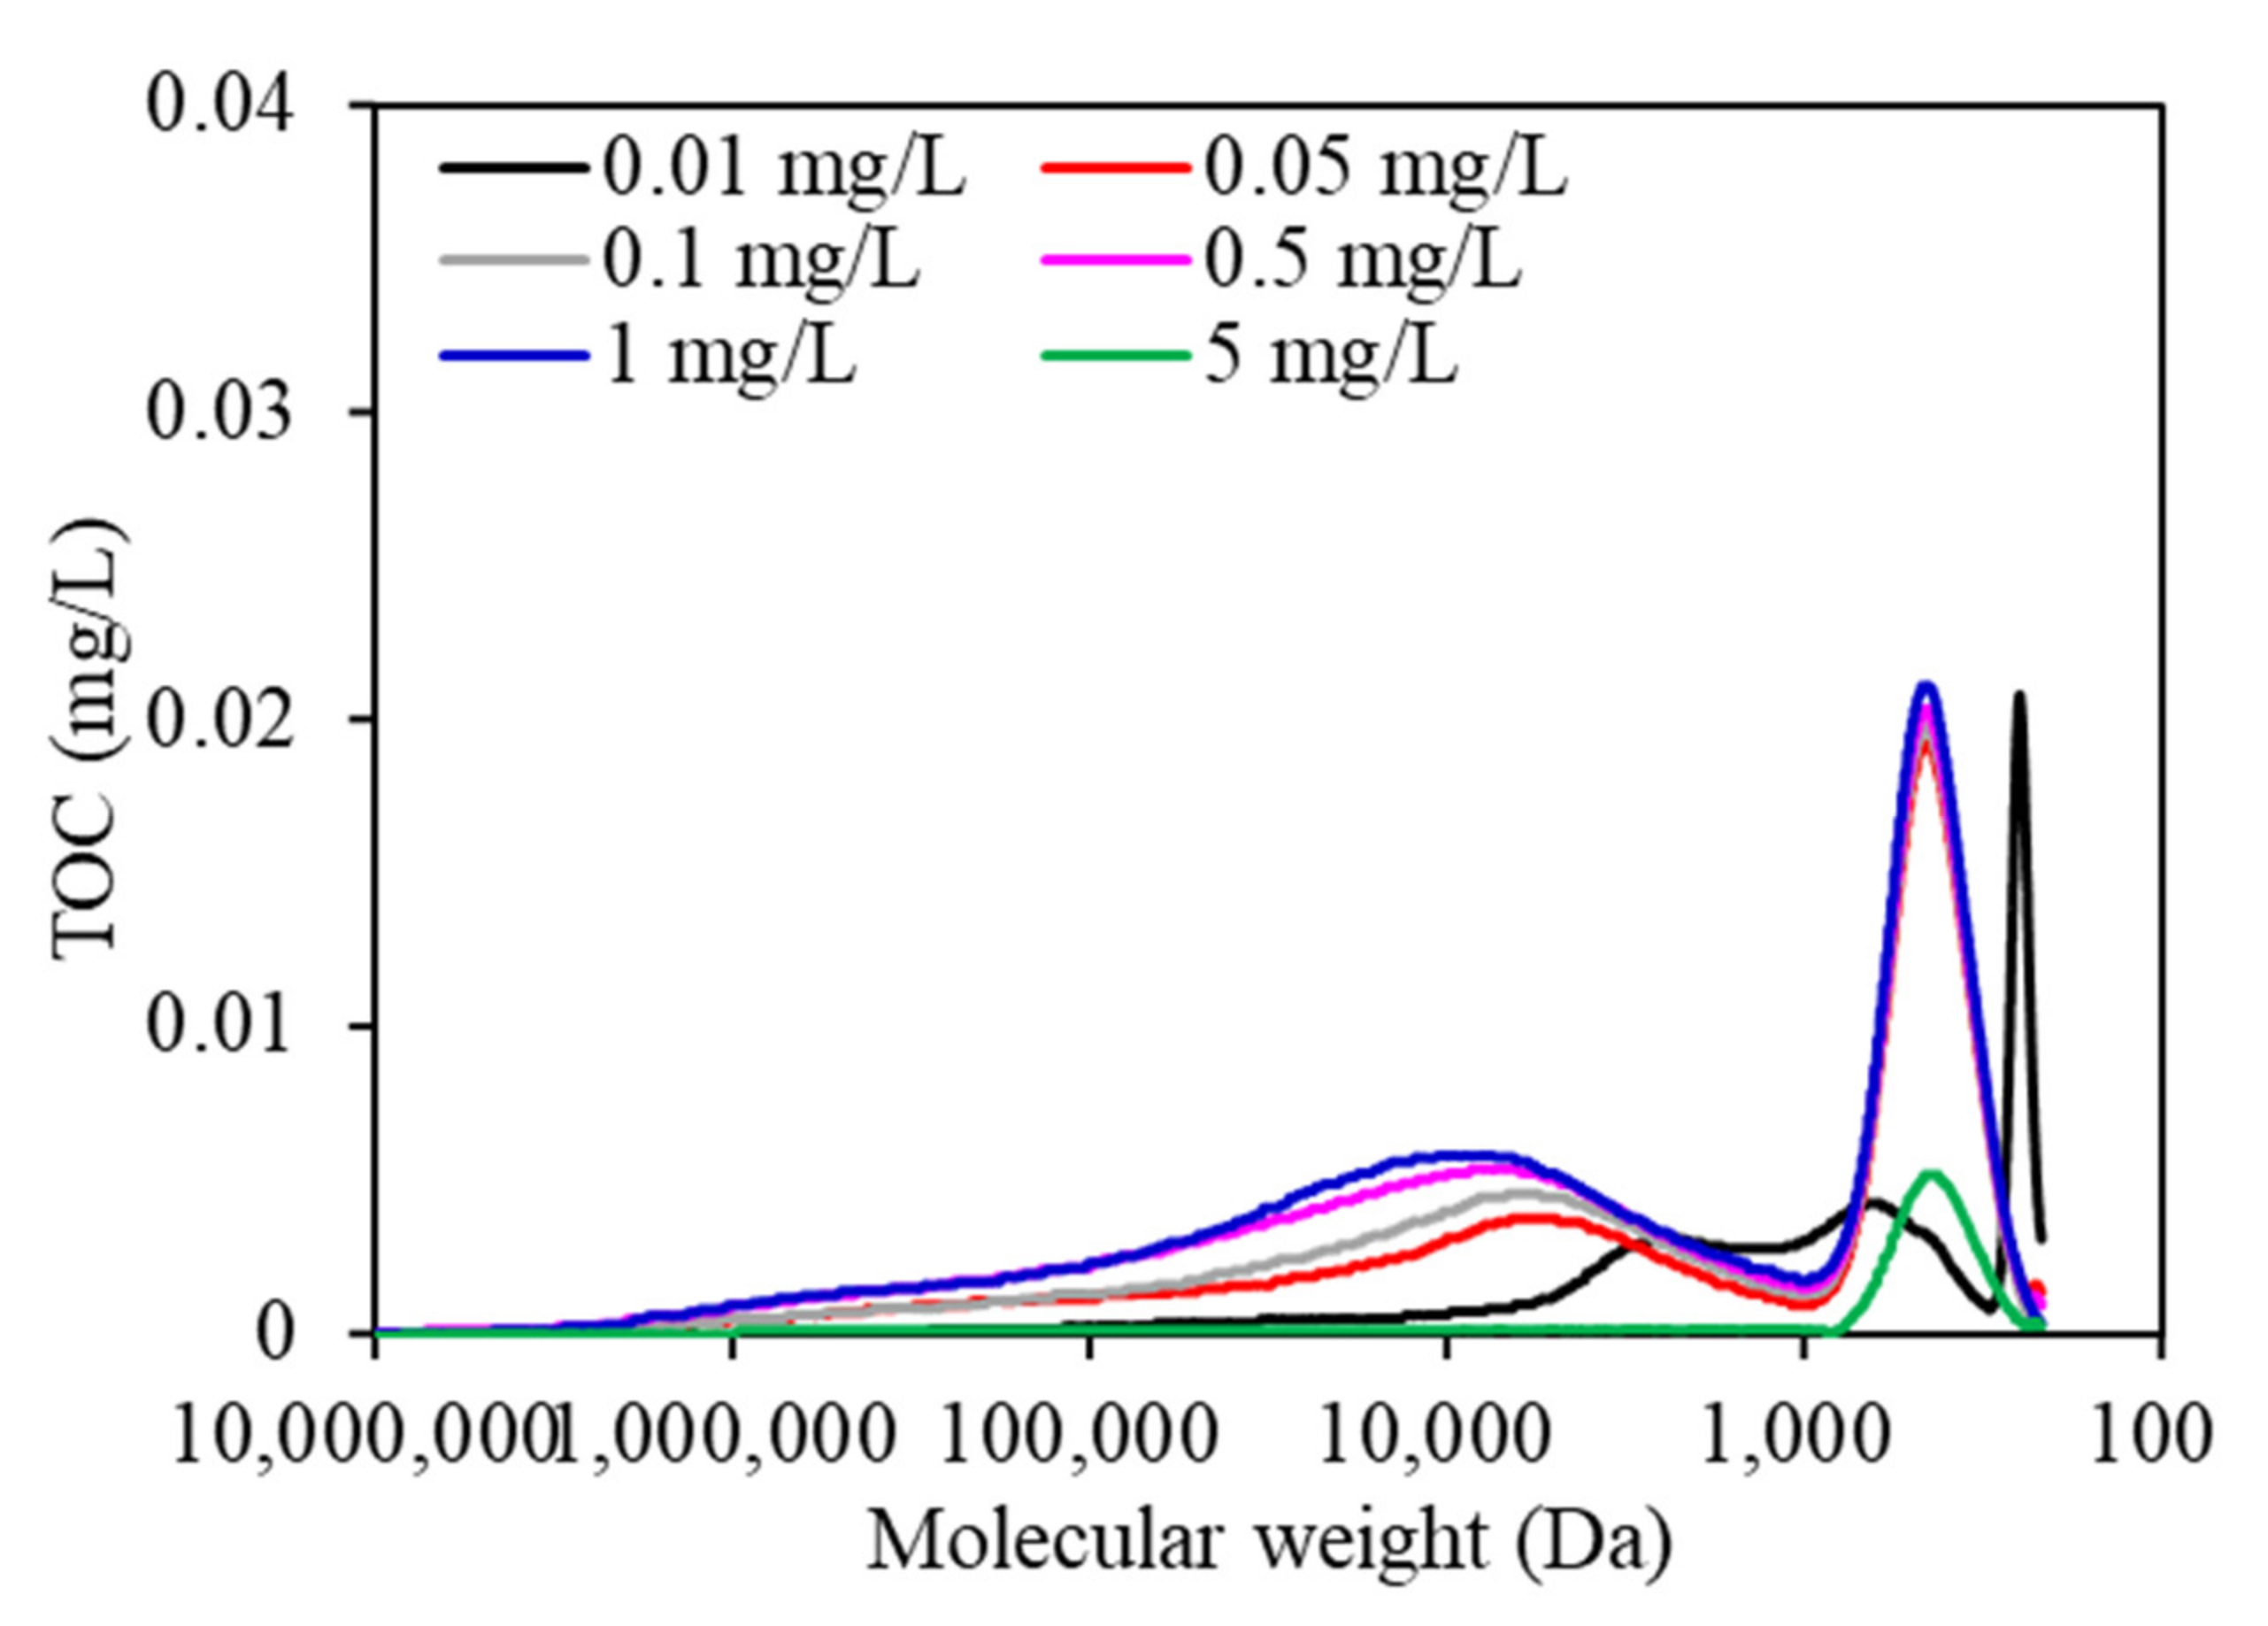
Figure 6, the MW distribution of EOM during the whole wastewater purification process changed significantly. Three peaks were found for all EOM samples according to TOC chromatography. Peak A, which had a high TOC peak area, was reported to be associated with biopolymers (i.e., polysaccharides, proteins, or amino sugars), and peak B and peak C were associated with humic-like substances (HSs) and building blocks of low-MW acids and humic acids, respectively [
29]. EOM exposed to 1 mg/L copper had the highest TOC peak areas, followed by that exposed to 0.5, 0.1, 0.05, 0.01, and 5 mg/L copper, whereas the TOC peak areas in low-MW regions demonstrated similar trends, with the TOC peaks in EOM subjected to 1 mg/L copper being the highest, followed by 0.5 > 0.1 > 0.05 > 0.01 mg/L copper, suggesting that the organic composition of EOM can also be changed when aquaculture wastewater contains various copper concentrations during the purification process. More macromolecular and small-molecule organics, such as proteins, polysaccharides or amino sugars, and HSs were more likely to be synthesized in EOM when aquaculture wastewater contained copper at a high concentration, which leads to serious membrane fouling following DDM filtration (
Figure 2), whereas fewer macromolecular and small-molecule organics were synthesized when algae were exposed to low copper concentrations of 0.01 and 0.05 mg/L. Xi et al. studied the effects of copper ions on the protein, polysaccharide, and malondialdehyde (MDA) contents of
C. vulgaris, and found that copper ions at low concentrations had obvious effects on intracellular polysaccharide secretion; however, the membrane structure can be severely damaged at high copper concentrations, which leads to an increase in membrane permeability and penetration of the intracellular electrolyte [
30].
Fluorescent EOM was also reported to contain a large quantity of aromatic constructions and unsaturated fatty chains with different kinds of fluorescent functional groups [
31]. Previous research suggested that fluorescent EOM can be utilized for the analysis of membrane foulants, which provided specific information on protein and HSs or fulvic-like substances [
29].
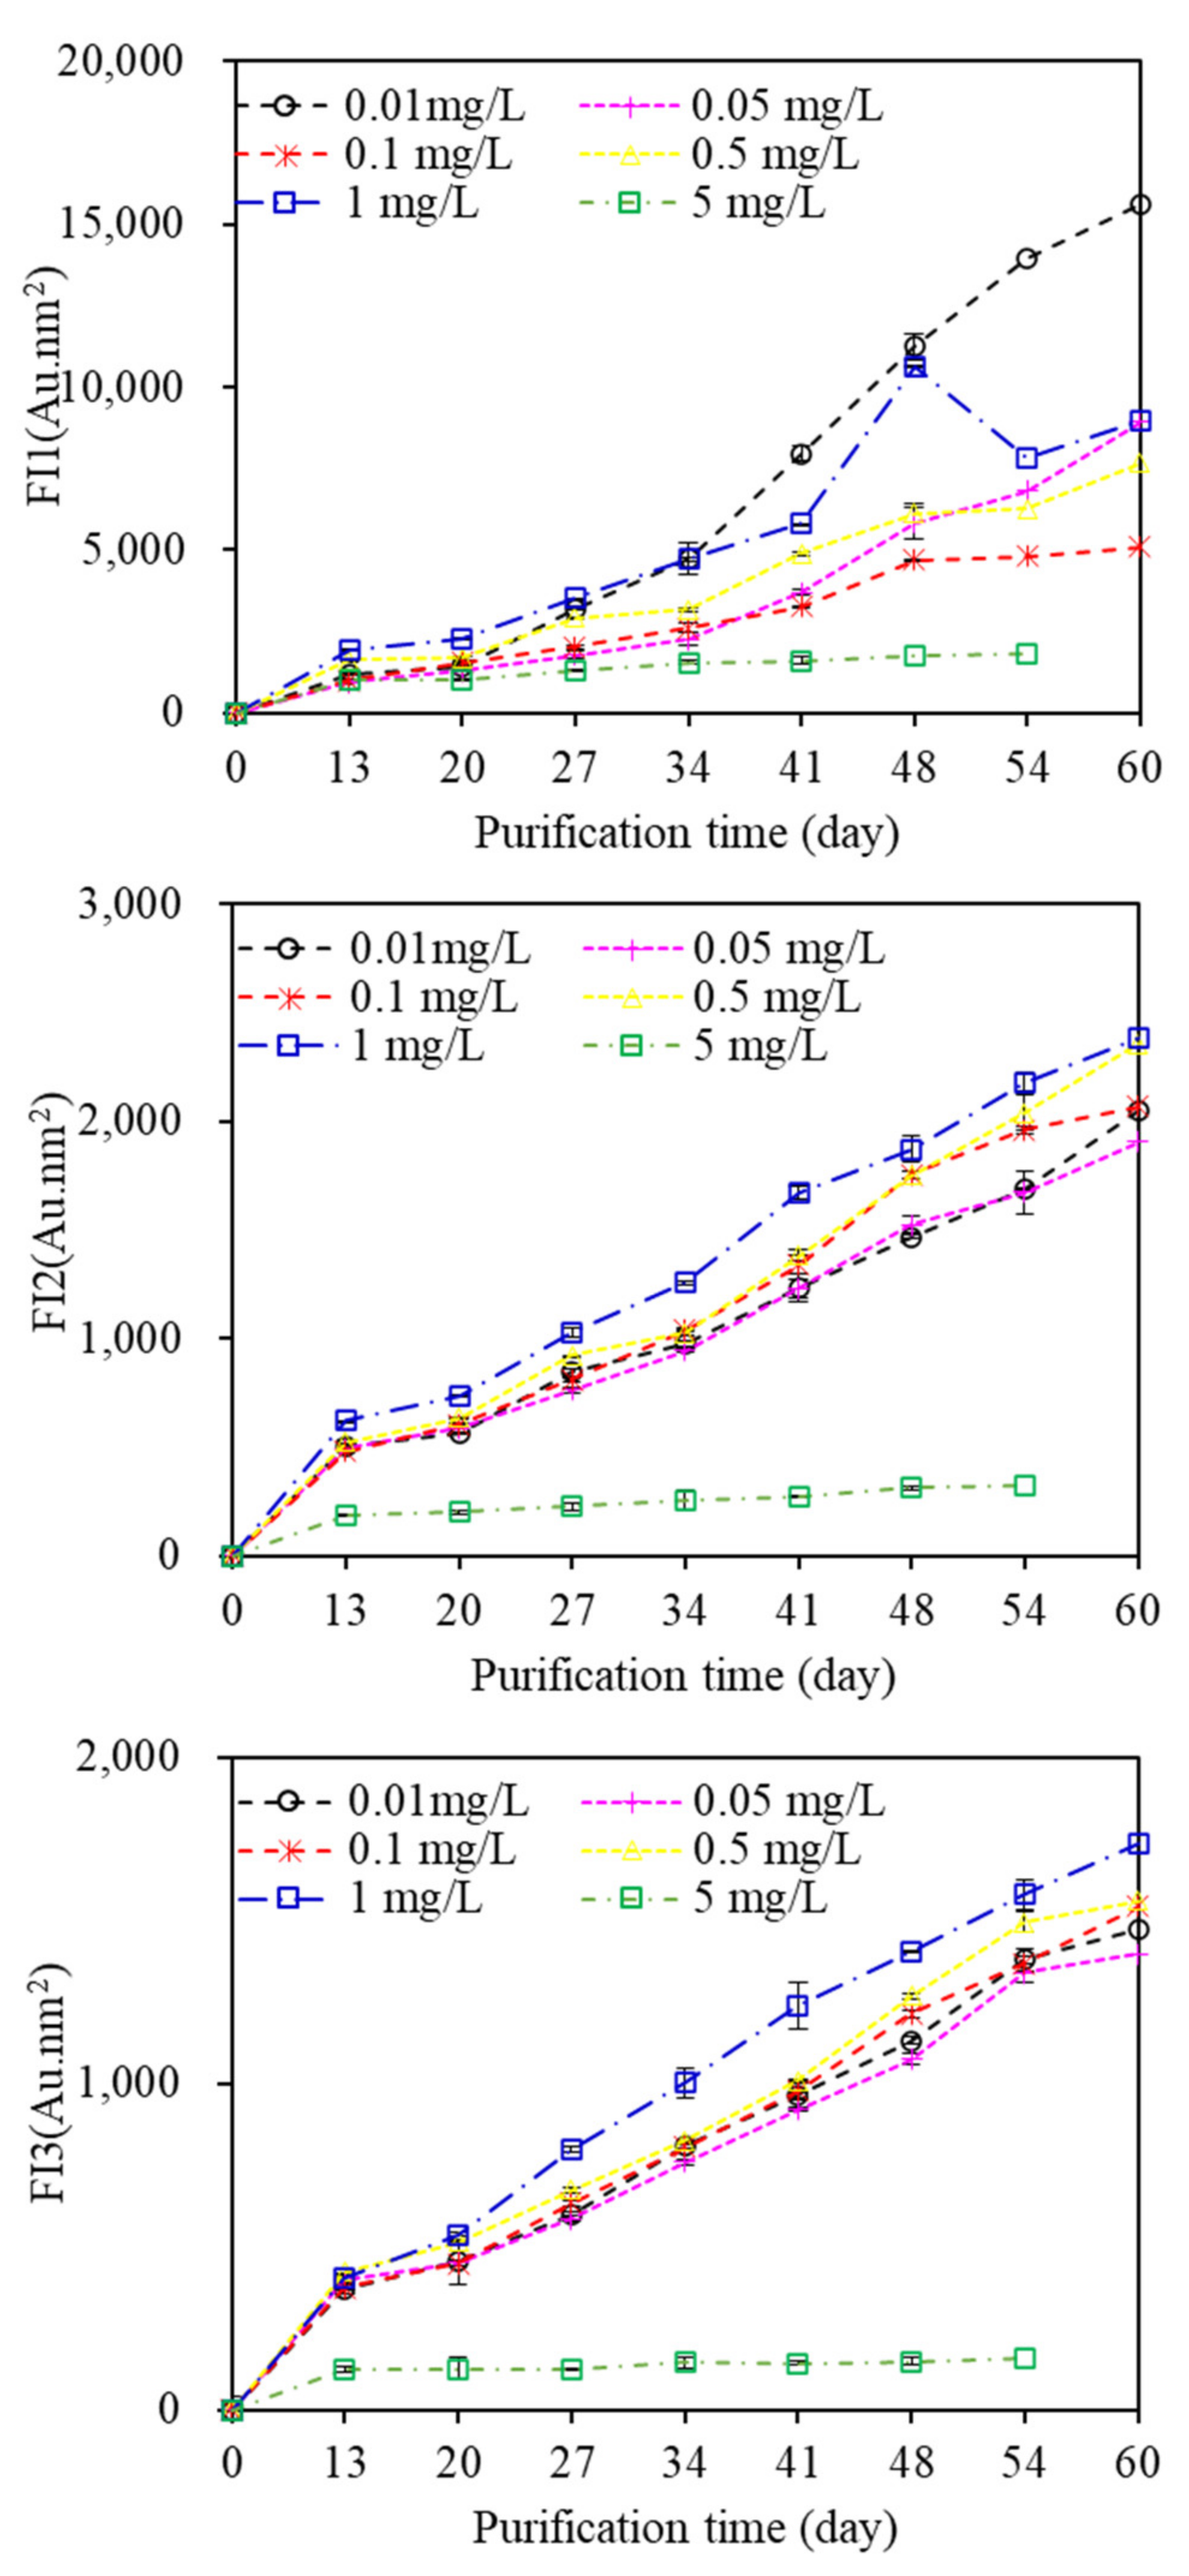
Figure S3 displays the EEM spectra of EOM during the aquaculture wastewater purification process. Three fluorescent components can be identified through EEM-PARAFAC. Component 1, which had maxima at Em and Ex wavelengths of 330 and 275 nm, respectively, represented protein-like fluorescence (tryptophans); component 2, which exhibited maxima at Ex and Em wavelengths of 250 and 325/385 nm, respectively, indicated HS fluorescence; and component 3 (Ex/Em = 260, 350/450 nm) indicated fulvic acid-like substance fluorescence. The FIs of all components increased gradually with increasing purification time (
Figure 7), indicating that fluorescent organic matter, such as protein and humic acid, constantly migrated to wastewater when algae were utilized to purify the aquaculture wastewater, and there were large differences in the FIs of components among EOM samples exposed to various copper concentrations. Algae exposed to 0.1 mg/L copper had the lowest FI of component 1, whereas the highest FI of component 1 occurred with 0.01 mg/L copper exposure, suggesting that algae exposed to the lowest copper concentration of 0.01 mg/L would release more fluorescent protein-like substances, whereas high copper concentrations promote algae to release fluorescent HSs, which was in line with the observed MW distributions. In addition, the FI of component 1 was much higher than those of components 2 and 3, suggesting that protein-like organics were more likely to be released than HSs during the whole aquaculture wastewater purification process.
From the TN during the purification process (
Figure S4), TN contents in aquaculture wastewater were found to be 64.56, 60.3, 67.86, 66.24, 68.22, and 96 mg/L when algae were exposed to 0.01, 0.05, 0.1, 0.5, and 1 mg/L copper, respectively, at the end of purification, indicating that algae exposed to low copper concentrations were more able to remove TN, which was in accordance with their algal growth (
Figure S1).
3.5. Analysis of Fouling Behaviour during the Algae Dewatering Process by DDM Filtration
Protein-like organics were reported to be major components that would cause serious membrane fouling [
17].
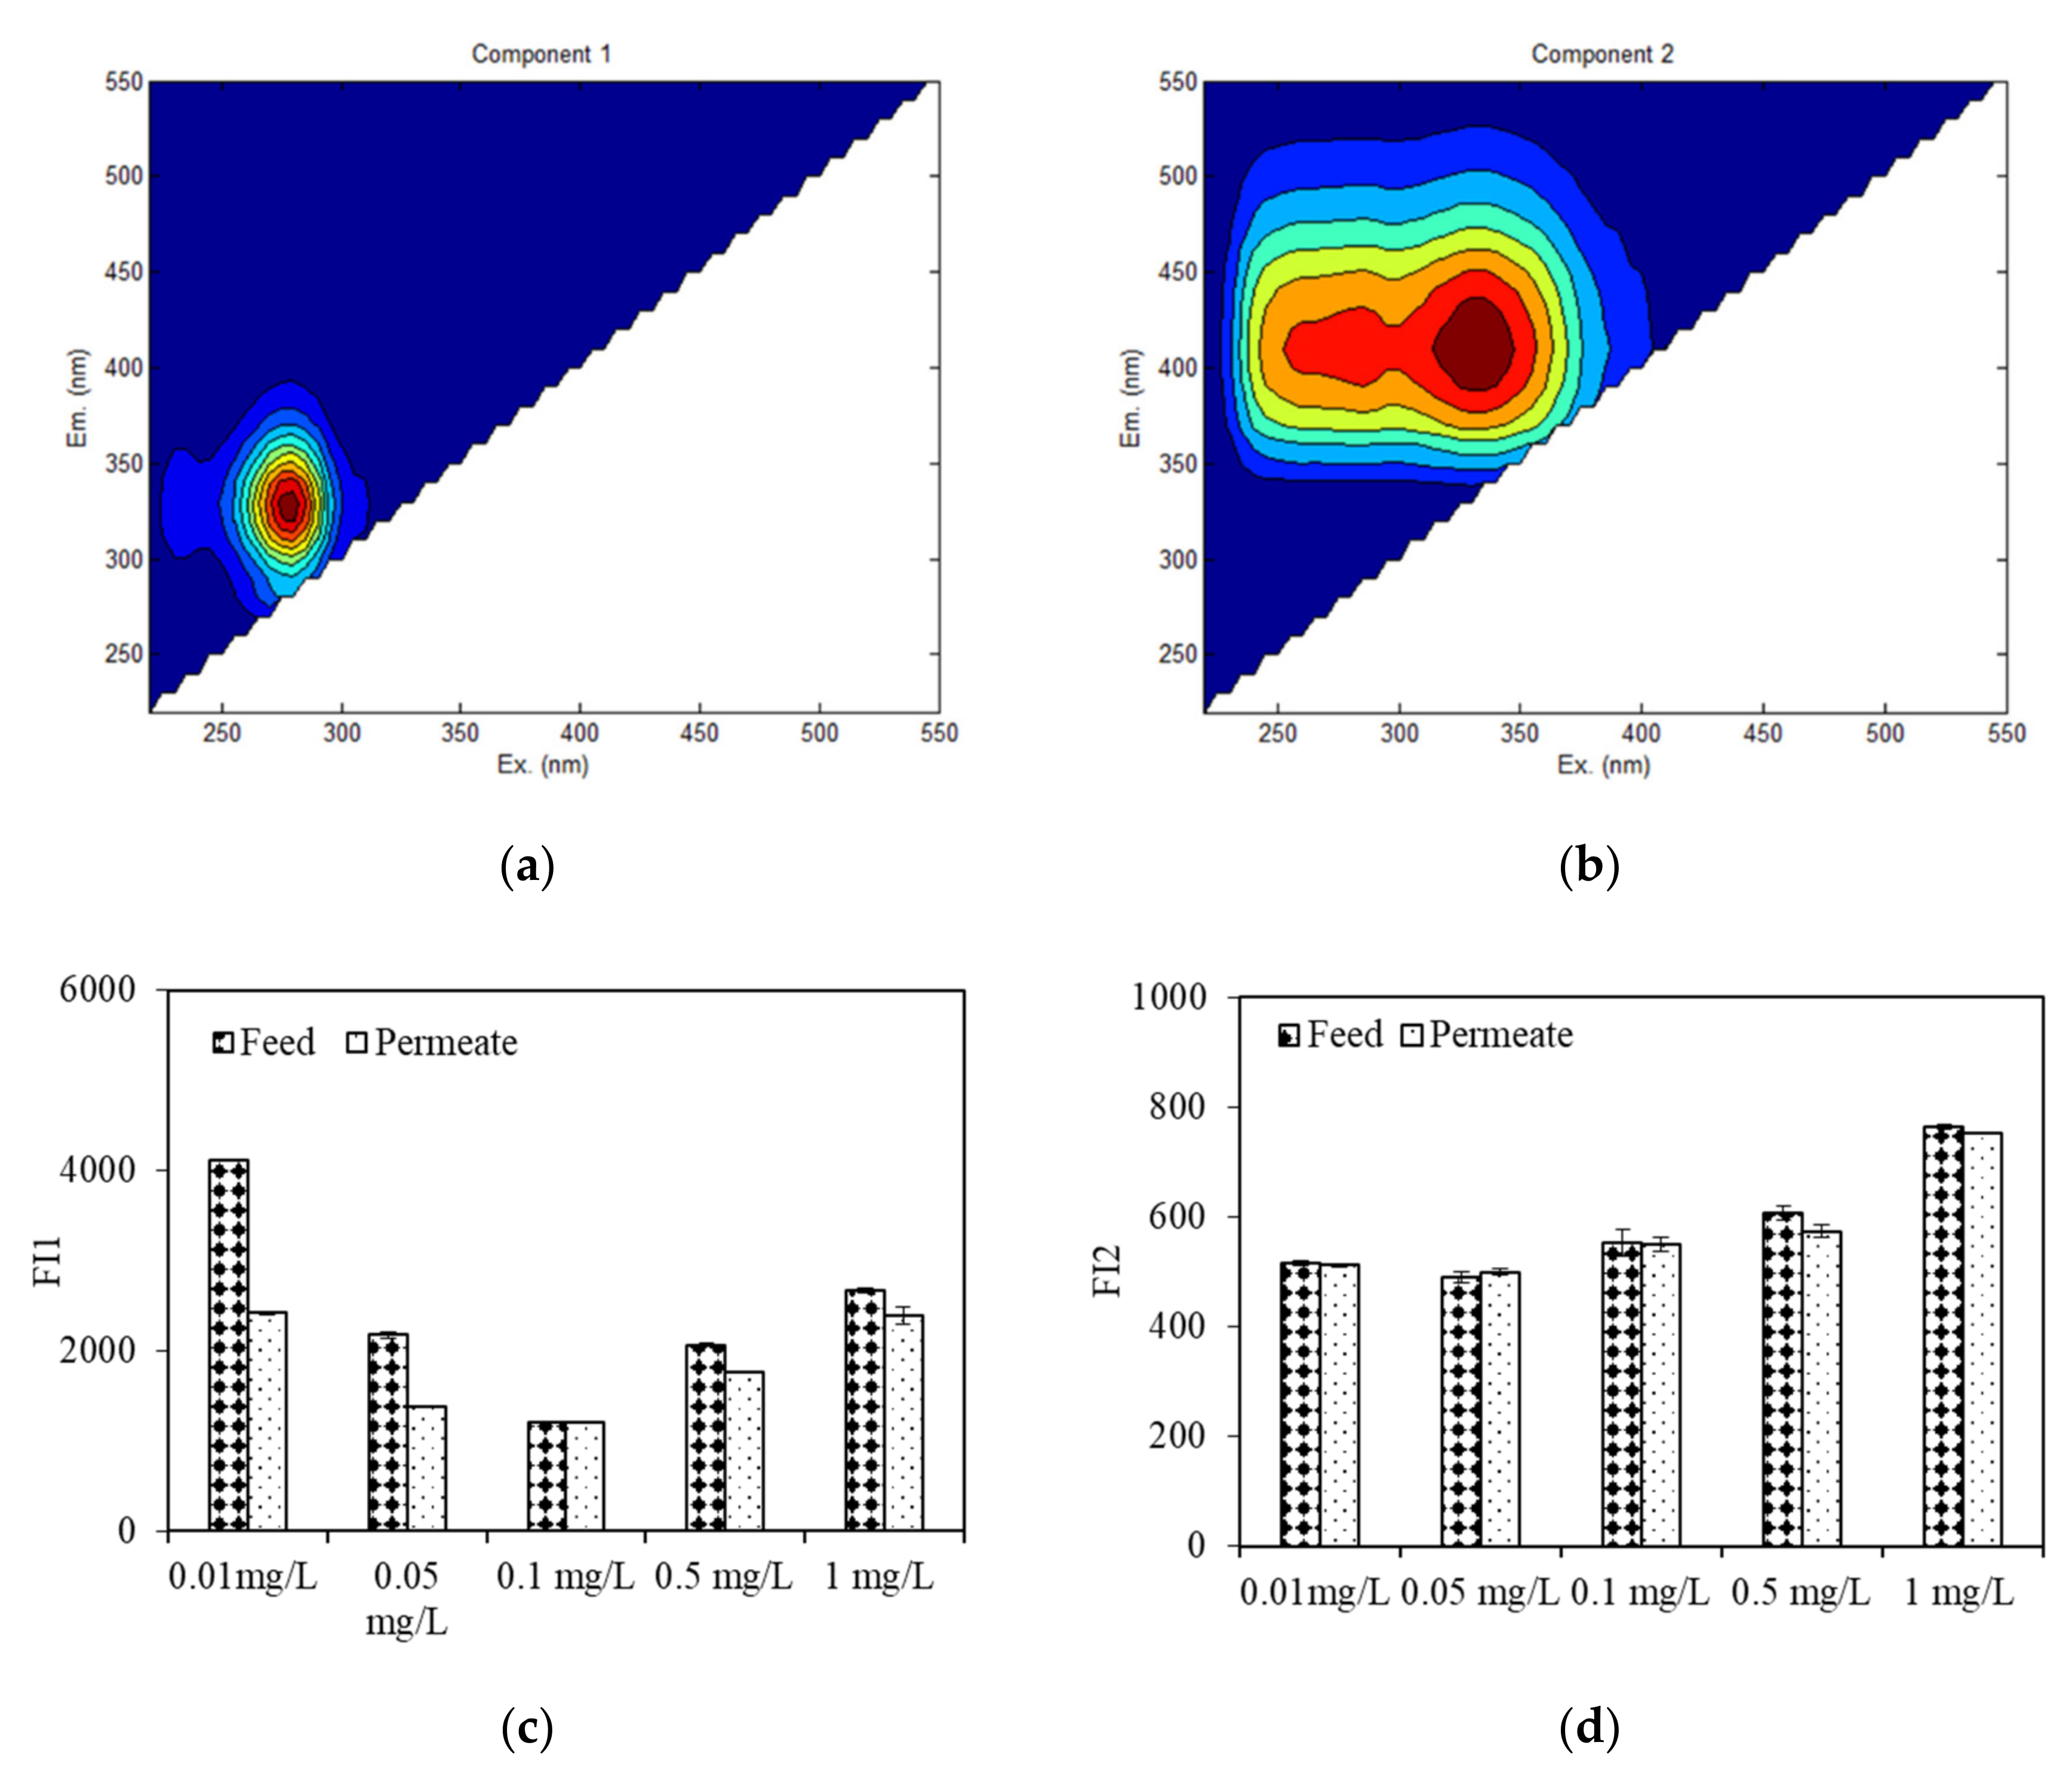
Figure 8 depicts the EEM spectra of feed and permeate water during algae dewatering by DDM filtration using EEM-PARAFAC. Unlike the EEM spectra of EOM during the wastewater purification process, there were only two fluorescent components of the feed and effluent water during the dewatering process (
Figure 8a,b), due to the smaller numbers of water samples as well as lower organic concentrations. EOM exposed to 0.01 mg/L copper had the highest FI of protein-like component 1 (Ex/Em = 275 nm/330 nm), followed by those of EOM exposed to 0.05, 0.5, 1, and 0.1 mg/L copper, while the highest FI of HS fluorescence (Ex, Em = 275, 345 nm/400 nm) occurred with 1 mg/L copper exposure, indicating that when the algae concentration was held constant, the EOM of algae exposed to low copper concentrations contain more protein-like organics than that of algae exposed to higher copper concentrations, whereas more HSs in EOM were observed when algae were exposed to high copper concentrations.
After dewatering by DDM filtration (
Figure 8c,d), the FI protein-like component was found to be greatly decreased, especially when algae were treated with copper at 0.01 and 0.05 mg/L, the removal efficiencies were as high as 41% and 36%, respectively, whereas there were small fluctuations in the HS FIs among the EOM samples from algae exposed to various copper concentrations, which was in line with the UV removal results (
Figure 4). This result suggests that fluorescent protein-like organics are the major components that were intercepted by the DDM, especially when the aquaculture wastewater contained a low copper concentration (<0.1 mg/L); however, fluorescent HSs and fulvic acid-like substances were rarely retained. Chu et al. investigated the EEM spectra of a DDM and found that after a long period of operation, the slime and algae layers mainly retained protein-like organics, while HSs are mainly retained by the algae and diatomite layers [
15]. The difference in our result lie in the algae dewatering time. EOM with low copper exposure (0.01 mg/L and 0.05 mg/L) had relatively high rejection of fluorescent protein-like organics, which was different from the observed DDM flux behaviours (
Figure 1). This result can be interpretated by the reality that other organics, such as polysaccharide-like substances, can also be major components that lead to serious DDM fouling; however, most polysaccharide-like organics were reported to have no fluorescent characteristics [
19].
Table S1 shows the MW distribution of EOM before and after DDM filtration. Similar to the MW distribution of EOM during the algae purification process, there were large differences in MW distribution with varying copper concentrations in the feed water. EOM with 1 mg/L copper exposure had the highest TOC content and highest peak A area, followed by those of EOM with 0.5, 0.01, 0.05, and 0.1 mg/L copper exposure, with TOC contents of 2.18, 2.12, 1.50, 3.18, and 5.14 mg/L, respectively, which was in line with their filtration fluxes. In addition, the TOC peak areas of medium-MW organics followed the order of 0.5 > 1 > 0.01 > 0.05 mg/L > 0.1 mg/L copper, suggesting that when the DDM filtered the algae at the same concentration, EOM at high copper concentrations (0.5 and 1 mg/L) also had the highest medium-MW organic compound content.
For microalgae dewatering, the TOC peak areas of macromolecular biopolymers were greatly reduced after dewatering, with rejection rates of 76.99%, 13.89%, 1.3%, 15.96%, and 31.47% for EOM exposed to copper concentrations of 0.01, 0.05, 0.1, 0.5, and 1 mg/L, respectively. Moreover, medium-MW HSs were also partly removed, and the removal efficiencies were 62.83%, 0%, 11.85%, 25.43%, and 3.29% for EOM exposed to copper concentrations of 0.01, 0.05, 0.1, 0.5, and 1 mg/L, respectively, indicating that macromolecular biopolymers and part of the medium-MW HSs were the major components that caused DDM fouling during the algae dewatering process. Previous research suggested that size exclusion was a key mechanism for membrane filtration. Organics nearing the membrane pore size lead to serious pore blockage, making the filtration resistance enhanced, whereas cake formation is induced by the organics with sizes greater than membrane pores [
29]. The high-MW substances that were rejected during the dewatering process can be explained by the slime layer and the algae layer of the DDM having high rejection rates of these organic substances.
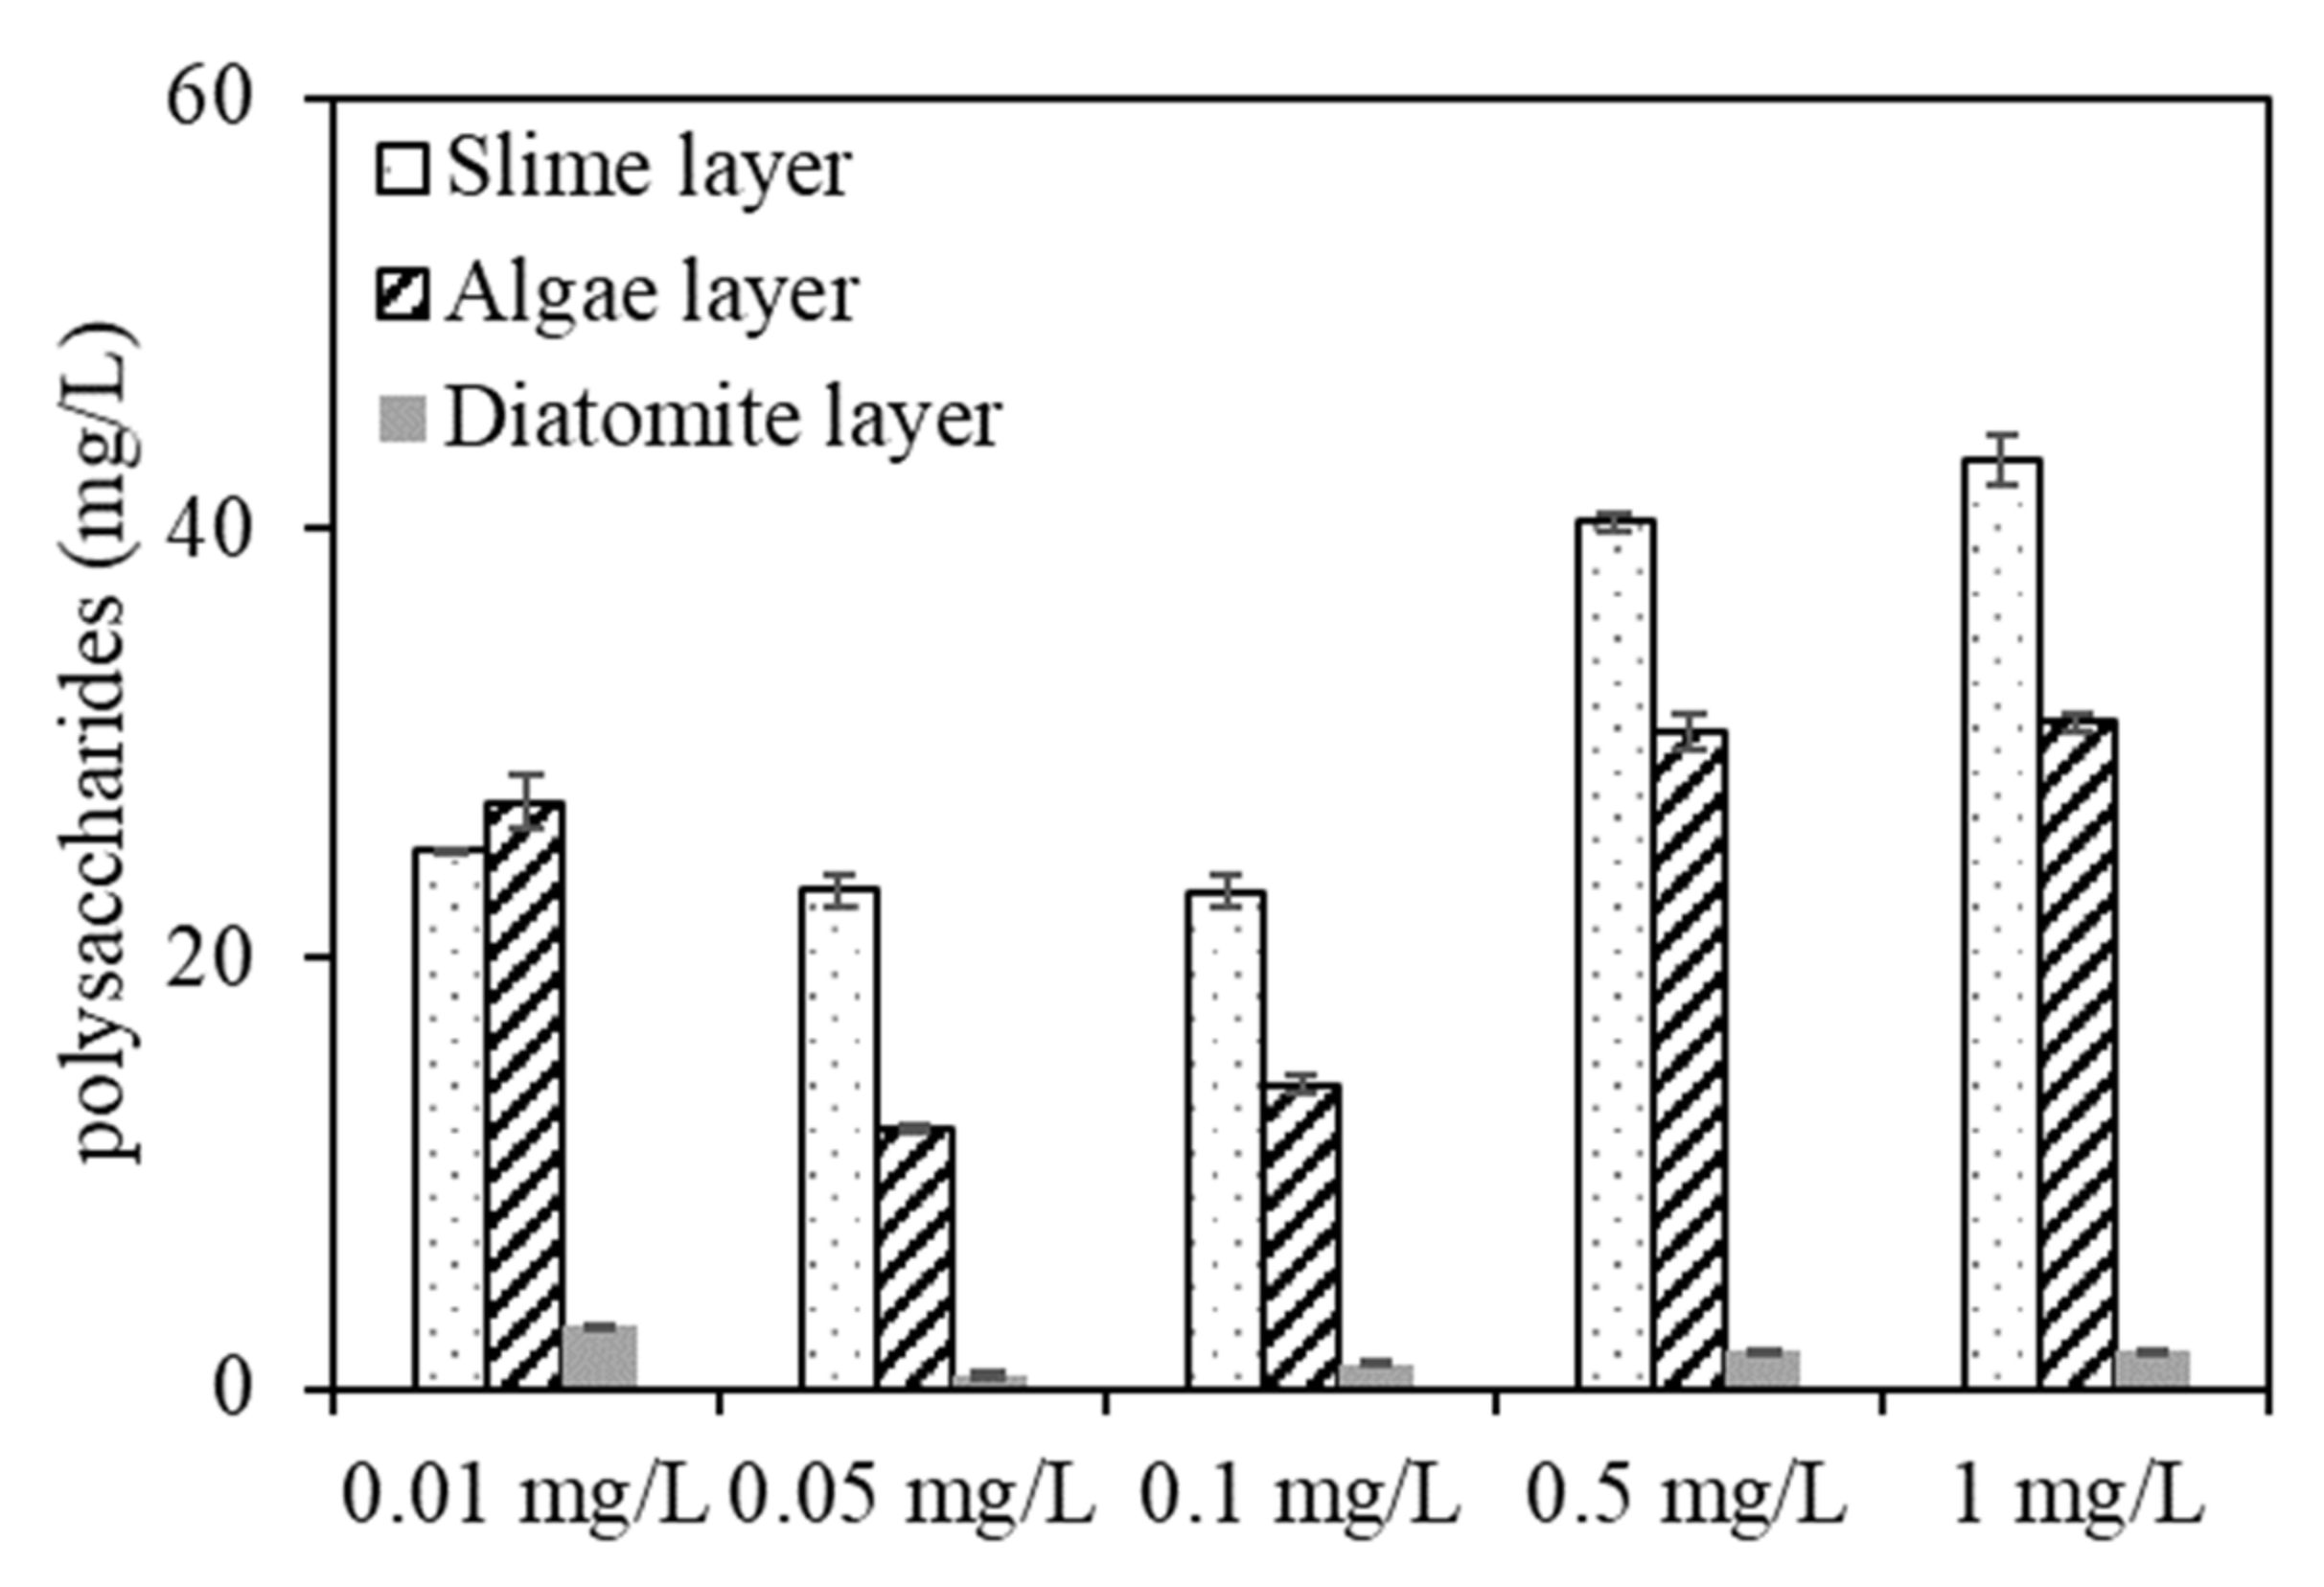
To further study the DDM filtration and fouling behaviour of algae under various copper concentrations, the protein and polysaccharide contents in the three DDM sublayers were further identified (
Figure 9).
Figure 9 shows that most protein and polysaccharide compounds accumulated in the slime layer, whereas a small amount of EOM cumulated in the diatomite layer. The protein contents in the slime layer were 31, 27.8, 15.05, 19.89, and 21 mg/L for algae exposed to copper concentrations of 0.01, 0.05, 0.1, 0.5, and 1 mg/L, respectively, indicating that the DDM would retain more protein organics in the slime layer when dewatering the algae under low copper concentrations, whereas a lower protein content was rejected by the DDM when filtering the algae with a copper concentration of 0.1 mg/L, which was in accordance with the EEM result (
Figure 8).
The polysaccharide contents in the three sublayers were much higher with high copper concentrations (0.5 and 1 mg/L) than with low copper concentrations, whereas the contents were comparatively low under low copper concentrations, and the polysaccharides contents in the slime layer were 25.12, 23.19, 23.14, 40.26, and 43.18 mg/L for algae exposed to copper at 0.01, 0.05, 0.1, 0.5, and 1 mg/L, respectively, and were 27.3, 12.03, 14.15, 30.56, and 31 mg/L for polysaccharides in the algae layer, indicating that polysaccharides within the slime and algae layers are also key factors causing DDM R
c fouling, which can be considered as one of the explanations for the filtration flux decreases seen in
Figure 1. Notably, since polysaccharides in EOM have been proven to be mainly hydrophilic, while the diatomaceous utilized in the experiment was hydrophilic, the rejection of polysaccharide organics by the diatomite layer was slightly higher than that of protein contents, which was consistent with previous research [
29].
3.6. Discussion of Organic Components and DDM Fouling with Various Copper Concentrations
Aquaculture wastewater treatment is of great concern due to its negative ecological and environmental impacts. Combined microalgal and membrane filtration could effectively treat aquaculture wastewater; however, the main problems are algae dewatering, especially the membrane fouling induced by EOM during the algal dewatering process. Many studies have investigated the fouling behaviours correlating with water characteristics to diagnose membrane fouling [
32,
33]. Although the DDM has obvious advantages compared with other algal concentration treatments, the main problem is membrane fouling; therefore, effectively analysing the relationship between organic characteristics and DDM fouling is very important for DDM operation and purification during the algal dewatering process.
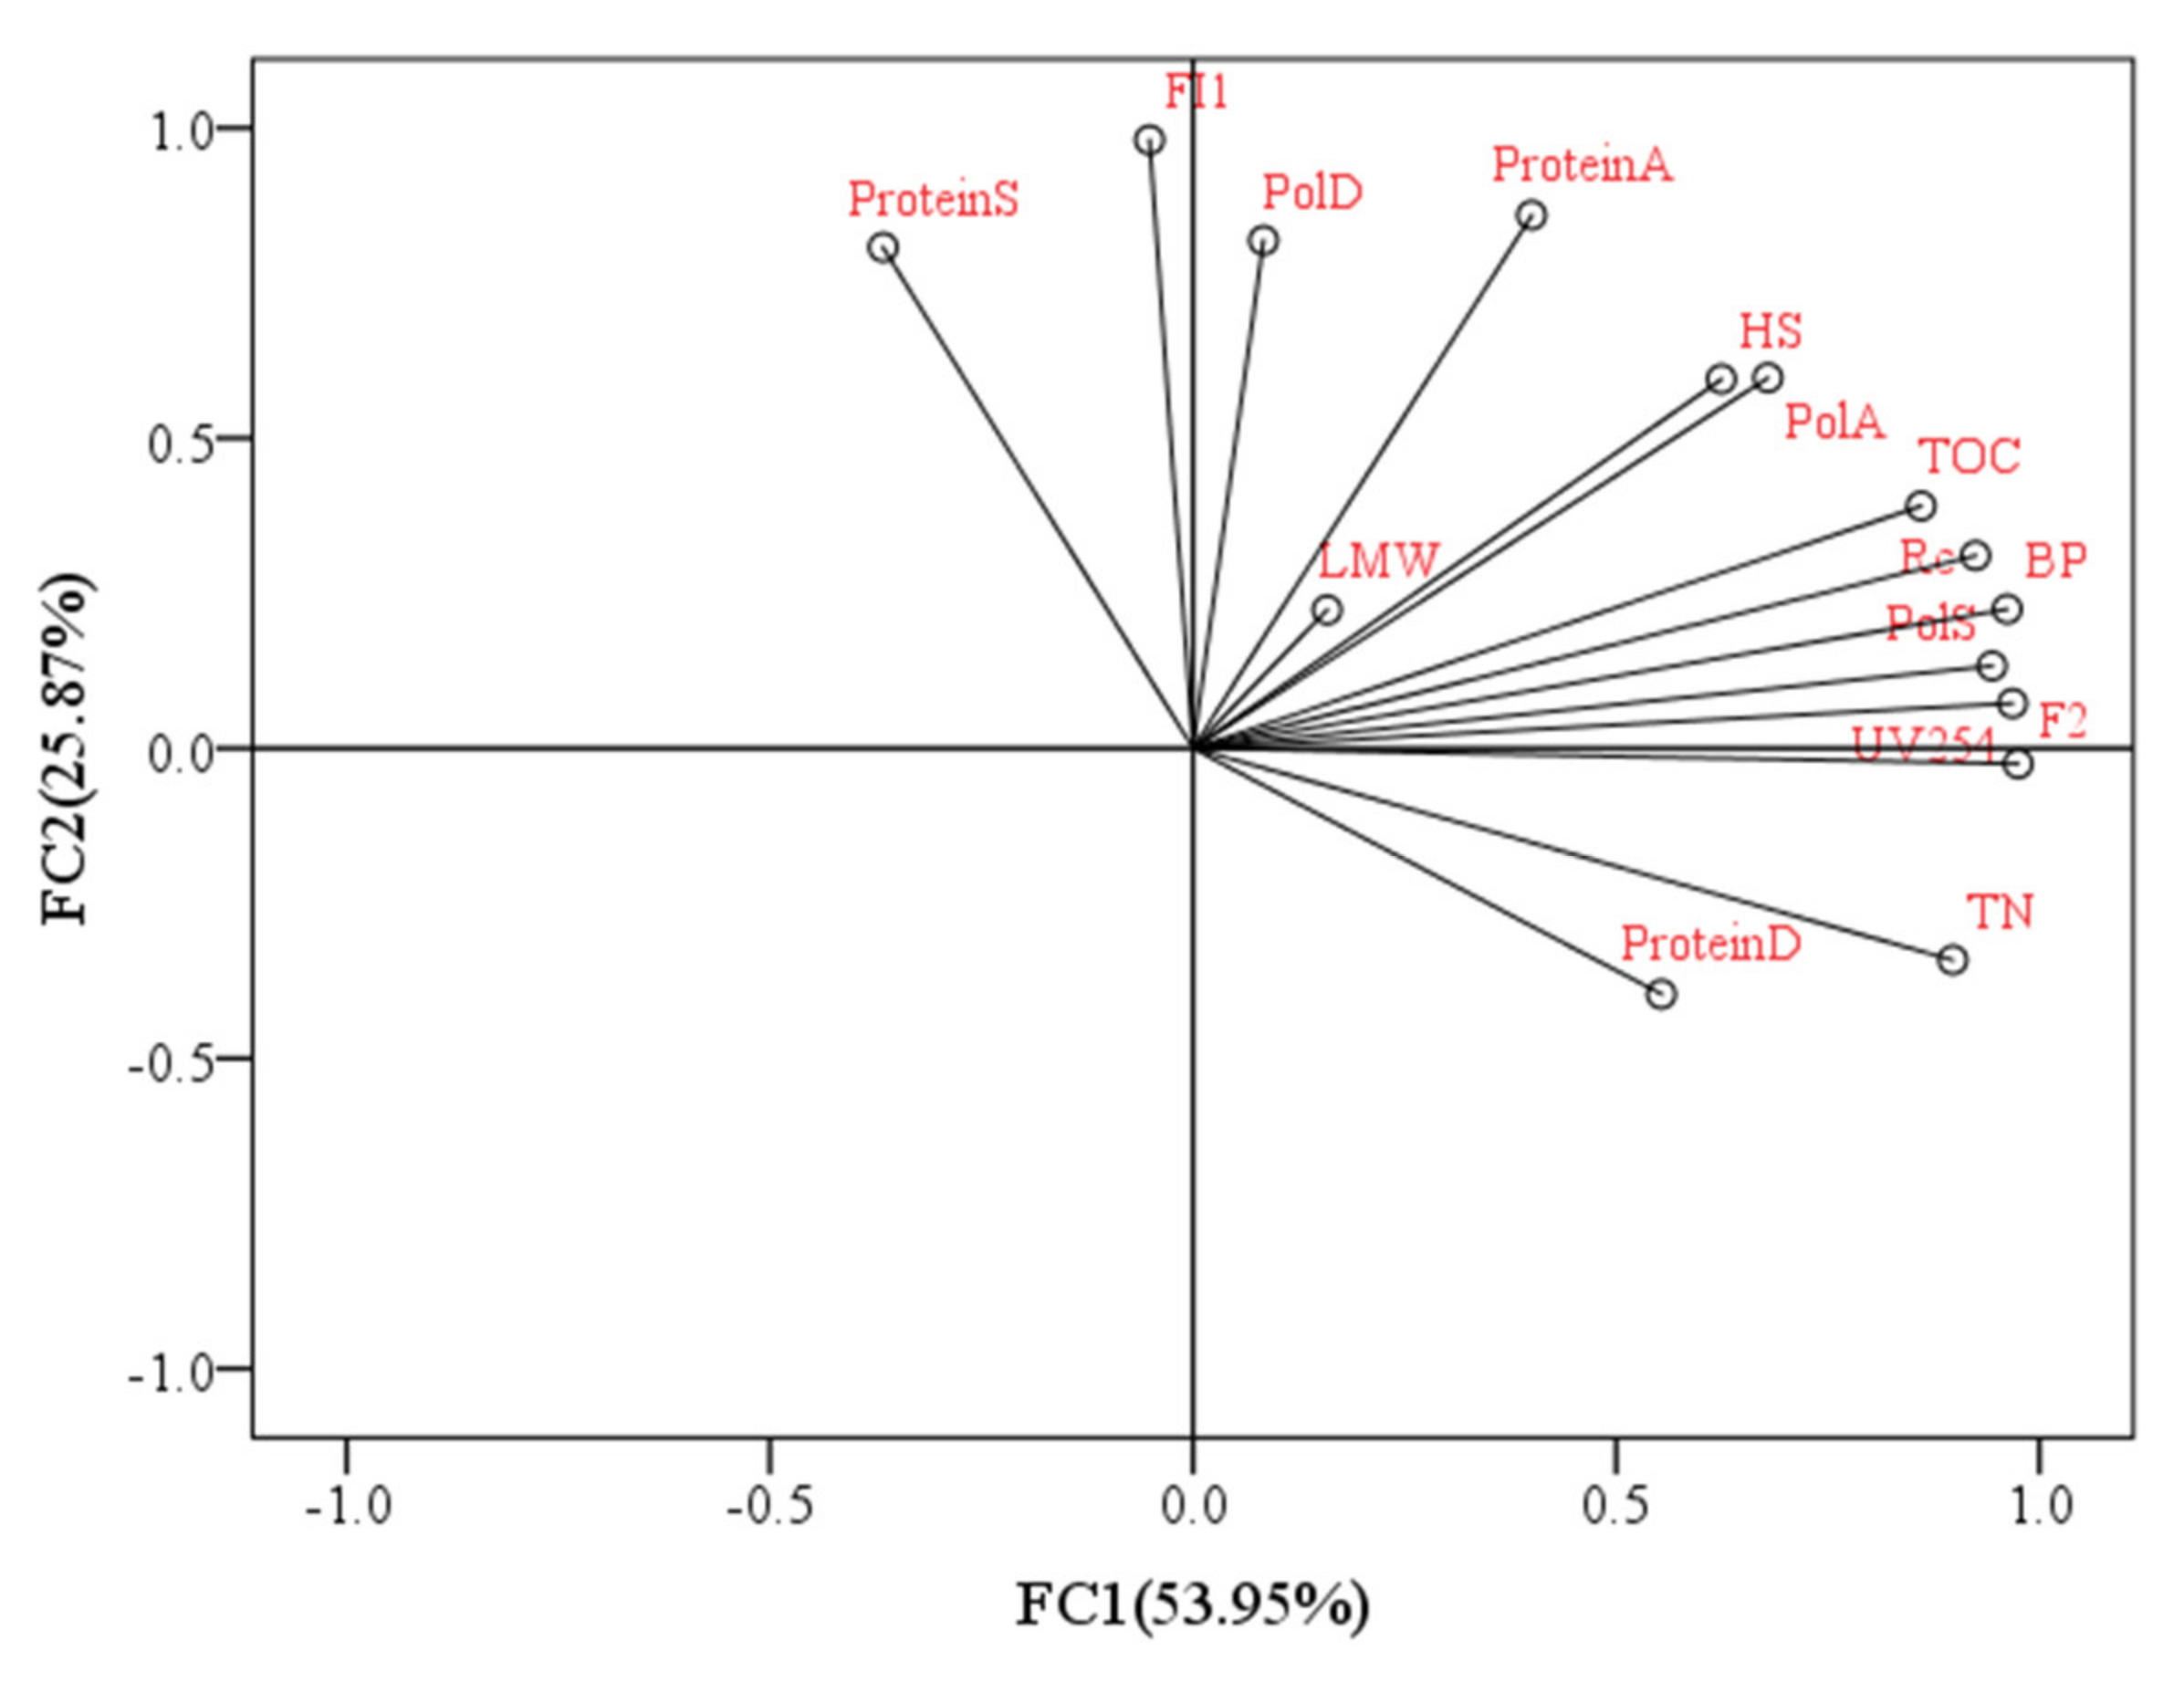
Figure 10 depicts the relationship between DDM membrane fouling (R
c) and the raw water characteristics of EOM under various copper concentrations (DOC, UV
254, biopolymers, HSs, low-MW (LMW) compounds, FI1, FI2, polysaccharides and protein). Pearson’s correlation matrix was utilized for this analysis. It can be seen from
Figure 10 that 79.8% of the data variance was explained by the first two principal components, which indicated good explanations of the data. In addition, there were high correlations between R
c and macromolecular organic biopolymers (r
2 = 0.968), which indicated that biopolymers contributed greatly to DDM fouling during the algal dewatering process, which was consistent with previous research suggesting that biopolymers (biopolymers), polysaccharides, and proteins were mainly responsible for membrane fouling [
34]. Previous research suggested that hydrophilic (HPI) organics, which usually contain lots of polar functional groups, had stronger affinity towards water than HPO organics [
35], as HPI organics could form hydrogen bonds with water molecules, and they had lower tendency to adhere to the membrane; however, when these HPI organics formed a cake layer on the membrane surface, they caused greater resistance to water flow than hydrophobic (HPO) organics due to stronger foulant–water interaction, whereas HPO organics had greater tendency to adhere to the membrane and aggravate the irreversible adhesion. Similar to the observed biopolymers, the TOC also clustered with R
c, exhibiting high correlation (r
2 = 0.888,
p = 0.044) and revealing that the TOC content in algal solutions was also extremely relevant with fouling potential during the algal dewatering process. The argument that the low molecular components contributed less to membrane fouling can be sustained by the minimal correlation of R
c with low-MW (LMW) acids and humic acids, with an r
2 of 0.049 (
p = 0.937).
For HSs, a certain amount of HS organics was found in the extracted substances, with the correlation of R
c with HSs being r
2 = 0.871. HSs were reported to be some of the main foulants in low-pressure membrane filtration performance according to previous research [
32]. As HSs were also partly removed by the DDM in this study (
Table S1), HSs may also play some roles in the formation of membrane fouling during DDM operation. Similarly to the observed TOC, the UV
254 values also had comparatively high correlations with R
c (r
2 = 0.865). UV
254 could be utilized as a good surrogate parameter for HSs in most cases, as some of the HSs can be rejected by the DDM and some can be retained (
Figure 4), which further indicated that HSs is important in the formation of membrane fouling (
Table S1). For fluorescent components 1 and 2, the r
2 values were 0.226 and 0.845 for FI1 and FI2, respectively, indicating that fluorescent protein-like organics had little correlation with DDM fouling during the dewatering process. It should be noted that although polysaccharides were reported to be mainly responsible for membrane fouling [
36], there were great discrepancies in polysaccharide contents in the DDM correlated with R
c. The polysaccharide components in the slime layer (PolS) contributing greatly to membrane fouling can be demonstrated by the strong correlation with R
c (r
2 = 0.950,
p = 0.13), whereas less fouling is contributed by polysaccharides in the algae layer (PolA) and diatomite layer (PolD) as indicated by the smaller correlations with R
c, with r
2 values of 0.799 and 0.237, respectively, which indicated that polysaccharides in the slime layer may be more suitable as indicators of membrane fouling in the DDM. This phenomenon can be explained by the fact that the slime layer has the densest construction, which is responsible for filtration resistance [
18], followed by the algae layer and diatomite layer, with the polysaccharide concentration reducing gradually. The protein content in the DDM had a lower correlation with R
c than the polysaccharide content, and the r
2 values were −0.033, 0.700, and 0.479 for proteins in the slime layer (ProteinS), algae layer (ProteinA), and diatomite layer (ProteinD), respectively.
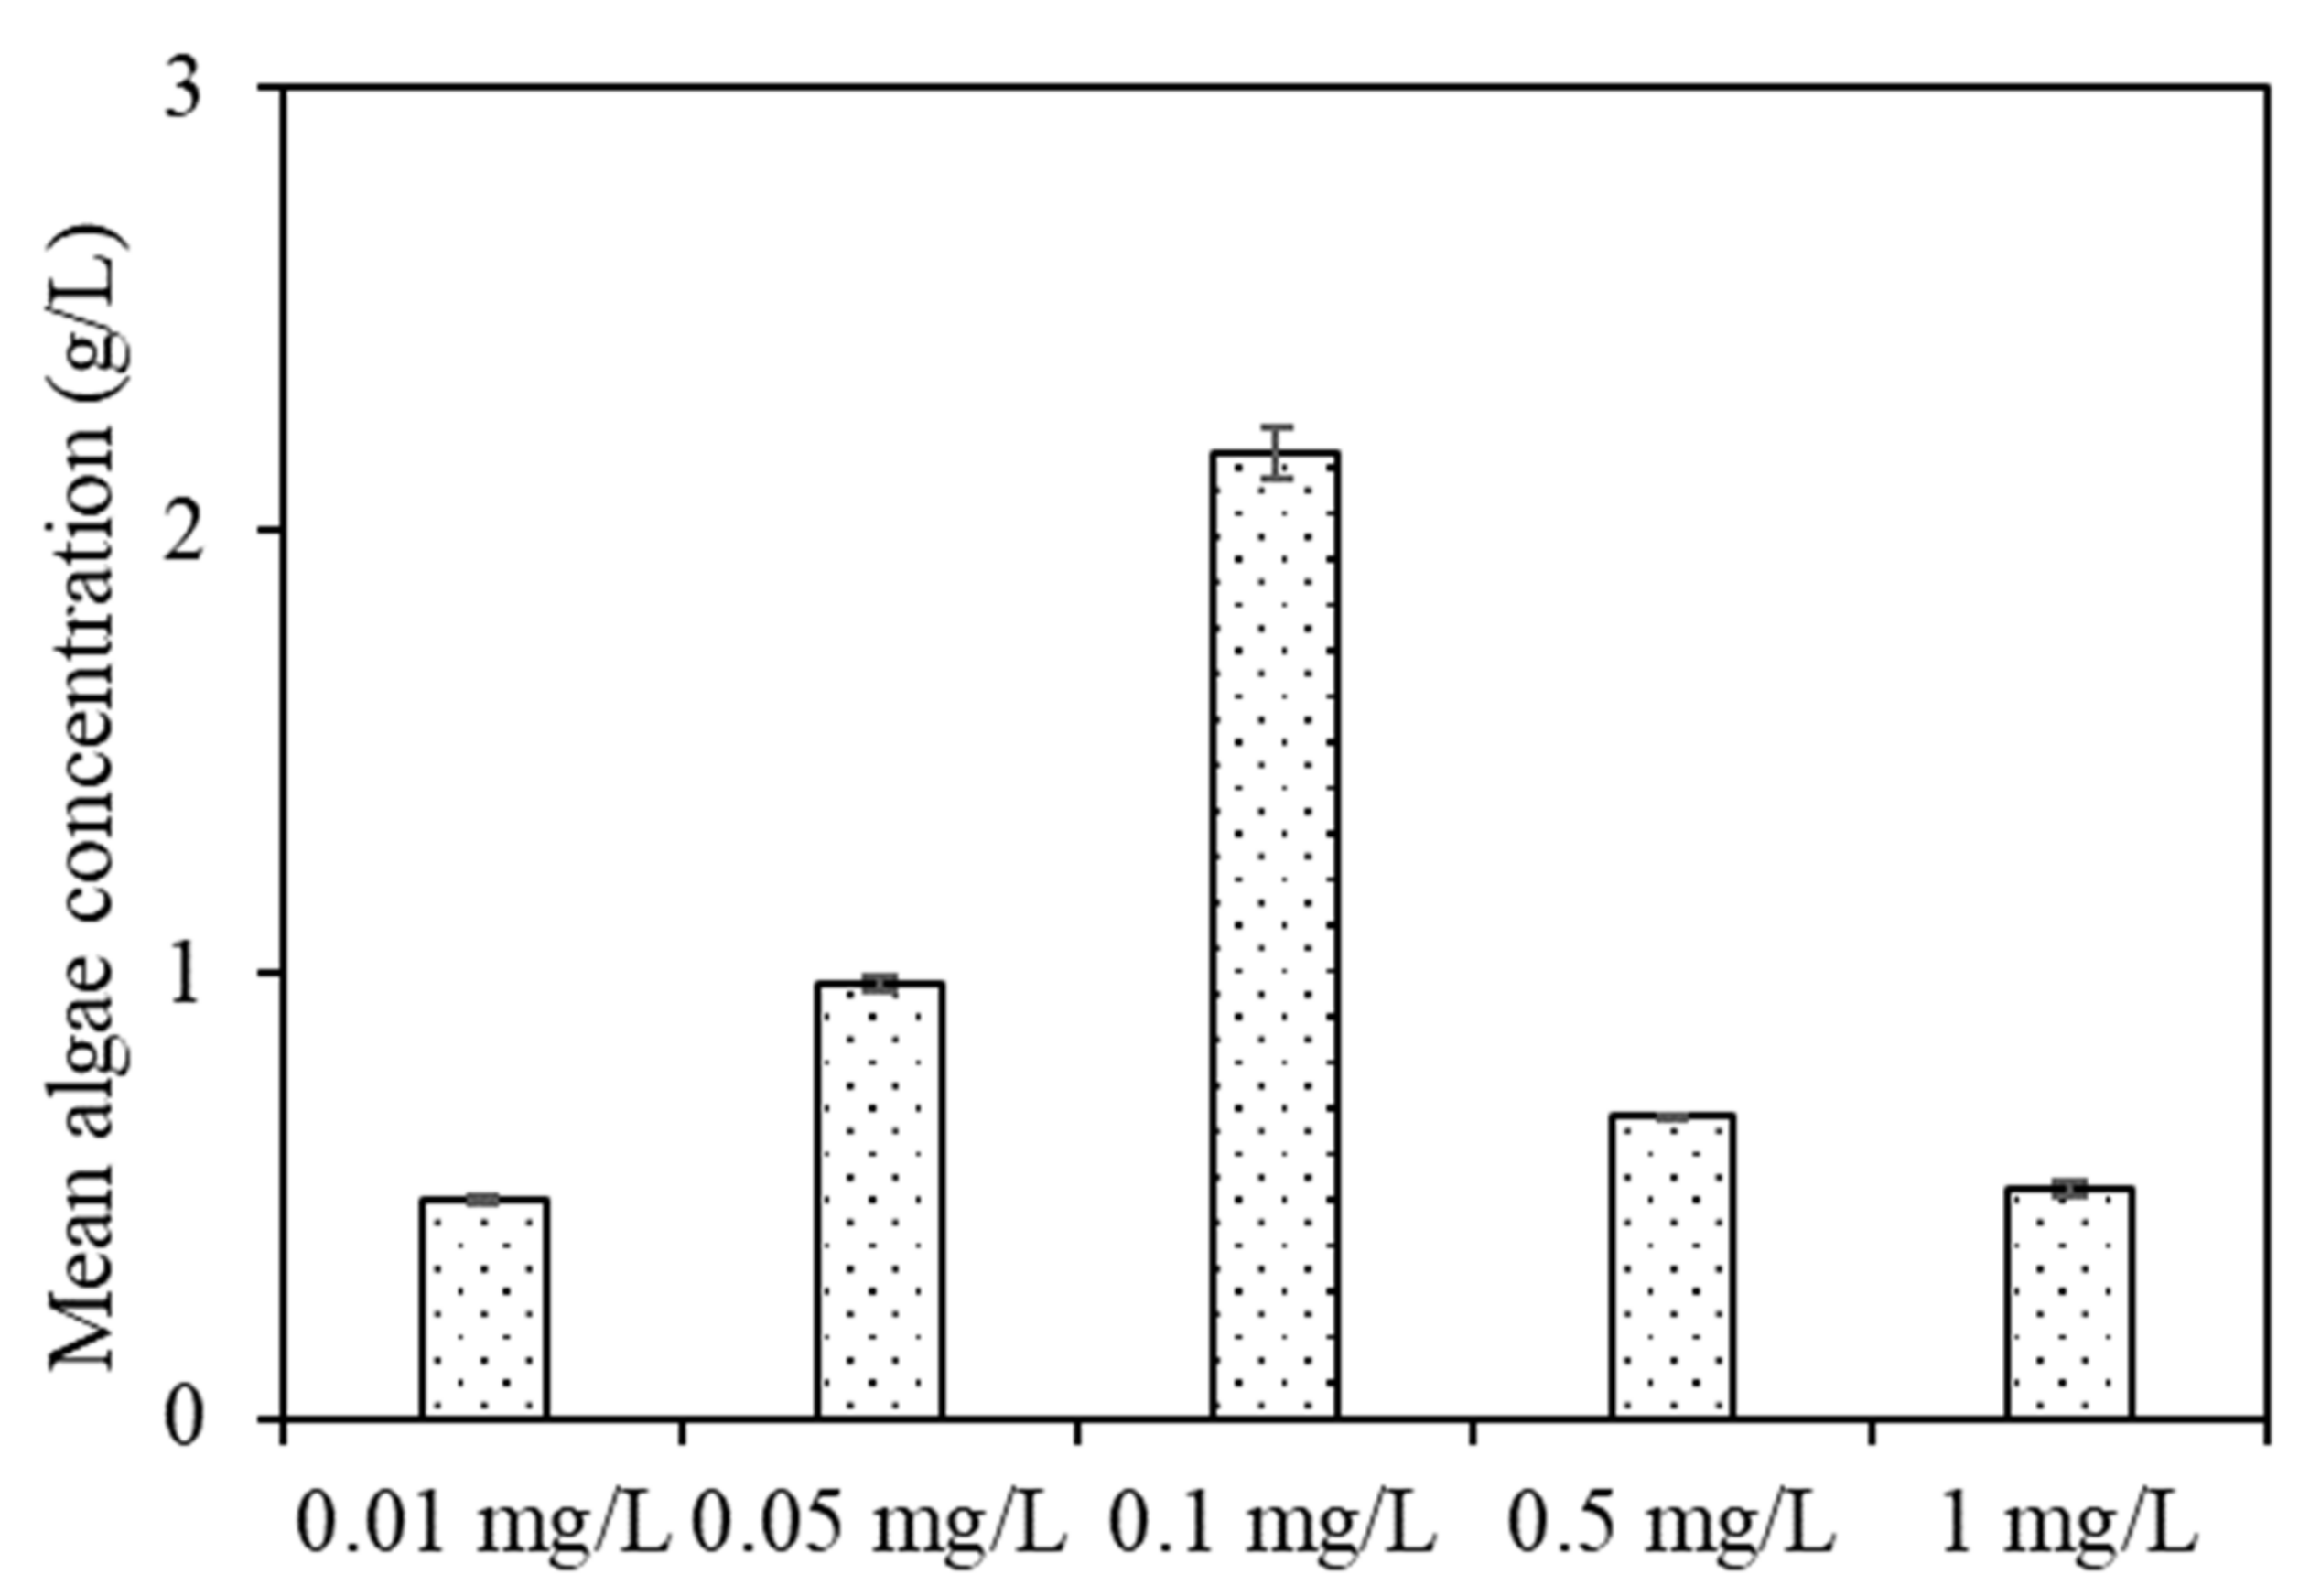
Based on this analysis, the influence of copper ions in aquaculture wastewater on DDM fouling during the dewatering of C. pyrenoidosa can be illustrated as follows: macromolecular biopolymers and polysaccharides in the slime layer were highly associated with DDM filtration. Combined algae and DDM filtration have excellent effects on organic and inorganic rejections during aquaculture wastewater purification; however, as copper ions existed in aquaculture wastewater, the purification effects and algae dewatering were significantly affected. A high concentration of copper ions in aquaculture wastewater significantly reduces the growth of microalgae during the purification process, yet the total organic matter and macromolecular organic matter synthesized in EOM were the highest, leading to subsequent decreases in DDM filtration fluxes as well as algae dewatering effects. When aquaculture wastewater contained low copper concentrations (≤0.1 mg/L), despite the algal growth being greatly promoted, the total organic matter and macromolecular organics synthesized were reduced, thus leading to the alleviation of DDM fouling, especially when algae were exposed to 0.1 mg/L copper. At this copper concentration, the Rc value was lowest, while the algae concentration effect was highest. Therefore, effective removal of copper ions in aquaculture wastewater before aquaculture wastewater utilization not only promotes the growth of economic microalgae, but also ameliorate DDM filtration behaviours and algae dewatering effects.
