1. Introduction
A hollow fiber membrane is a membrane formed by the intersection of functional fiber materials and separation membrane technology. It has the advantages of high packing density, small occupying space, simple membrane module structure, and relatively low cost. Hollow fiber membrane technology has become key in the fields of environmental protection, resource recovery, the new energy industry, and the upgrading of traditional industries. In recent years, hollow fiber membrane modules have become widely used in wastewater treatment [
1,
2,
3], membrane extraction [
4,
5,
6,
7], gas separation [
8,
9,
10], and air humidification [
11,
12,
13,
14,
15] and dehumidification processes [
16,
17,
18,
19,
20].
Generally, a hollow fiber membrane is a semi-permeable unit with high permeability and selectivity of target compounds [
5]. The structure of a hollow fiber membrane module is similar to that of a shell and tube heat exchanger, where the hollow fibers act as the tube bundle. In the humidification/dehumidification process, liquid usually flows into the hollow fibers and air flows into the shell side. The water vapor can permeate through the membrane, but liquid water will be intercepted by the membrane. Thus, the calcium and magnesium ions in water, which are harmful to human health, will not enter the air stream. The heat and mass transfer characteristics of the hollow fiber membrane bundle for humidification/dehumidification have been investigated by many researchers theoretically [
18,
21,
22,
23,
24] and experimentally [
25,
26,
27,
28].
When a hollow fiber membrane is used in water treatment, gas separation, and other fields, the hollow fibers are impinged by the fluid in the shell side. Then, fibers deform and vibrate due to the impinging of the incoming fluid. Fiber deformation will conversely affect the flow field and heat mass transfer performance during operation. Therefore, how the flow-induced vibration affects the stress distribution and heat and mass transfer performance of hollow fiber membranes is worthy of study. The effect of heat transfer enhancement caused by flow-induced vibration has been observed in elastic tube bundles, and the heat transfer coefficient can be enhanced by about 20–30% compared with steady flow conditions [
29,
30,
31,
32]. Unlike the rigid metallic tubes in shell and tube heat exchangers, hollow fiber membranes are flexible tube bundles that are prone to vibration due to the influence of fluid flow and gravity. During the humidification/dehumidification process, the airflow causes fiber vibration and deformation. The fiber vibration then affects the flow field, thus influencing the heat and mass transfer performance of the fiber bundle. This is a typical fluid–solid coupling problem.
The effect of vibrations on submerged hollow fiber membranes has been studied experimentally with the aim of mitigating membrane fouling [
33,
34,
35,
36,
37,
38,
39,
40,
41]. These studies mainly focused on the influence of membrane vibration on the critical flux, transmembrane pressure, and other parameters that reflect the degree of membrane fouling but not the influence of fluid–structure coupling on the heat and mass transfer performance of hollow fiber membranes. Zamani et al. [
42] proposed an analytical model to predict the wall shear rate at the membrane surface caused by longitudinal vibration. Liu et al. [
43] investigated aeration-induced fiber movement on surface shear stress and flux in submerged hollow fiber membrane systems using the fluid–structure interaction (FSI) approach. Huang et al. [
44] conducted a numerical study of the fluid flow and heat transfer characteristics of curved hollow fiber membrane bundles for air humidification/dehumidification. The hollow fibers were curved at certain deformed heights and angles in their model. However, the deformed heights and angles of the fiber were assumed according to the empirical values obtained in their study.
The fluid flow, stress, and heat and mass transfer in hollow fiber membrane bundles under flow-induced vibration have not been fully investigated. Fiber vibration frequently changes the stress acting on the fiber. Therefore, under these conditions, the fiber will be abraded at both ends and its lifetime will be shortened. From a mechanical point of view, reducing the effective length of the fiber can reduce the stress at both ends of the fiber and prolong its lifetime. Stress distribution on the fiber is important for the membrane’s lifetime, and the Nusselt number (Nu) and Sherwood number (Sh) across the fiber are key parameters in the design of hollow fiber membrane modules. In this study, the effects of fiber vibration on stress, Nu, and Sh for flow across a hollow fiber were investigated using the FSI approach. In this way, the influence of the pulsating amplitude and frequency of the incoming air on Nu and Sh was studied.
2. Methodology
2.1. Physical Model
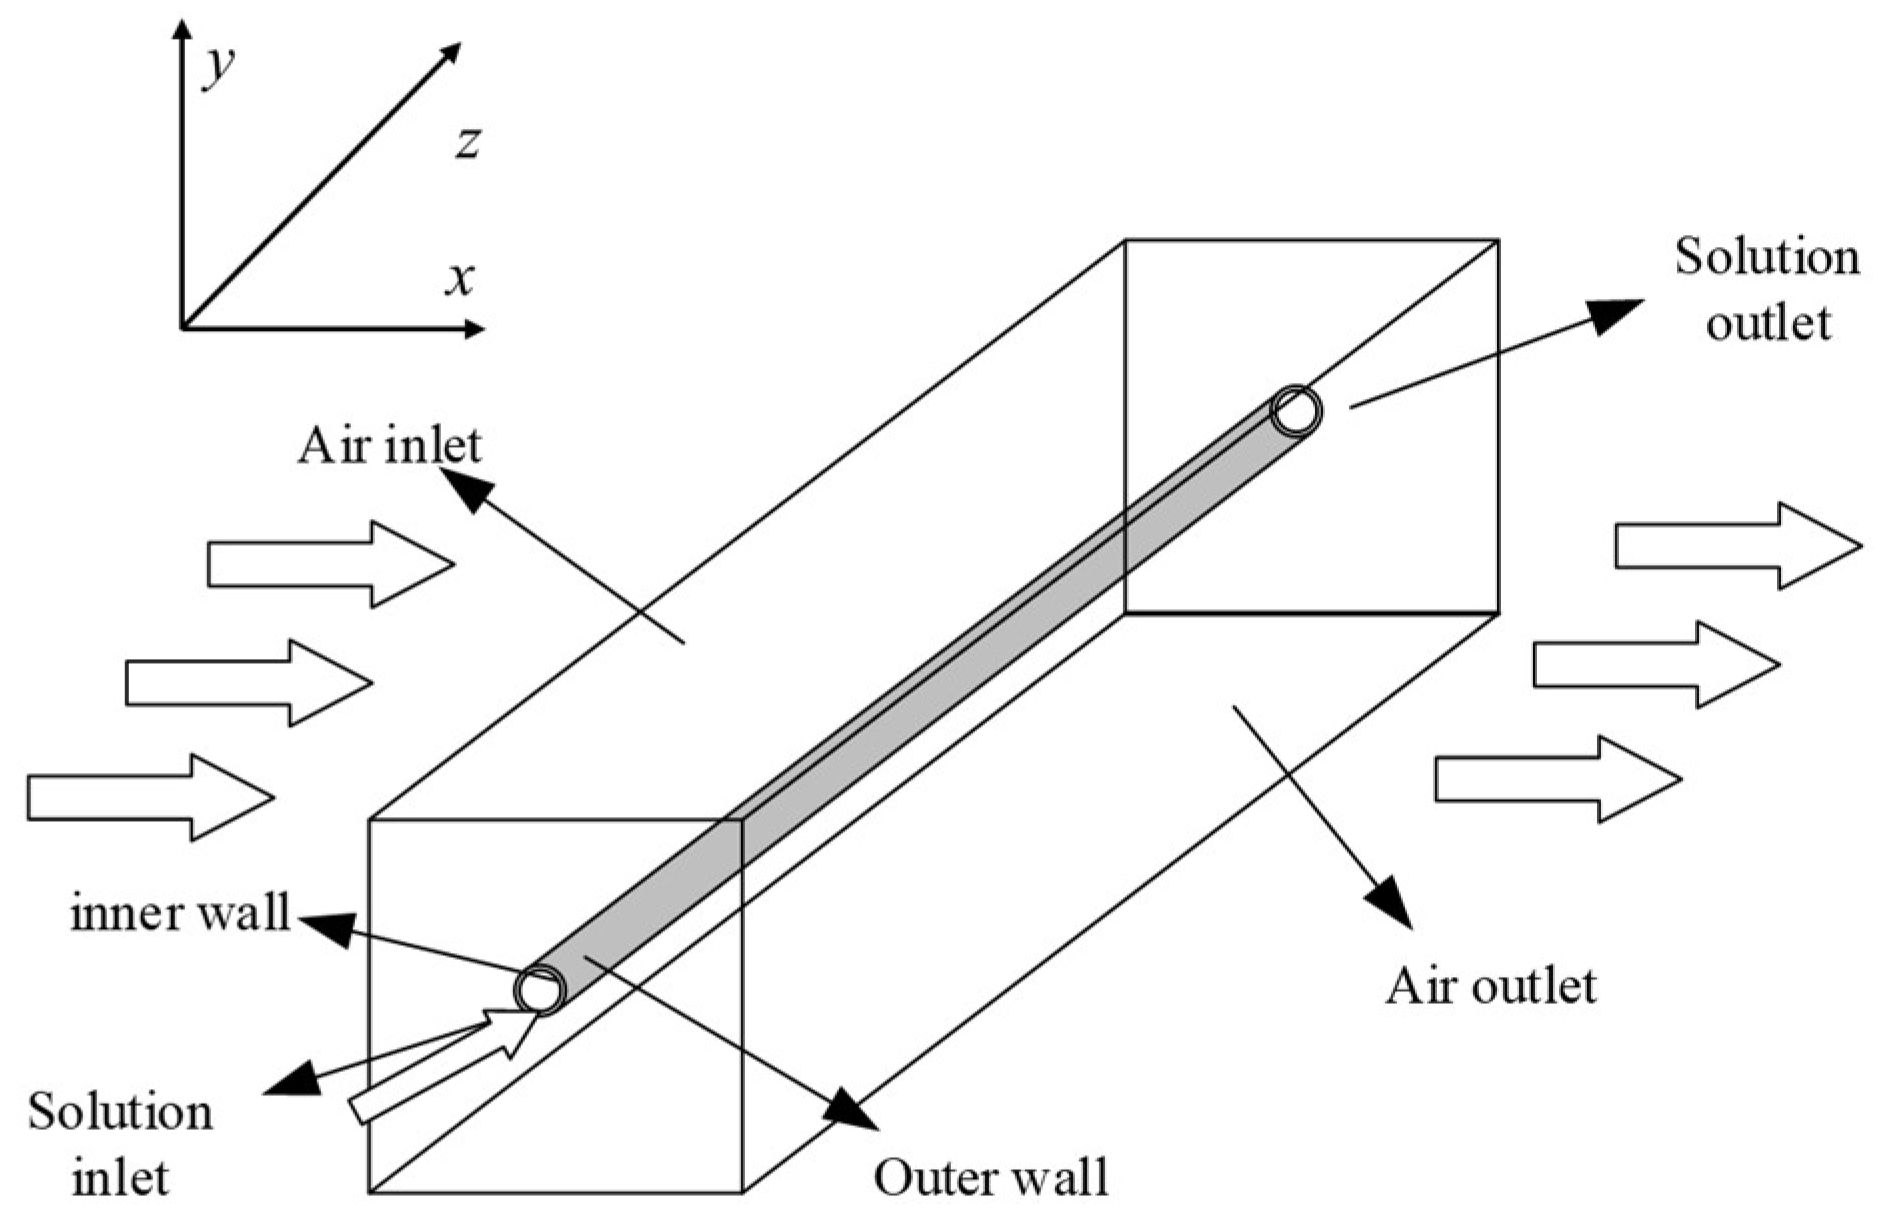
A physical model of single-fiber vibration is shown in
Figure 1. The computational domain is divided into three zones: the airflow zone outside the fiber, the liquid flow zone inside the fiber, and the solid zone that represents the hollow fiber membrane. Under practical conditions, air flows into the computational domain with a pulsating speed and impinges on the fiber. Then, the fiber begins to vibrate under the force of the air, self-gravity, and gravity from the inner fluid. Continuous vibration of the fiber will affect the flow field of the air. This is a classic fluid–structure coupling phenomenon that involves both fluid dynamics and structural mechanics. When addressing this phenomenon, the computational fluid dynamics (CFD) method treats the fiber as a rigid tube that will not deform; thus, the transient impact of fiber deformation on the flow field cannot be solved. In this study, the FSI approach was applied to assess the interaction between the fiber and the fluid. In the FSI approach, the flow field and the force acting on the fiber are calculated by the CFD method. Then, the fiber deformation is calculated by transient structural analysis, which, in turn, affects the CFD calculation of the flow field. The effect of vibration on heat and mass transfer in the inner tube was ignored in this study. Detailed dimensions of the model are listed in
Table 1.
2.2. Governing Equations
To establish a suitable mathematical model for the simulation, the following assumptions were made: (1) the fluid is an incompressible Newtonian fluid; (2) the physical parameters are constant; (3) the heat effect caused by viscous dissipation during fluid flow is ignored.
2.2.1. Governing Equation for the Solid Domain
The domain of the hollow fiber membrane is solid. The response of the hollow fiber membrane to the internal and external loads can be defined by partial differential equations. The momentum equations of the solid domain in the
x,
y, and
z directions are depicted as:
where
σ represents the stress (Pa),
ρs is the density of the hollow fiber membrane (kg/m
3),
b is the acceleration of the volume element (m
2/s), and
t is time (s).
The energy conservation equation is as follows:
where
e is the energy (J) and
ε is the dissipation rate of the turbulent kinetic energy (m
2/s
3).
2.2.2. Governing Equation for the Fluid Domain
In the fluid domain, there are two kinds of fluids: air and solution. Both air and solution are defined as Newtonian fluids, which are incompressible, and their thermophysical properties are assumed to be unchanged. The RNG k-epsilon model was chosen to describe the flow state, which can be found in [
44]. The governing equation for the fluid is as follows:
where
p is the static pressure (Pa),
ρfg is gravity (N), and
F is the external volume force (N).
Dynamic grid technology theory was applied to capture the deformation of the solid domain based on the Lagrangian–Euler method. Therefore, the fluid–solid coupling problem can be solved through the deformed grid using the dynamic grid function. The control equations for momentum, energy, and species transport are [
45]:
where
Vam is the velocity of the air domain grid (m/s),
Va −
Vam is the velocity of the air relative to the grid (m/s),
Cp,a is the specific heat capacity of the air at constant pressure (J/kg∙K
−1),
λa is the thermal conductivity of air (W/m∙K
−1), and
ωa is the mass fraction of water vapor in humid air. The entire diffusion process is driven by the difference in concentration and temperature. According to Fick’s theory,
Ja is defined as:
where
Dv,a is the binary diffusion coefficient of water vapor in the air (m
2/s) and
Dv,T is the thermal diffusion coefficient of water vapor driven by the temperature field (m
2/s).
2.3. Boundary Conditions
When performing fluid–solid coupling calculations, the velocity, displacement, and stress of the fluid–solid interface need to meet certain conditions to balance the forces on both sides. The boundary conditions of the interface are:
where
d is the displacement (m) and
n refers to the unit normal vector of stress, which is perpendicular to the interface of fluid and solid.
Fiber tubes produce a vibration response under the effect of pulsating flow. Due to the existence of damping, there will be energy loss at the fluid–solid interface. The dynamic response equation of the system is:
Pulsating air causes the hollow fiber membrane (the solid domain) to vibrate, and the force equation is:
where
M,
C,
K, and
RT are the mass matrix, damping matrix, stiffness matrix and coupling matrix, respectively.
Air flows along the positive direction of the
x-axis, and the solution flows along the positive direction of the
z-axis. The velocity of the air is defined as a sine function, and its definition is:
where
A is the amplitude,
B is the frequency, and
C is the phase.
The main object of this research was air in the shell side, with the flow rate of liquid in the inner tube remaining unchanged. The amplitude and frequency of pulsating flow were altered in this simulation; detailed setups are given in
Table 2.
The temperature and humidity in the inlet are defined as:
At the fiber outer surface, the uniform temperature and humidity condition is applied.
At the air outlet, the boundary condition is defined as:
The parameter setups and fiber material properties in the calculation are shown in
Table 3. The main purpose of our current research was to study the heat and mass transfer performance of a single fiber under flow-induced vibration through the two-way FSI method. The solution method was based on constant wall temperature/concentration boundary conditions; therefore, the results of the dimensionless heat and mass transfer coefficient are suitable for a wide range of applications, such as gas separation, seawater desalination, and sewage treatment.
2.4. Solution Strategy
Under practical conditions, even at Reynolds numbers ranging from 50 to 350 [
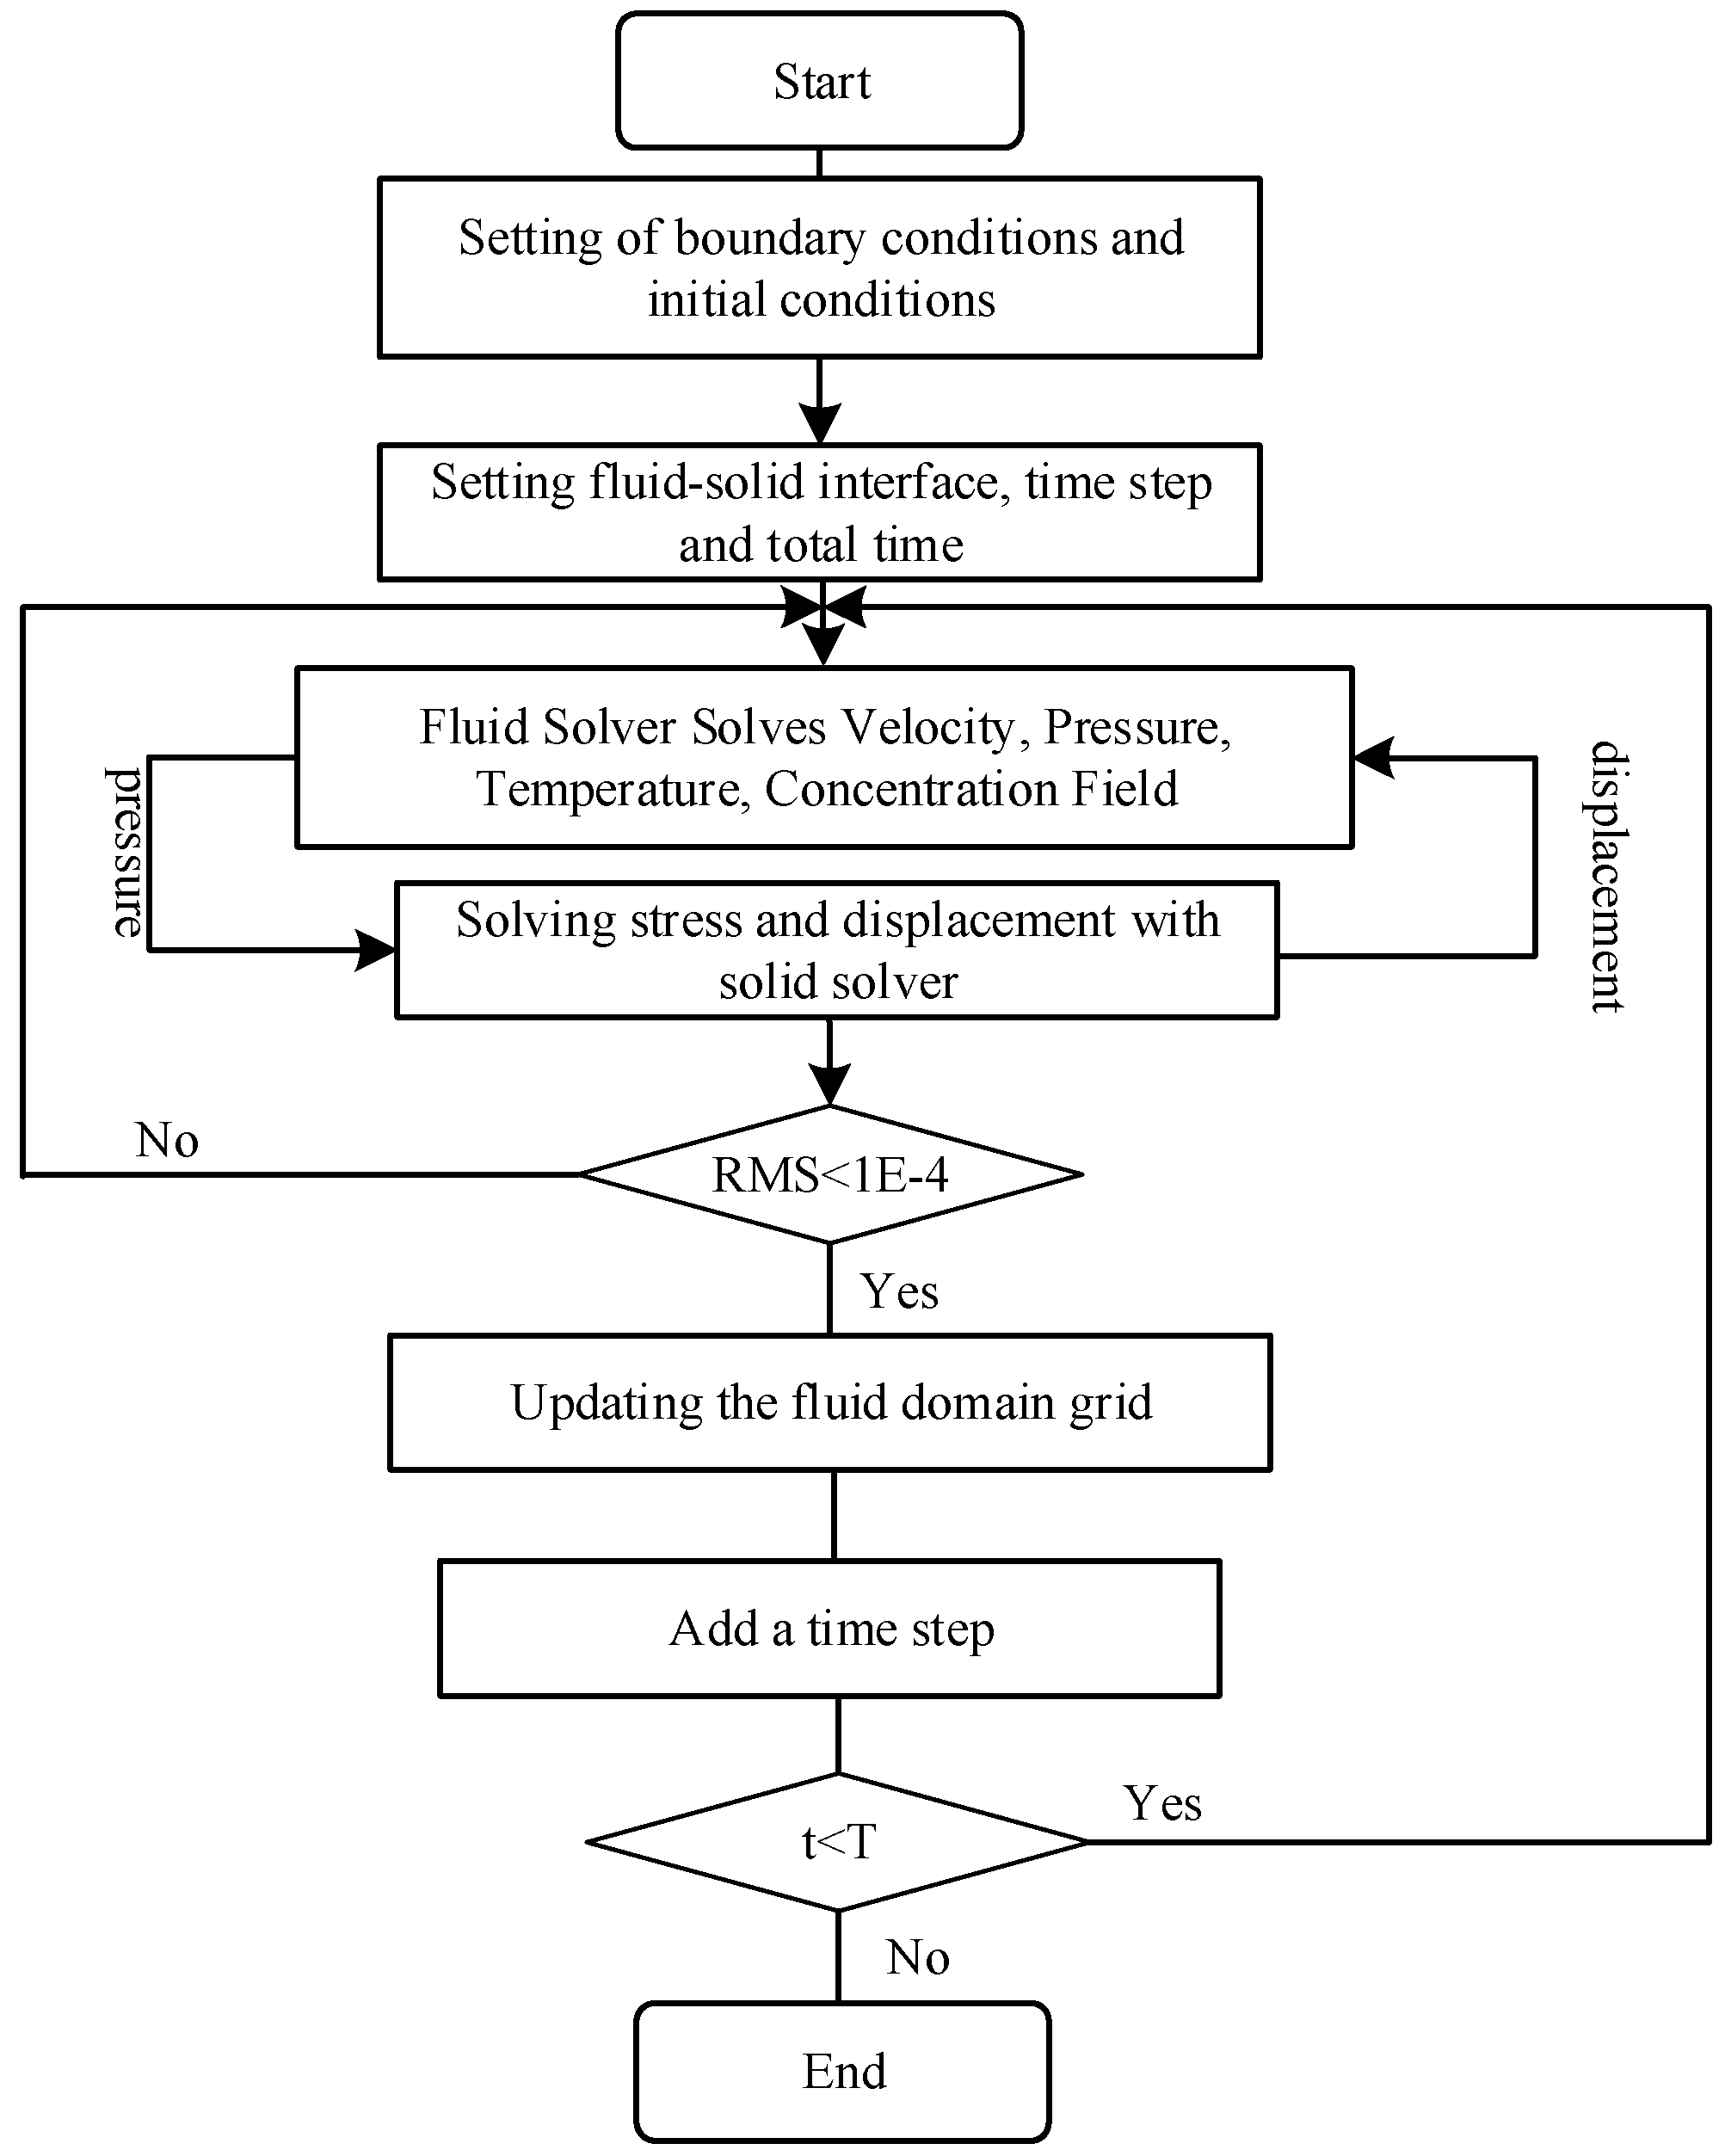
44], turbulence will be generated when air flows across the fiber bundle. The entire calculation process is shown in
Figure 2.
(1) According to the previously specified boundary conditions, the flow velocity, pressure data, temperature data, and concentration data of the internal and external flow fields were calculated. At the time t = 0, the pressure data are transmitted to the solid structure solver through the system coupling communication module. Additionally, no deformation information on the solid domain is transmitted to the fluid domain.
(2) The transient structure solver receives the pressure data of the fluid domain transmitted by the system-coupling calculation module. Then, the transient structure solver applies pressure to the solid surface as a load and calculates the deformation of the fiber at this time step. The solver judges convergence according to the root mean square (RMS) value in this time step. When RMS value of deformation changes less than 1 × 10⁻⁴, the result at this time step is judged as converged. The deformation data are transmitted through the system coupling to the fluid domain, updating the dynamic mesh, and changing the shape of the fluid domain.
(3) The system coupling calculation module enters the next time step, repeats the first and second steps in the fluid domain after the mesh is updated, and keeps looping until the pre-specified end time is reached.
where
θ is the grid diffusion coefficient and
ufm is the velocity of the grid movement.
2.5. Mesh Independence Check
Two-way fluid–solid coupling calculations require considerable computing resources and time. Therefore, the choice of an appropriate grid number can effectively improve computational efficiency. A mesh independence check was performed in this study, and the calculation data for different grid systems are given in
Table 4. In total, five grid systems were generated for calculation. The temperature and mass fraction of water vapor in the air outlet were selected to check the computational accuracy. The results show that when the grid number is larger than 293,025, the deviation for temperature and mass fraction of water vapor is less than 0.01%. Considering the calculation power and time consumption, a grid system with node number 293,025 was selected for calculation.
2.6. Performance Criterion
The Reynolds number is:
where
Vm is the average velocity of incoming air (m/s), and
Dh is the hydraulic diameter (m). For airflow,
Dh is equal to the fiber outer diameter. For solution flow,
Dh is equal to the inner fiber diameter.
The performance criterion for the heat and mass transfer is represented as Nusselt number, Sherwood number, heat transfer enhancement index, and mass transfer enhancement index. The definition of the Nusselt number is:
where
h is the convective heat transfer coefficient (W/m
2⋅K
−1).
h is calculated as:
where the subscripts
i and
o represent the inlet and outlet, respectively,
Ai is the area of the inlet,
Amem is the total area of the hollow fiber membrane (m
2), and Δ
Tlog is the logarithmic mean temperature difference.
where the subscript
W means wall.
The Sherwood number is calculated by:
where
ka is the convective mass transfer coefficient (m/s).
ka is calculated as:
where Δ
ω is the logarithmic mean humidity difference:
The heat transfer enhancement index is defined as [
46]:
where Δ
Tc (K) is the temperature difference between air inlet and outlet when the fiber vibrates, and Δ
Tuc (K) is the temperature difference when the fiber does not vibrate.
The mass transfer enhancement index is defined as:
where Δ
ωc is the mass fraction difference of water vapor between the air inlet and outlet when the fiber vibrates and Δ
ωuc is the mass fraction difference of water vapor when the fiber does not vibrate.
3. Experiment Verification
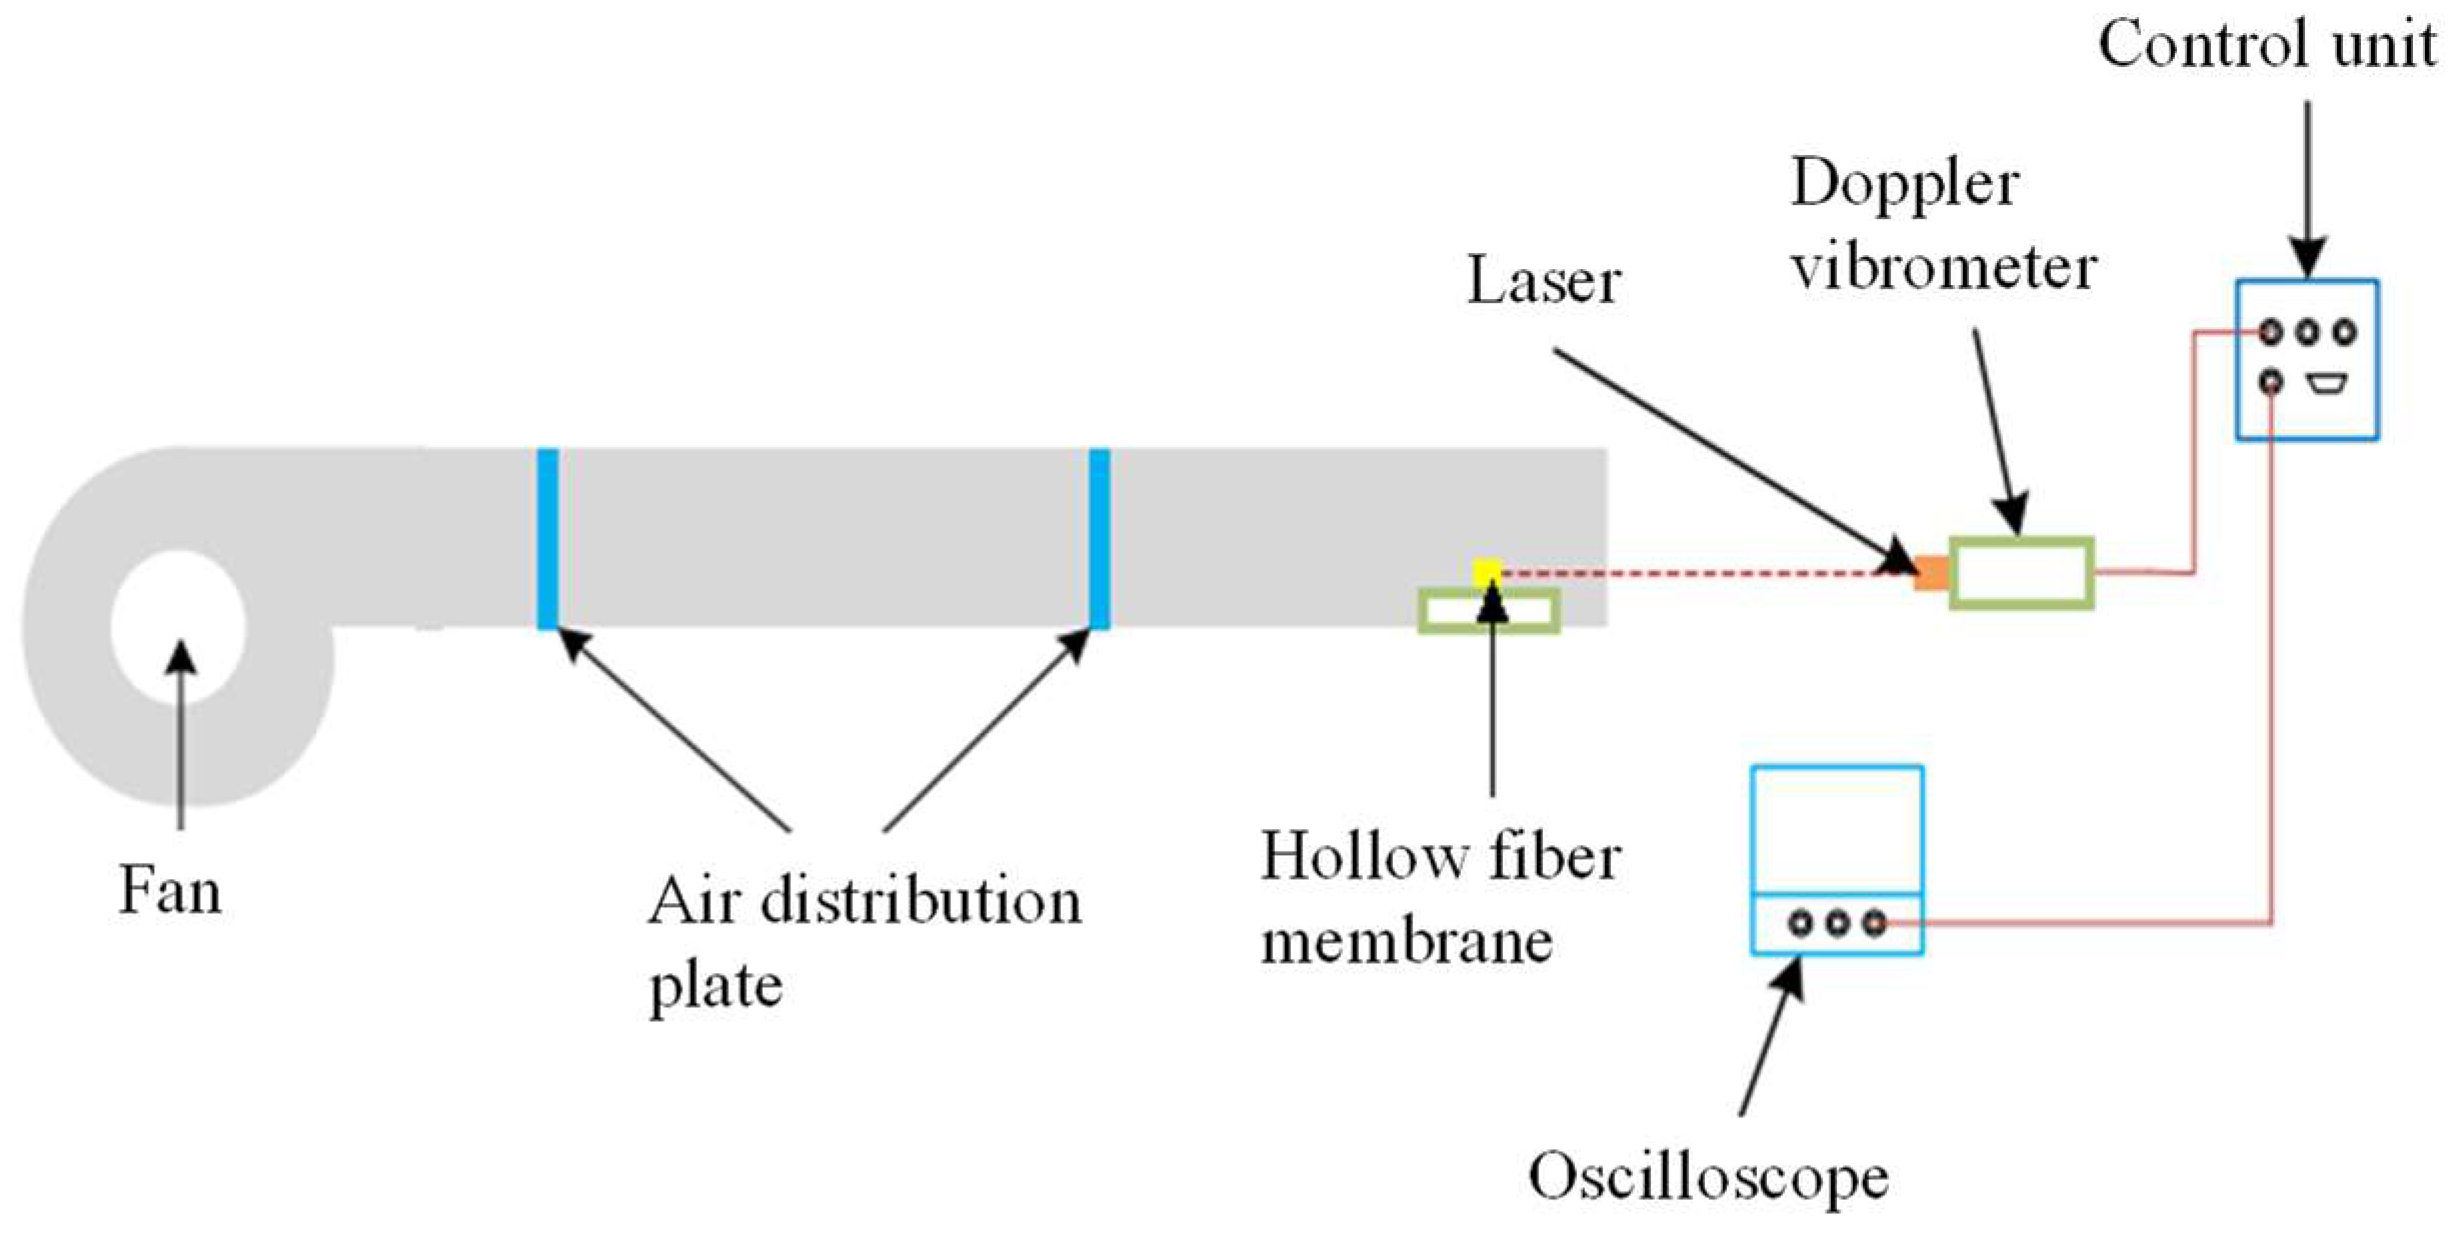
The experiment was conducted to verify the fiber vibration calculated by the numerical model. The experimental device for measuring the flow-induced vibration of a single hollow fiber membrane is shown in
Figure 3. A hollow fiber membrane made of polyvinylidene fluoride with a nominal pore size of 0.4 μm was used for the test. The inner tube of the fiber was filled with water, and both ends of the fiber penetrated an acrylic plate through a hole and were then fixed with epoxy glue. The hollow fiber membrane had an outer diameter of 1.7 mm, an inner diameter of 1.5 mm, and a length of 10 cm. The air volume flow rate was controlled using a draught fan with variable frequency (SIEMENS
® 1LE001, SIEMENS Co. Ltd., Berlin, Germany). To ensure the accuracy of the numerical over a wide
Re range, the incoming air velocity was tested from 0 to 2.5 m/s. The corresponding Reynolds number was 0–275. To ensure the measurement accuracy of the air velocity, the data were tested after 1 min of adjusting the fan frequency. Additionally, for each Reynolds number, three wind speeds were recorded with a time interval of 30 s. A circular tube with a diameter of 15 cm and a length of 5 m was used as the test flow channel. The incoming air velocity was measured using the Testo-425 hot wire anemometer. The flow-induced fiber deformation was tested using the laser vibrometer (melectro
® V-100lm type-DA) produced by DENSHIGIKENQ Co., Ltd. (Osaka, Japan). This laser vibrometer has high precision and good linearity. It can ensure the consistency of amplitude in the high-frequency range. This apparatus uses laser reflection to measure the fiber deformation; therefore, it is not limited by distance and adds no additional mass to the test section, so it is suitable for measuring hollow fiber membranes.
The pressure drop of a single fiber is difficult to measure accurately because it is much lower than the pressure drop of airflow through tube bundles. Additionally, it is hard to test the pressure drop difference between a vibrating and non-vibrating fiber. The arrangement of the fiber will greatly affect the velocity field of flow across a fiber bundle; thus, the pressure drops for flow across a single fiber or fiber bundle are quite different. Obtaining the pressure drop of flow across a tube bundle is more meaningful. Thus, the pressure drop was not tested in this study.
4. Results and Discussions
4.1. Model Validation
To validate the numerical model, the amplitude of the hollow fiber was tested and compared with the numerical results. The tested air velocity was higher than that used in actual operating conditions. The selected air velocities were 1 m/s, 1.5 m/s, 2 m/s, and 2.5 m/s, corresponding to
Re numbers of 110, 165, 220, and 275, respectively. For each
Re number, deformation data of fiber were tested five times. The results for fiber deformation in the
x and
y directions are given in
Table 5. The maximum deviations between the experimental and numerical data in the
x direction were −3.70%, 4.17%, −2.68%, and −2.07% for each
Re number, and in the
y direction, they were 7.69%, −6.52%, −3.85%, and 3.74%. The numerical data fitted well with the experimental results; therefore, this model is sufficiently accurate to predict the flow-induced vibration of hollow fiber membranes.
4.2. The Effect of Air Pulsation Amplitude on Stress Distribution of the Fiber
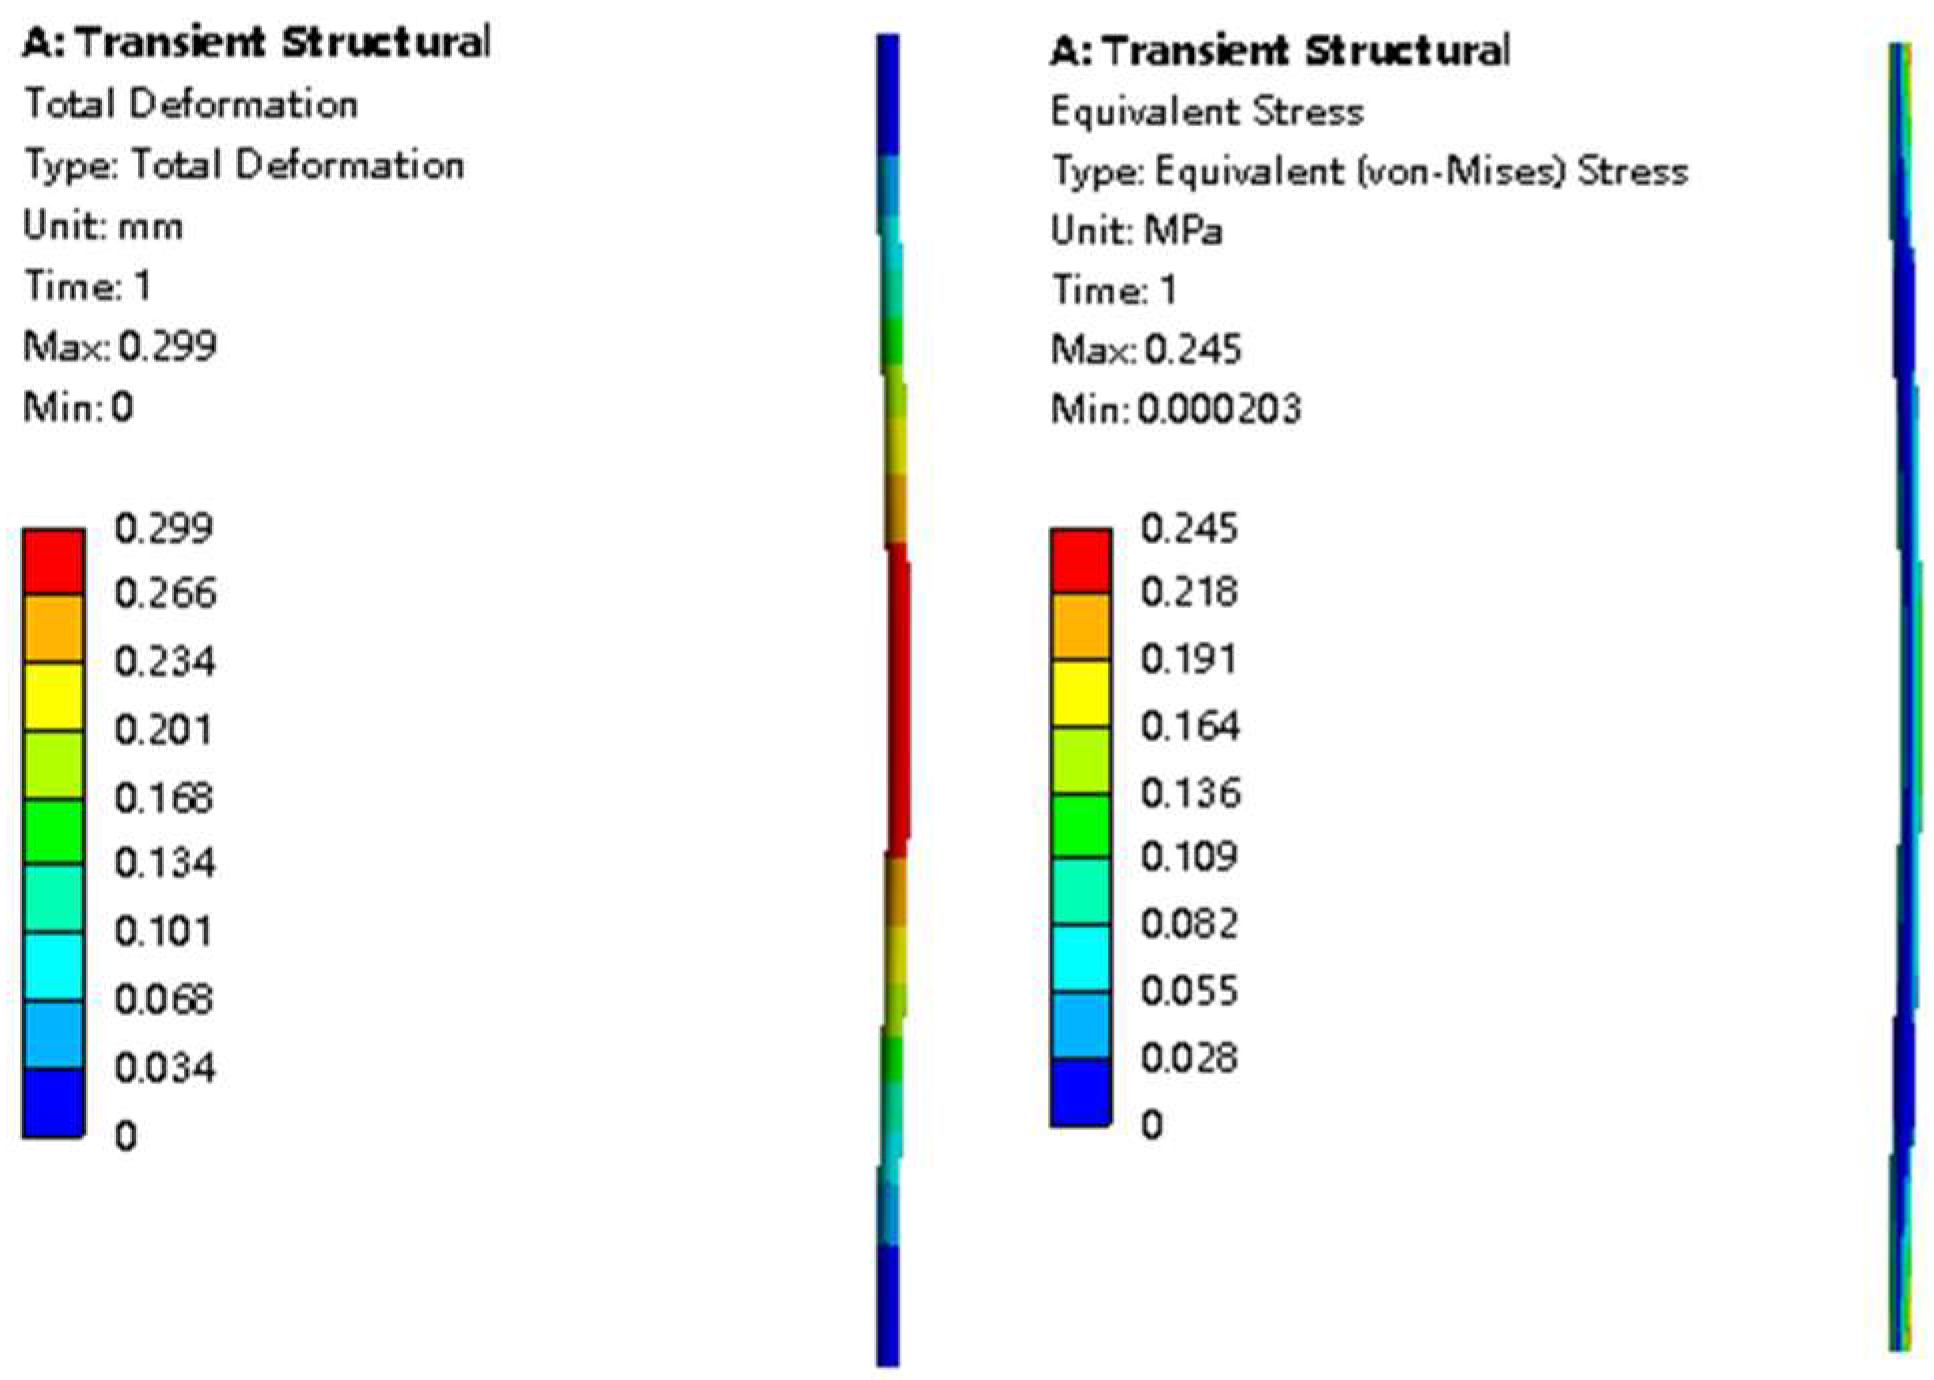
Fiber vibration causes frequent force variations at the fixed end of the fiber. Therefore, the fiber will be abraded, and its lifetime will be shortened. Thus, we need to know the stress distribution on the fiber to guide membrane module design. The deformation and stress distribution on the fiber are shown in
Figure 4. As can be seen from the figures, the maximum total deformation occurred in the center of the fiber. As for the stress distribution, the maximum value was at both ends of the fiber, and the second highest value was at the center of the fiber. This is consistent with our conjecture. The two ends of the fiber were fixed; therefore, the stress here was largest in the vibration process. Additionally, the wind speed at the center of the fiber was the greatest; thus, the stress there was relatively high. Detailed stresses for various
Re values are given in
Table 6. This approach can predict the stress distribution caused by flow-induced fiber vibration and thus provide data to establish the relationship between stress conditions and fiber lifetimes.
4.3. The Effect of Air Pulsation Amplitude on Heat Transfer Performance
The validated numerical model was used to simulate heat transfer in the humidification process. In this simulation, water flows into the fiber tube at a velocity of 0.08 m/s, corresponding to a laminar flow. Additionally, the incoming air velocities were 1 m/s, 1.5 m/s, 2 m/s, and 2.5 m/s, as depicted in
Table 2. The air pulsation frequency was set to 20 Hz.
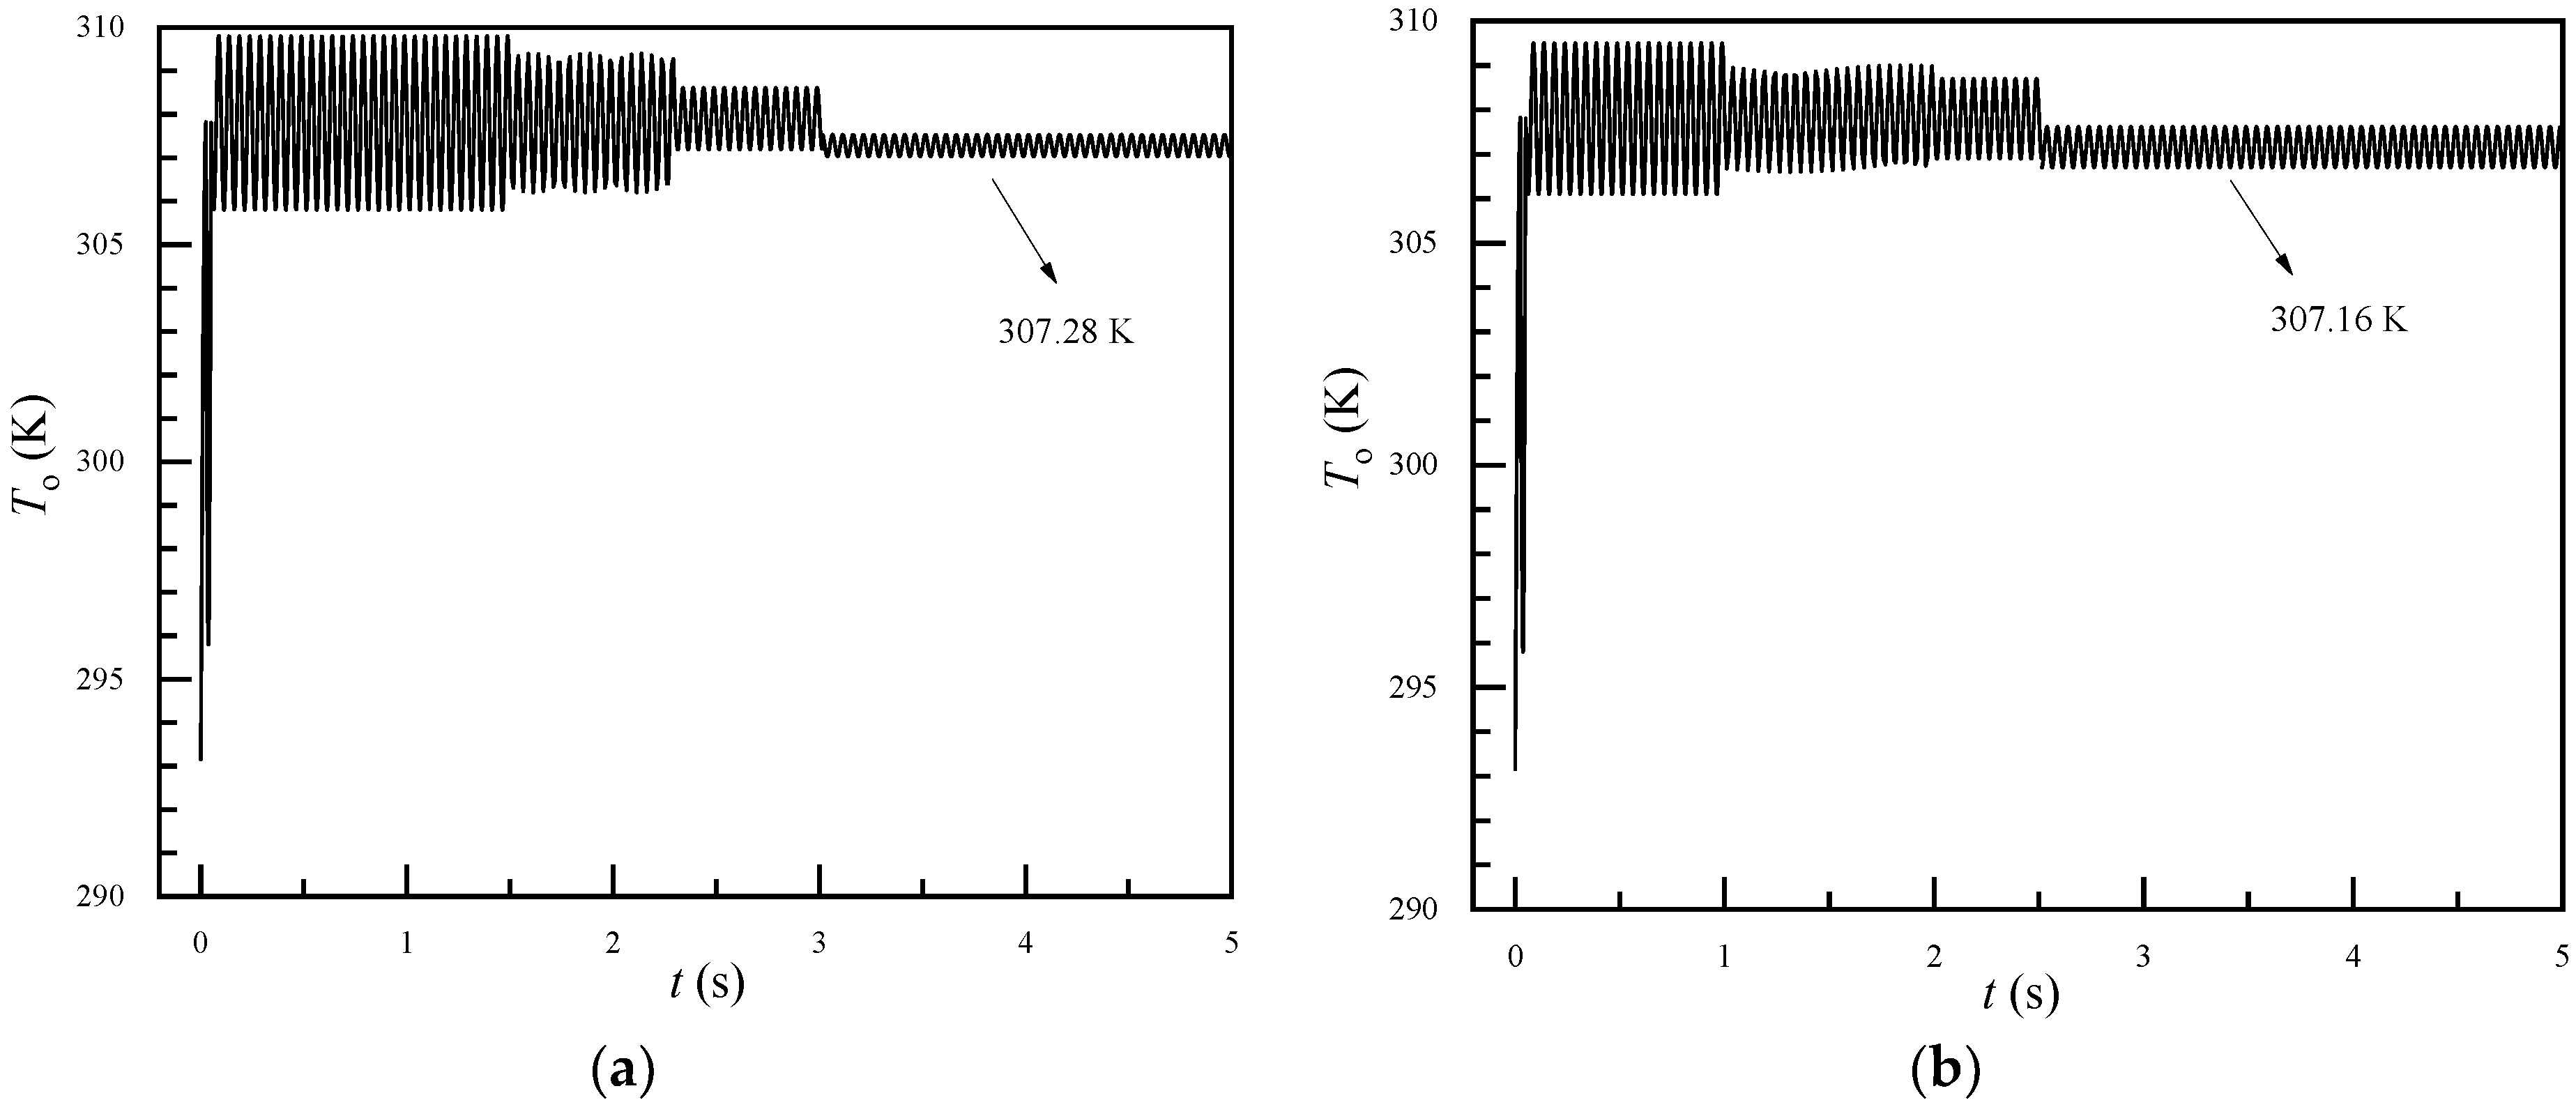
Figure 5 shows the transient variation of outlet air temperature with or without fiber vibration (
Vm = 1 m/s,
Re = 110). For
Figure 5a, only the incoming air pulsated in a sinusoidal waveform, and the FSI approach was not used in the calculation; thus, the fiber did not vibrate. In
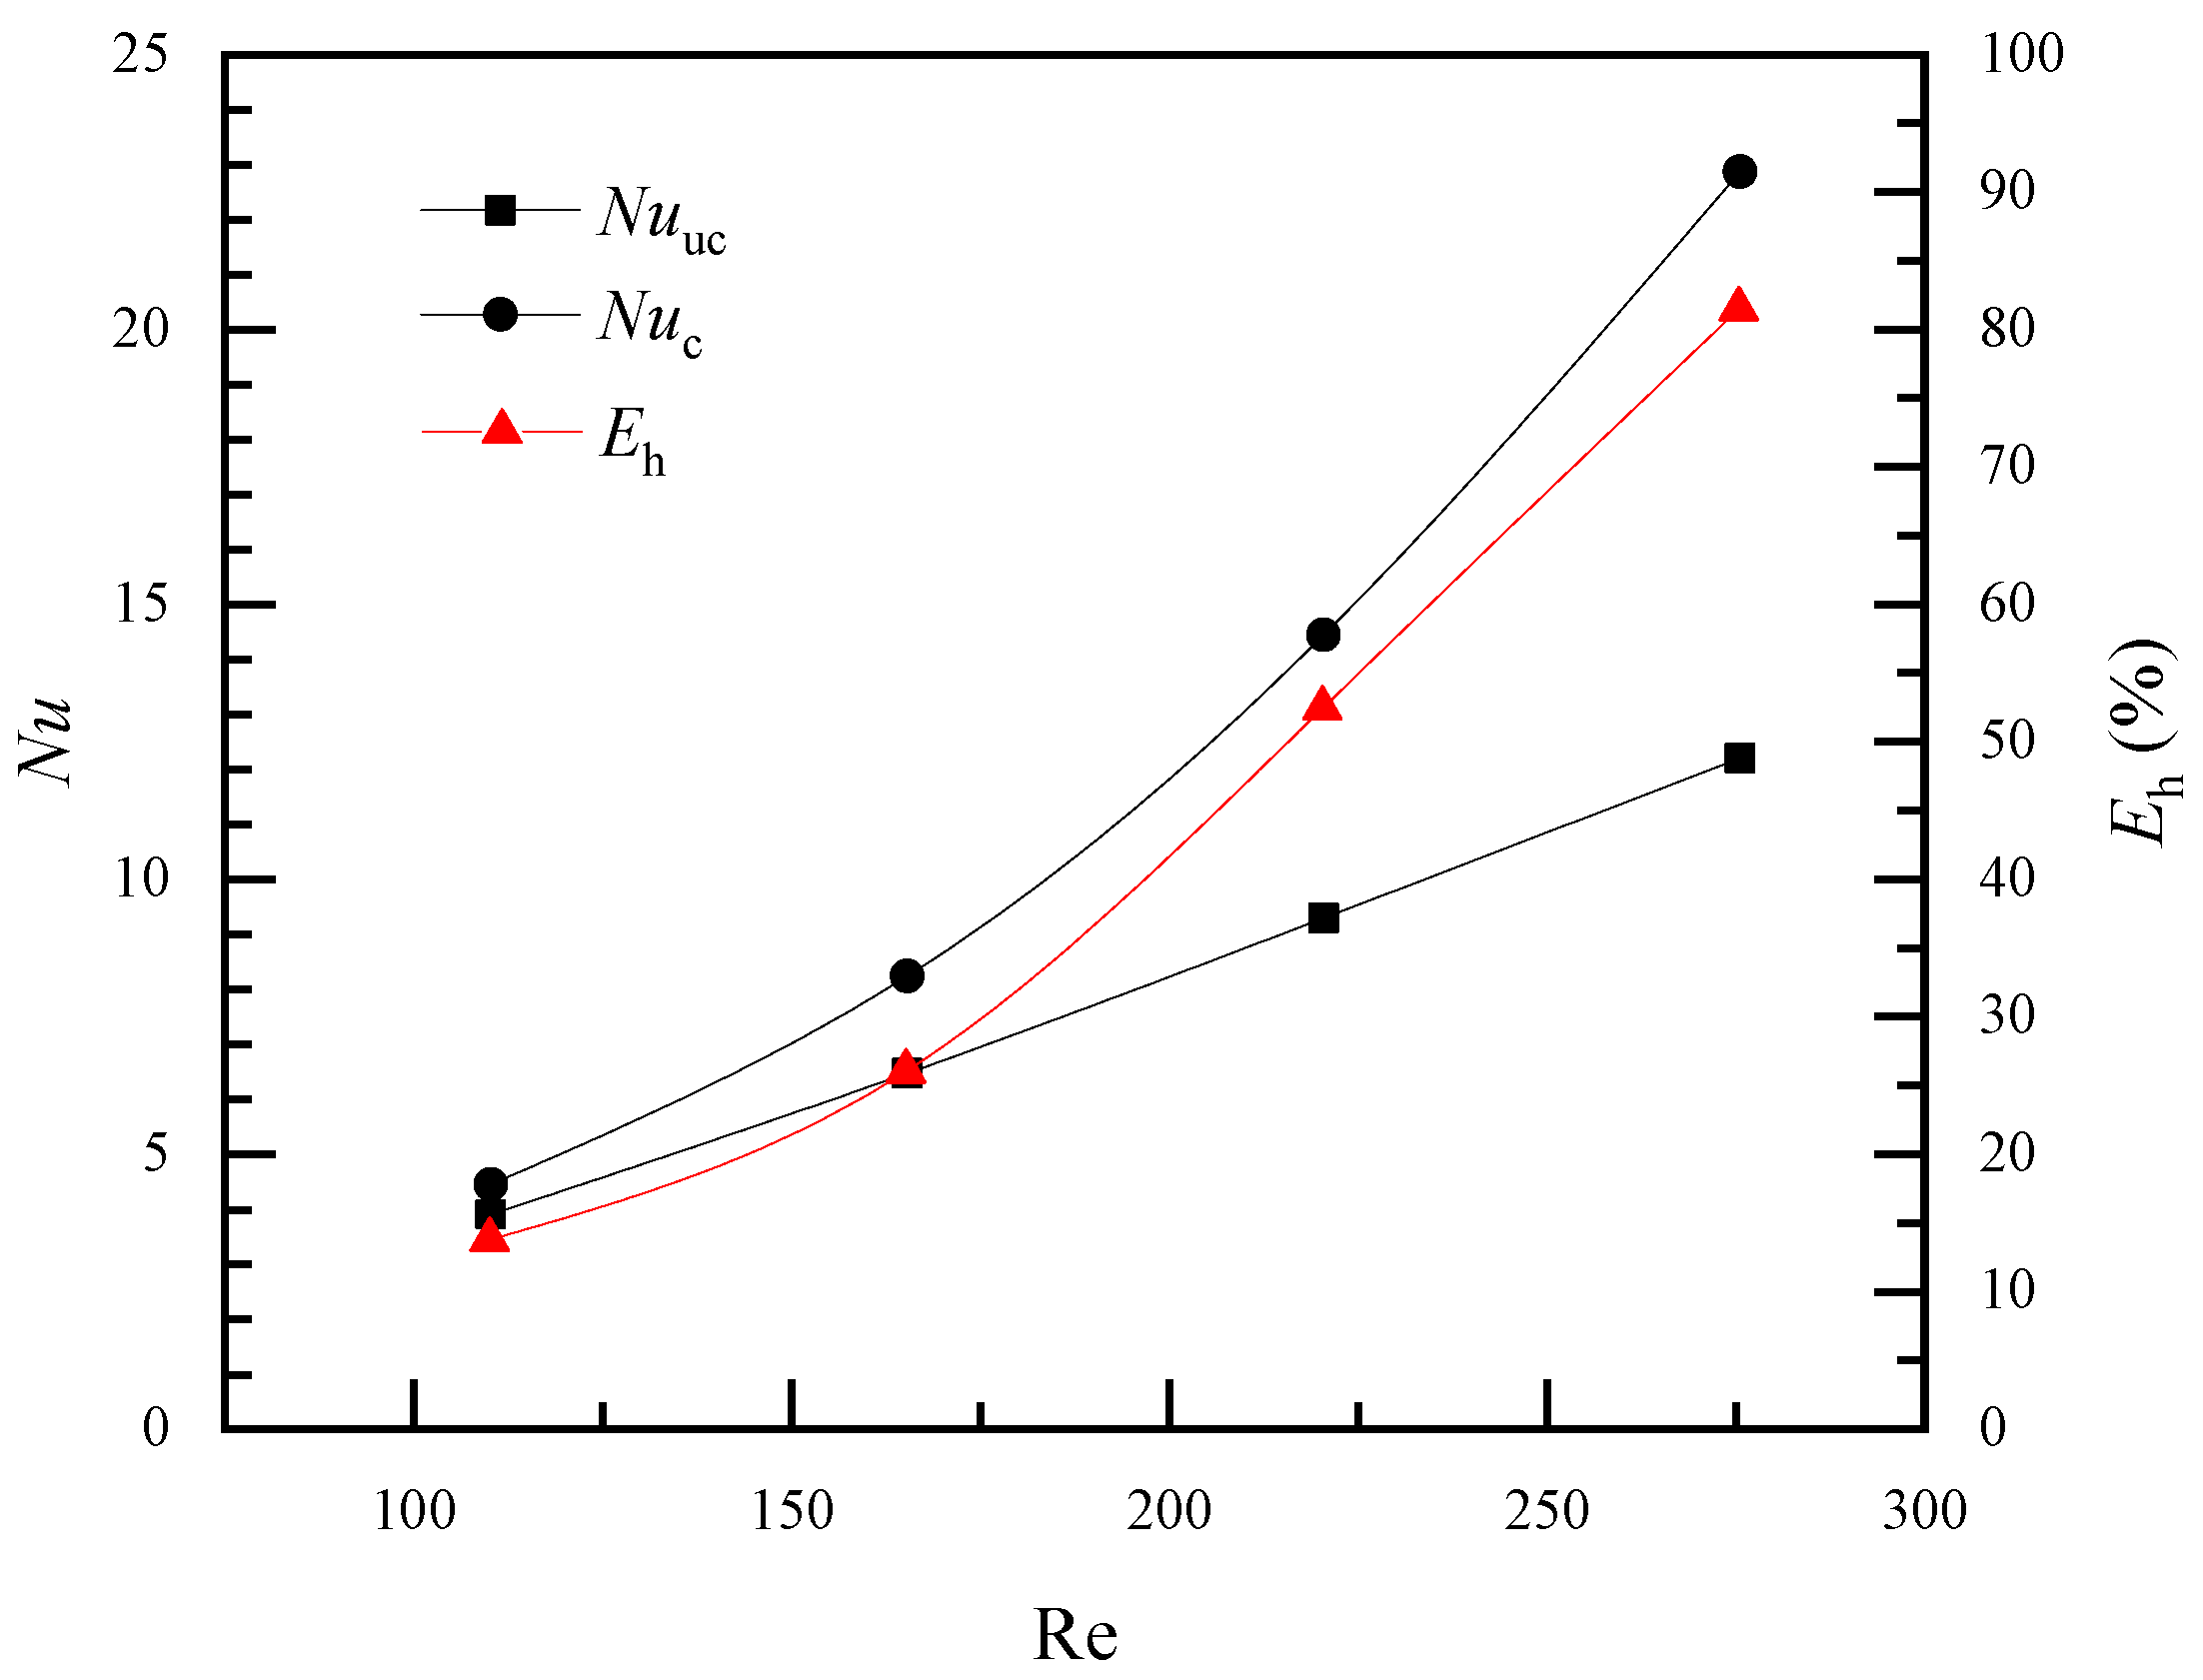
Figure 5b, the fiber was modeled with the FSI approach and vibrated with the inlet air. The outlet air temperature fluctuated with the sinusoidal waveform, similarly to the pulsation of the inlet air velocity. As time progressed, the pulsation amplitude of the air outlet temperature gradually decreased. In the later stage, the air outlet temperature was 307.16K when considering the vibration of the hollow fiber, and 307.28K when the fiber vibration is ignored. Additionally, the heat transfer enhancement index reached 13.8%. Detailed
Nu and
Eh values are given in
Figure 6. The maximum heat transfer enhancement index could be as high as 80%.
4.4. The Effect of Air Pulsation Frequency on Heat Transfer Performance
The effect of air pulsating frequency on heat transfer performance was also investigated. Parameters A and C in Equation (15) are assumed to be 1 and 1.5 in this section, respectively.
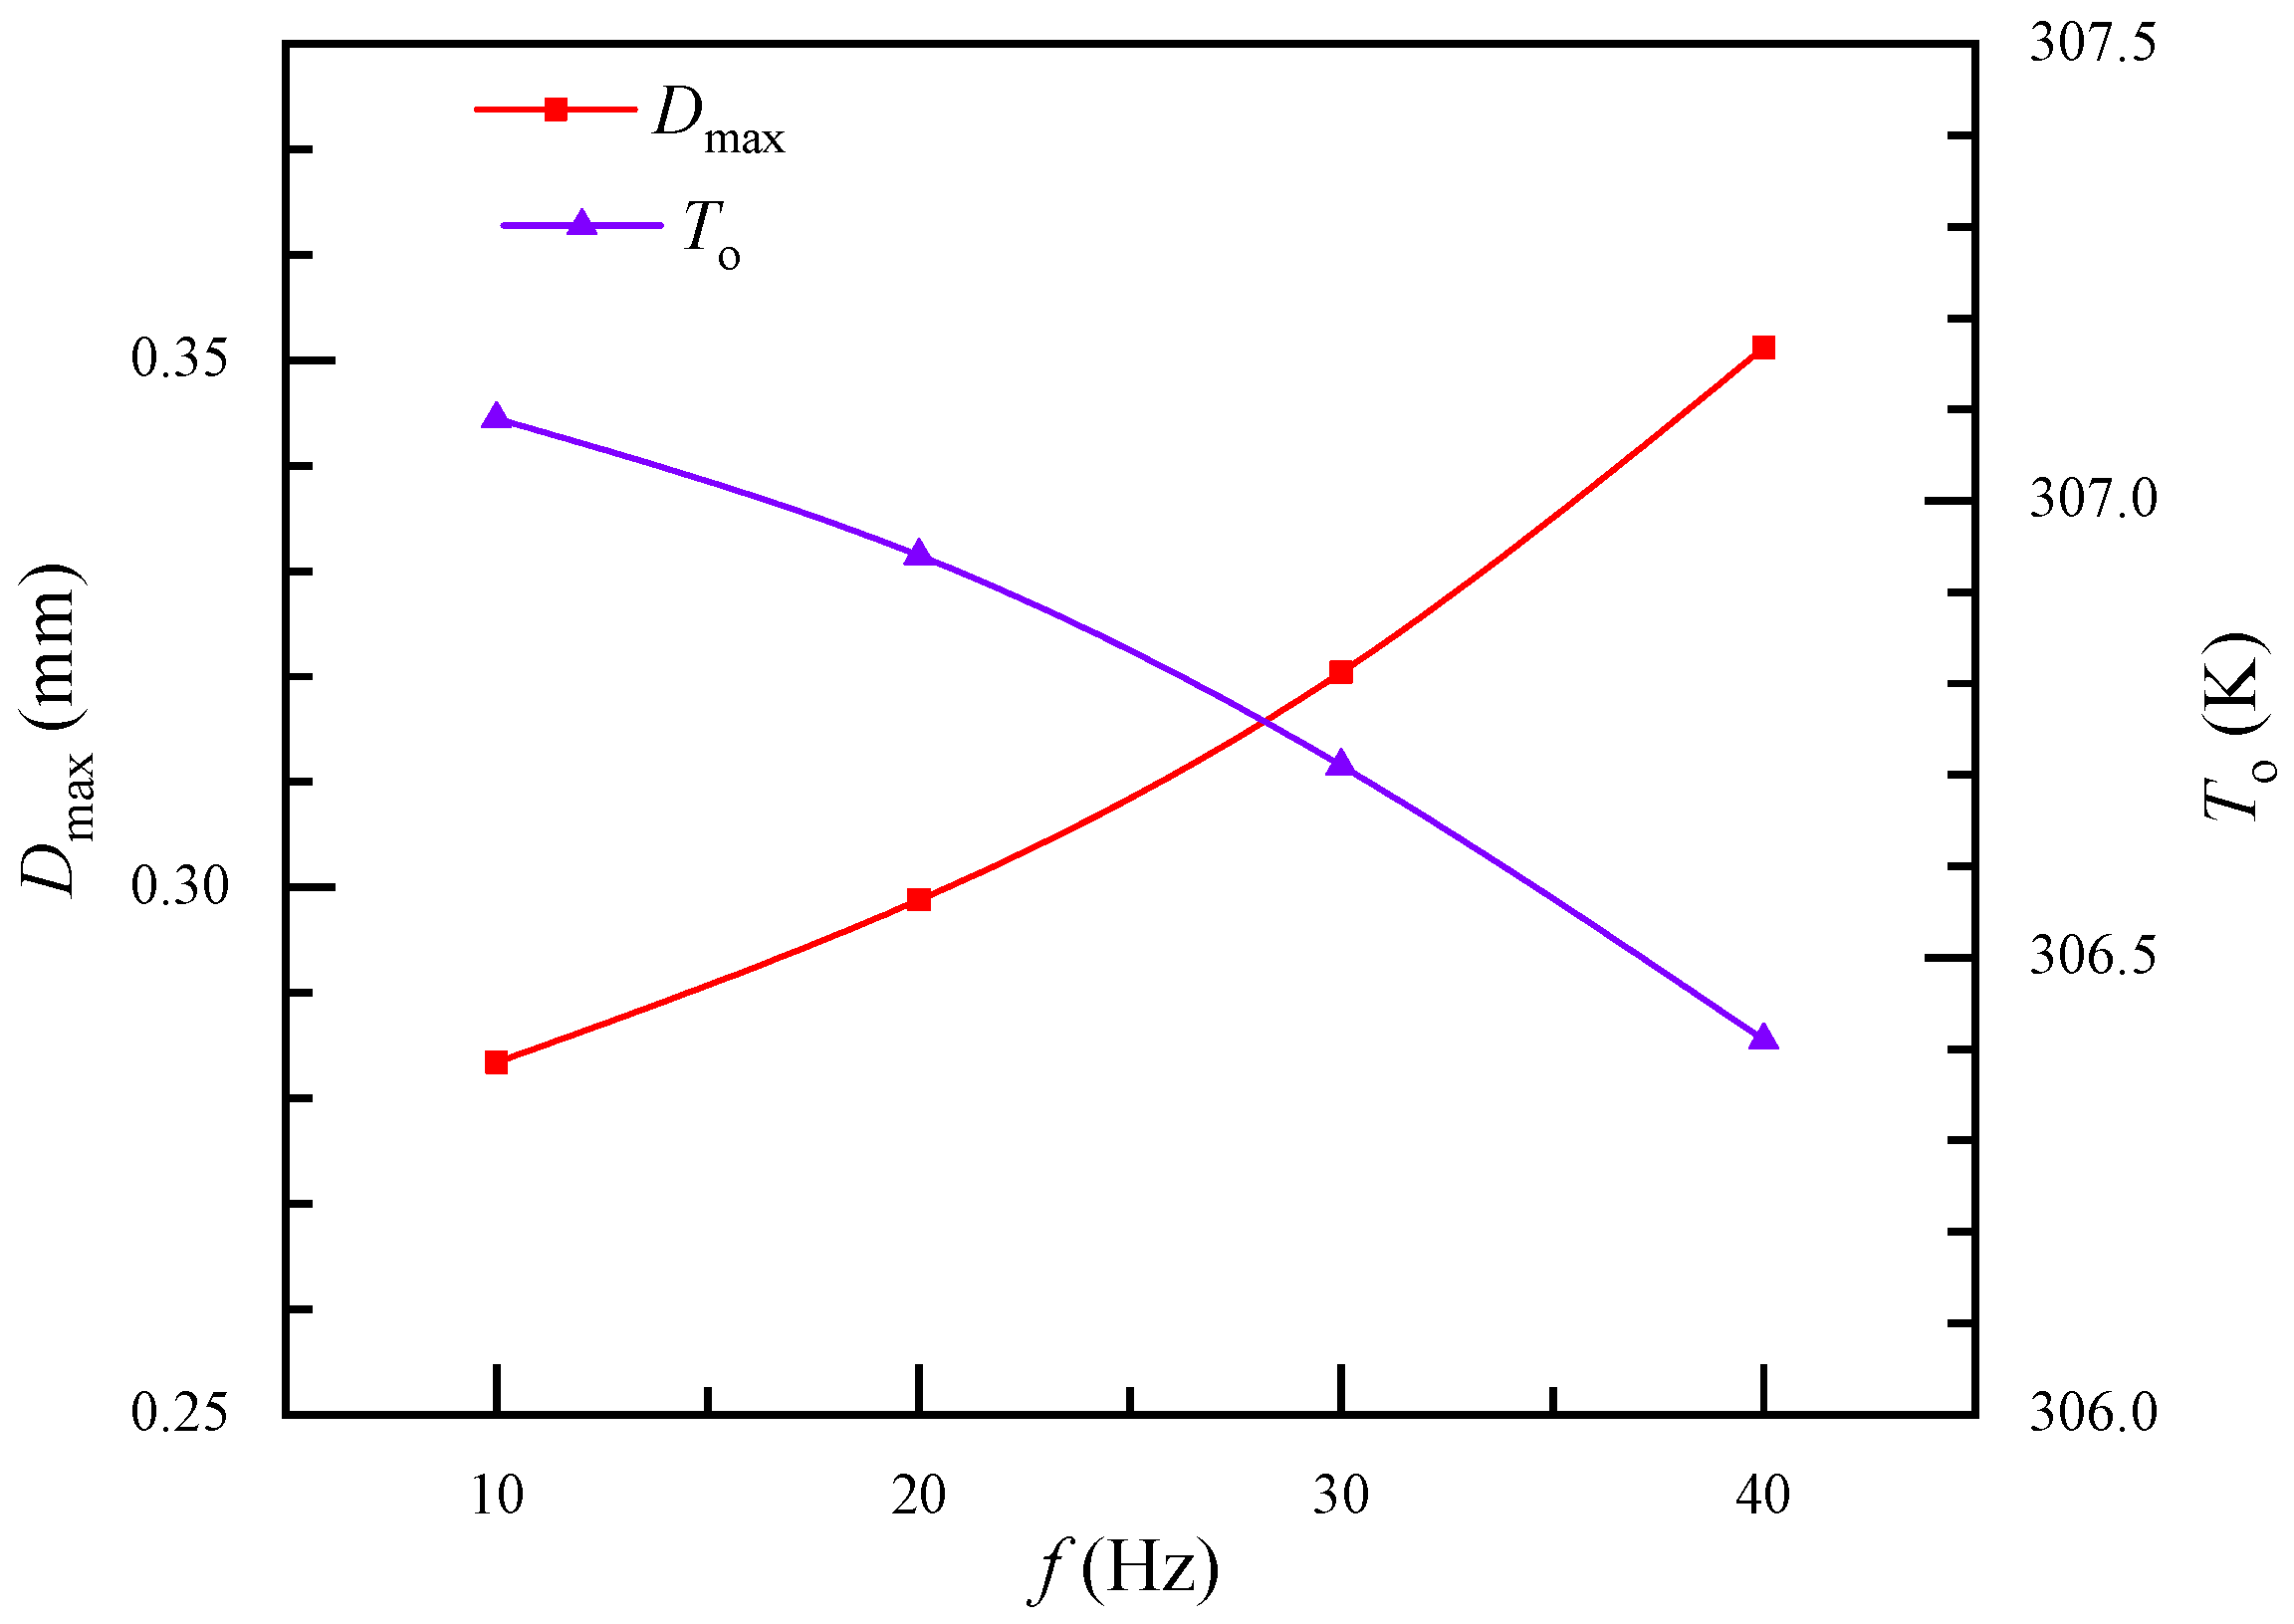
Figure 7 shows the air effect of pulsating frequency on maximum fiber deformation and outlet air temperature. The heat transfer enhancement index increased by 65.9% when the pulsating frequency increased from 10 Hz to 40 Hz. The maximum fiber deformation slightly increased with pulsating frequency, but the outlet air temperature apparently declined. This indicates that the pulsating frequency of incoming air had little effect on fiber deformation. Therefore, heat transfer enhancement may be caused by the pulsating frequency.
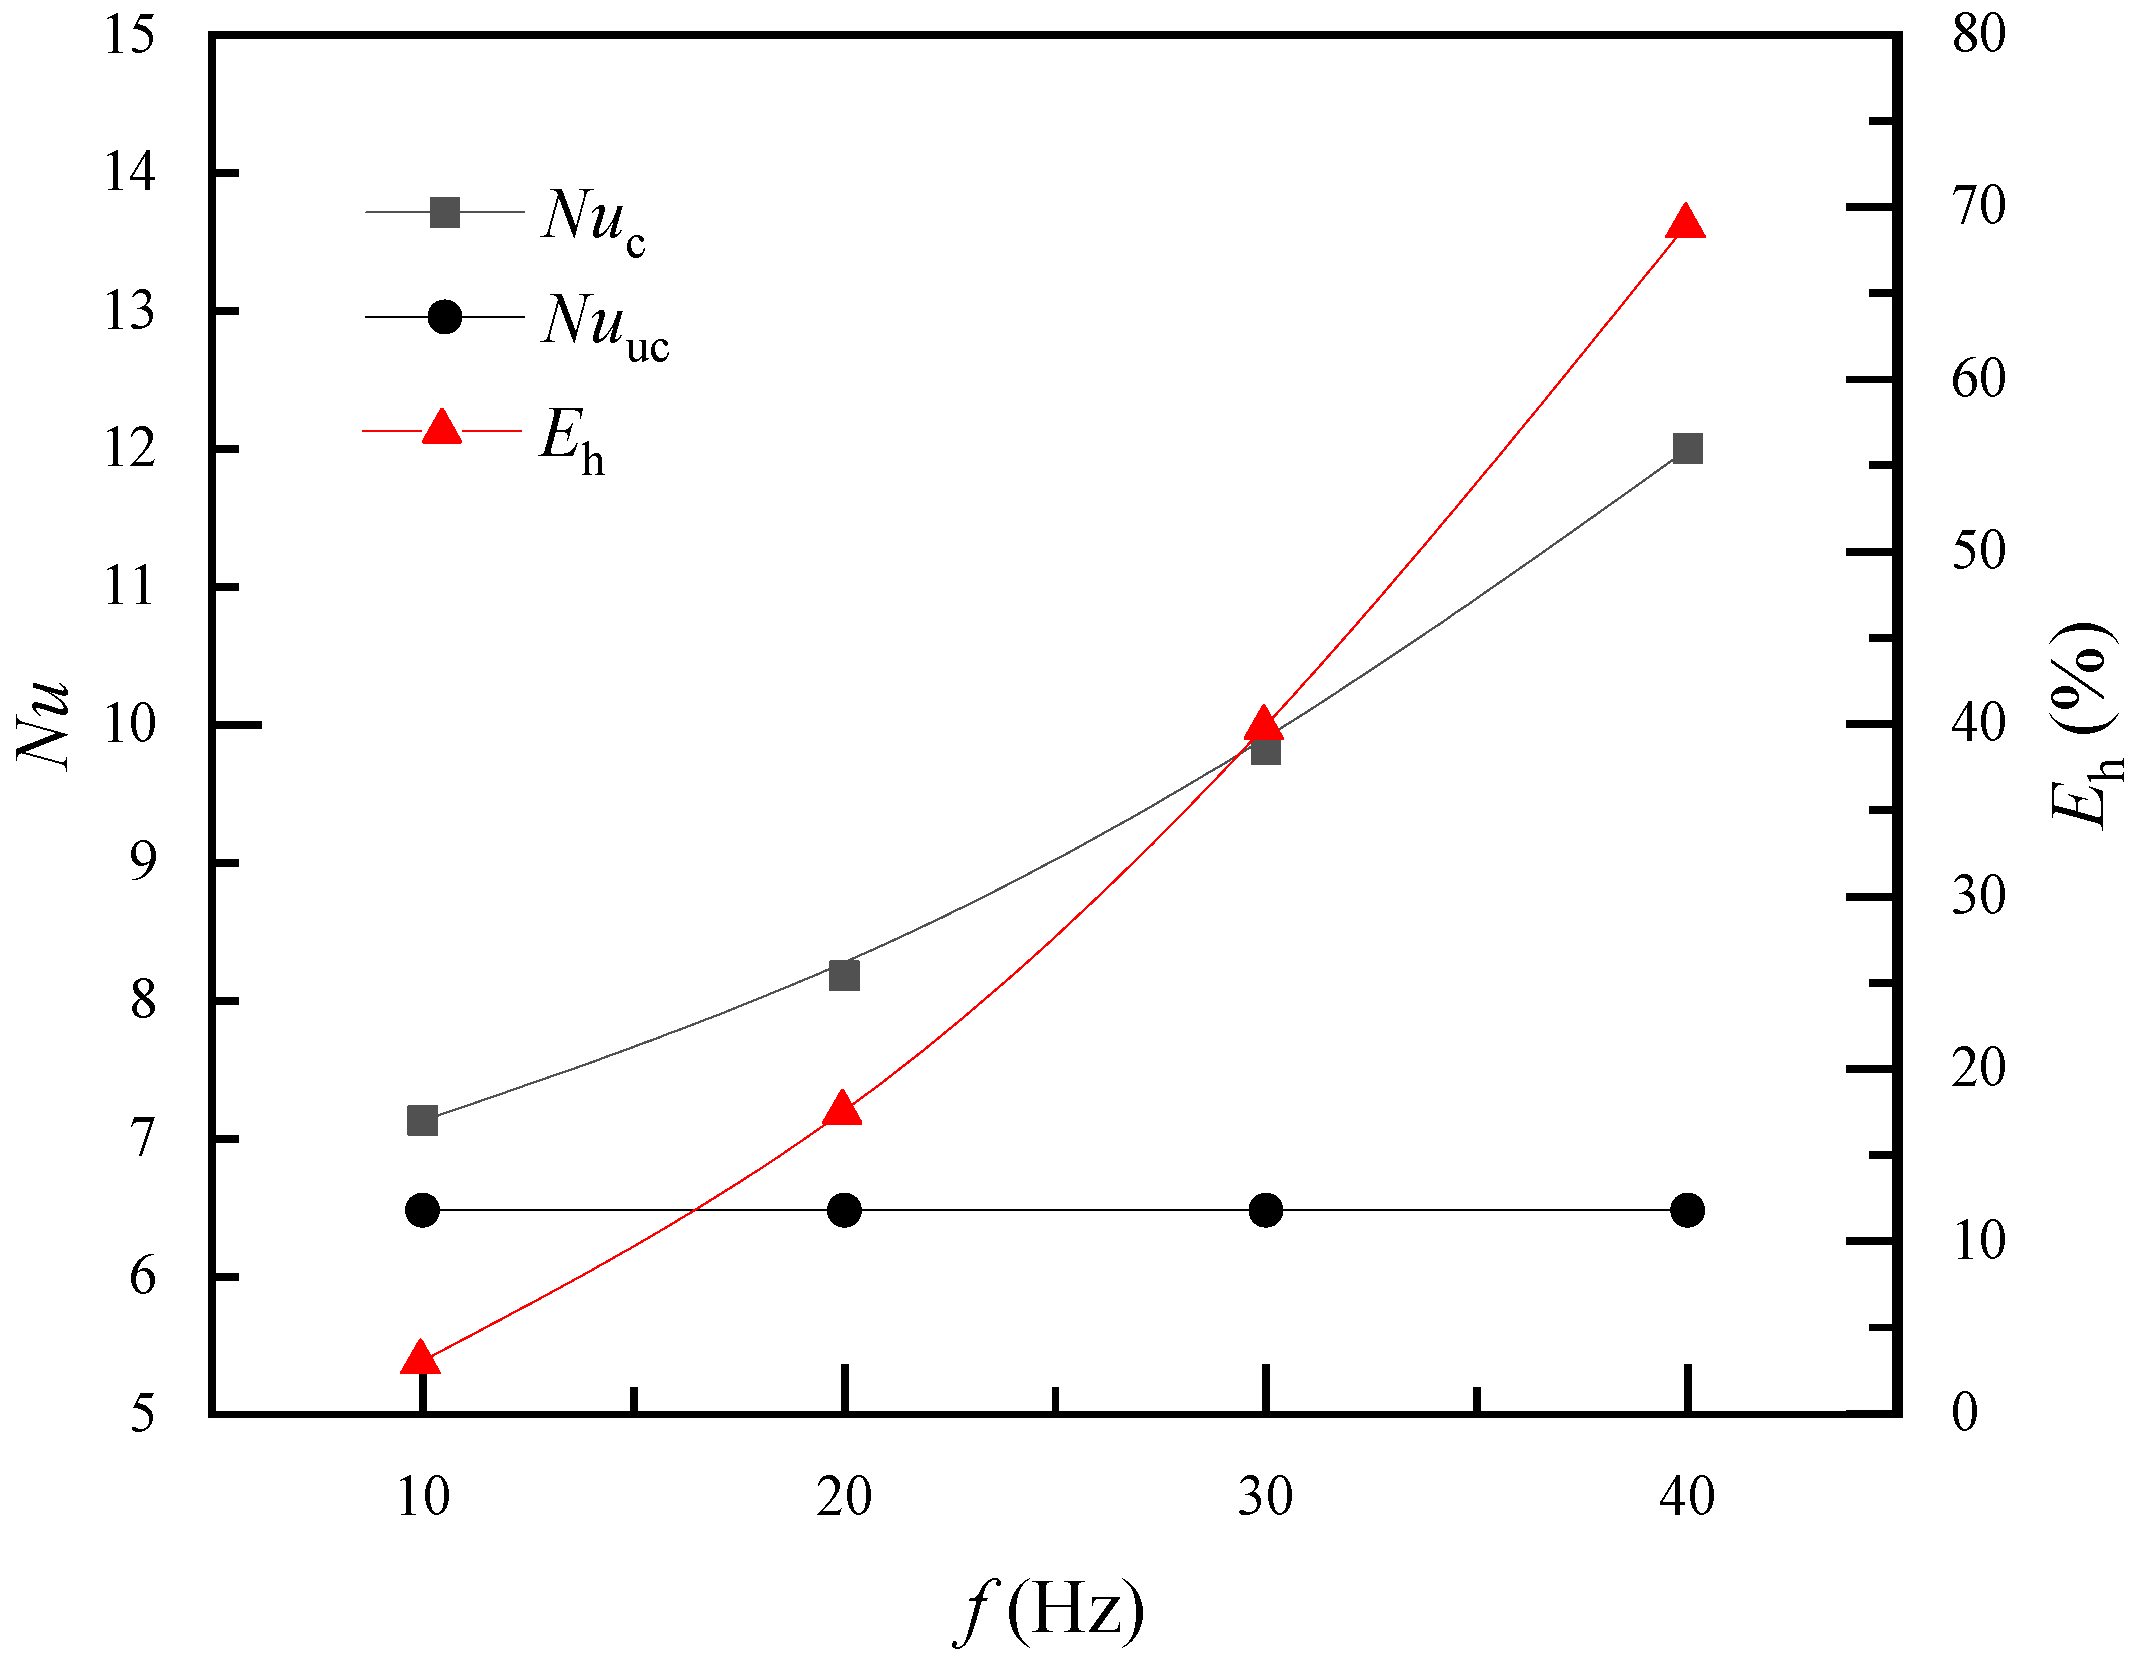
Figure 8 shows the relationship between
Nu and pulsating frequency.
Nuuc is a constant of 6.48 when the fiber is treated as a non-vibrating tube. When the fiber vibrates,
Nuc increases from 7.13 to 12.01 with increasing pulsation frequency. Convective heat transfer is usually enhanced by strengthened momentum transfer; therefore, the velocity field was analyzed. Hollow fibers will mainly vibrate toward the airflow direction, i.e., the
x direction.
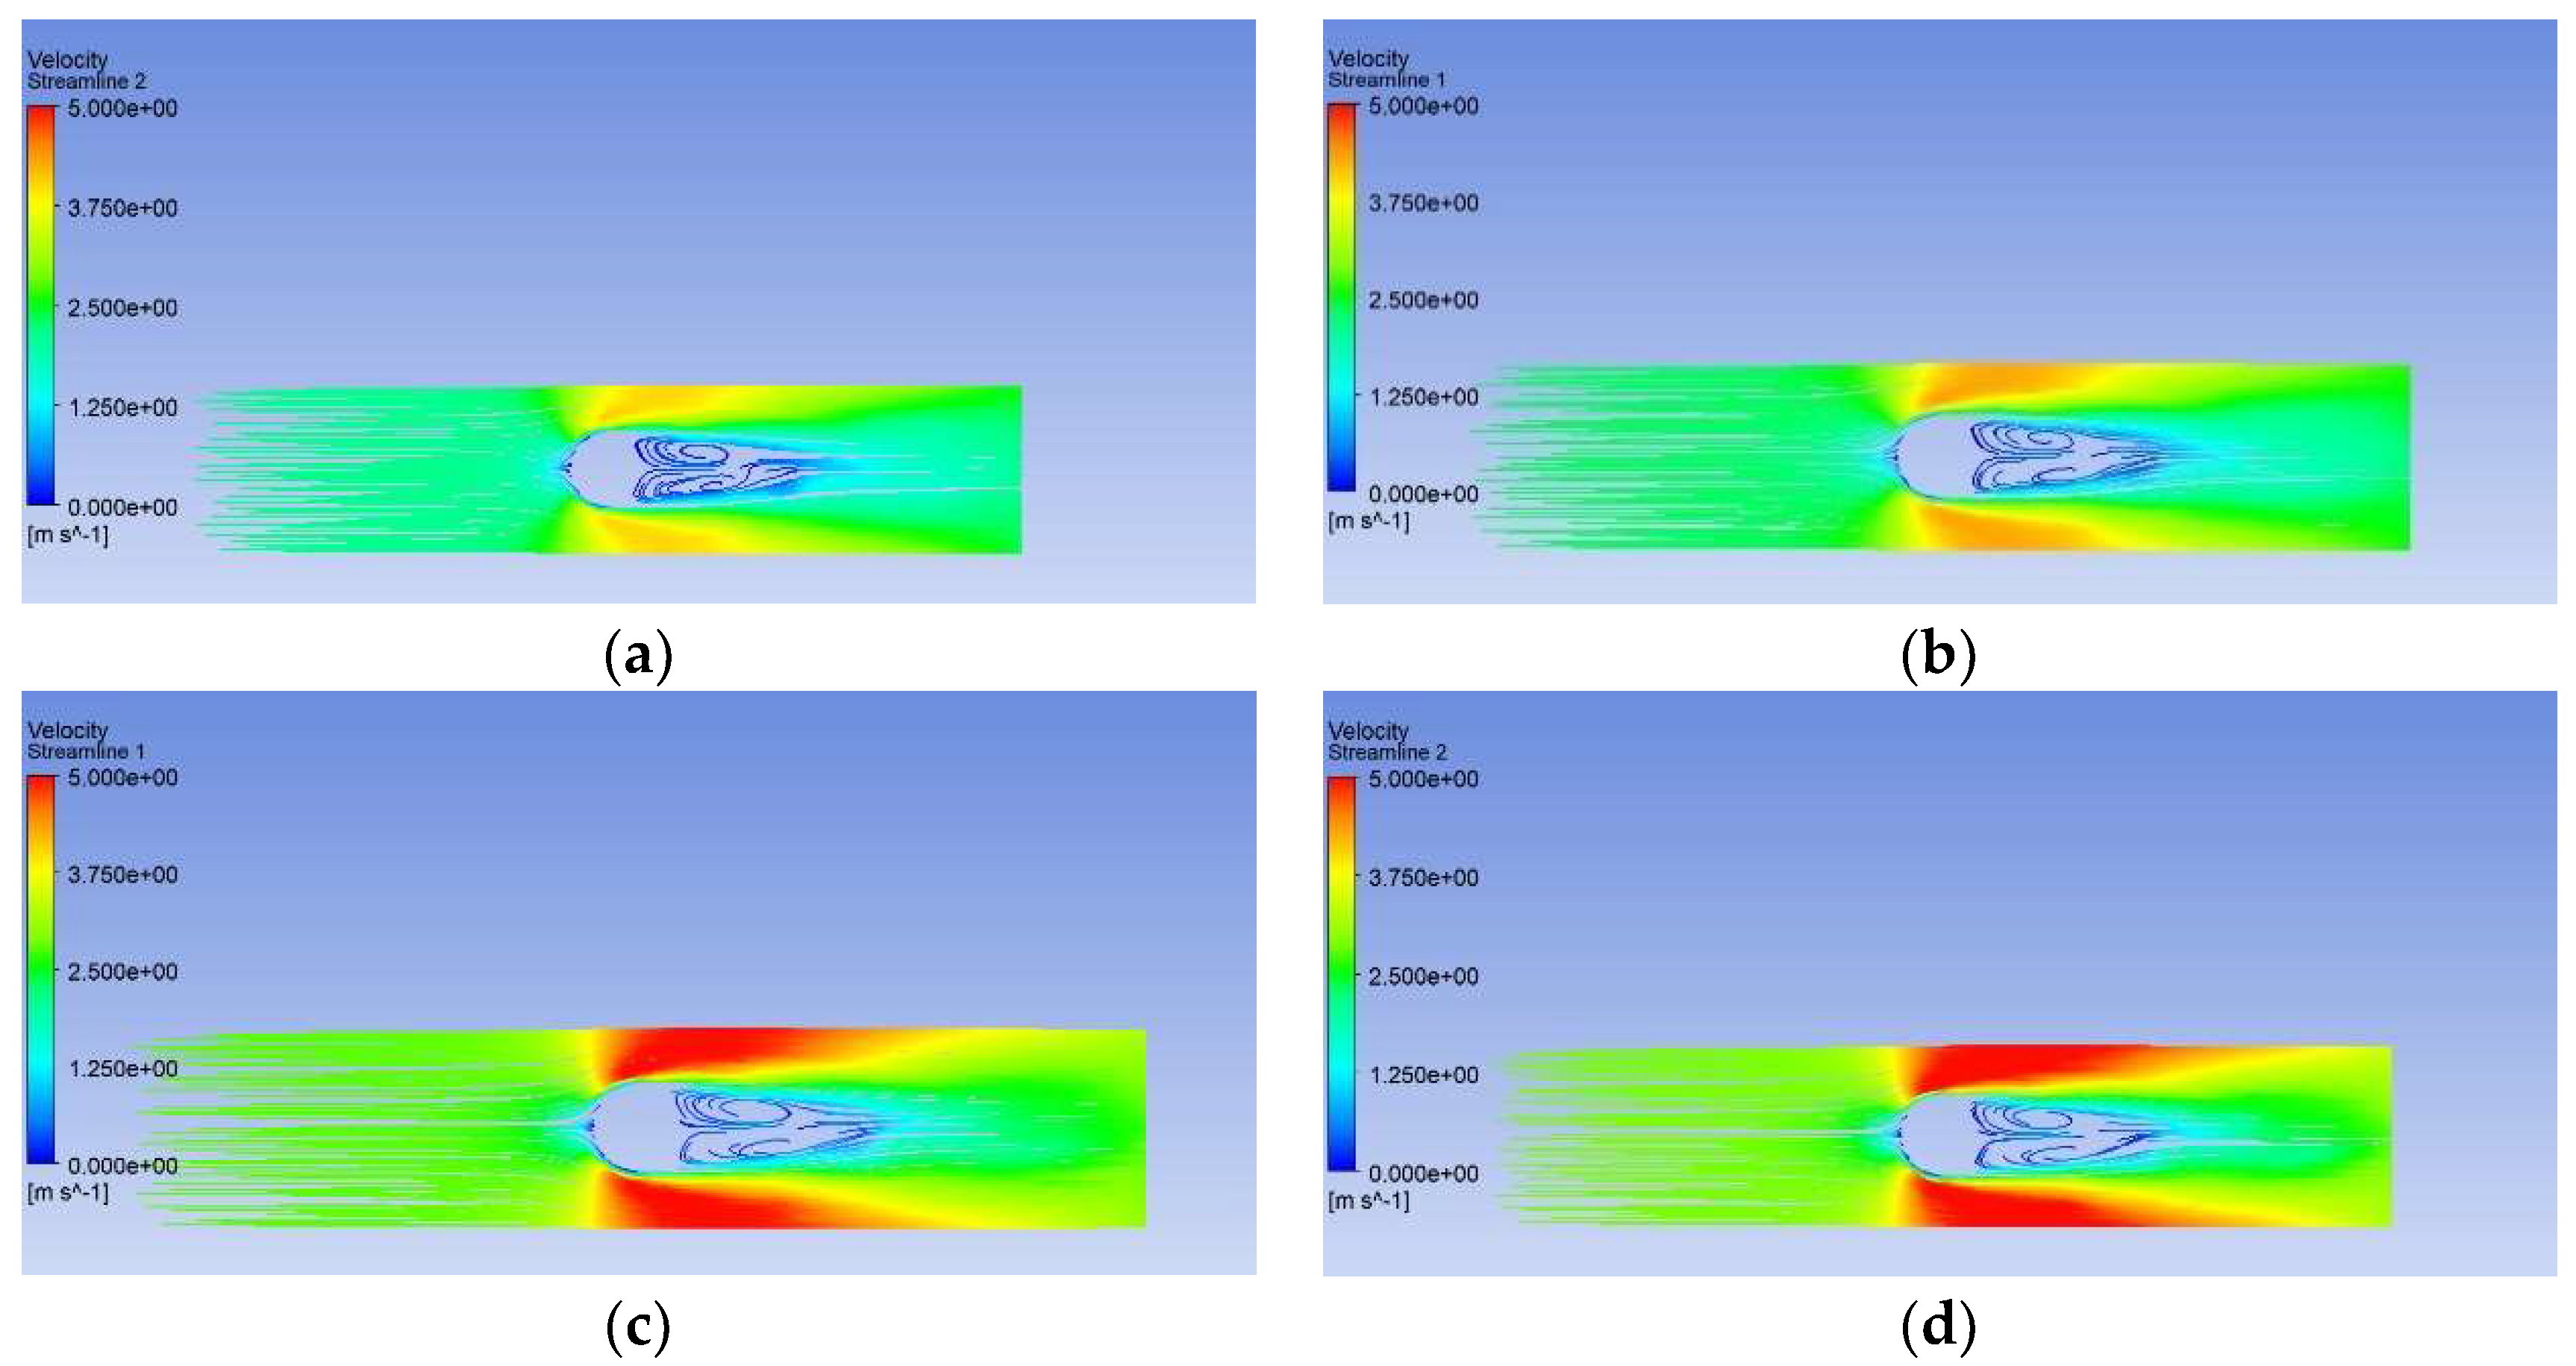
Figure 9 depicts the streamlines for different pulsation frequencies at the times when the fiber returned to its original position. The contour plot is colored by air velocity magnitude. The velocity magnitude in the gap between the fiber and wall clearly increased with pulsating frequency. This means that with frequent vibration, the local maximum velocity increased and the high-velocity zone was enlarged. Velocity increments will reduce the thickness of the flow and thermal boundary layer. This may be the reason why the heat transfer coefficient increased with pulsating frequency.
4.5. Mass Transfer Performance Caused by Flow-Induced Fiber Vibration
The influences of air pulsating amplitude and frequency on mass transfer were also studied.
Table 7 shows the effect of air pulsating amplitude on
Sh number and
Em. The
Sh number changed little between vibrating and non-vibrating fiber conditions when A was 0.5 m/s. As the pulsating amplitude rose to 2 m/s, the
Sh number under fiber vibration conditions was almost two times greater than the non-vibrating condition and the mass transfer enhancement index was 86.7%. The influence of air pulsation frequency on
Sh number and
Em was consistent with the amplitude, and the calculated data are given in
Table 8. As can be deduced, both increasing amplitude and frequency of the pulsating fluid can effectively enhance mass transfer flow across the hollow fiber membrane.
5. Conclusions
The flow-induced vibration of a hollow fiber membrane during humidification/dehumidification has been investigated using the FSI approach. Incoming air was assumed to exhibit pulsating flow with a sinusoidal waveform. The influence of the pulsating amplitude and frequency on the heat or mass transfer characteristics of the hollow fiber membrane was analyzed.
The fiber deformation was tested using a laser vibrometer. The maximum deformation of fiber in the airflow direction was about 5–10 times larger than that perpendicular to the flow direction. The Nu number under fiber vibration conditions increased by 14–87% compared with non-vibration fiber conditions, with a pulsating amplitude of 0.5–2 m/s. Flow-induced fiber vibration could raise the heat transfer enhancement index from 13.8% to 80%. The pulsation frequency could also enhance the heat transfer of hollow fiber membranes due to the continuously weakened thermal boundary layer.
The Sh number and Em are also affected by flow-induced fiber vibration. At low amplitude or frequency, there is little difference in the Sh number under vibration and non-vibration conditions. As pulsating amplitude or frequency increased, the Sh number under fiber vibration conditions was almost two times greater than that under non-vibration conditions.
The purpose of this research was to investigate the effect of flow-induced vibration on the mechanical and heat and mass transfer performance of hollow fiber membranes in the humidification/dehumidification process. In this work, we tested the deformation of a single fiber in the experiment to verify the accuracy of the numerical model. Thus, the verified two-way FSI approach can be used to calculate flow-induced vibration in fiber bundles in future. The subject in flow-induced fiber vibration can be extended to a hollow fiber bundle rather than a single fiber. Choosing the characteristics of the hollow fiber membrane (length, diameter, Young modulus, Poisson’s ratio, etc.) that allows for a compromise between the heat mass transfer performance and the lifetime of the fiber under flow-induced fiber vibration is our future aim in this field of investigation. This will provide guidance for synthetic design of the membrane and the processing of the membrane module.
Author Contributions
Conceptualization, C.L. and Z.L.; methodology, C.L.; software, B.C.; validation, N.L.; formal analysis, Y.Z.; investigation, Z.L.; resources, C.D.; data curation, Z.L.; writing—original draft preparation, C.L.; writing—review and editing, C.D. All authors have read and agreed to the published version of the manuscript.
Funding
The authors gratefully acknowledge the joint financial support from the Natural Science Foundation of China (Grant No. 51566002,51906071); Guangxi Province of Natural Science Foundation (Grant No. 2018GXNSFAA281347); Guangxi Science and Technology Plan Project (AD18281027); Guangxi Key Lab of Manufacturing System and Advanced Manufacturing Technology (Grant No.19050-44-001Z); and the Guangdong Provincial Key Laboratory of Distributed Energy Systems (Grant No.2020B1212060075).
Institutional Review Board Statement
Not applicable.
Data Availability Statement
Not applicable.
Conflicts of Interest
The authors declare no conflict of interest.
References
- Nouzaki, K.; Nagata, M.; Arai, J.; Idemoto, Y.; Koura, N.; Yanagishita, H.; Negishi, H.; Kitamoto, D.; Ikegami, T.; Haraya, K. Preparation of polyacrylonitrile ultrafiltration membranes for wastewater treatment. Desalination 2002, 144, 53–59. [Google Scholar] [CrossRef]
- Pendergast, M.; Hoek, E. A review of water treatment membrane nanotechnologies. Energy Environ. Sci. 2011, 4, 1946–1971. [Google Scholar] [CrossRef]
- Yuliwati, E.; Ismail, A.; Matsuura, T.; Kassim, M.; Abdullah, M. Effect of modified PVDF hollow fiber submerged ultrafiltration membrane for refinery wastewater treatment. Desalination 2011, 283, 214–220. [Google Scholar] [CrossRef]
- Pabby, A.K.; Sastre, A.M. State-of-the-art review on hollow fibre contactor technology and membrane-based extraction processes. J. Membr. Sci. 2013, 430, 263–303. [Google Scholar] [CrossRef]
- Moghaddam, A.Z.; Bameri, A.E.; Ganjali, M.R.; Alexovič, M.; Jazi, M.E.; Tabani, H. A low-voltage electro-membrane extraction for quantification of imatinib and sunitinib in biological fluids. Bioanalysis 2021, 13, 1401–1413. [Google Scholar] [CrossRef]
- Moghaddam, A.Z.; Goharjoo, M.; Ghiamati, E.; Khodaei, K.; Tabani, H. Gel electro-membrane extraction of propranolol and atenolol from blood serum samples: Effect of graphene-based nanomaterials on extraction efficiency of gel membrane. Talanta 2021, 222, 121557. [Google Scholar] [CrossRef]
- Rahimi, A.; Nojavan, S.; Tabani, H. Inside gel electromembrane extraction: A novel green methodology for the extraction of morphine and codeine from human biological fluids. J. Pharm. Biomed. Anal. 2020, 184, 113175. [Google Scholar] [CrossRef]
- Adewole, J.; Ahmad, A.; Ismail, S.; Leo, C. Current challenges in membrane separation of CO2 from natural gas: A review. Int. J. Greenh. Gas Control 2013, 17, 46–65. [Google Scholar] [CrossRef]
- Li, G.; Kujawski, W.; Válek, R.; Koter, S. A review—The development of hollow fibre membranes for gas separation processes. Int. J. Greenh. Gas Control 2021, 104, 103195. [Google Scholar] [CrossRef]
- Baig, M.I.; Ingole, P.G.; Choi, W.K.; Park, S.R.; Kang, E.C.; Lee, H.K. Development of carboxylated TiO2 incorporated thin film nanocomposite hollow fiber membranes for flue gas dehydration. J. Membr. Sci. 2016, 514, 622–635. [Google Scholar] [CrossRef]
- Zhang, L.Z.; Huang, S.M. Coupled heat and mass transfer in a counter flow hollow fiber membrane module for air humidification. Int. J. Heat Mass Transf. 2011, 54, 1055–1063. [Google Scholar] [CrossRef]
- Huang, S.M.; Yang, M. Longitudinal fluid flow and heat transfer between an elliptical hollow fiber membrane tube bank used for air humidification. Appl. Energy 2013, 112, 75–82. [Google Scholar] [CrossRef]
- Li, G.P.; Qi, R.h.; Zhang, L.Z. Performance study of a solar-assisted hollow-fiber-membrane-based air humidification-dehumidification desalination system: Effects of membrane properties. Chem. Eng. Sci. 2019, 206, 164–179. [Google Scholar] [CrossRef]
- Nguyen, X.L.; Vu, H.N.; Yu, S. Parametric understanding of vapor transport of hollow fiber membranes for design of a membrane humidifier. Renew. Energy 2021, 177, 1293–1307. [Google Scholar] [CrossRef]
- Vu, H.N.; Nguyen, X.L.; Han, J.; Yu, S. A study on vapor transport characteristics in hollow-fiber membrane humidifier with empirical mass transfer coefficient. Int. J. Heat Mass Transf. 2021, 177, 121549. [Google Scholar] [CrossRef]
- Li, Z.X.; Zhang, L.Z. Flow maldistribution and performance deteriorations in a counter flow hollow fiber membrane module for air humidification/dehumidification. Int. J. Heat Mass Transf. 2014, 74, 421–430. [Google Scholar] [CrossRef]
- Kim, K.H.; Ingole, P.G.; Lee, H.K. Membrane dehumidification process using defect-free hollow fiber membrane. Int. J. Hydrogen Energy 2017, 42, 24205–24212. [Google Scholar] [CrossRef]
- Fakharnezhad, A.; Masoumi, S.; Keshavarz, P. Analysis of design parameter effects on gas dehumidification in hollow fiber membrane contactor: Theoretical and experimental study. Sep. Purif. Technol. 2019, 226, 22–30. [Google Scholar] [CrossRef]
- Liu, Y.; Cui, X.; Yan, W.; Su, J.; Duan, F.; Jin, L. Analysis of pressure-driven water vapor separation in hollow fiber composite membrane for air dehumidification. Sep. Purif. Technol. 2020, 251, 117334. [Google Scholar] [CrossRef]
- Zhao, W.J.; Lu, H.; Li, C.S. Composite hollow fiber membrane dehumidification: A review on membrane module, moisture permeability and self-cleaning performance. Int. J. Heat Mass Transf. 2021, 181, 121832. [Google Scholar] [CrossRef]
- Zhang, L.Z. Heat and mass transfer in a randomly packed hollow fiber membrane module: A fractal model approach. Int. J. Heat Mass Transf. 2011, 54, 2921–2931. [Google Scholar] [CrossRef]
- Zhang, L.Z.; Huang, S.M.; Zhang, W.B. Turbulent heat and mass transfer across a hollow fiber membrane bundle considering interactions between neighboring fibers. Int. J. Heat Mass Transf. 2013, 64, 162–172. [Google Scholar] [CrossRef]
- Zhang, L.Z.; Huang, S.M.; Chi, J.H.; Pei, L.X. Conjugate heat and mass transfer in a hollow fiber membrane module for liquid desiccant air dehumidification: A free surface model approach. Int. J. Heat Mass Transf. 2012, 55, 3789–3799. [Google Scholar] [CrossRef]
- Ding, W.; Gao, D.; Wang, Z.; He, L. Theoretical estimation of shell-side mass transfer coefficient in randomly packed hollow fiber modules with polydisperse hollow fiber outer radii. J. Membr. Sci. 2006, 284, 95–101. [Google Scholar] [CrossRef]
- Zhang, L.Z.; Zhang, N. A heat pump driven and hollow fiber membrane-based liquid desiccant air dehumidification system: Modeling and experimental validation. Energy 2014, 65, 441–451. [Google Scholar] [CrossRef]
- Fakharnezhad, A.; Keshavarz, P. Experimental investigation of gas dehumidification by tri-ethylene glycol in hollow fiber membrane contactors. J. Ind. Eng. Chem. 2016, 34, 390–396. [Google Scholar] [CrossRef]
- Chen, X.; Su, Y.; Aydin, D.; Bai, H.; Jarimi, H.; Zhang, X.; Riffat, S. Experimental investigation of a polymer hollow fibre integrated liquid desiccant dehumidification system with aqueous potassium formate solution. Appl. Therm. Eng. 2018, 142, 632–643. [Google Scholar] [CrossRef]
- Wang, Y.; Ruhani, B.; Fazilati, M.A.; Sajadi, S.M.; Alizadeh, A.A.; Toghraie, D. Experimental analysis of hollow fiber membrane dehumidifier system with SiO2/CaCl2 aqueous desiccant solution. Energy Rep. 2021, 7, 2821–2835. [Google Scholar] [CrossRef]
- Ji, J.; Ge, P.; Bi, W. Numerical analysis on shell-side flow-induced vibration and heat transfer characteristics of elastic tube bundle in heat exchanger. Appl. Therm. Eng. 2016, 107, 544–551. [Google Scholar] [CrossRef]
- Su, Y.; Gao, L.; Li, L.; Li, X.; Zhang, C. A study of the vortex-induced lateral vibration and heat transfer characteristics of elastic supported single tubes with different cross-sectional shapes. Int. Commun. Heat Mass Transf. 2019, 104, 8–14. [Google Scholar] [CrossRef]
- Duan, D.; Ge, P.; Bi, W.; Yang, X.; Fu, X.; Yan, K. An empirical correlation for the heat transfer enhancement of planar elastic tube bundle by flow-induced vibration. Int. J. Therm. Sci. 2020, 155, 106405. [Google Scholar] [CrossRef]
- Chen, G.; Liang, X.F.; Li, X.B.; Zhou, D.; Lien, F.s. Numerical investigation of vortex induced vibration effects on the heat transfer for various aspect ratios ellipse cylinder. Int. J. Therm. Sci. 2021, 170, 107138. [Google Scholar] [CrossRef]
- Genkin, G.; Waite, T.D.; Fane, A.G.; Chang, S. The effect of vibration and coagulant addition on the filtration performance of submerged hollow fibre membranes. J. Membr. Sci. 2006, 281, 726–734. [Google Scholar] [CrossRef]
- Altaee, A.; Al-Rawajfeh, A.E.; Baek, Y.J. Application of vibratory system to improve the critical flux in submerged hollow fiber MF process. Sep. Sci. Technol. 2009, 45, 28–34. [Google Scholar] [CrossRef]
- Li, T.; Law, A.W.K.; Cetin, M.; Fane, A.G.; Wicaksana, F. Fouling control of submerged hollow fibre membranes: The effect of vibrations and fibre looseness. Procedia Eng. 2012, 44, 24–26. [Google Scholar] [CrossRef][Green Version]
- Zhang, W.; Hao, Z.; Li, J.; Liu, J.; Wang, Z.; Ren, Z. Residence time distribution analysis of a hollow-fiber contactor for membrane gas absorption and vibration-induced mass transfer intensification. Ind. Eng. Chem. Res. 2014, 53, 8640–8650. [Google Scholar] [CrossRef]
- Zhao, F.; Chu, H.; Zhang, Y.; Jiang, S.; Yu, Z.; Zhou, X.; Zhao, J. Increasing the vibration frequency to mitigate reversible and irreversible membrane fouling using an axial vibration membrane in microalgae harvesting. J. Membr. Sci. 2017, 529, 215–223. [Google Scholar] [CrossRef]
- Kim, S.; Min, C. Fouling reduction using the resonance vibration in membrane separation of whole milk. J. Ind. Eng. Chem. 2019, 75, 123–129. [Google Scholar] [CrossRef]
- Kaya, R.; Tirol, N.; Ozgun, H.; Ersahin, M.E.; Tarabara, V.V.; Yiit, N.O.; Arikan, O.A.; Koyuncu, S. Impact of magnetically induced vibration on the performance of pilot-scale membrane bioreactor. J. Environ. Eng. 2020, 146, 04020001. [Google Scholar] [CrossRef]
- Yu, D.; Liu, M.; Liu, J.; Zheng, L.; Wei, Y. Effects of mixed-liquor rheology on vibration of hollow-fiber membrane via particle image velocimetry and computational fluid dynamics. Sep. Purif. Technol. 2020, 239, 116590. [Google Scholar] [CrossRef]
- Mishra, N.K.; Patil, N.; Yi, S.; Hopkinson, D.; Grunlan, J.C.; Wilhite, B.A. Highly selective hollow fiber membranes for carbon capture via in-situ layer-by-layer surface functionalization. J. Membr. Sci. 2021, 633, 119381. [Google Scholar] [CrossRef]
- Zamani, F.; Law, A.W.K.; Fane, A.G. Hydrodynamic analysis of vibrating hollow fibre membranes. J. Membr. Sci. 2013, 429, 304–312. [Google Scholar] [CrossRef]
- Liu, X.; Wang, Y.; Waite, T.D.; Leslie, G. Fluid Structure Interaction analysis of lateral fibre movement in submerged membrane reactors. J. Membr. Sci. 2016, 504, 240–250. [Google Scholar] [CrossRef]
- Huang, S.M.; Qiu, D.; Wu, Z.H.; Yang, M.L.; Zeng, S.H.; Chen, Y.H. Fluid flow and heat transfer across a curved hollow fiber membrane tube bank (CHFMTB): Effects of the tube deformations. Int. J. Heat Mass Transf. 2018, 116, 471–483. [Google Scholar] [CrossRef]
- Sotiropoulos, F.; Yang, X. Immersed boundary methods for simulating fluid–structure interaction. Prog. Aerosp. Sci. 2014, 65, 1–21. [Google Scholar] [CrossRef]
- Xing, Y.; Spring, S.; Weigand, B. Experimental and numerical investigation of heat transfer characteristics of inline and staggered arrays of impinging jets. J. Heat Transf. 2010, 132, 53–58. [Google Scholar] [CrossRef]
| Publisher’s Note: MDPI stays neutral with regard to jurisdictional claims in published maps and institutional affiliations. |
© 2021 by the authors. Licensee MDPI, Basel, Switzerland. This article is an open access article distributed under the terms and conditions of the Creative Commons Attribution (CC BY) license (https://creativecommons.org/licenses/by/4.0/).
