Effect of Membrane Fouling on Fertilizer-Drawn Forward Osmosis Desalination Performance


Abstract
1. Introduction
2. Material and Methods
2.1. Chemicals
2.2. Feed and Draw Solution
2.3. Forward Osmosis Membrane
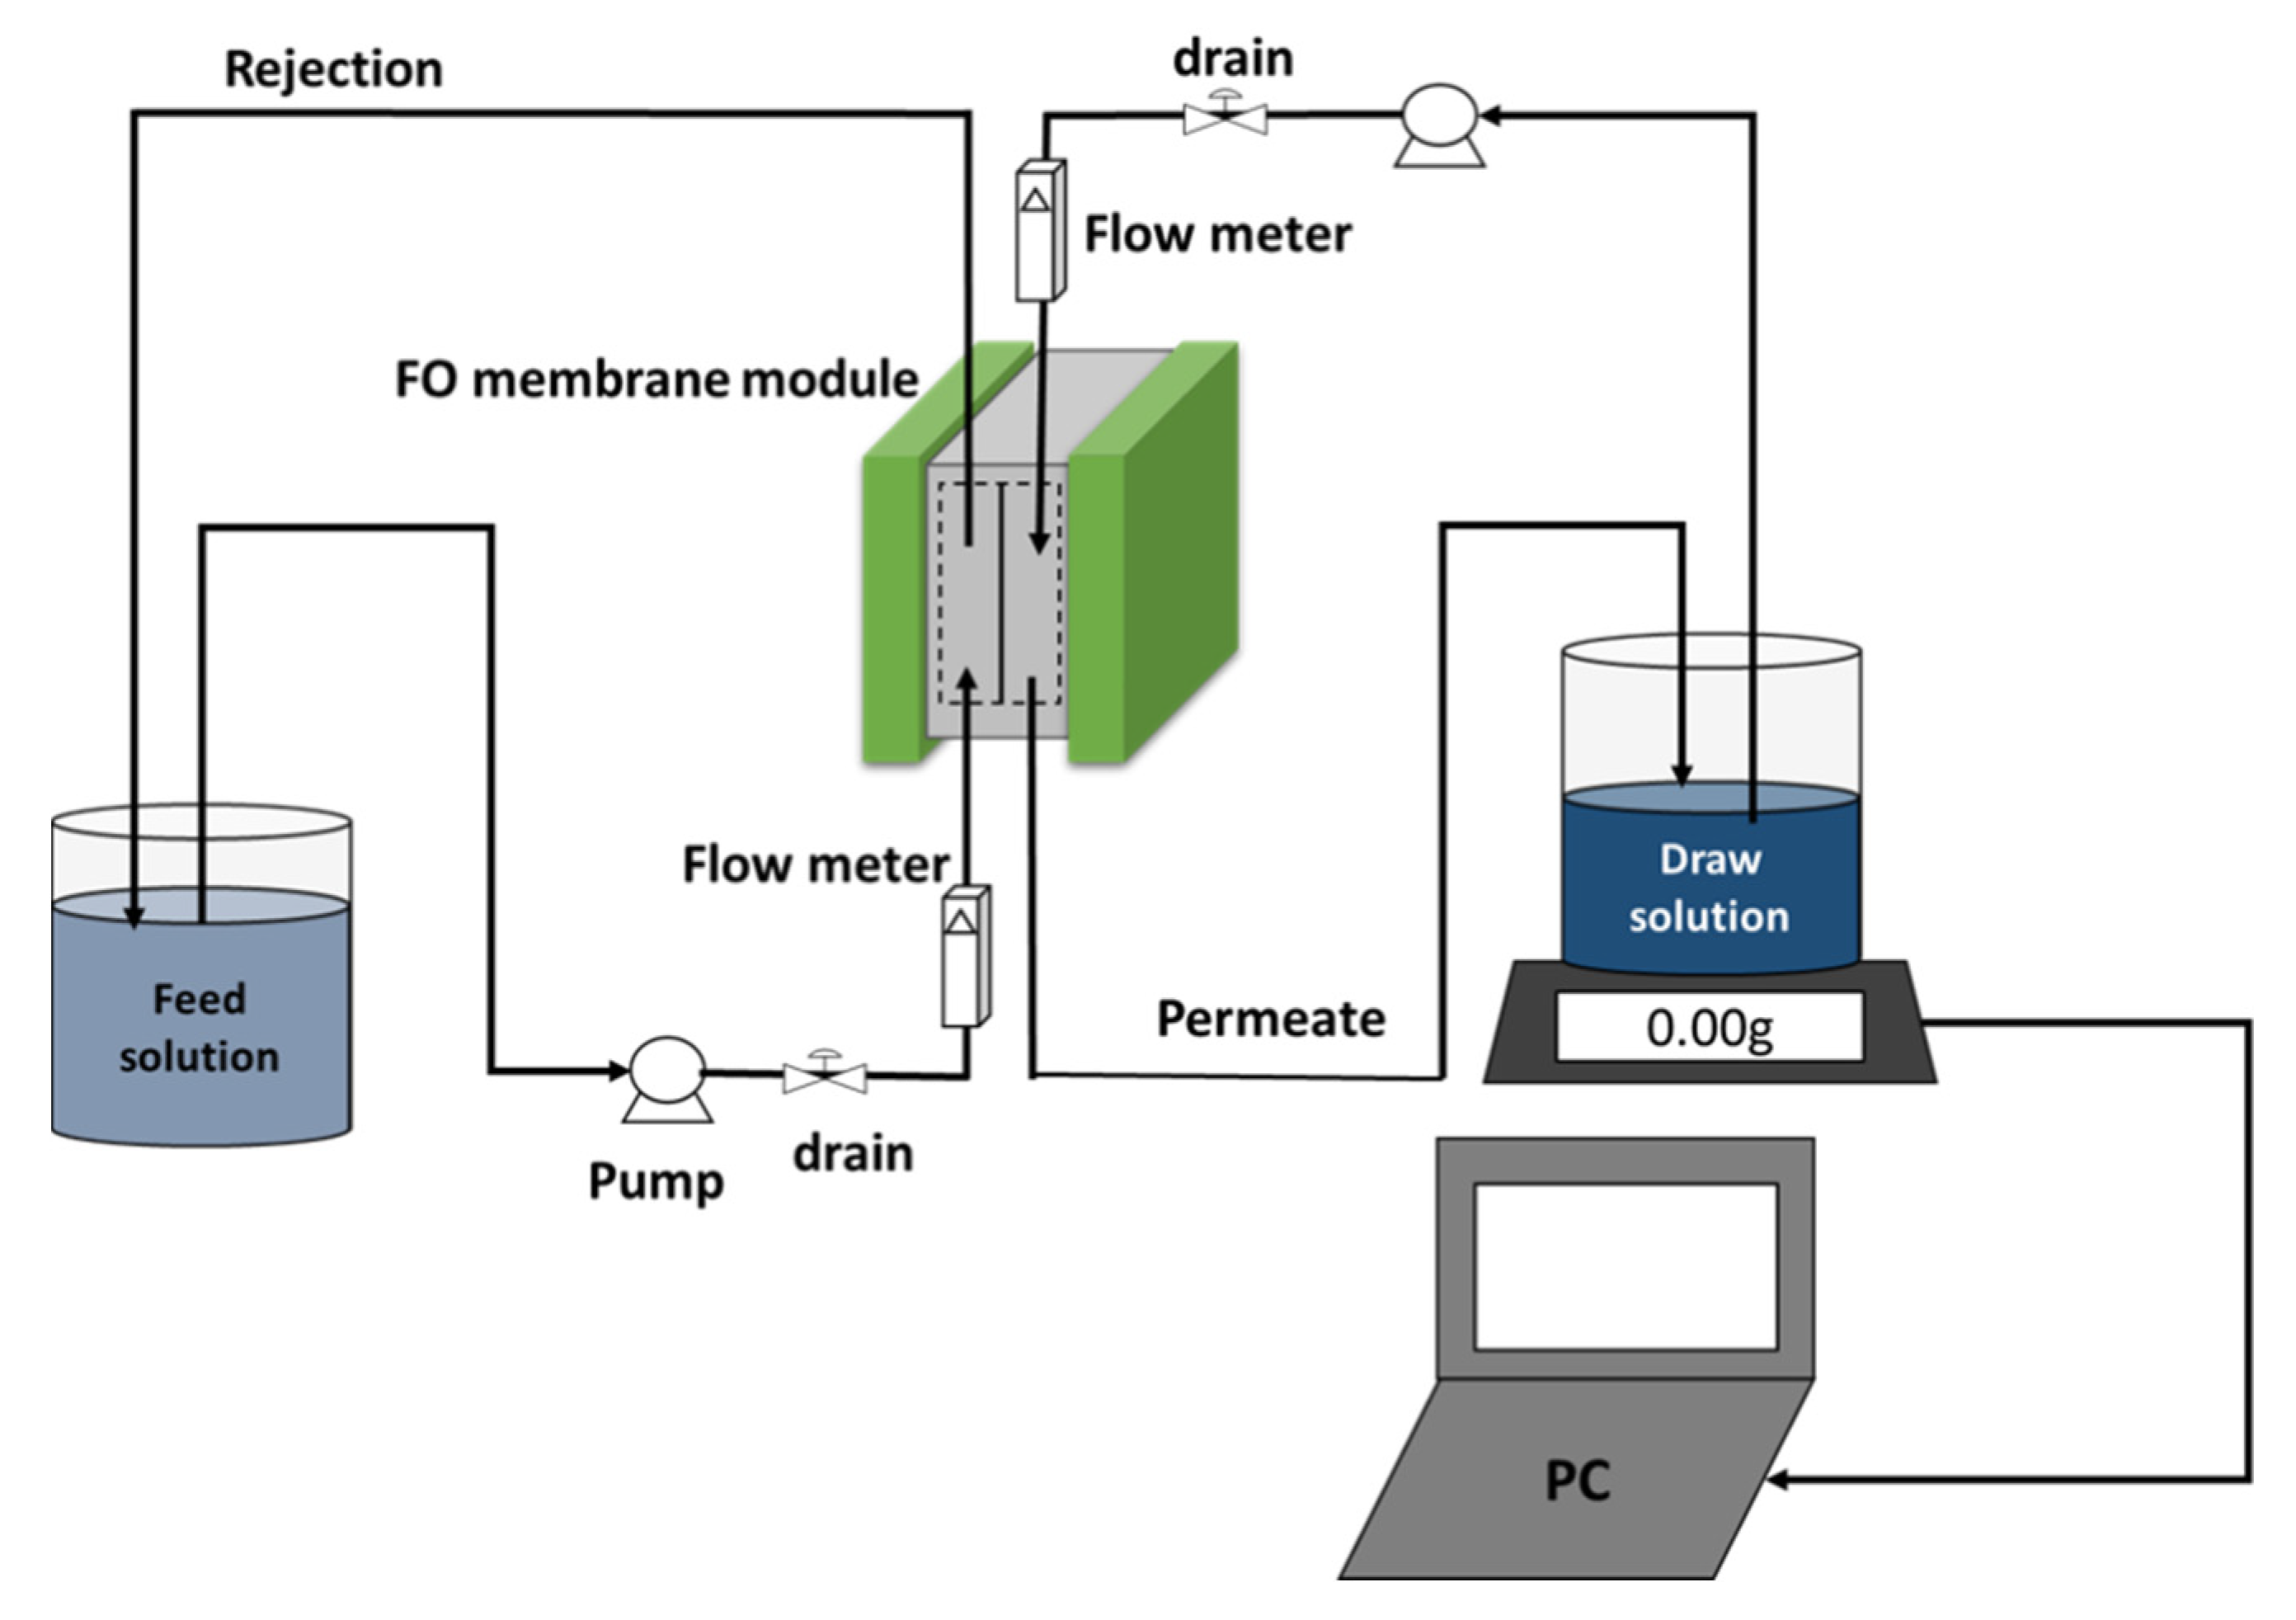
2.4. Experimental Setup
2.5. Control Experiment and Membrane Fouling Test
2.6. Physical Cleaning Approach
2.7. Measurement and Analysis
3. Results and Discussion
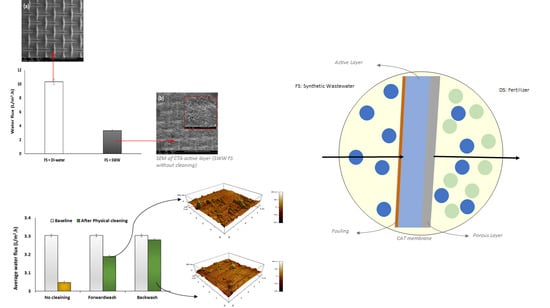
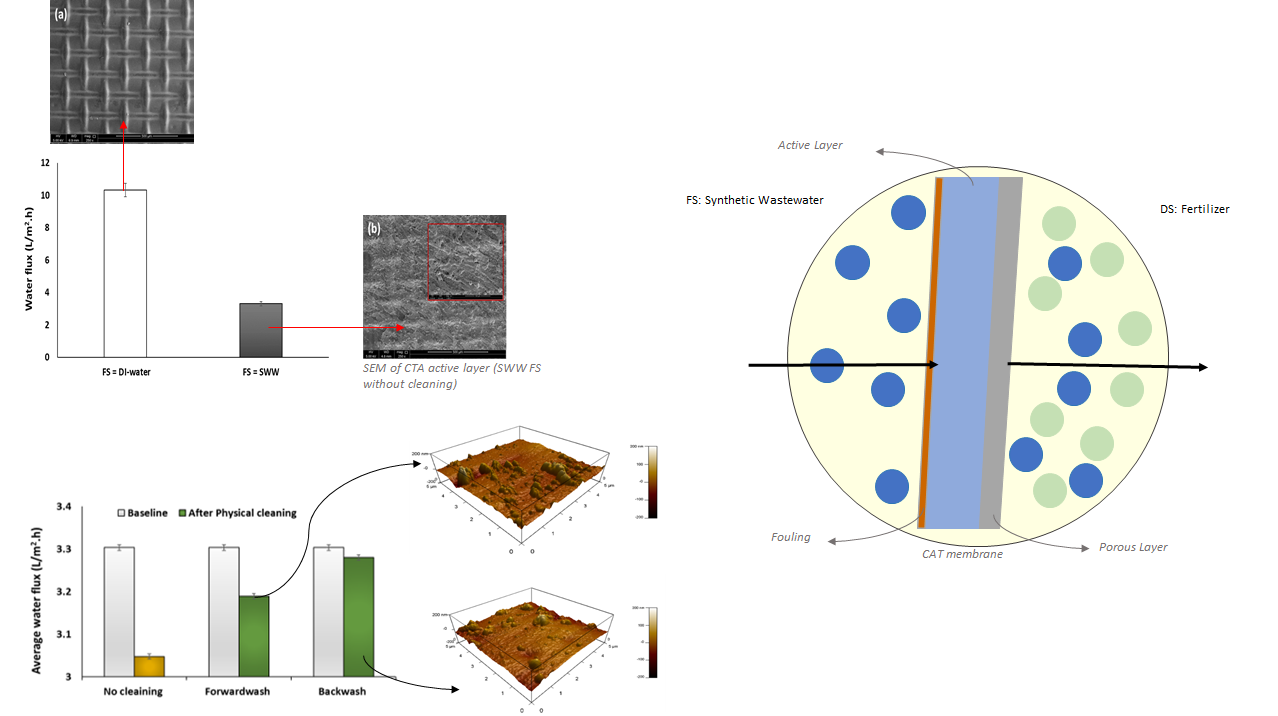
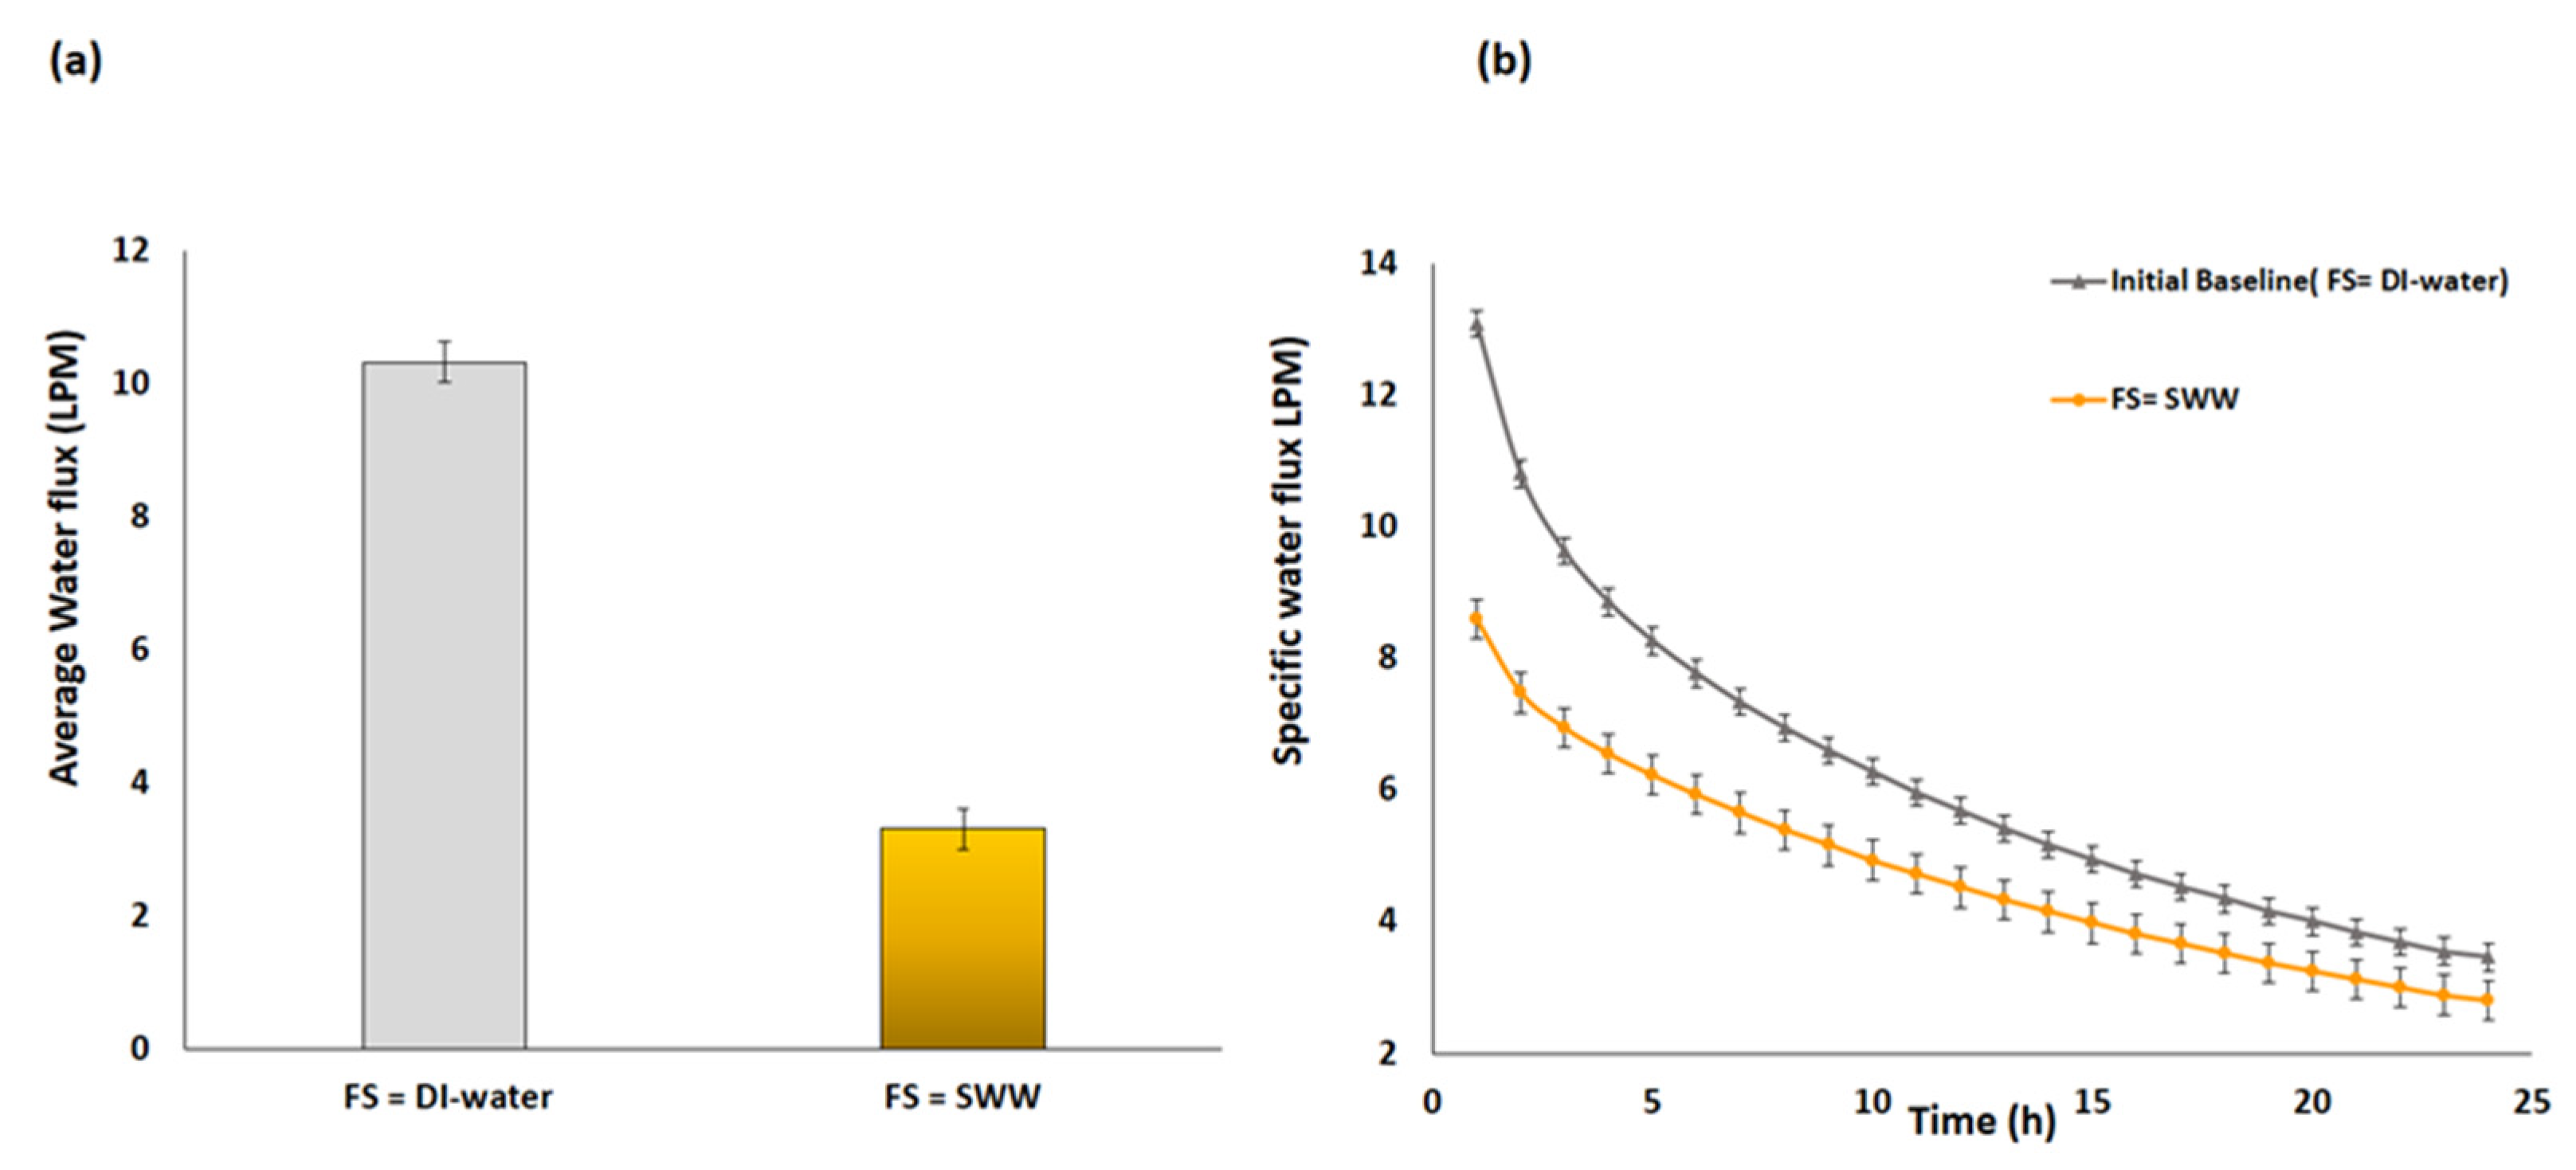
3.1. Membrane Fouling
3.2. Effect of Physical Cleaning on Foul Membrane
3.2.1. Water Flux and Water Recovery
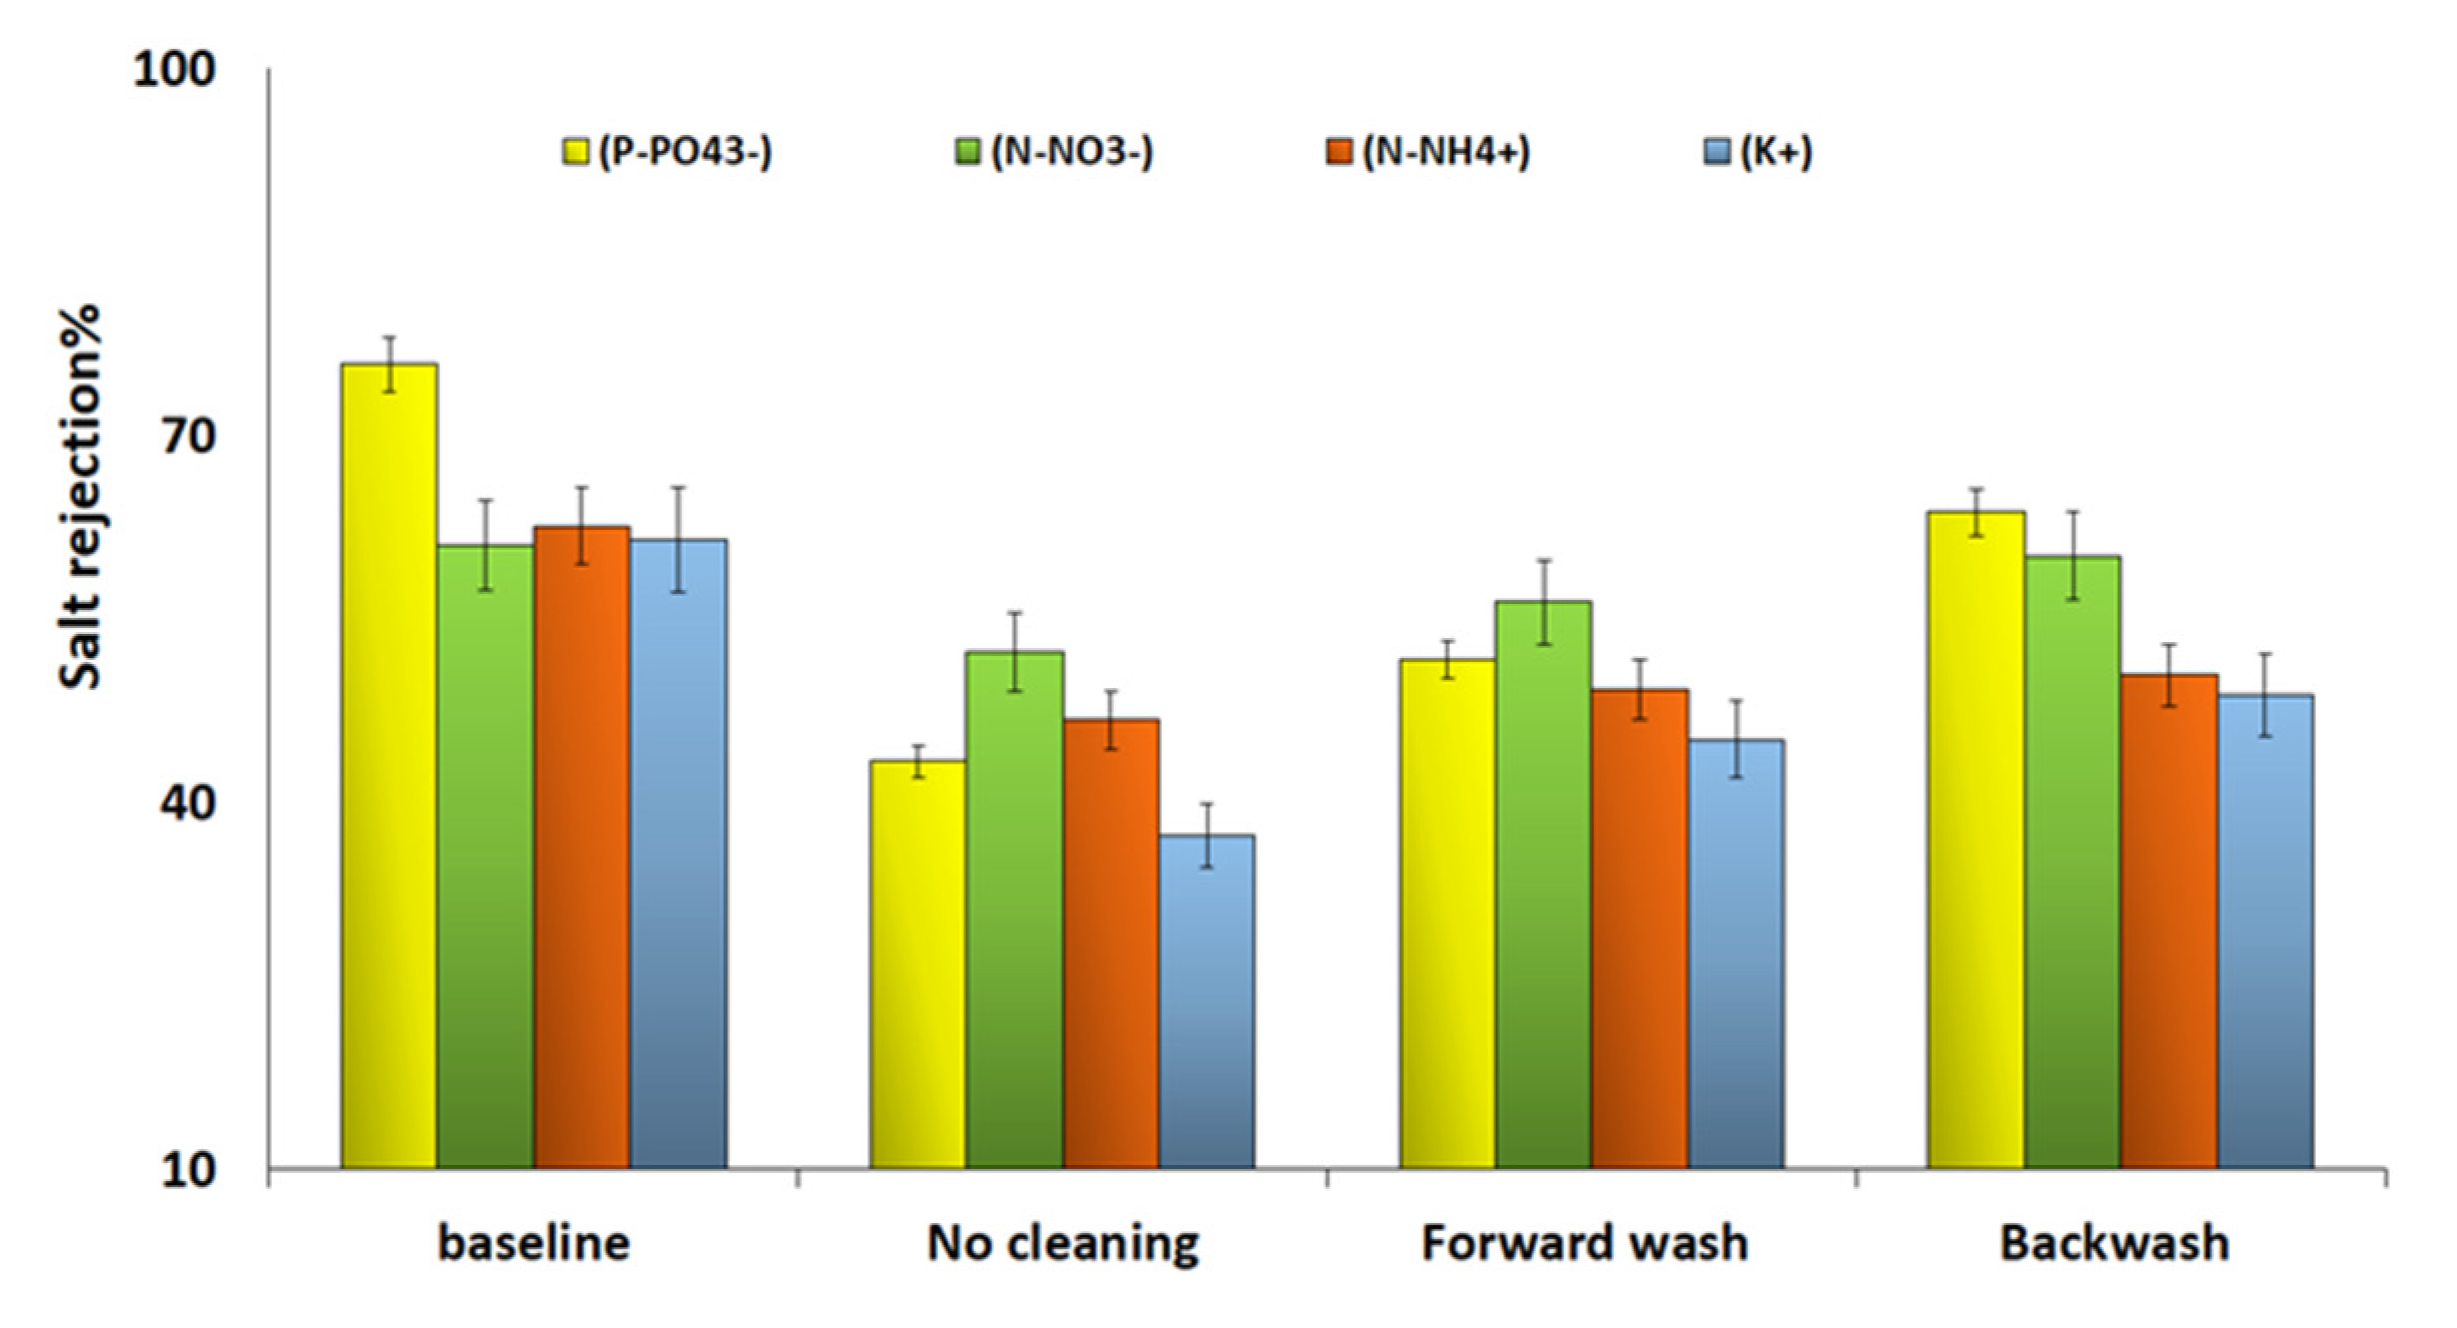
3.2.2. Salt Rejection
3.3. Morphologies of CTA Membrane
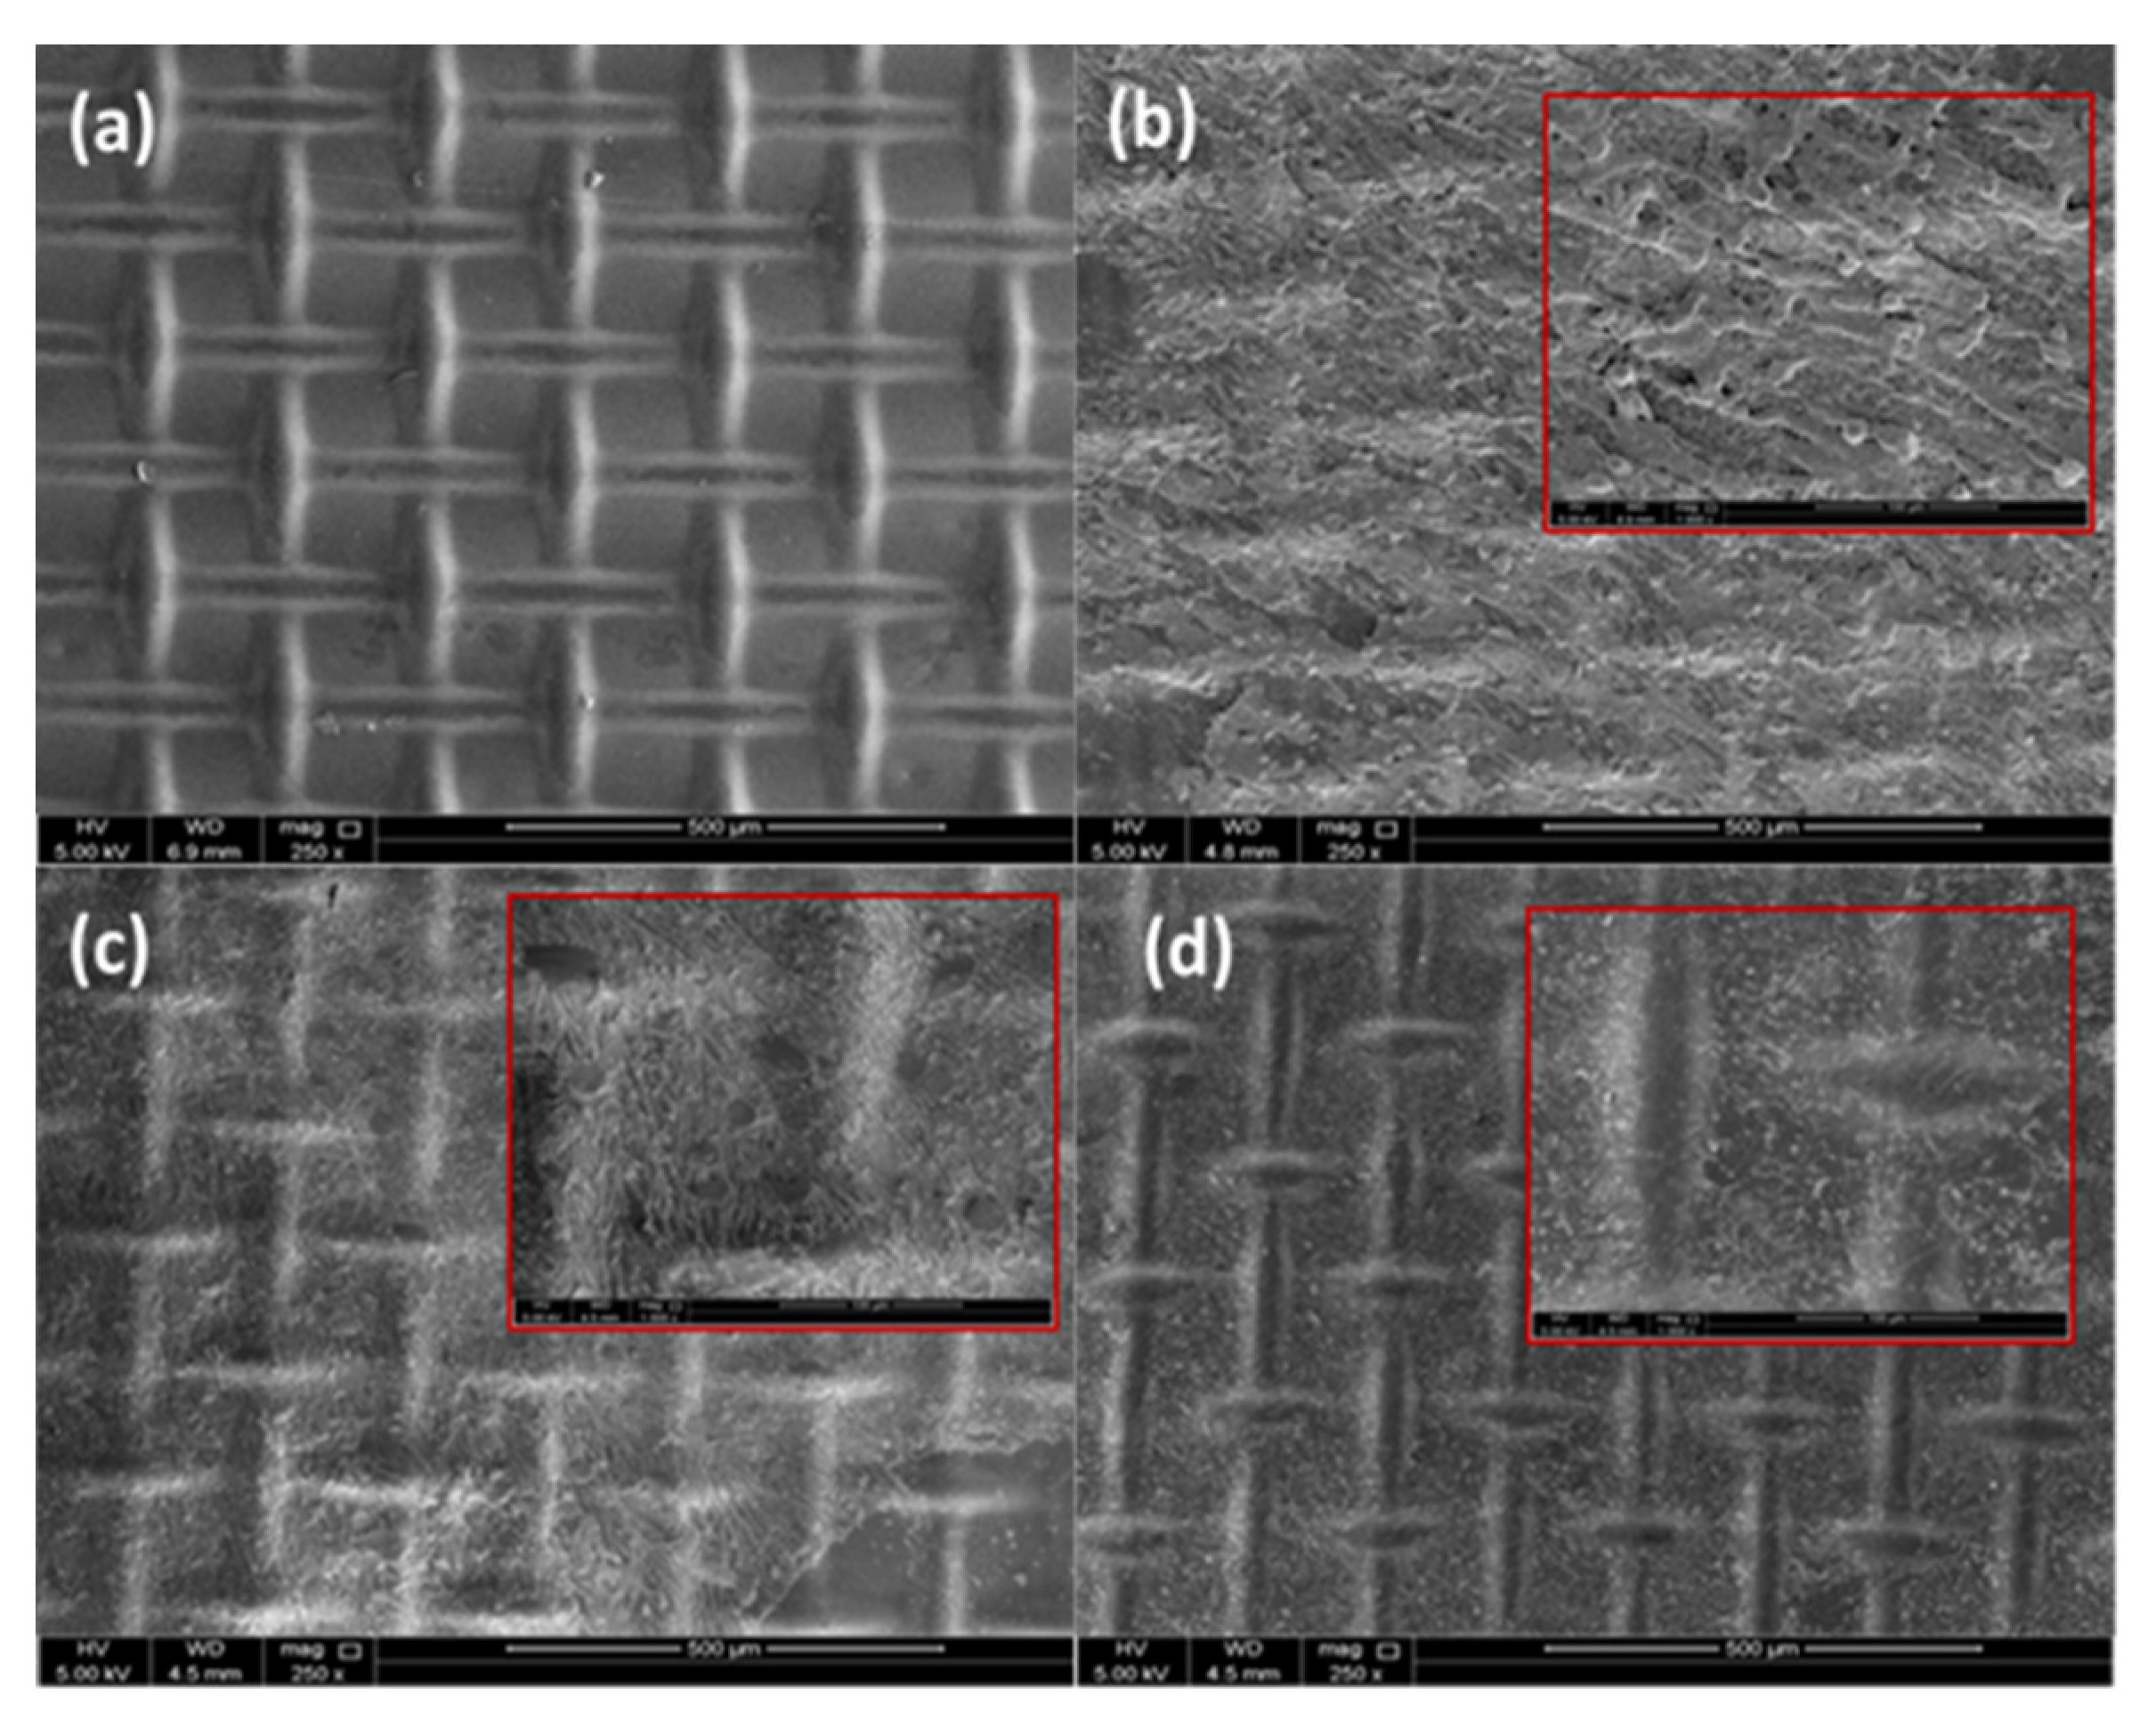
3.3.1. SEM
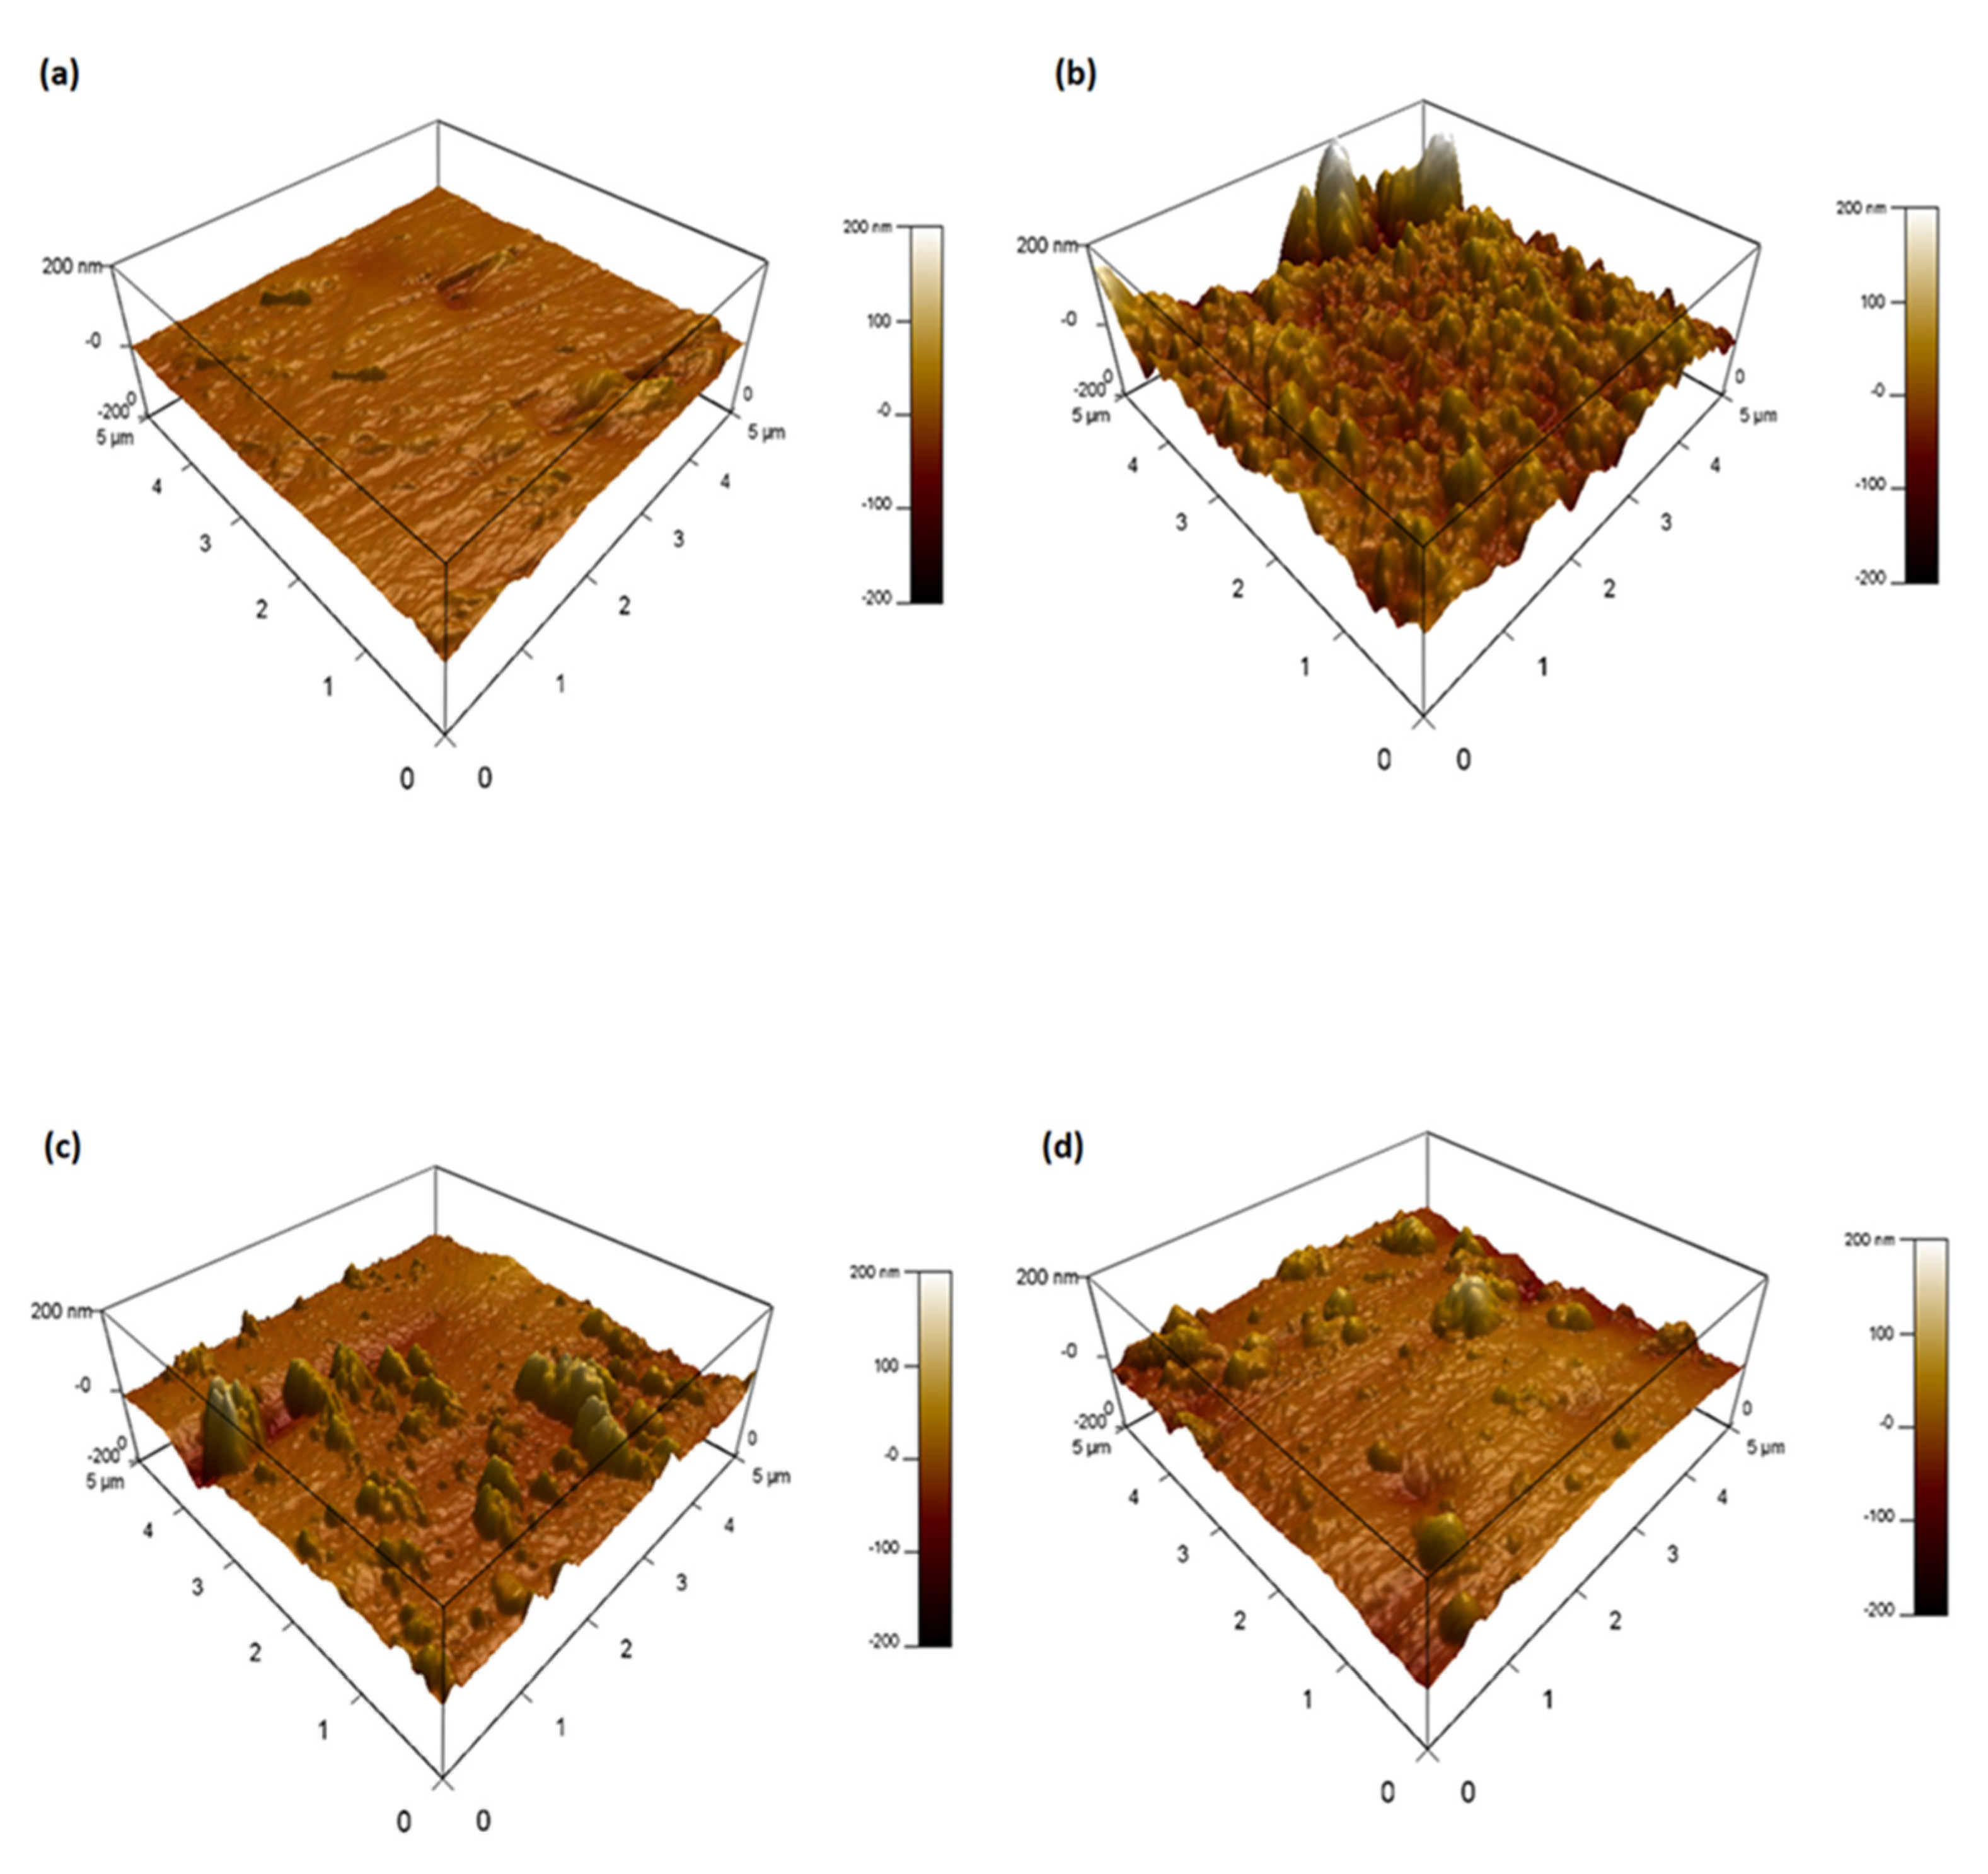
3.3.2. AFM
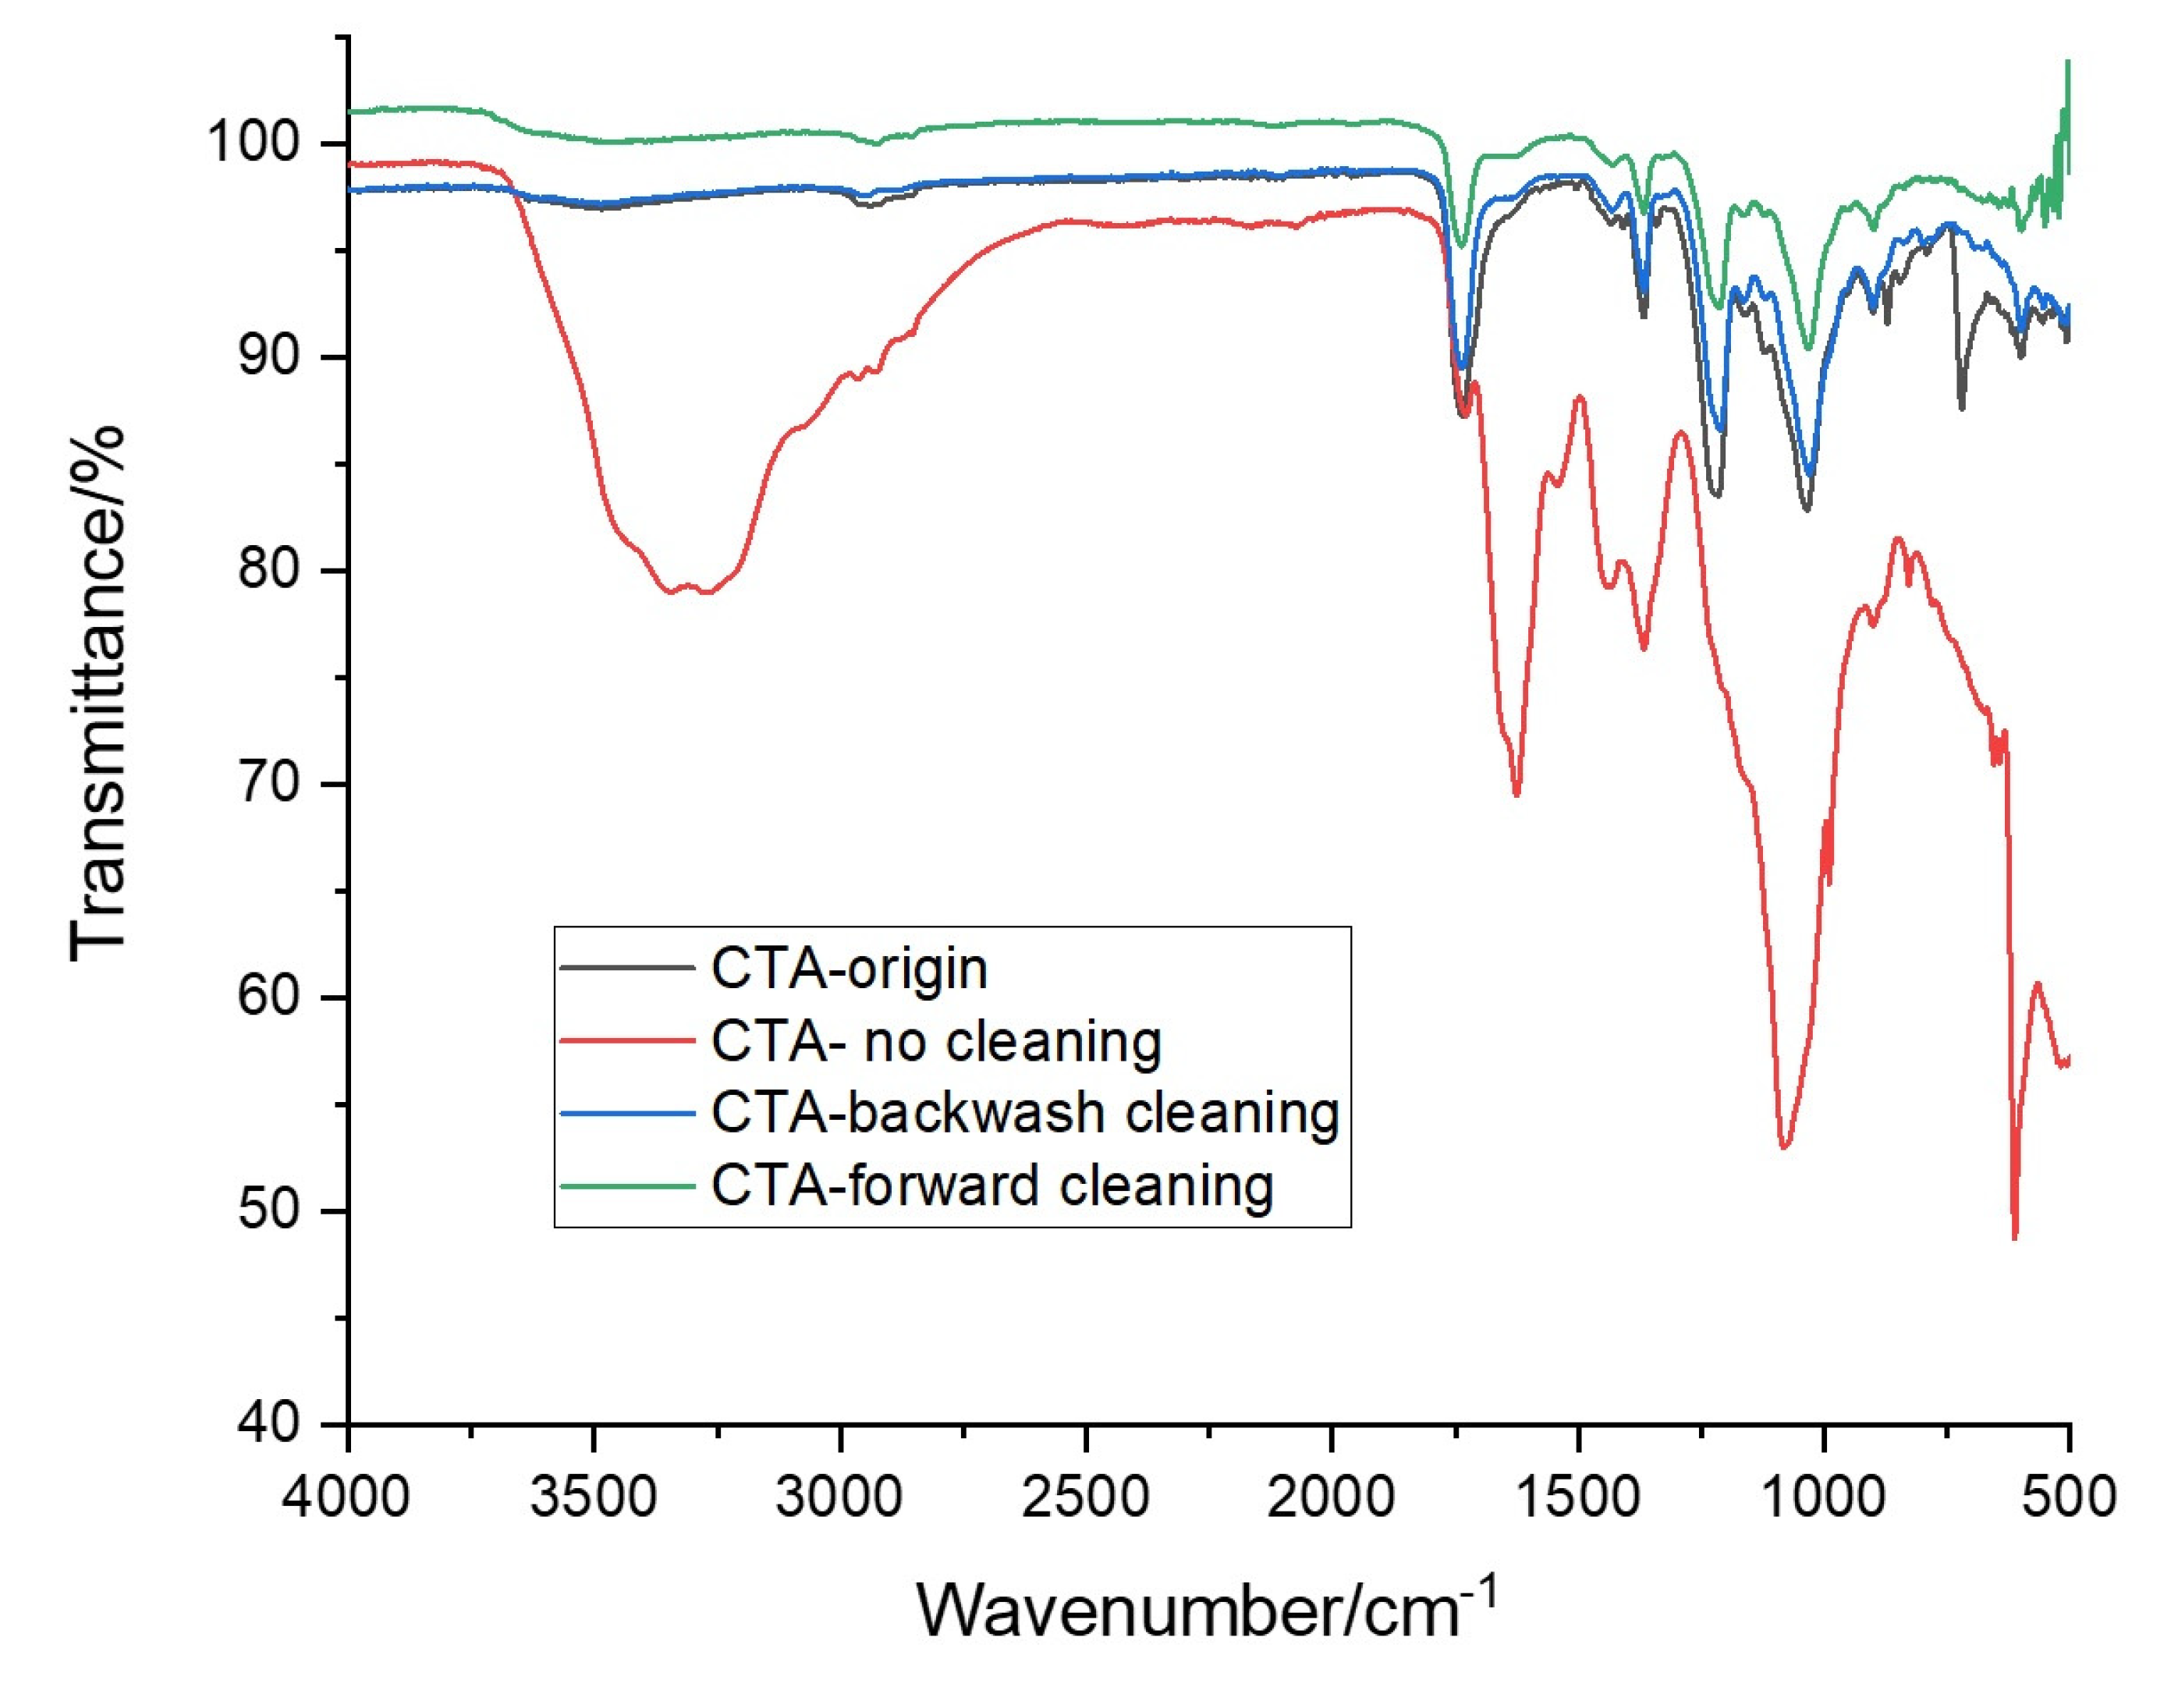
3.3.3. FTIR
4. Conclusions
Author Contributions
Funding
Acknowledgments
Conflicts of Interest
Abbreviations
| Active layer | AL |
| Atomic Force Microscopy | AFM |
| Cellulose triacetate | CTA |
| Concentration polarization | CP |
| Concentrative external concentration polarization | CECP |
| Deionized water | DI water |
| Dilutive internal concentration polarization | DICP |
| Draw solution/solute | DS |
| External concentration polarization | ECP |
| Feed solution | FS |
| Fertilizer draw solution/solute | FDS |
| Forward osmosis | FO |
| Fourier Transform infrared spectroscopy | FTIR |
| Internal concentration polarization | ICP |
| Multi- components fertilizer | MCF |
| Multi- components fertilizer draw solution | MCFDS |
| Porous layer | PL |
| Root mean square | RMS or Rq |
| Salt rejection percentage | R% |
| Scanning Electron Microscopy | SEM |
| Synthetic wastewater | SWW |
| Water flux | WF |
References
- Lee, W.J.; Ng, Z.C.; Hubadillah, S.K.; Goh, P.S.; Lau, W.J.; Othman, M.H.D.; Ismail, A.F.; Hilal, N. Fouling mitigation in forward osmosis and membrane distillation for desalination. Desalination 2020, 480, 114338. [Google Scholar] [CrossRef]
- Wu, W.; Shi, Y.; Liu, G.; Fan, X.; Yu, Y. Recent development of graphene oxide based forward osmosis membrane for water treatment: A critical review. Desalination 2020, 491, 114452. [Google Scholar] [CrossRef]
- Gulied, M.; al Momani, F.; Khraisheh, M.; Bhosale, R.; AlNouss, A. Influence of draw solution type and properties on the performance of forward osmosis process: Energy consumption and sustainable water reuse. Chemosphere 2019, 233, 234–244. [Google Scholar] [CrossRef]
- Rastogi, N.K. 1-Forward osmosis: Principles, applications, and recent developments. In Current Trends and Future Developments on (Bio-) Membranes; Basile, A., Cassano, A., Rastogi, N.K., Eds.; Elsevier: Amsterdam, Netherlands, 2020; pp. 3–35. [Google Scholar]
- Phuntsho, S.; Shon, H.K.; Majeed, T.; el Saliby, I.; Vigneswaran, S.; Kandasamy, J.; Hong, S.; Lee, S. Blended fertilizers as draw solutions for fertilizer-drawn forward osmosis desalination. Environ. Sci. Technol. 2012, 46, 4567–4575. [Google Scholar] [CrossRef] [PubMed]
- Phuntsho, S.; Kim, J.E.; Johir, M.A.; Hong, S.; Li, Z.; Ghaffour, N.; Leiknes, T.; Shon, H.K. Fertiliser drawn forward osmosis process: Pilot-scale desalination of mine impaired water for fertigation. J. Membr. Sci. 2016, 508, 22–31. [Google Scholar] [CrossRef]
- Lee, J.M.; Nguyen, D.Q.; Lee, S.B.; Kim, H.; Ahn, B.S.; Lee, H.; Kim, H.S. Cellulose triacetate-based polymer gel electrolytes. J. Appl. Polym. Sci. 2010, 115, 32–36. [Google Scholar] [CrossRef]
- Lee, S.; Boo, C.; Elimelech, M.; Hong, S. Comparison of fouling behavior in forward osmosis (FO) and reverse osmosis (RO). J. Membr. Sci. 2010, 365, 34–39. [Google Scholar] [CrossRef]
- Mi, B.; Elimelech, M. Gypsum scaling and cleaning in forward osmosis: Measurements and mechanisms. Environ. Sci. Technol. 2010, 44, 2022–2028. [Google Scholar] [CrossRef]
- Mi, B.; Elimelech, M. Organic fouling of forward osmosis membranes: Fouling reversibility and cleaning without chemical reagents. J. Membr. Sci. 2010, 348, 337–345. [Google Scholar] [CrossRef]
- Chun, Y.; Zaviska, F.; Cornelissen, E.; Zou, L. A case study of fouling development and flux reversibility of treating actual lake water by forward osmosis process. Desalination 2015, 357, 55–64. [Google Scholar] [CrossRef]
- Kim, Y.; Li, S.; Chekli, L.; Woo, Y.C.; Wei, C.-H.; Phuntsho, S.; Ghaffour, N.; Leiknes, T.; Shon, H.K. Assessing the removal of organic micro-pollutants from anaerobic membrane bioreactor effluent by fertilizer-drawn forward osmosis. J. Membr. Sci. 2017, 533, 84–95. [Google Scholar] [CrossRef]
- Lotfi, F.; Samali, B.; Hagare, D. Cleaning efficiency of the fouled forward osmosis membranes under different experimental conditions. J. Environ. Chem. Eng. 2018, 6, 4555–4563. [Google Scholar] [CrossRef]
- Lotfi, F.; Chekli, L.; Phuntsho, S.; Hong, S.; Choi, J.Y.; Shon, H.K. Understanding the possible underlying mechanisms for low fouling tendency of the forward osmosis and pressure assisted osmosis processes. Desalination 2017, 421, 89–98. [Google Scholar] [CrossRef]
- Balkenov, A.; Anuarbek, A.; Satayeva, A.; Kim, J.; Inglezakis, V.; Arkhangelsky, E. Complex organic fouling and effect of silver nanoparticles on aquaporin forward osmosis membranes. J. Water Process Eng. 2020, 34, 101177. [Google Scholar] [CrossRef]
- Jung, J.; Ryu, J.; Yu, Y.; Kweon, J. Characteristics of organic fouling, reversibility by physical cleaning and concentrates in forward osmosis membrane processes for wastewater reclamation. Chemosphere 2020, 245, 125787. [Google Scholar] [CrossRef]
- Kim, Y.; Li, S.; Ghaffour, N. Evaluation of different cleaning strategies for different types of forward osmosis membrane fouling and scaling. J. Membr. Sci. 2020, 596, 117731. [Google Scholar] [CrossRef]
- Liu, X.; Wu, J.; Hou, L.-A.; Wang, J. Fouling and cleaning protocols for forward osmosis membrane used for radioactive wastewater treatment. Nucl. Eng. Technol. 2020, 52, 581–588. [Google Scholar] [CrossRef]
- Siddiqui, F.A.; She, Q.; Fane, A.G.; Field, R.W. Exploring the differences between forward osmosis and reverse osmosis fouling. J. Membr. Sci. 2018, 565, 241–253. [Google Scholar] [CrossRef]
- Wang, C.; Wang, M.; Li, Y. Effects of sodium dodecyl sulfate on forward osmosis membrane fouling and its cleaning. Chemosphere 2020, 257, 127180. [Google Scholar] [CrossRef]
- Zou, S.; Gu, Y.; Xiao, D.; Tang, C.Y. The role of physical and chemical parameters on forward osmosis membrane fouling during algae separation. J. Membr. Sci. 2011, 366, 356–362. [Google Scholar] [CrossRef]
- Chekli, L.; Kim, Y.; Phuntsho, S.; Li, S.; Ghaffour, N.; Leiknes, T.; Shon, H.K. Evaluation of fertilizer-drawn forward osmosis for sustainable agriculture and water reuse in arid regions. J. Environ. Manag. 2017, 187, 137–145. [Google Scholar] [CrossRef]
- Xiang, X.; Zou, S.; He, Z. Energy consumption of water recovery from wastewater in a submerged forward osmosis system using commercial liquid fertilizer as a draw solute. Sep. Purif. Technol. 2017, 174, 432–438. [Google Scholar] [CrossRef]
- Yangali-Quintanilla, V.; Li, Z.; Valladares, R.; Li, Q.; Amy, G. Indirect desalination of Red Sea water with forward osmosis and low pressure reverse osmosis for water reuse. Desalination 2011, 280, 160–166. [Google Scholar] [CrossRef]
- Benavides, S.; Phillip, W.A. Water recovery and solute rejection in forward osmosis modules: Modeling and bench-scale experiments. J. Membr. Sci. 2016, 505, 26–35. [Google Scholar] [CrossRef]
- Motsa, M.M.; Mamba, B.B.; Thwala, J.M.; Verliefde, A.R. Osmotic backwash of fouled FO membranes: Cleaning mechanisms and membrane surface properties after cleaning. Desalination 2017, 402, 62–71. [Google Scholar] [CrossRef]
- Xie, M.; Gray, S.R. Gypsum scaling in forward osmosis: Role of membrane surface chemistry. J. Membr. Sci. 2016, 513, 250–259. [Google Scholar] [CrossRef]
- McCutcheon, J.R.; McGinnis, R.L.; Elimelech, M. Desalination by ammonia–carbon dioxide forward osmosis: Influence of draw and feed solution concentrations on process performance. J. Membr. Sci. 2006, 278, 114–123. [Google Scholar] [CrossRef]
- Ansari, A.J.; Hai, F.I.; He, T.; Price, W.E.; Nghiem, L.D. Physical cleaning techniques to control fouling during the pre-concentration of high suspended-solid content solutions for resource recovery by forward osmosis. Desalination 2018, 429, 134–141. [Google Scholar] [CrossRef]
- Heo, J.; Chu, K.H.; Her, N.; Im, J.; Park, Y.-G.; Cho, J.; Sarp, S.; Jang, A.; Jang, M.; Yoon, Y. Organic fouling and reverse solute selectivity in forward osmosis: Role of working temperature and inorganic draw solutions. Desalination 2016, 389, 162–170. [Google Scholar] [CrossRef]
- Suwaileh, W.; Johnson, D.; Hilal, N. Brackish water desalination for agriculture: Assessing the performance of inorganic fertilizer draw solutions. Desalination 2019, 456, 53–63. [Google Scholar] [CrossRef]
- Honda, R.; Rukapan, W.; Komura, H.; Teraoka, Y.; Noguchi, M.; Hoek, E.M. Effects of membrane orientation on fouling characteristics of forward osmosis membrane in concentration of microalgae culture. Bioresour. Technol. 2015, 197, 429–433. [Google Scholar] [CrossRef] [PubMed]
- Volpin, F.; Chekli, L.; Phuntsho, S.; Cho, J.; Ghaffour, N.; Vrouwenvelder, J.S.; Shon, H.K. Simultaneous phosphorous and nitrogen recovery from source-separated urine: A novel application for fertiliser drawn forward osmosis. Chemosphere 2018, 203, 482–489. [Google Scholar] [CrossRef] [PubMed]
- Tawalbeh, M.; Al-Othman, A.; Singh, K.; Douba, I.; Kabakebji, D.; Alkasrawi, M. Microbial desalination cells for water purification and power generation: A critical review. Energy 2020, 209, 118493. [Google Scholar] [CrossRef]
- Jin, X.; Shan, J.; Wang, C.; Wei, J.; Tang, C.Y. Rejection of pharmaceuticals by forward osmosis membranes. J. Hazard. Mater. 2012, 227, 55–61. [Google Scholar] [CrossRef] [PubMed]


| Composition | Units | SWW |
|---|---|---|
| pH | 7.4 | |
| EC (Electric Conductivity) | mS/cm | 60.33 |
| π | bar | 37.96 |
| TDS (Total Dissolved Solids) | mg/L | 54,297 |
| TOC (Total Organic Content) | mg/L | 1333 |
| COD (Chemical Oxygen Demand) | mg/L | 861.66 |
| Ammonia (NH3) | mg/L | 1370.3 |
| Nitrate (NO3−) | mg/L | 2100.65 |
| Phosphate (PO43−) | mg/L | 3125 |
| Potassium (K) | mg/L | 4081.15 |
| Sulfate SO42− | mg/L | 1364.85 |
| Chloride (Cl) | mg/L | 20,550.75 |
| Sodium (Na) | mg/L | 12,376.25 |
| Calcium (Ca) | mg/L | 265.4 |
| Magnesium (Mg) | mg/L | 179.5 |
| Fertilizer | Weight Percent% |
| Total Nitrogen (N) | 20 |
| Ammonia (NH4+-N) | 3.9 |
| Nitrate (NO3−-N) | 3.6 |
| Urea-N | 12.6 |
| Phosphorus peroxide (P2O5-P) | 20 |
| Potassium oxide (K2O-K) | 20 |
© 2020 by the authors. Licensee MDPI, Basel, Switzerland. This article is an open access article distributed under the terms and conditions of the Creative Commons Attribution (CC BY) license (http://creativecommons.org/licenses/by/4.0/).
Share and Cite
Khraisheh, M.; Gulied, M.; AlMomani, F. Effect of Membrane Fouling on Fertilizer-Drawn Forward Osmosis Desalination Performance. Membranes 2020, 10, 243. https://doi.org/10.3390/membranes10090243
Khraisheh M, Gulied M, AlMomani F. Effect of Membrane Fouling on Fertilizer-Drawn Forward Osmosis Desalination Performance. Membranes. 2020; 10(9):243. https://doi.org/10.3390/membranes10090243
Chicago/Turabian StyleKhraisheh, Majeda, Mona Gulied, and Fares AlMomani. 2020. "Effect of Membrane Fouling on Fertilizer-Drawn Forward Osmosis Desalination Performance" Membranes 10, no. 9: 243. https://doi.org/10.3390/membranes10090243
APA StyleKhraisheh, M., Gulied, M., & AlMomani, F. (2020). Effect of Membrane Fouling on Fertilizer-Drawn Forward Osmosis Desalination Performance. Membranes, 10(9), 243. https://doi.org/10.3390/membranes10090243