Long-Running Comparison of Feed-Water Scaling in Membrane Distillation

 ,
, 
Abstract
1. Introduction
2. Materials and Methods
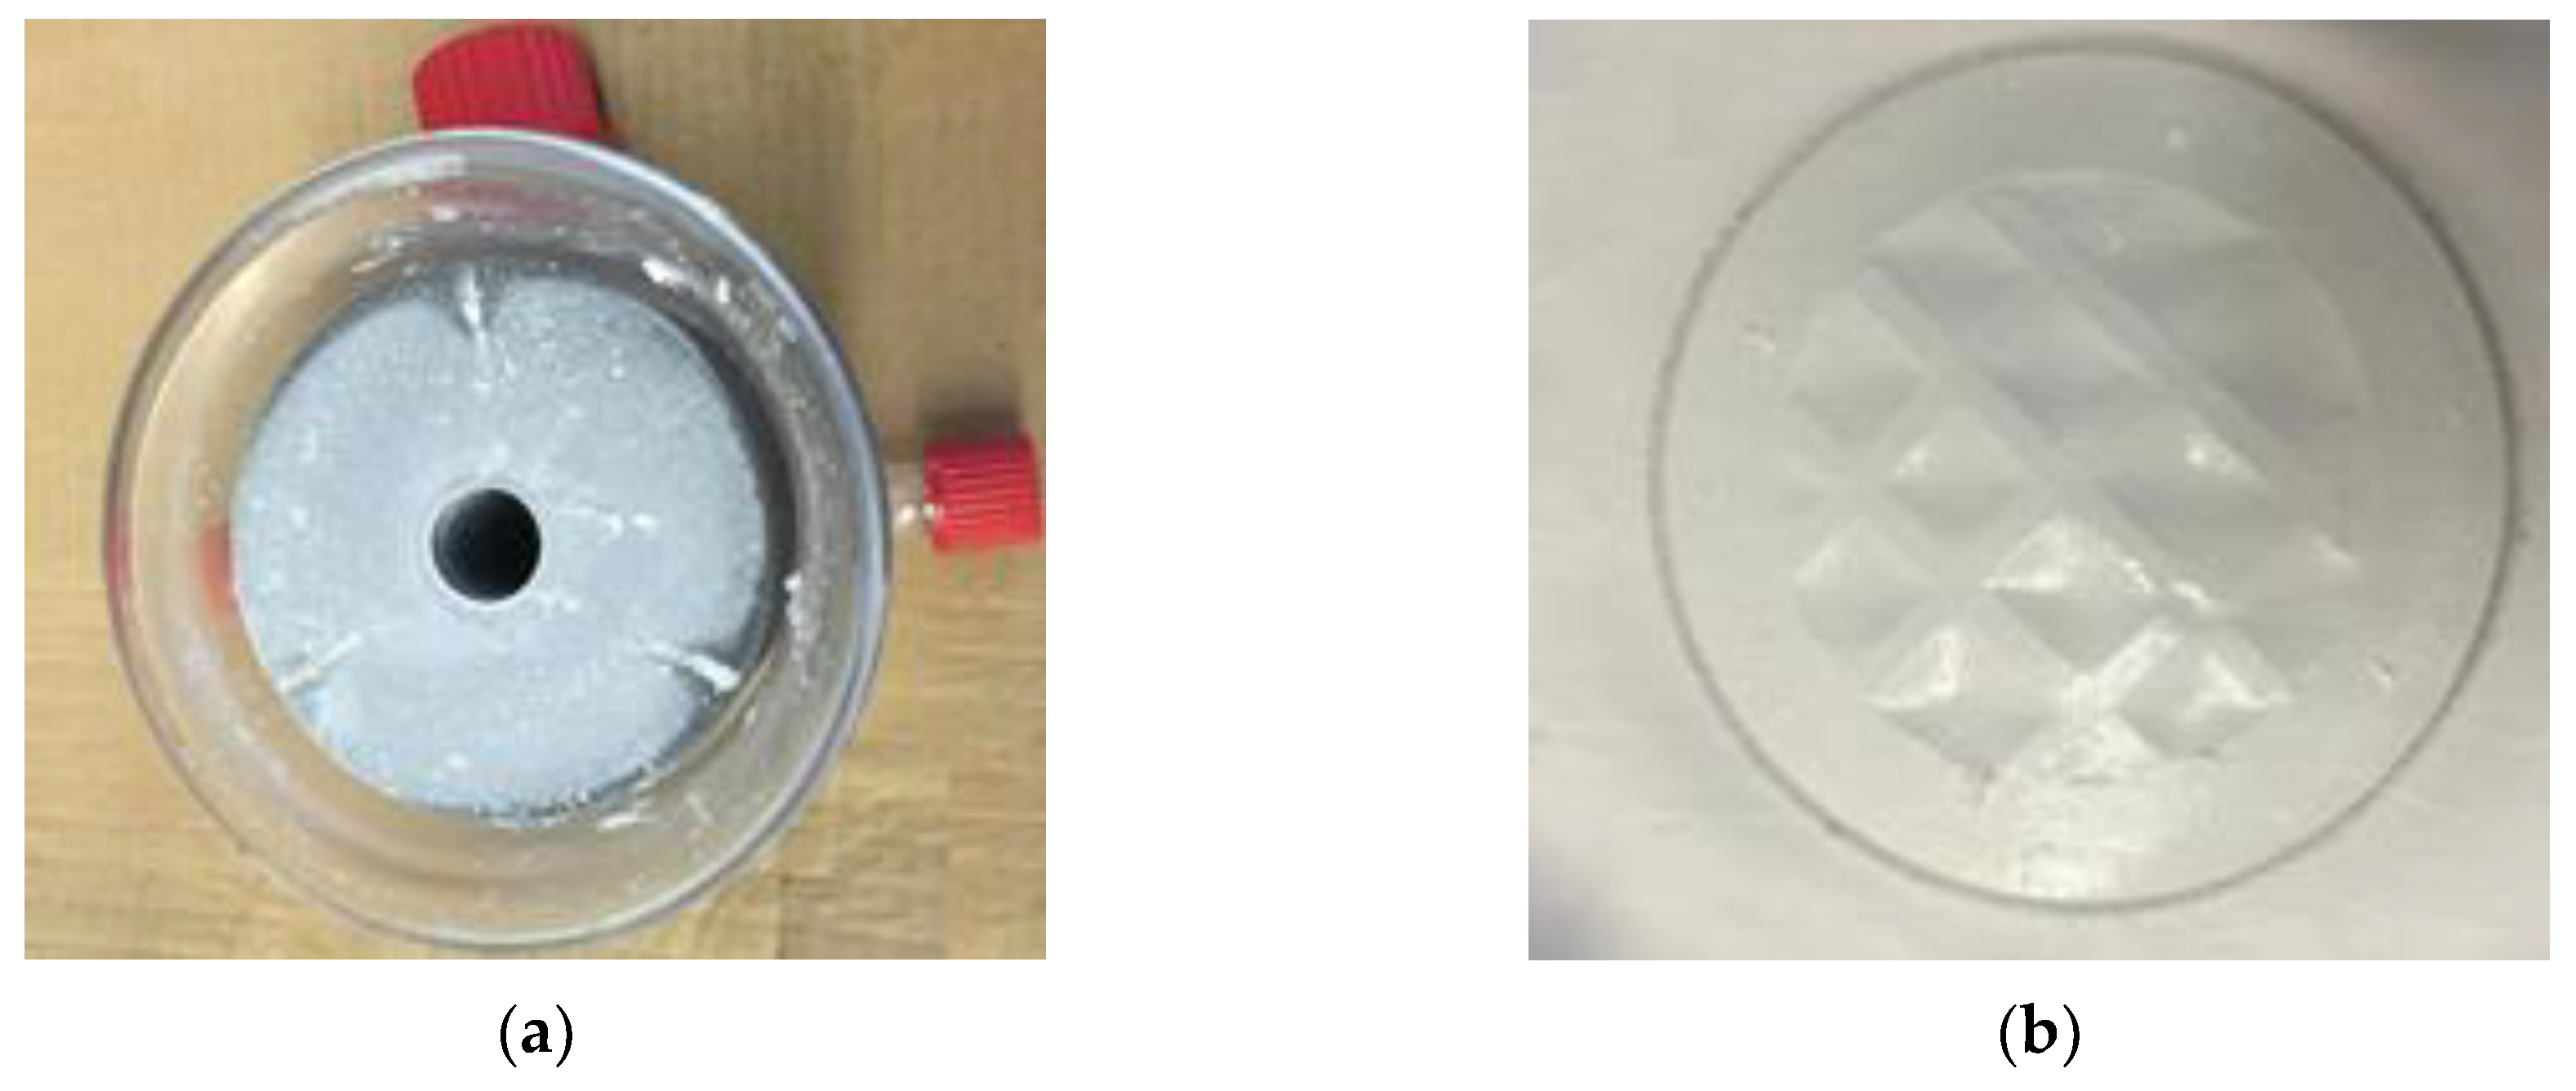
2.1. Laboratory Apparatus
2.2. Membrane Material
2.3. Feed Waters
2.4. Salt Saturation Modeling
2.5. Antiscalant
3. Results
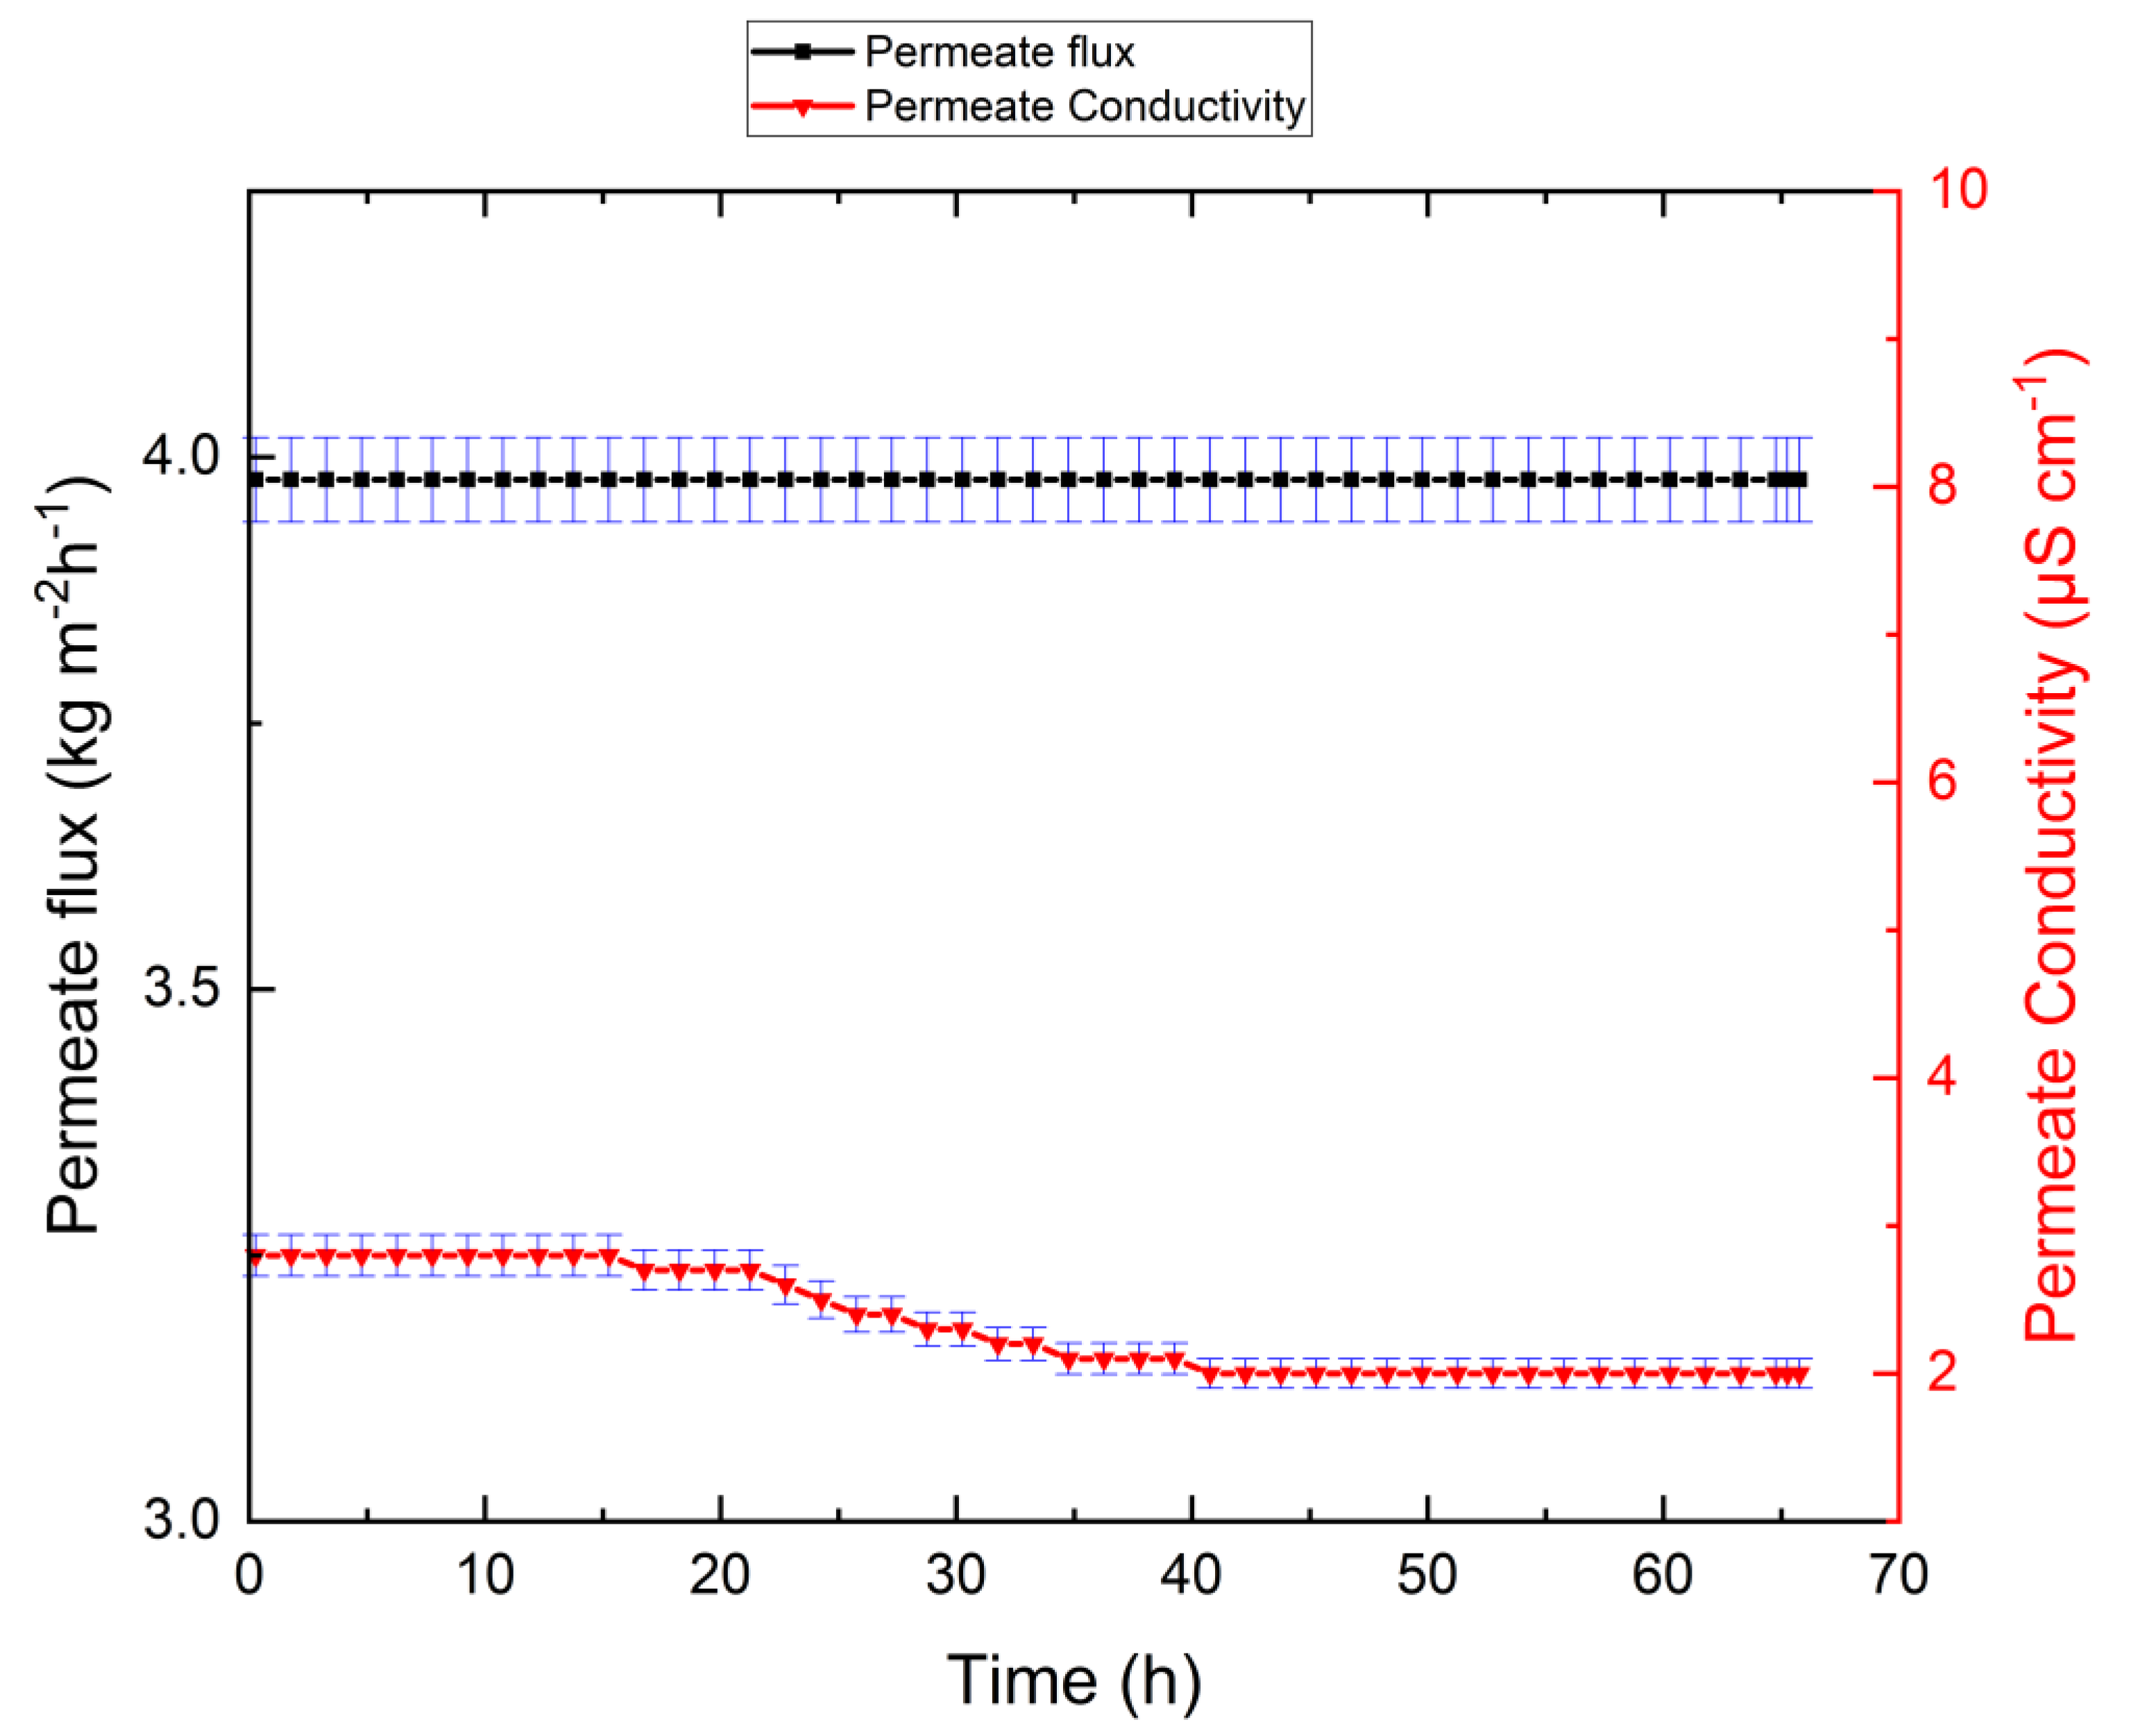
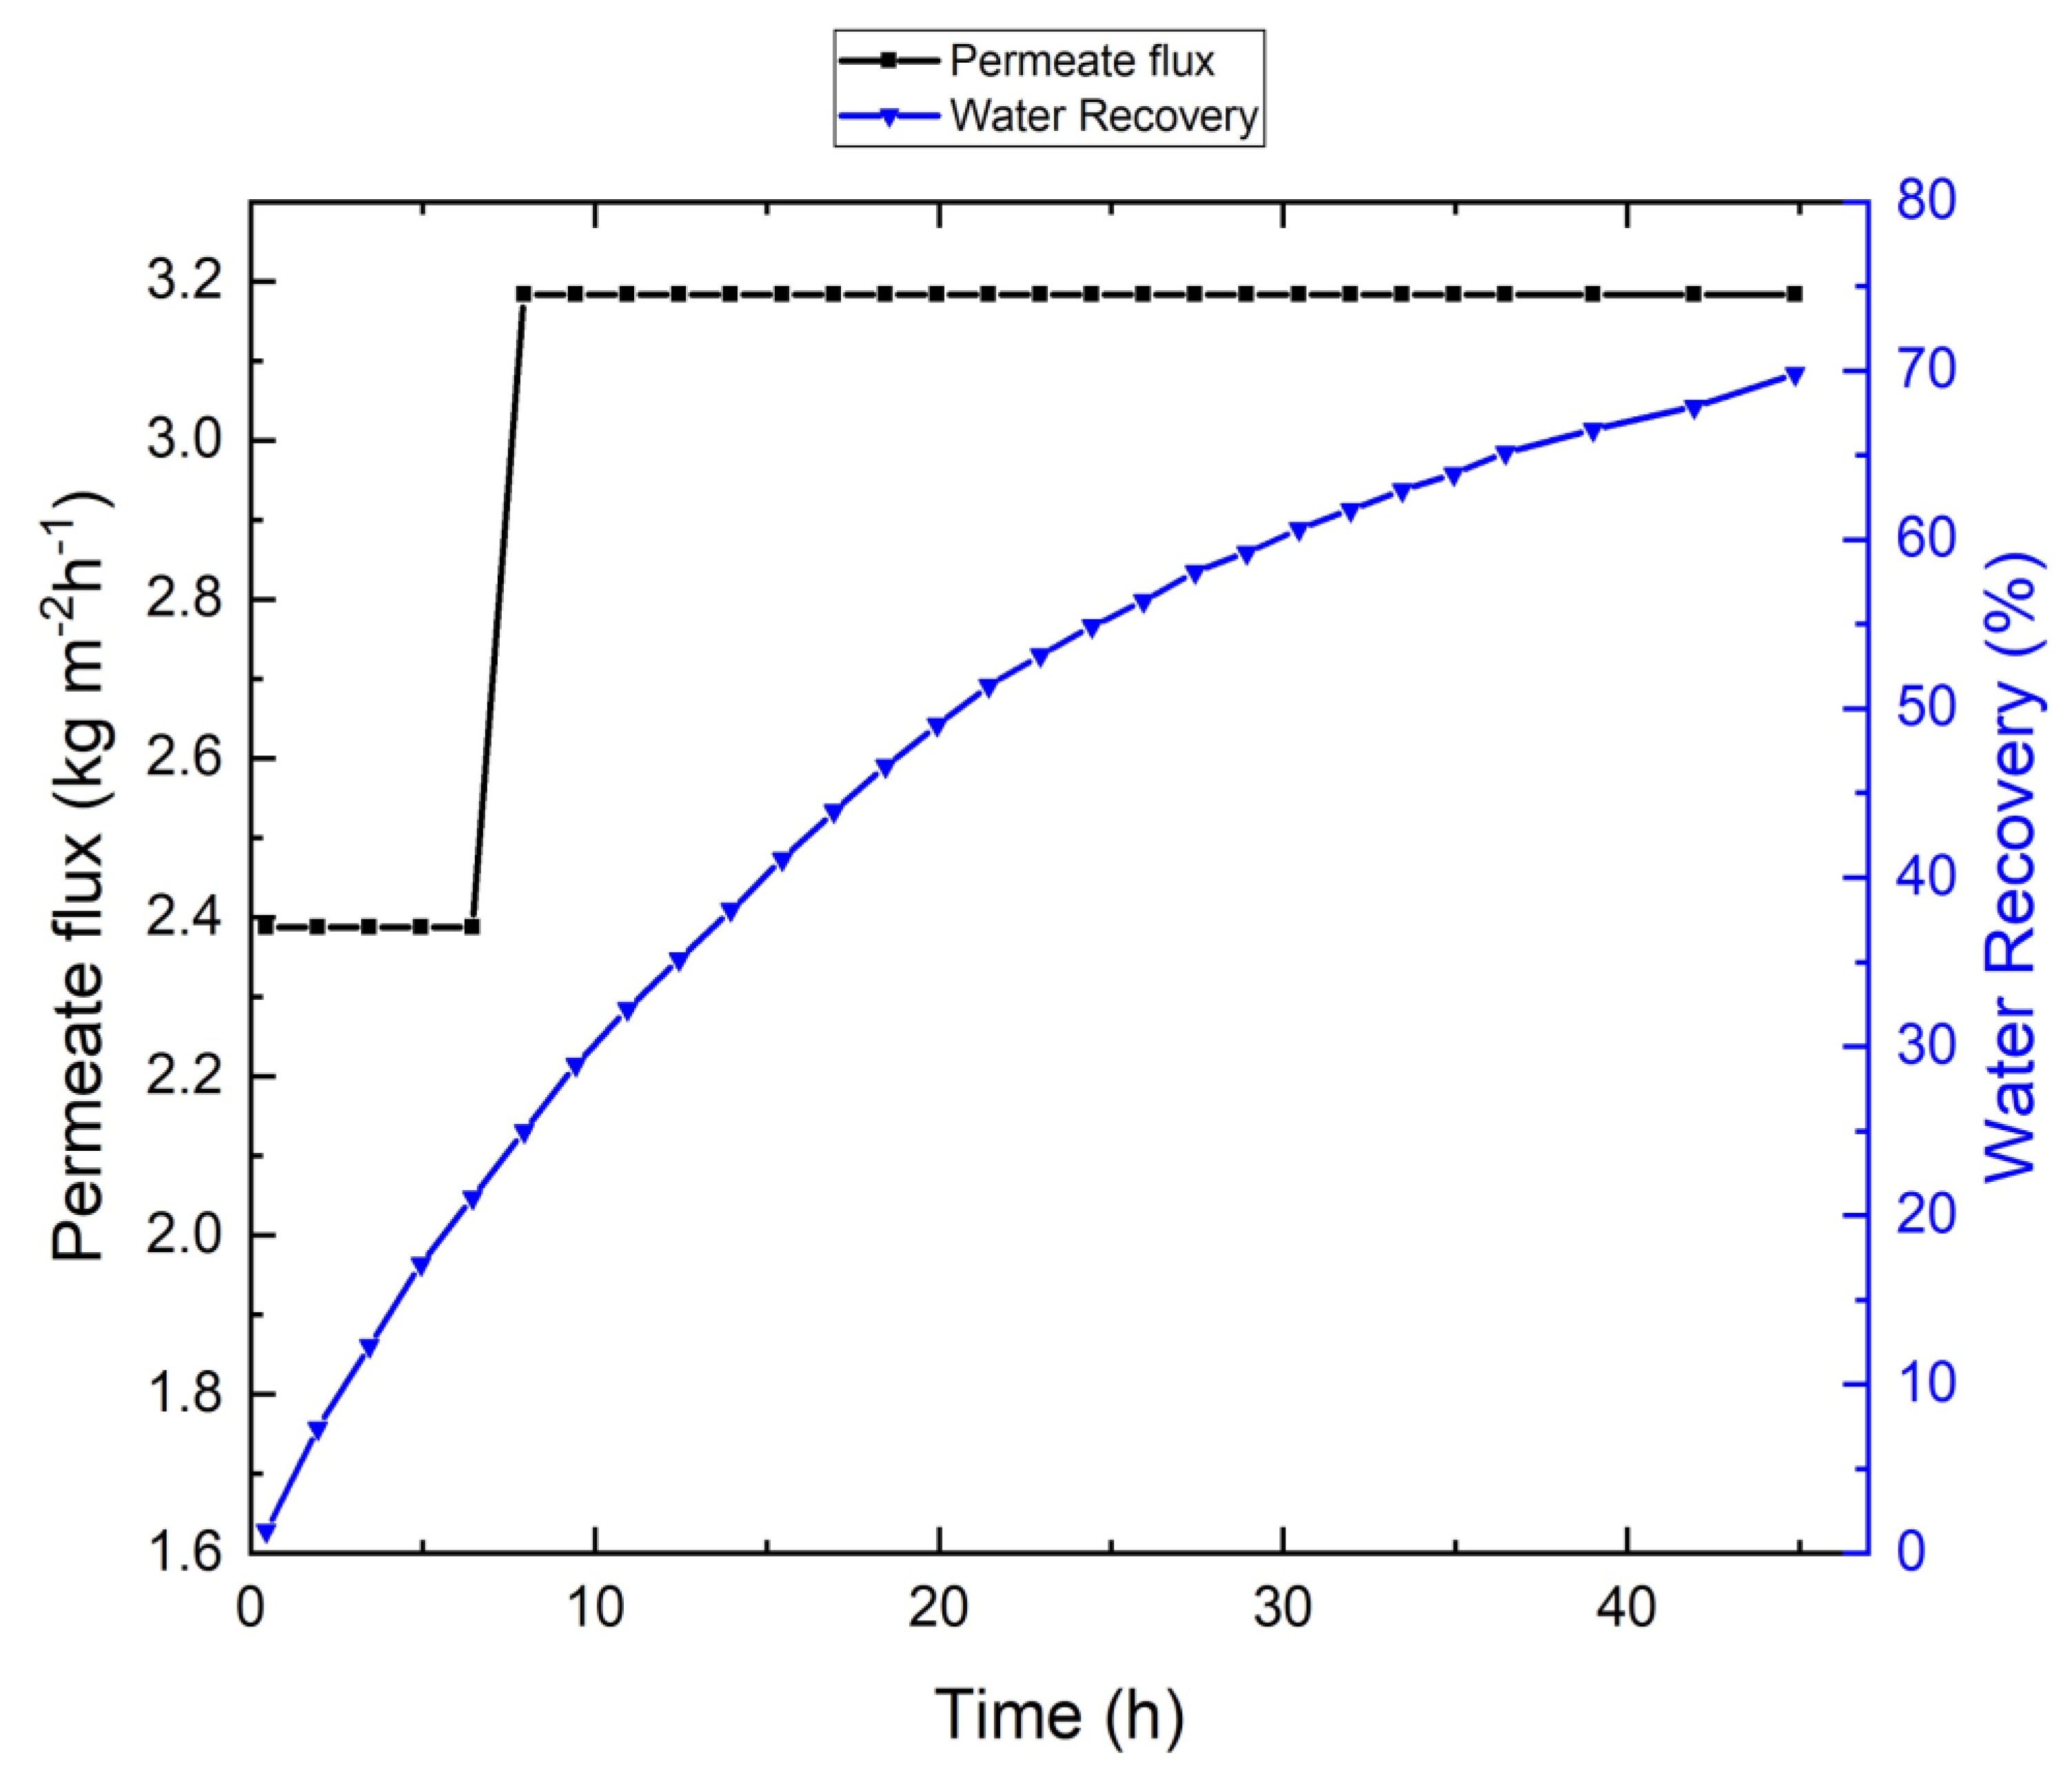
3.1. Tap-Water-Based VMD Results
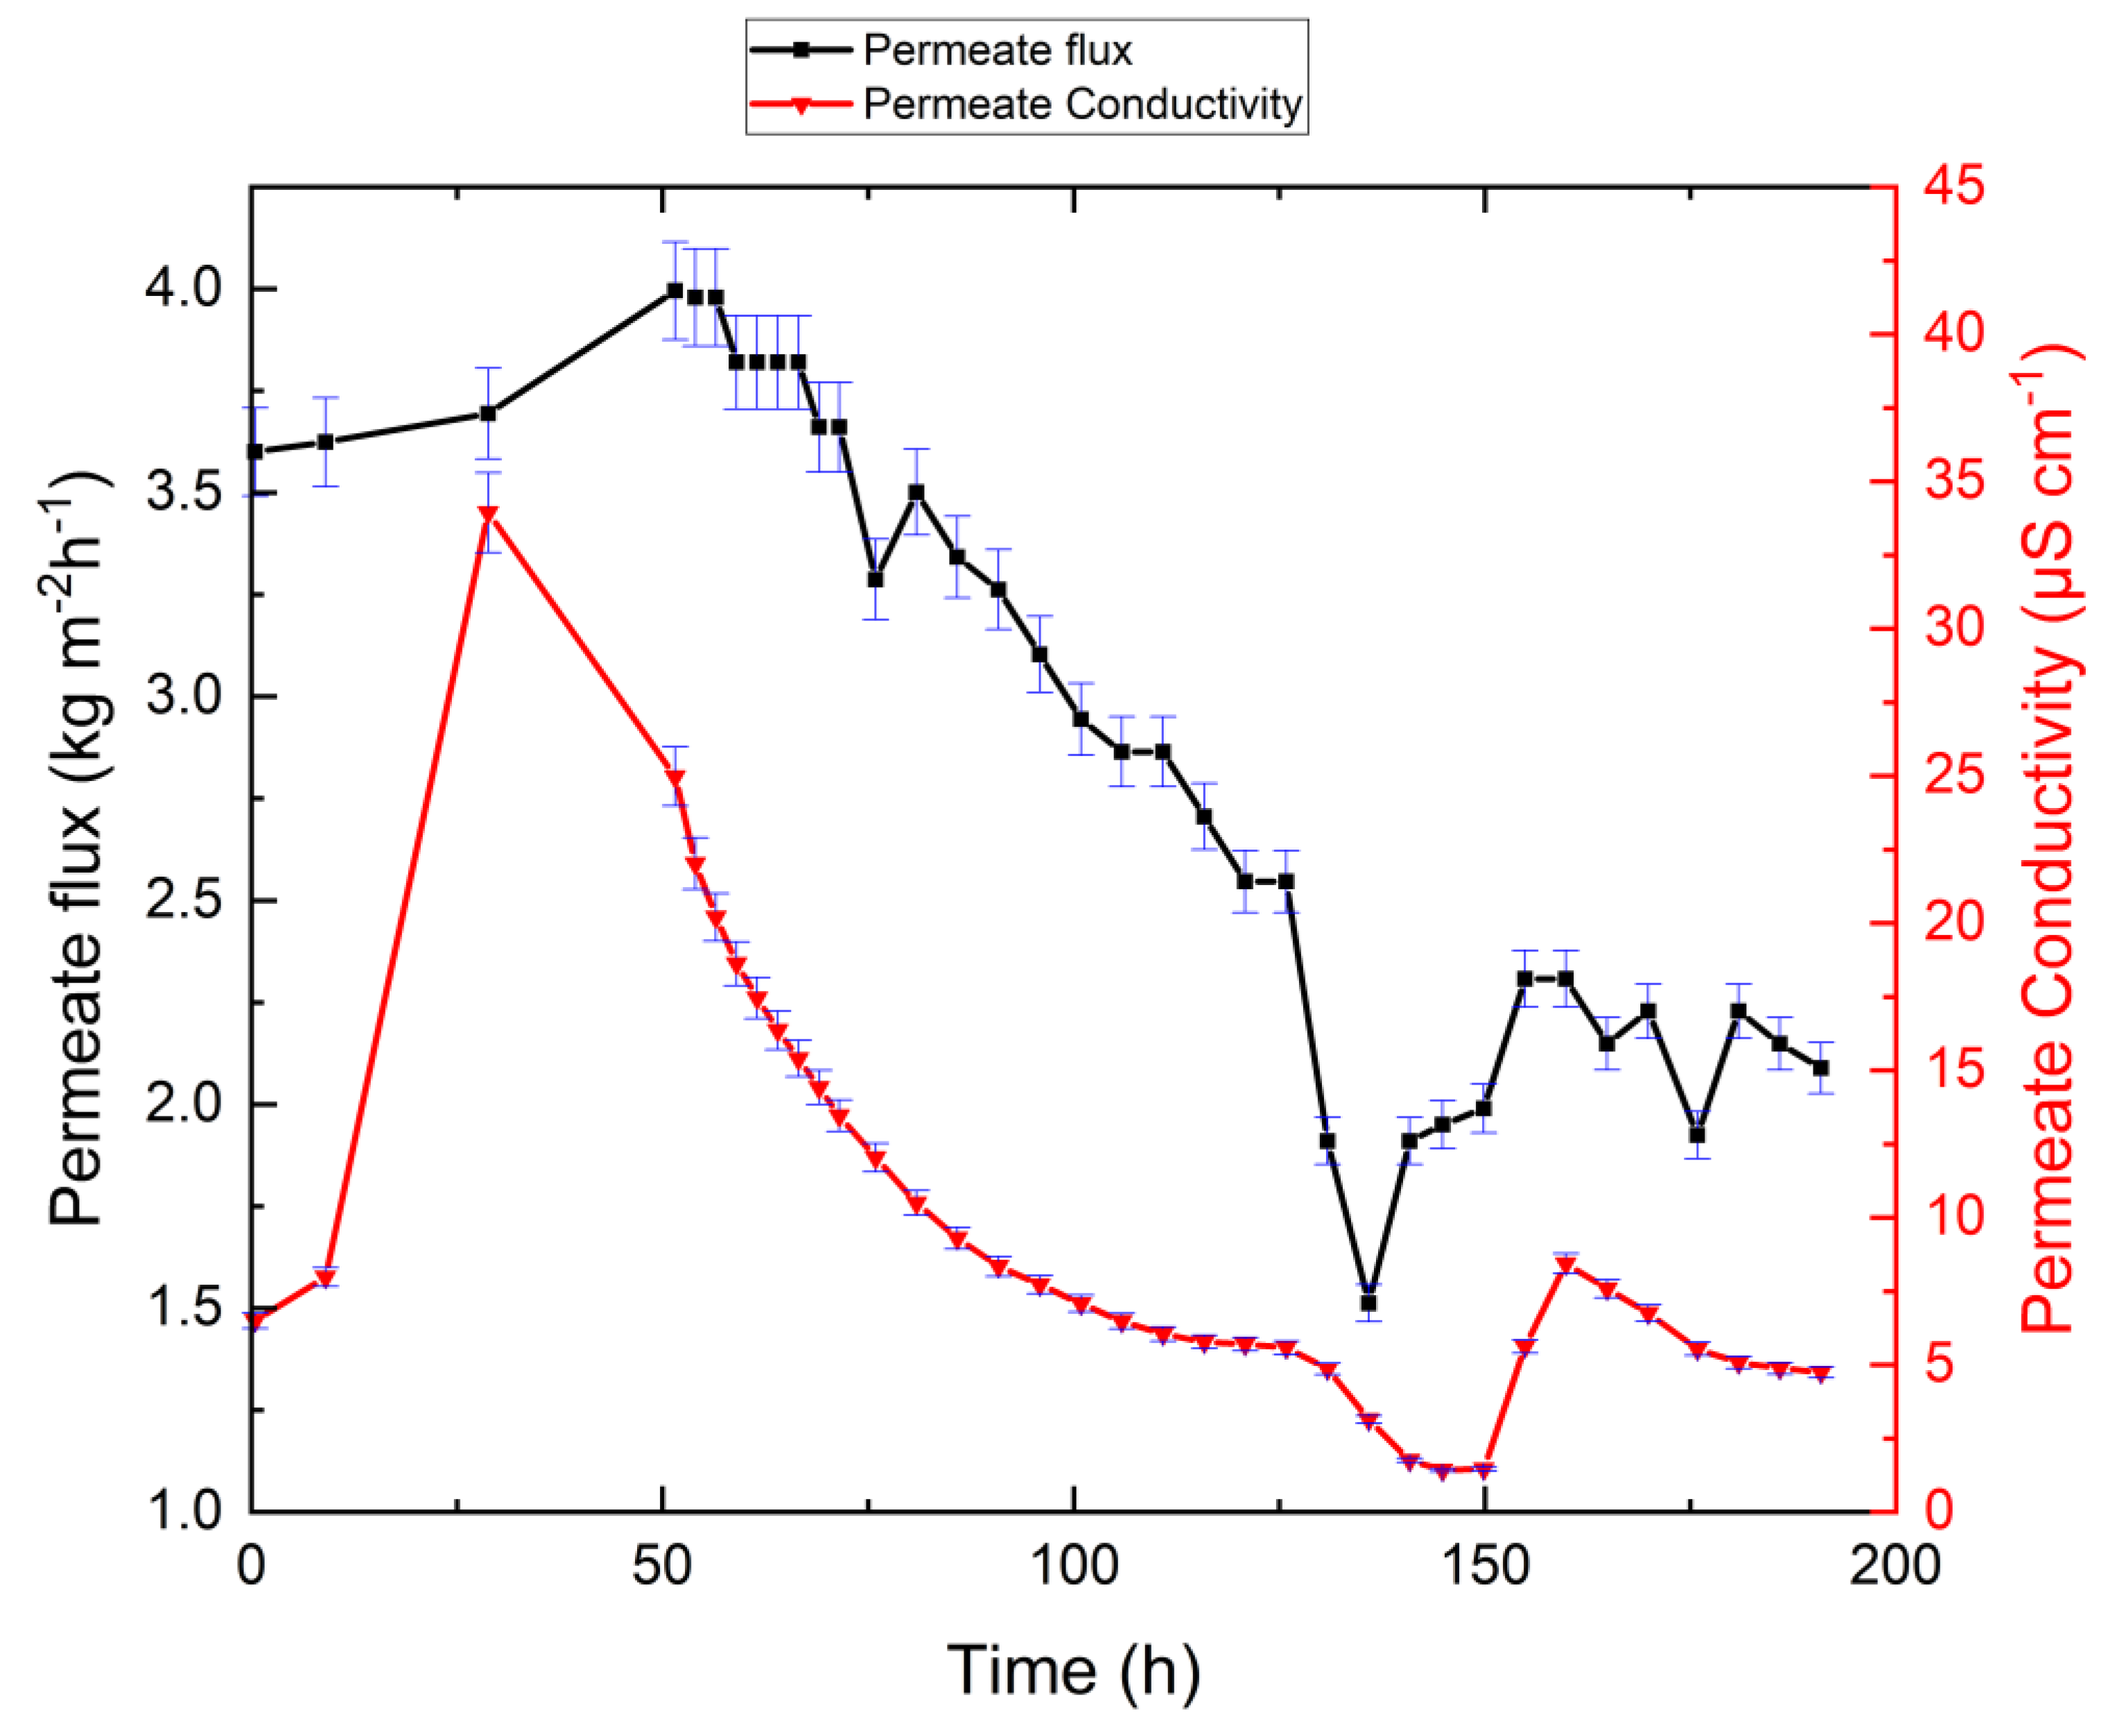
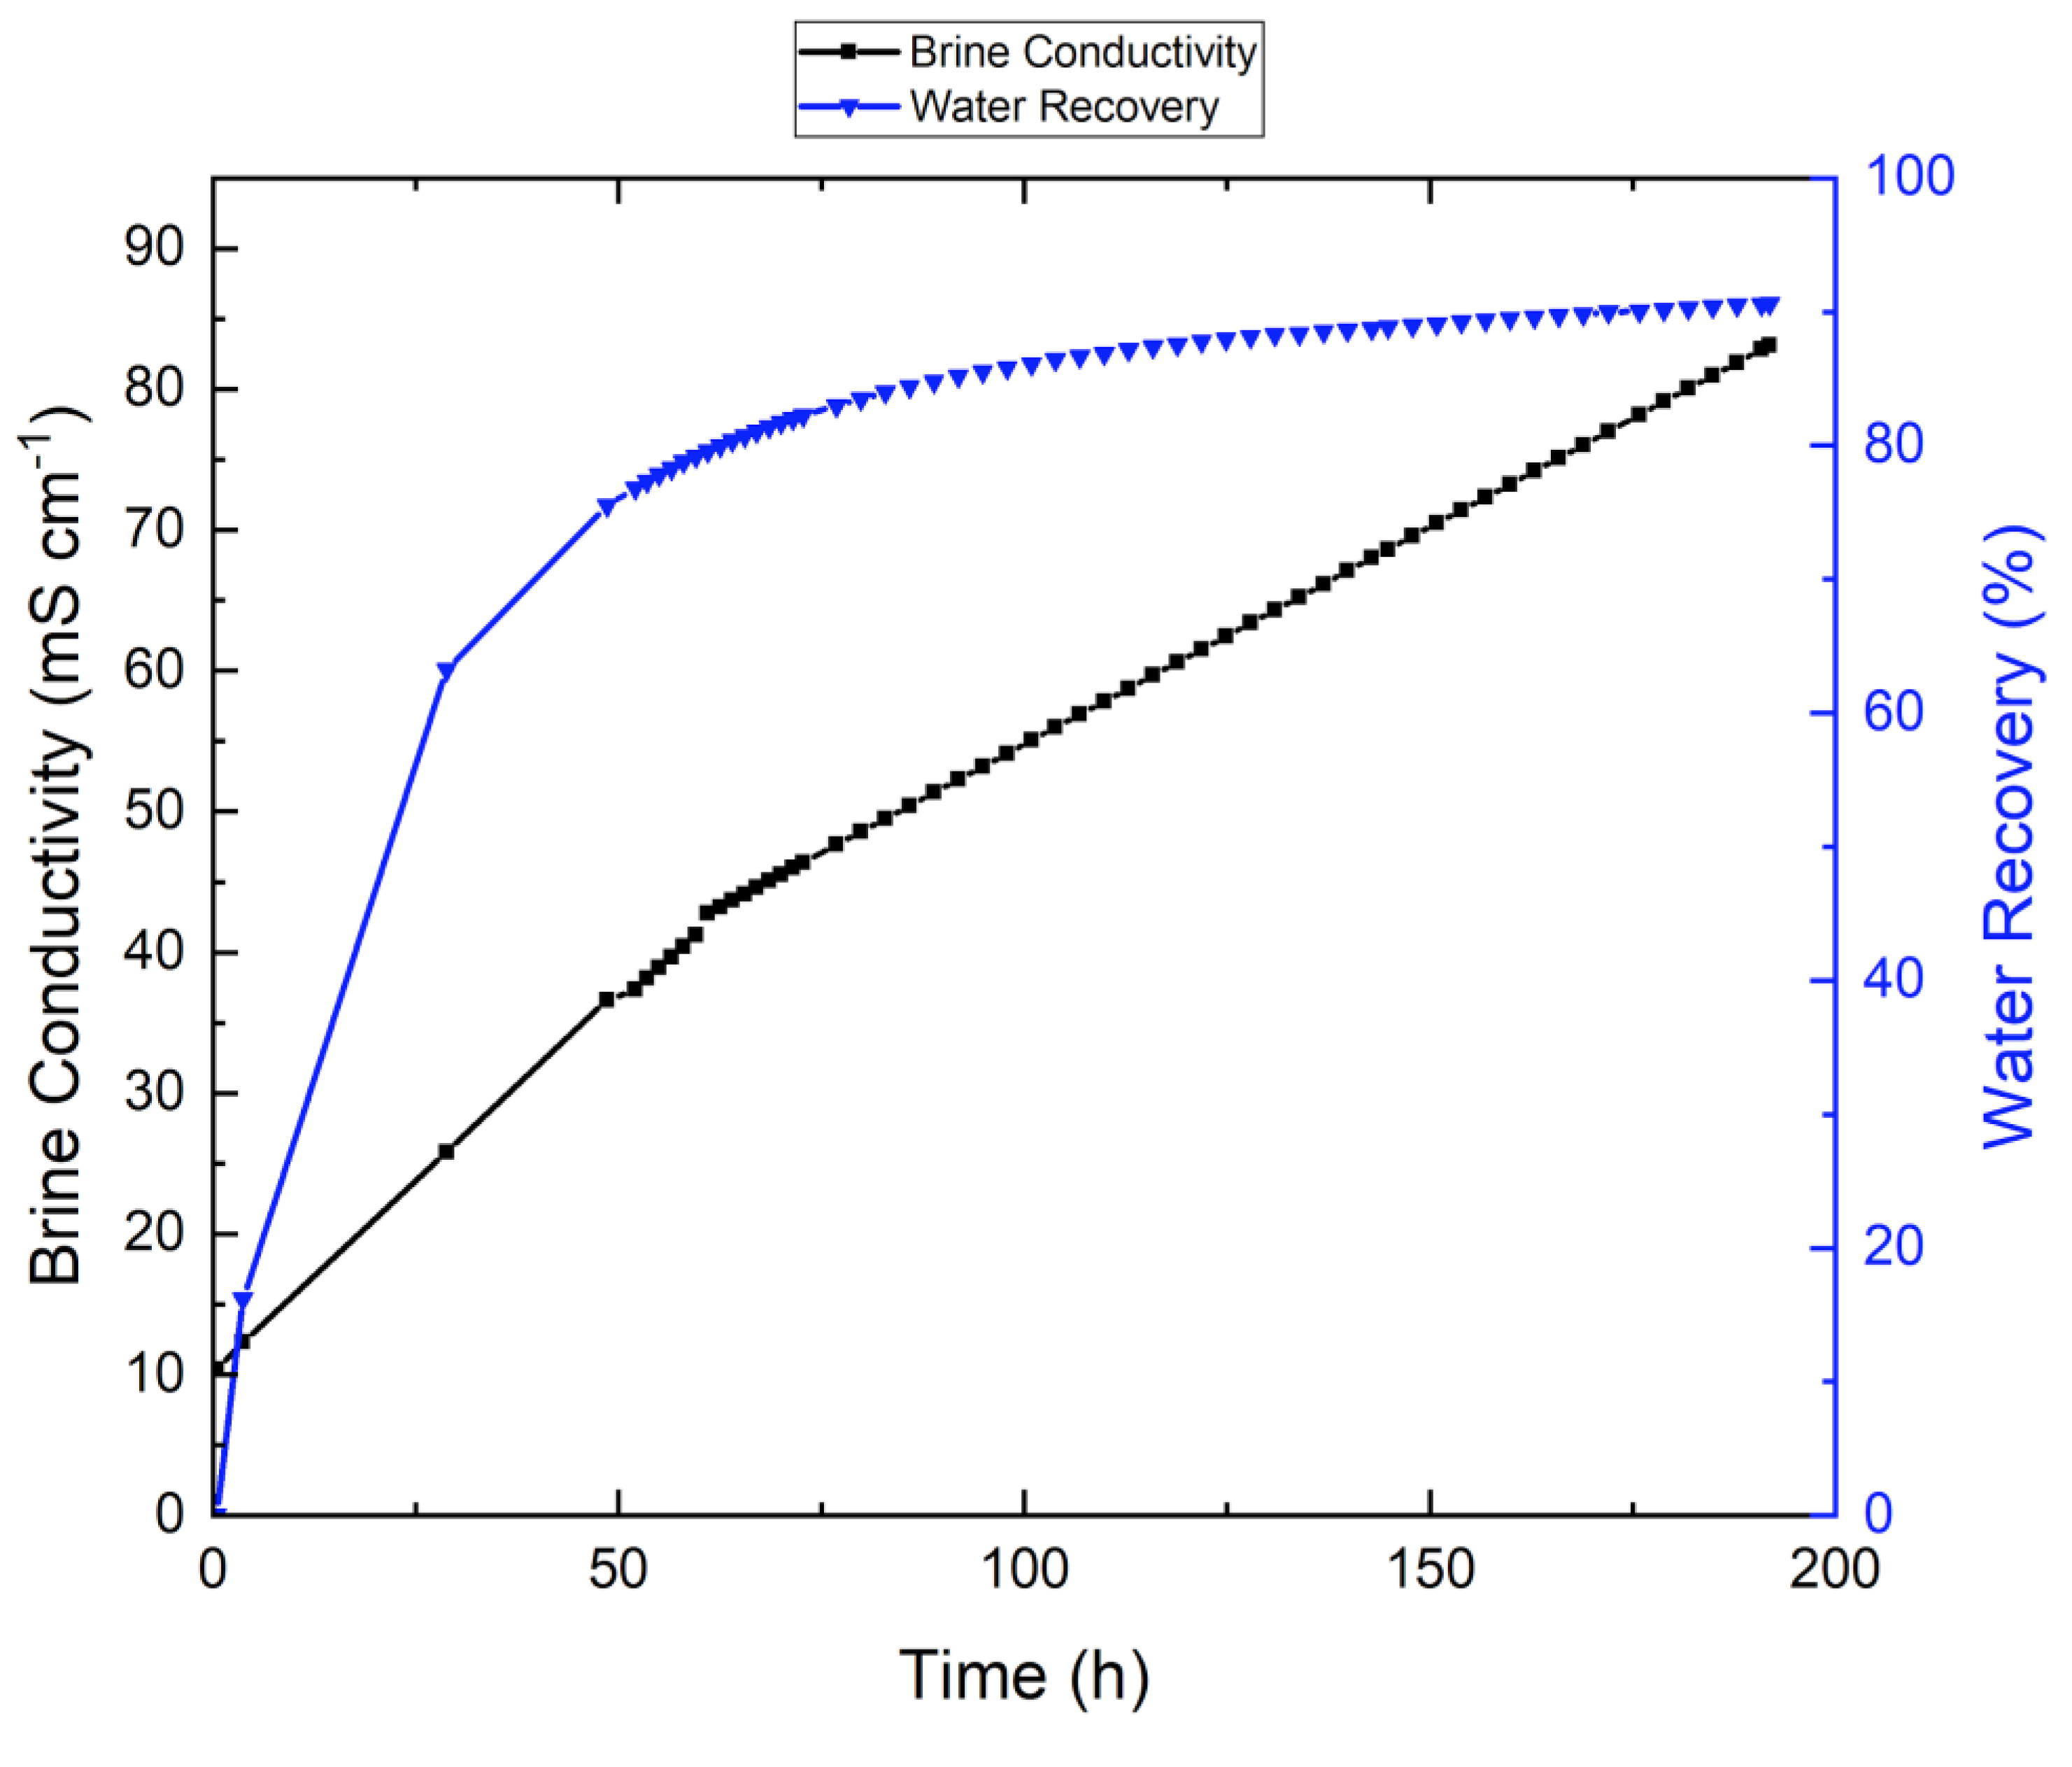
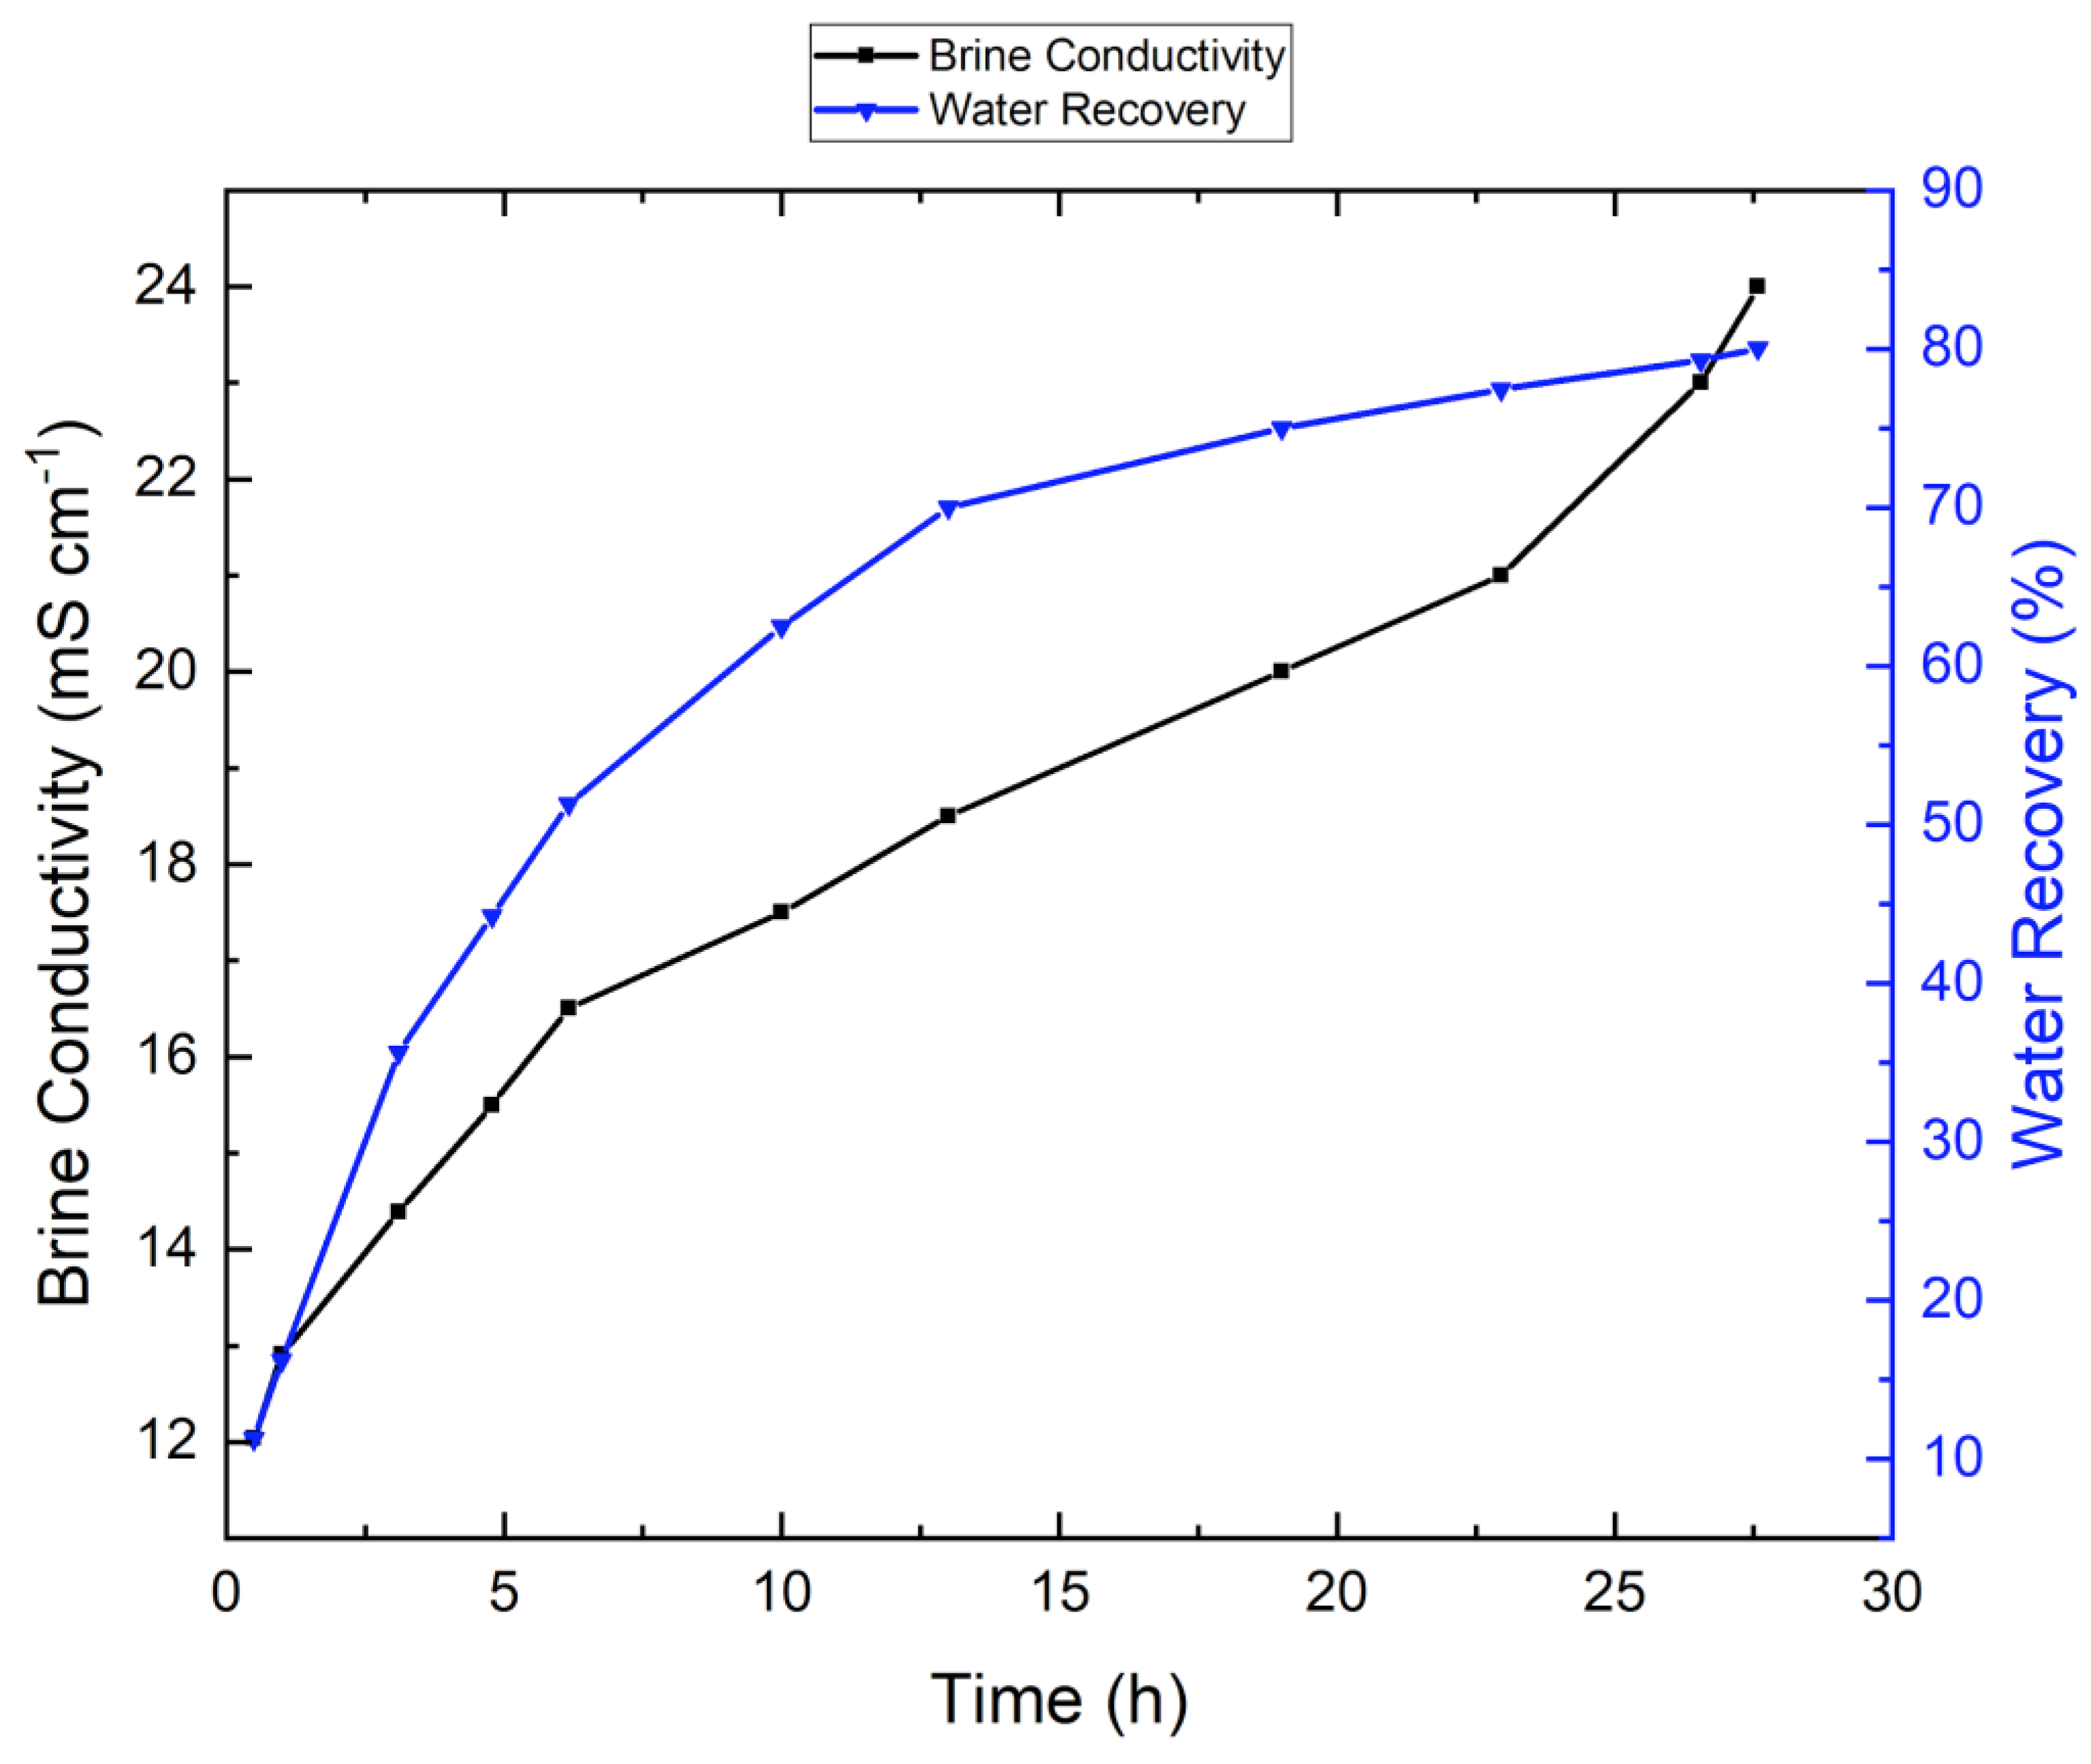
3.2. VMD Results for Synthetic Brine Without Antiscalant
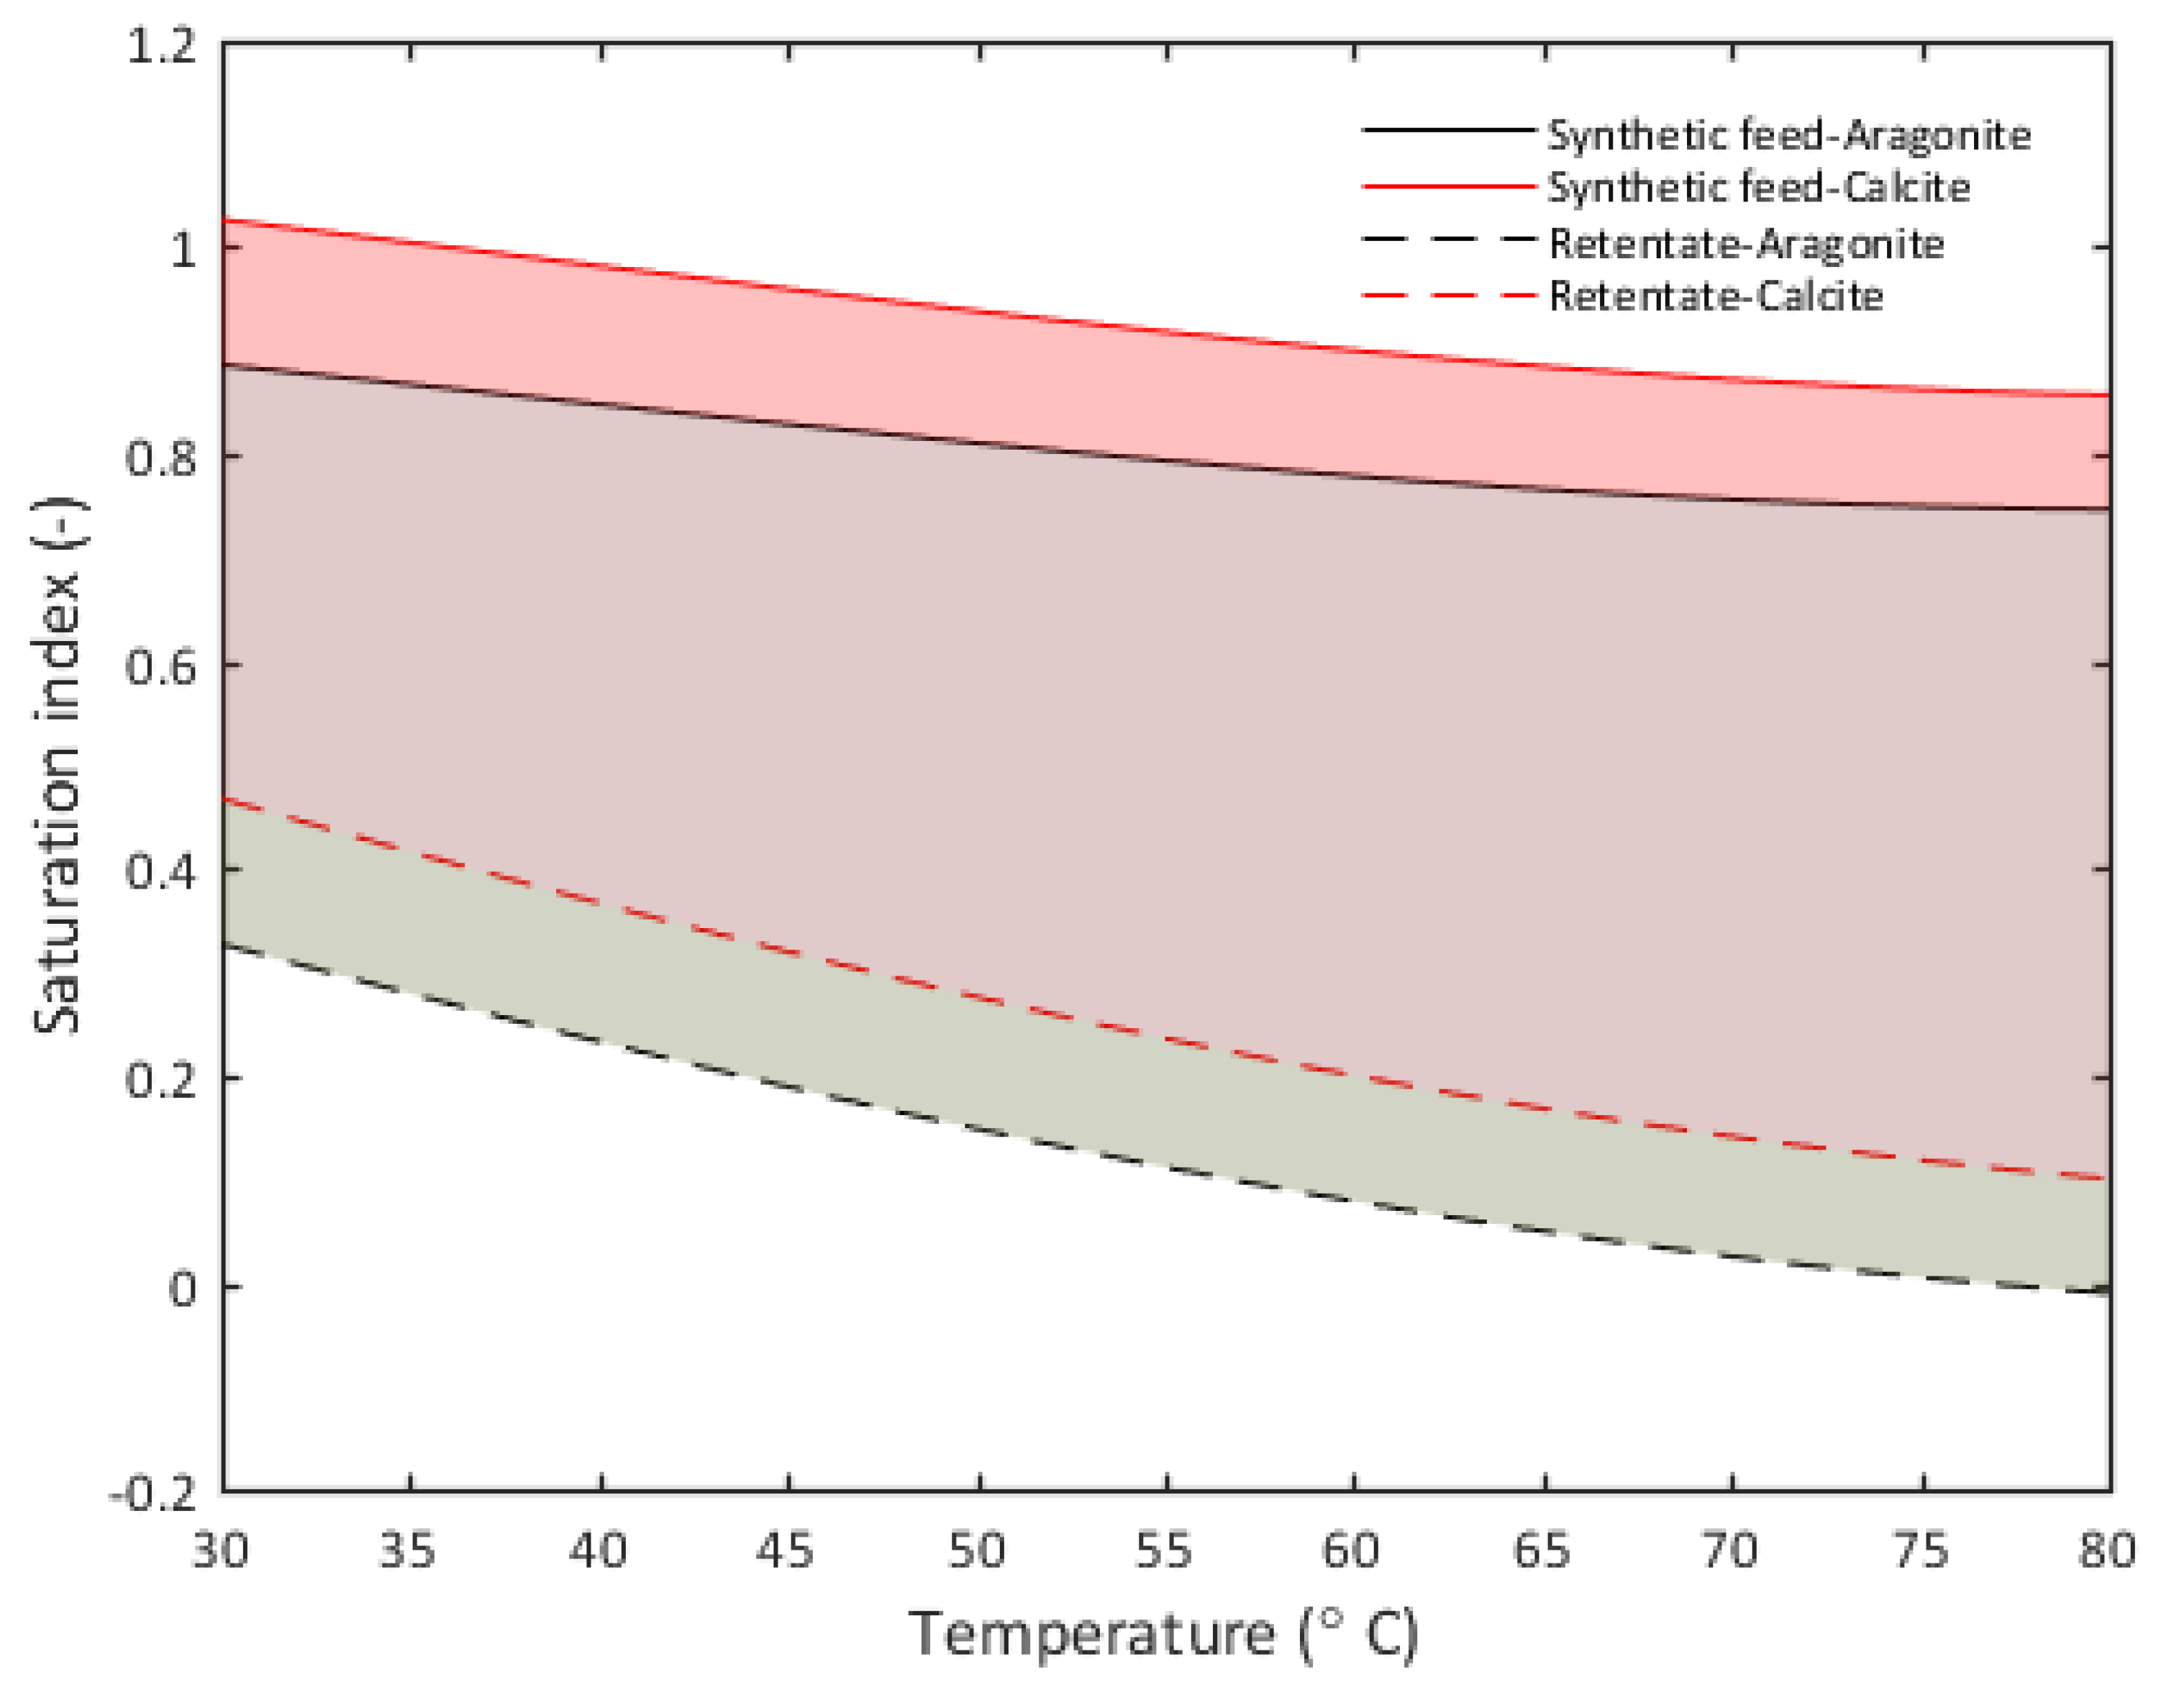
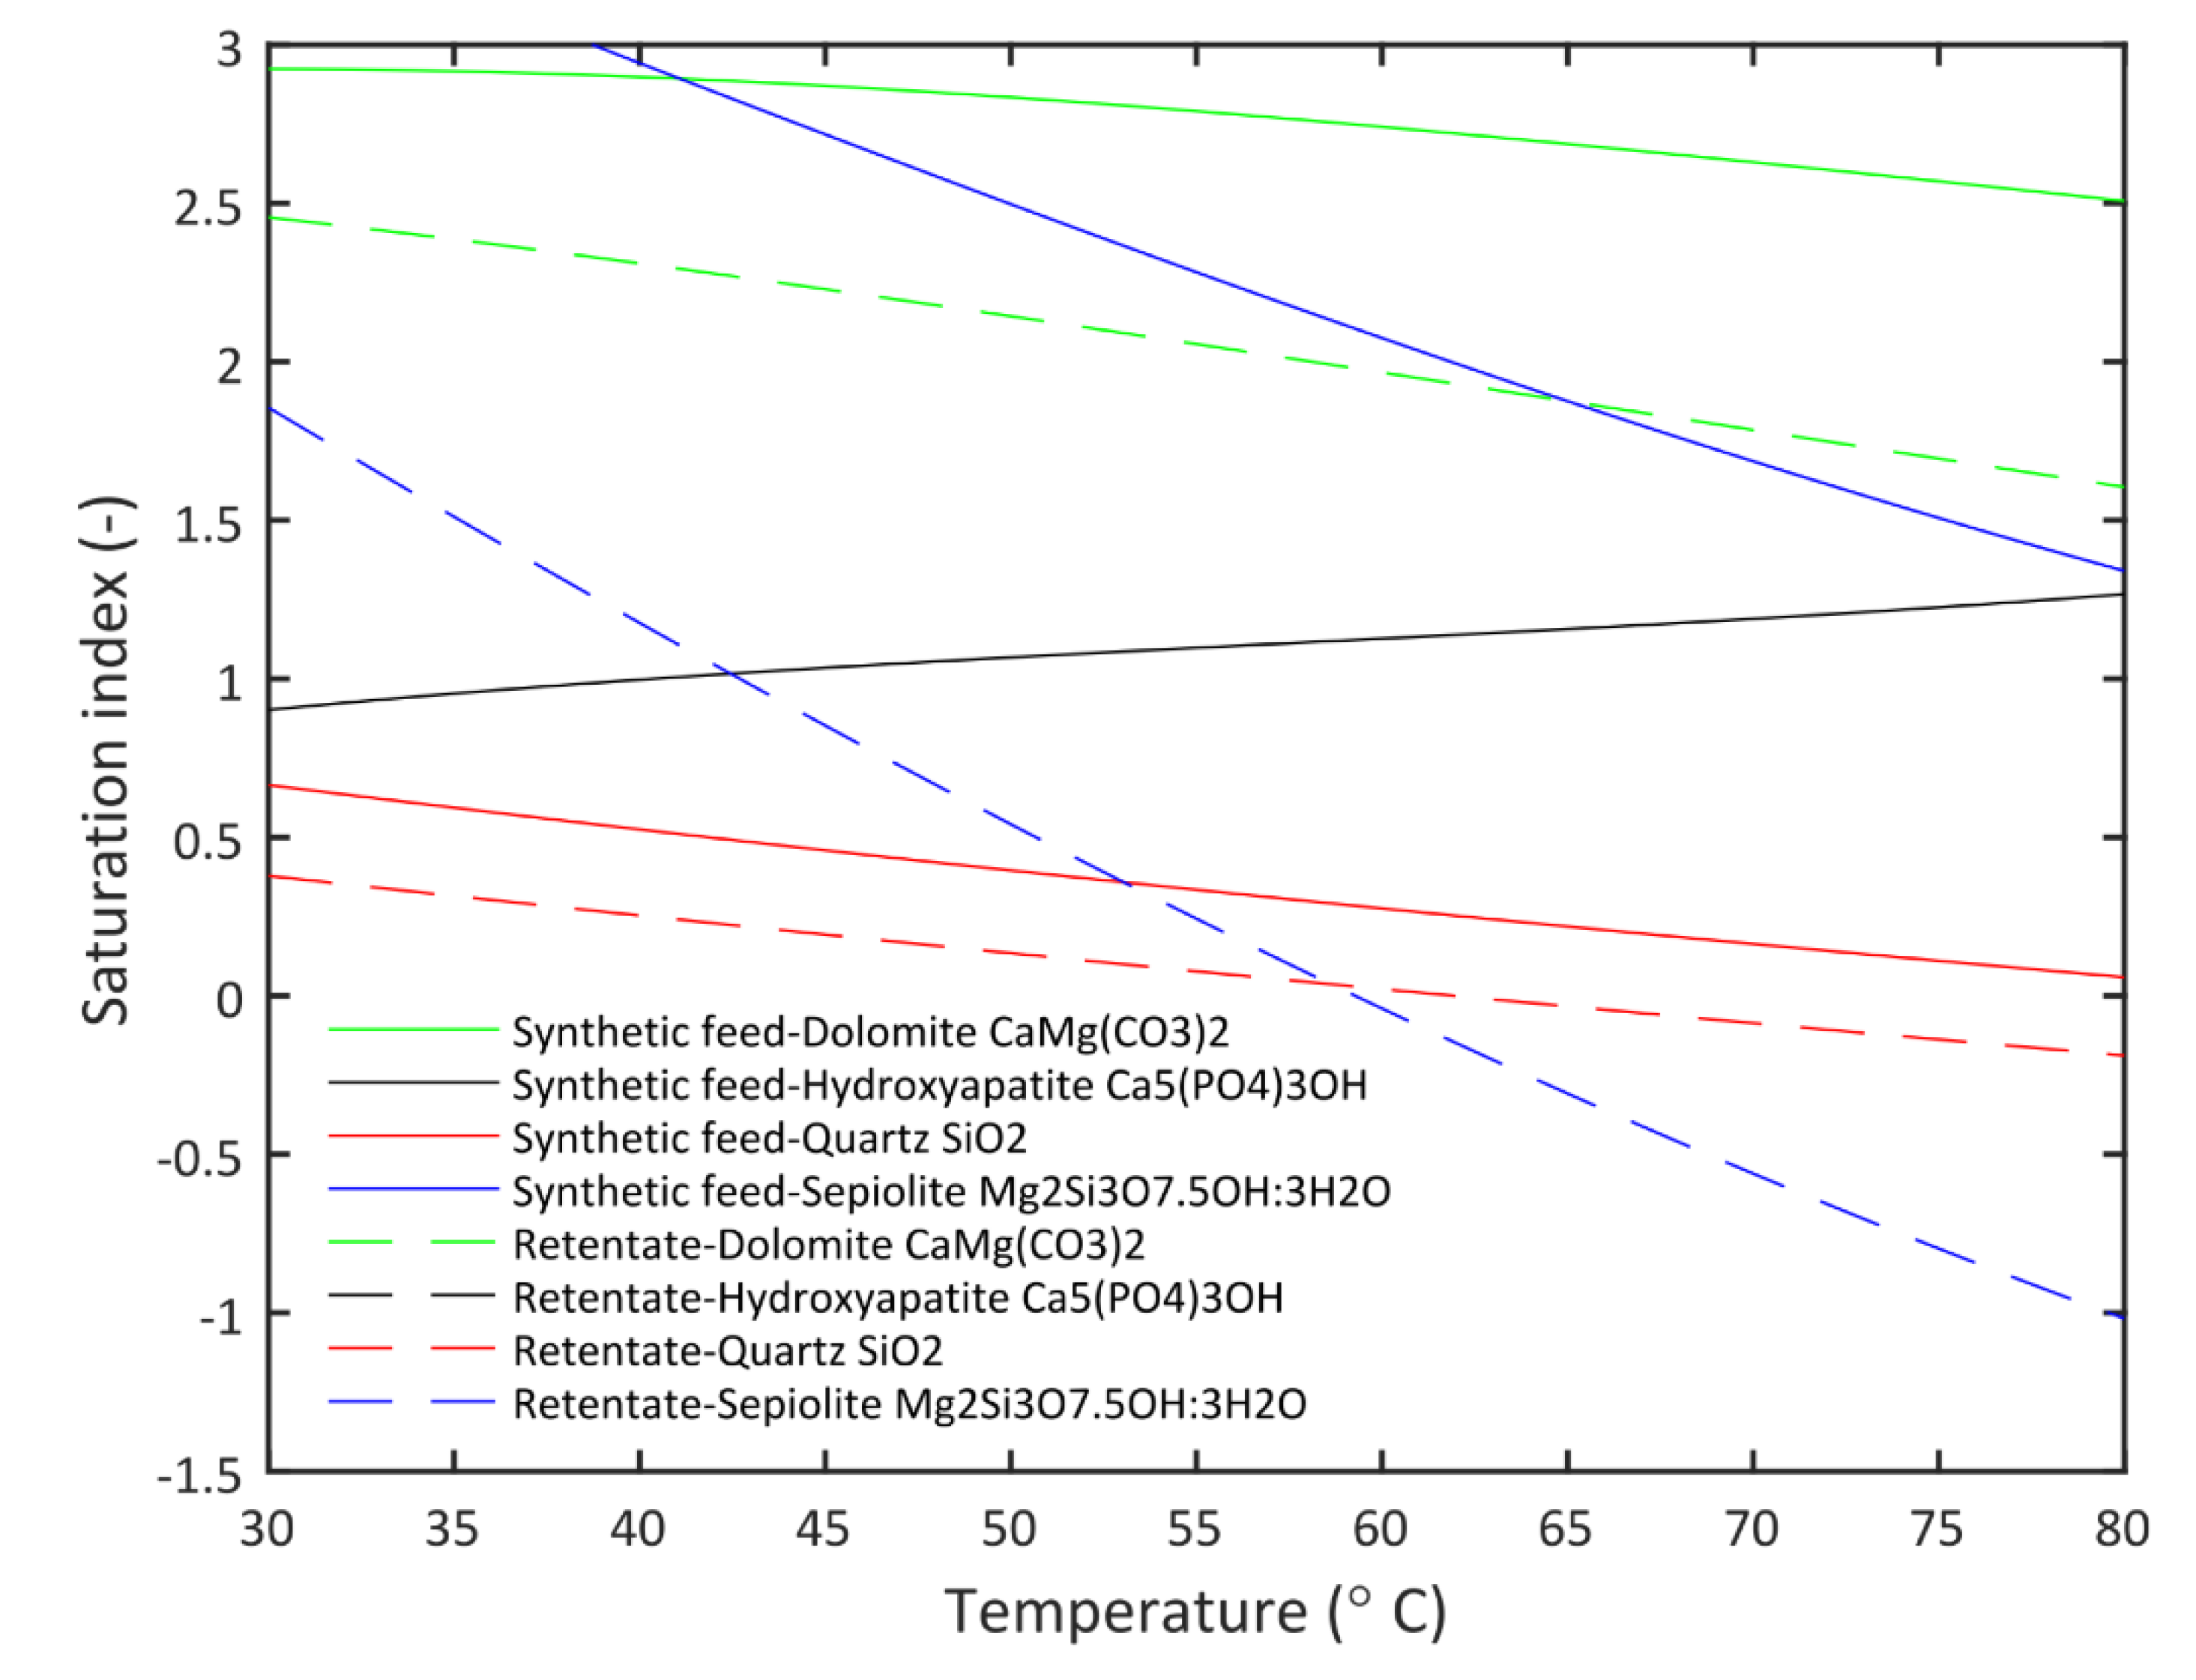
3.3. Saturation Index Analysis
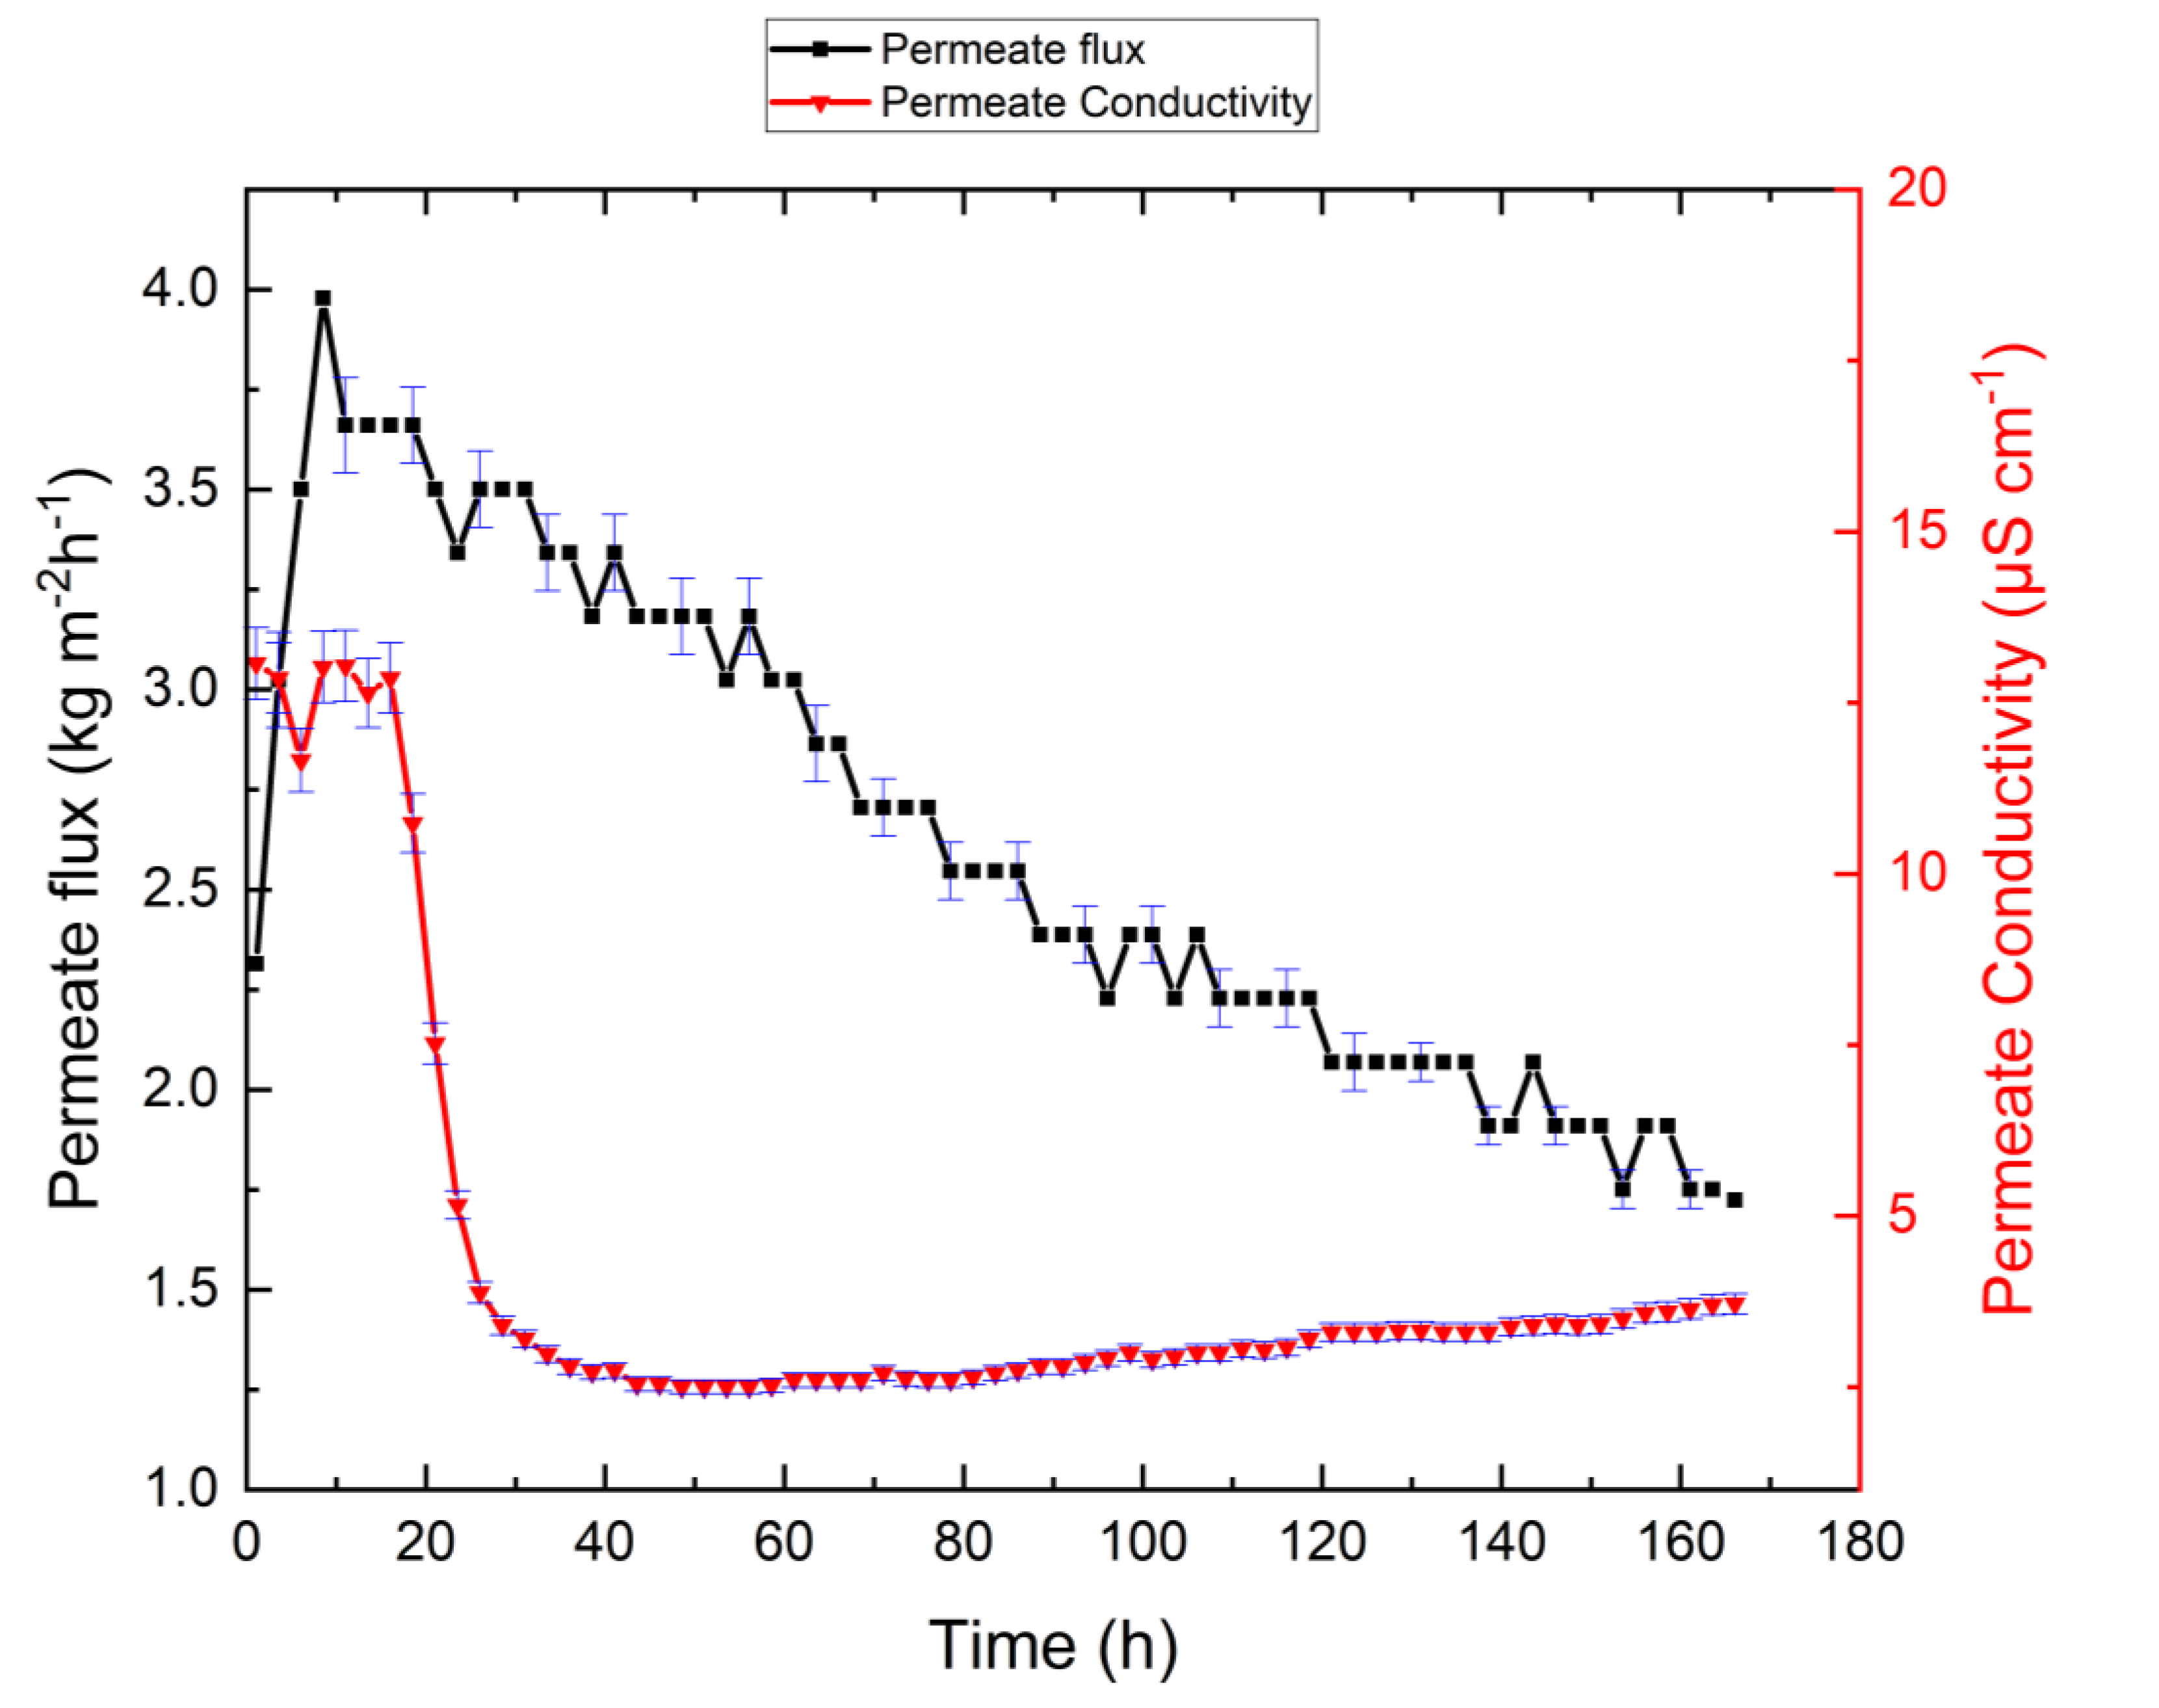
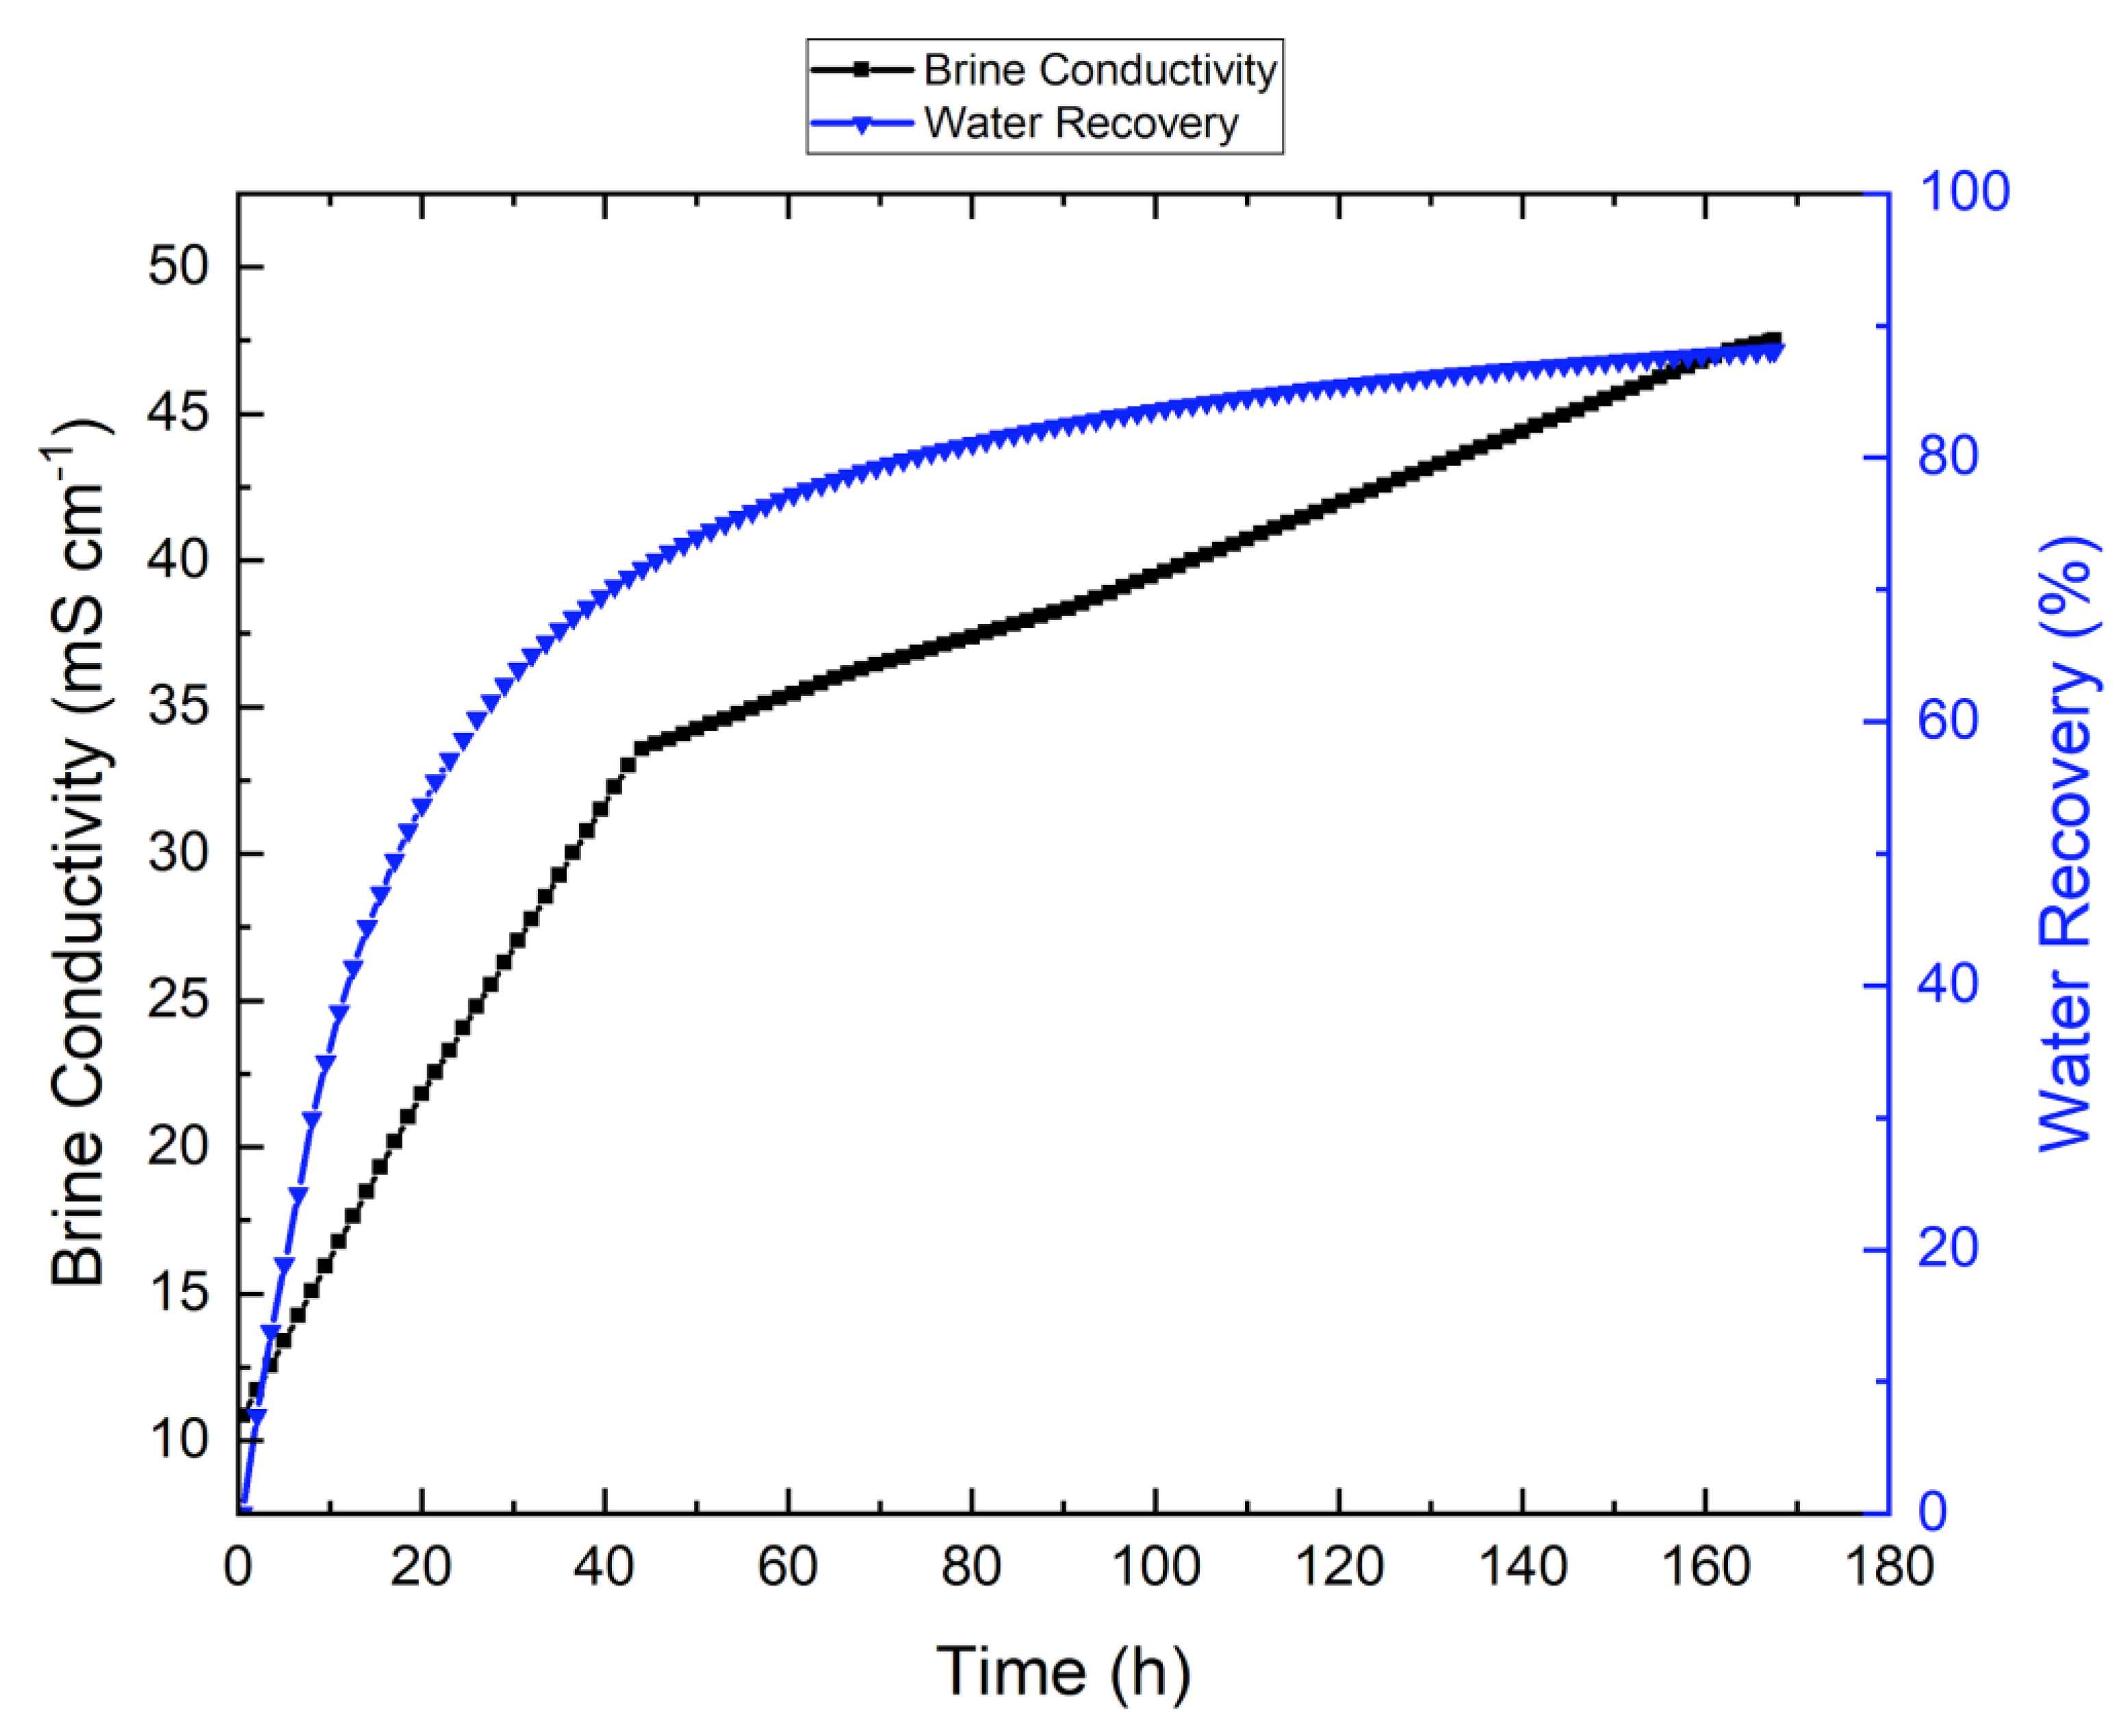
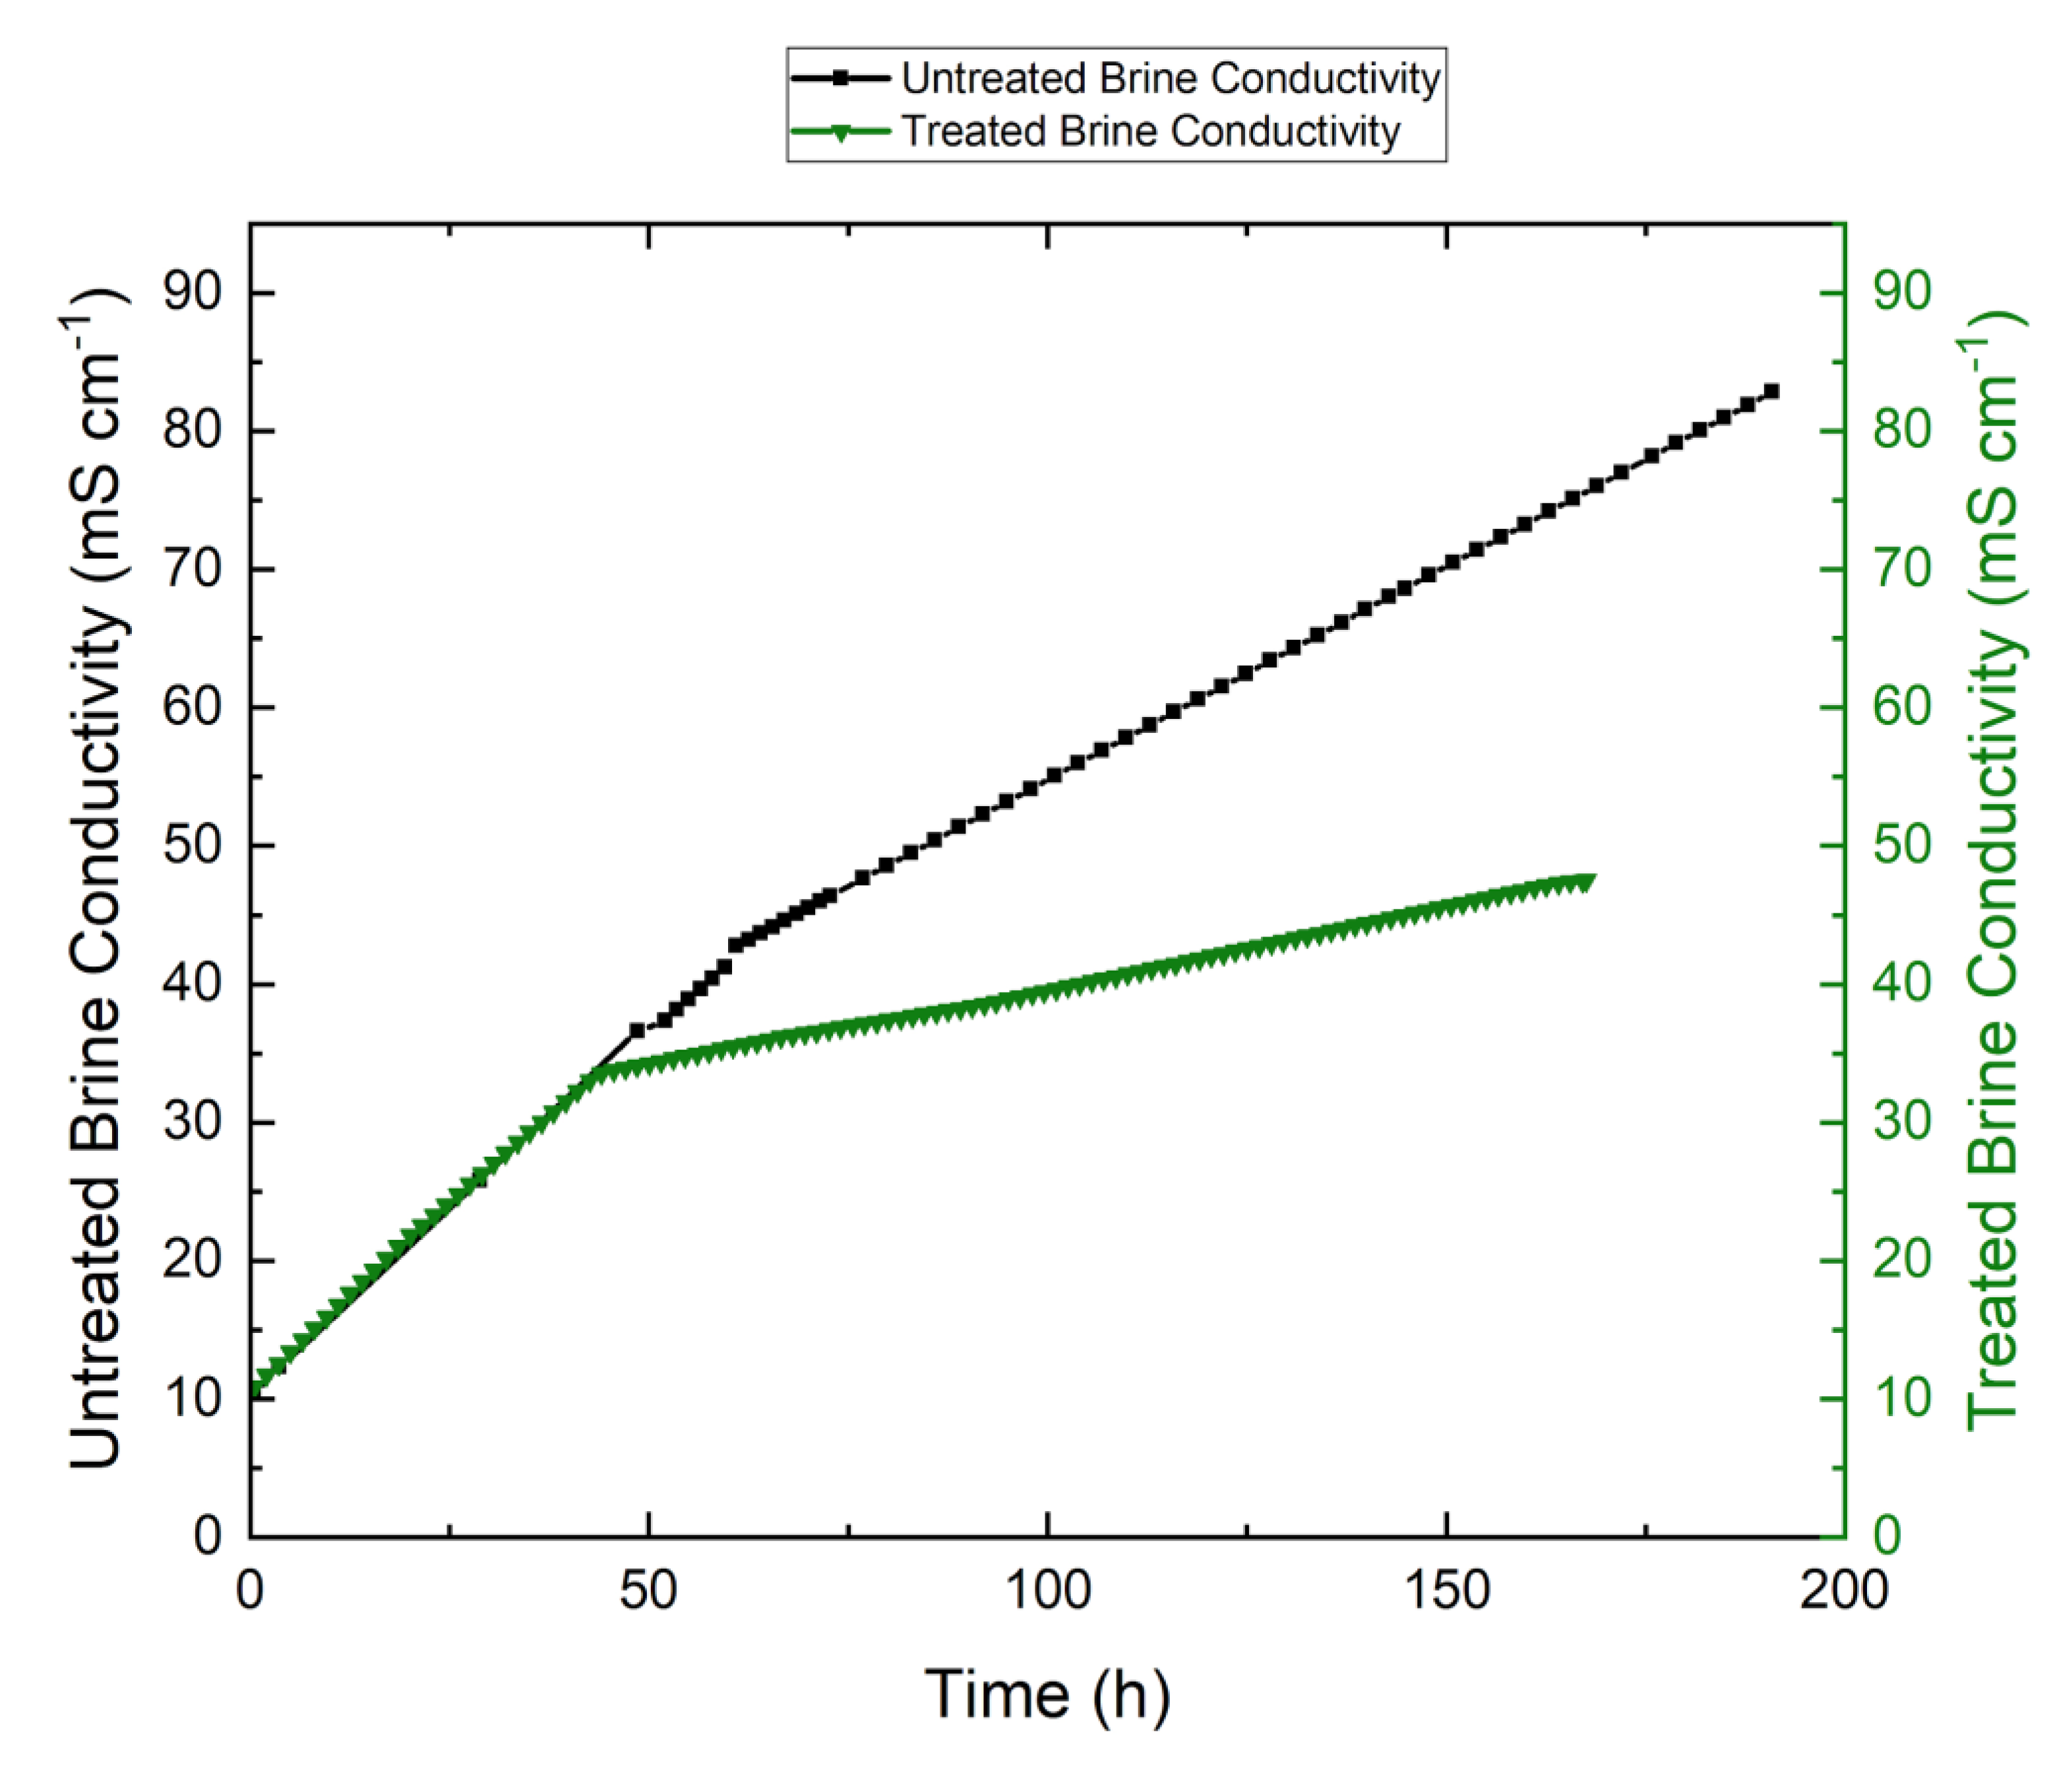
3.4. Effect of Antiscalant on the System
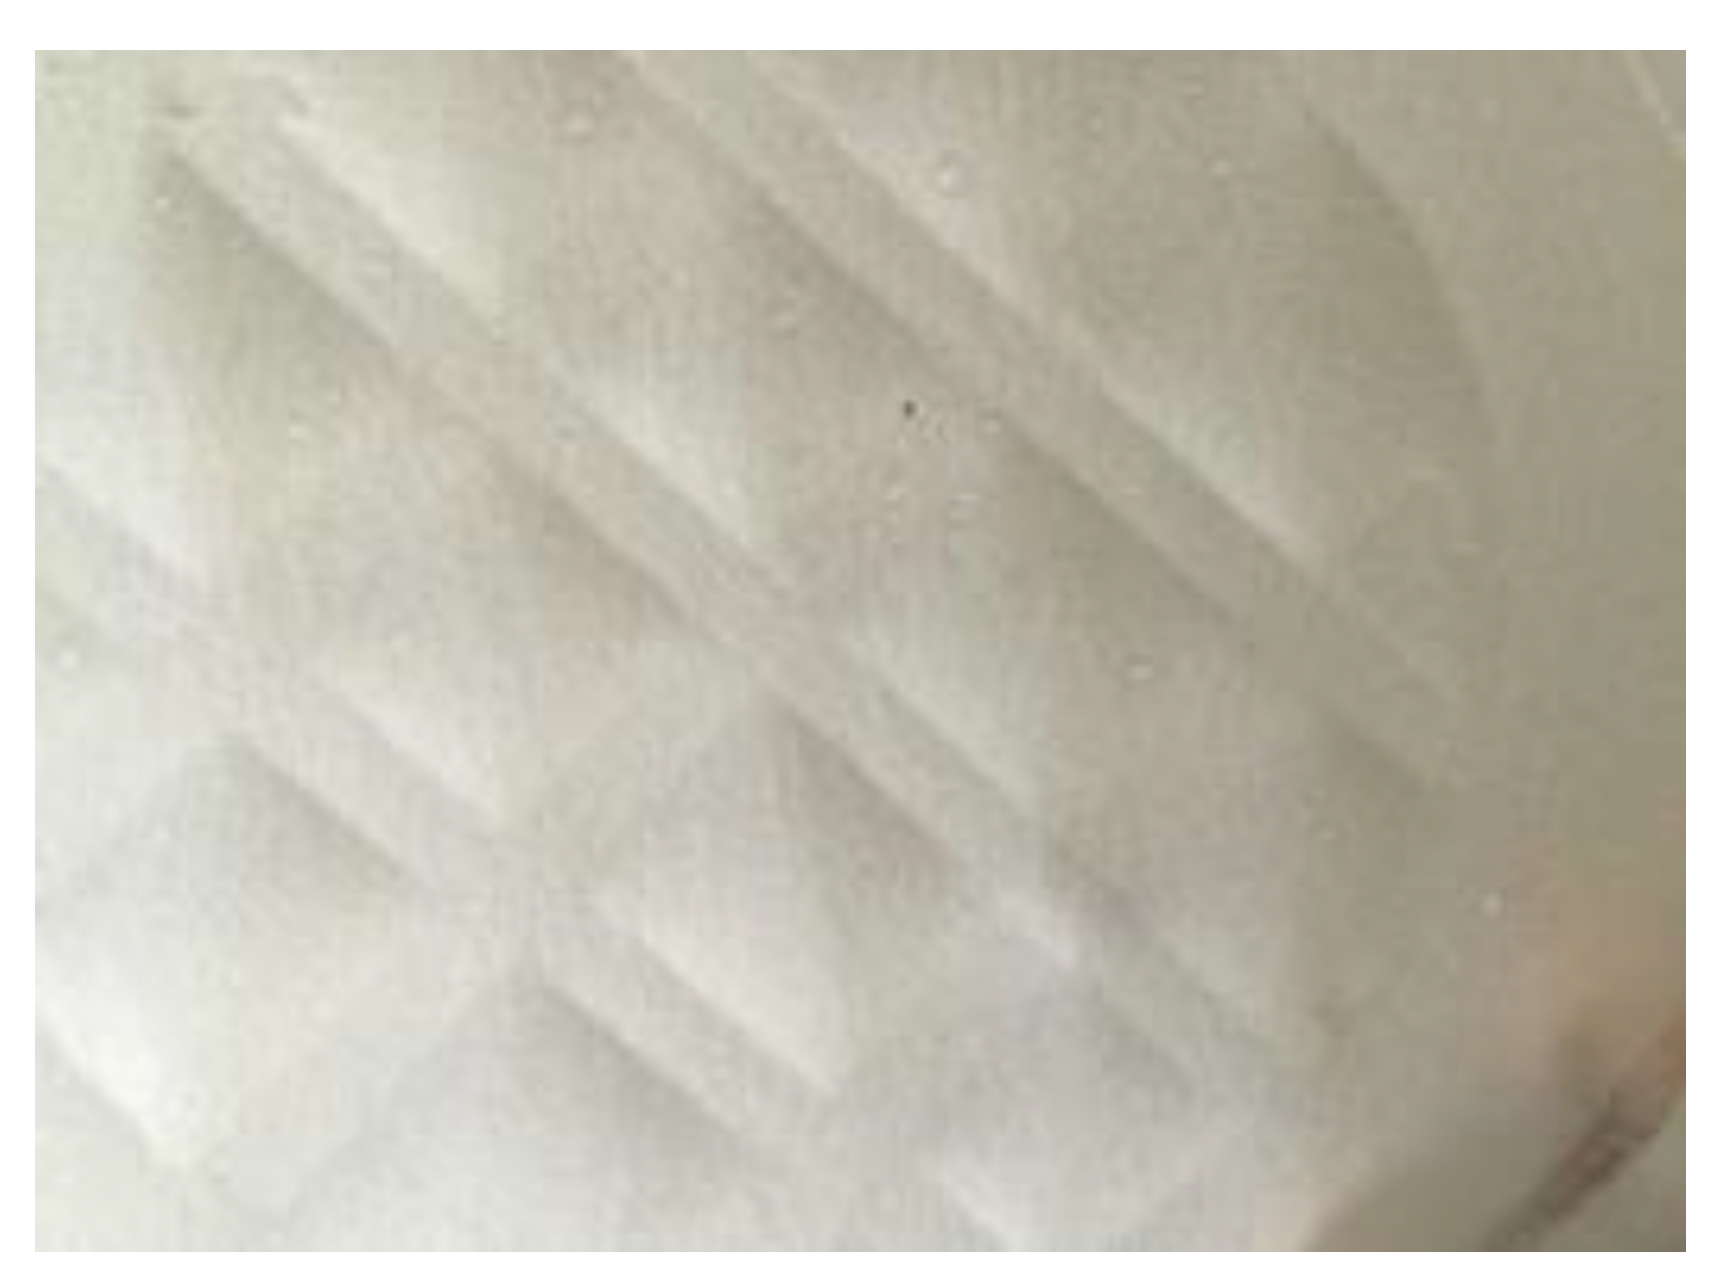
3.5. Effect of Wetting on Membrane Performance
3.6. Effect of Retentate Salinity on Permeate Flux
3.7. Effect of Scaling on Membrane Performance
4. Summary
5. Conclusions
Author Contributions
Funding
Conflicts of Interest
Nomenclature
| f | Concentration factor |
| KSP | Solubility product (molar) |
| LEP | Liquid entry pressure (mbar) |
| MD | Membrane distillation |
| Freshwater vapor pressure (mbar) | |
| Saline water vapor pressure (mbar) | |
| PP | Polypropylene |
| PTFE | Polytetrafluoroethylene |
| RO | Reverse osmosis |
| Absolute salinity (g/kg) | |
| T | Absolute temperature (K) |
| Feed mass under the membrane in the cell | |
| Sum of and the mass of liquid dispensed from the feed tank | |
| VMD | Vacuum Membrane Distillation |
| WR | Water recovery |
Appendix A


References
- Ahmed, M.; Arakel, A.; Hoey, D.; Thumarukudy, M.R.; Goosen, M.F.A.; Al-Haddabi, M.; Al-Belushi, A. Feasibility of salt production from inland RO desalination plant reject brine: A case study. Desalination 2003, 158, 109–117. [Google Scholar] [CrossRef]
- Singh, D.; Sirkar, K.K. Desalination of brine and produced water by direct contact membrane distillation at high temperatures and pressures. J. Memb. Sci. 2012, 389, 380–388. [Google Scholar] [CrossRef]
- Greenlee, L.F.; Lawler, D.F.; Freeman, B.D.; Marrot, B.; Moulin, P. Reverse osmosis desalination: Water sources, technology, and today’s challenges. Water Res. 2009, 43, 2317–2348. [Google Scholar] [CrossRef]
- Warsinger, D.M.; Tow, E.W.; Maswadeh, L.A.; Connors, G.; Swaminathan, J.; Lienhard, J.H. Inorganic fouling mitigation by salinity cycling in batch reverse osmosis. Water Res. 2018. [Google Scholar] [CrossRef]
- Mericq, J.-P.; Laborie, S.; Cabassud, C. Vacuum membrane distillation for an integrated seawater desalination process. Desalin. Water Treat. 2009, 9, 287–296. [Google Scholar] [CrossRef]
- Fritzmann, C.; Löwenberg, J.; Wintgens, T.; Melin, T. State-of-the-art of reverse osmosis desalination. Desalination 2007, 216, 1–76. [Google Scholar] [CrossRef]
- Mohamed, A.M.O.; Maraqa, M.; Al Handhaly, J. Impact of land disposal of reject brine from desalination plants on soil and groundwater. Desalination 2005, 182, 411–433. [Google Scholar] [CrossRef]
- Lattemann, S.; Höpner, T. Environmental impact and impact assessment of seawater desalination. Desalination 2008, 220, 1–15. [Google Scholar] [CrossRef]
- Macedonio, F.; Drioli, E. Pressure-driven membrane operations and membrane distillation technology integration for water purification. Desalination 2008, 223, 396–409. [Google Scholar] [CrossRef]
- Swaminathan, J.; Chung, H.W.; Warsinger, D.M.; Lienhard, V.J.H. Energy efficiency of membrane distillation up to high salinity: Evaluating critical system size and optimal membrane thickness. Appl. Energy 2018, 211, 715–734. [Google Scholar] [CrossRef]
- Warsinger, D.M.; Swaminathan, J.; Morales, L.L.; Lienhard, V.J.H. Comprehensive condensation flow regimes in air gap membrane distillation: Visualization and energy efficiency. J. Memb. Sci. 2018, 555, 517–528. [Google Scholar] [CrossRef]
- Tow, E.W.; Warsinger, D.M.; Trueworthy, A.M.; Swaminathan, J.; Thiel, G.P.; Zubair, S.M.; Myerson, A.S.; Lienhard, V.J.H. Comparison of fouling propensity between reverse osmosis, forward osmosis, and membrane distillation. J. Memb. Sci. 2018, 556, 352–364. [Google Scholar] [CrossRef]
- Ruiz-Aguirre, A.; Andrés-Mañas, J.A.; Zaragoza, G. Evaluation of permeate quality in pilot scale membrane distillation systems. Membranes 2019, 9, 69. [Google Scholar] [CrossRef]
- Al-Furaiji, M.; Arena, J.T.; Ren, J.; Benes, N.; Nijmeijer, A.; Mccutcheon, J.R. Triple-layer nanofiber membranes for treating high salinity brines using direct contact membrane distillation. Membranes 2019, 9, 60. [Google Scholar] [CrossRef]
- Cath, T.Y.; Adams, V.D.; Childress, A.E. Experimental study of desalination using direct contact membrane distillation: A new approach to flux enhancement. J. Memb. Sci. 2004, 228, 5–16. [Google Scholar] [CrossRef]
- Ji, H.; Choi, M.-Y.; Lee, H.-S.; Kim, A.S.; Kim, H.-J. Vacuum membrane distillation for deep seawater: Experiments and theory. Desalin. Water Treat. 2017, 58, 344–350. [Google Scholar] [CrossRef]
- Hu, C.; Yang, Z.; Sun, Q.; Ni, Z.; Yan, G.; Wang, Z. Facile Preparation of a Superhydrophobic iPP Microporous Membrane with Micron-Submicron Hierarchical Structures for Membrane Distillation. Polymers 2020, 12, 962. [Google Scholar] [CrossRef]
- Rao, G.; Hiibel, S.R.; Achilli, A.; Childress, A.E. Factors contributing to flux improvement in vacuum-enhanced direct contact membrane distillation. Desalination 2015, 367, 197–205. [Google Scholar] [CrossRef]
- Martinetti, C.R.; Childress, A.E.; Cath, T.Y. High recovery of concentrated RO brines using forward osmosis and membrane distillation. J. Memb. Sci. 2009, 331, 31–39. [Google Scholar] [CrossRef]
- Ang, W.L.; Mohammad, A.W.; Hilal, N.; Leo, C.P. A review on the applicability of integrated/hybrid membrane processes in water treatment and desalination plants. Desalination 2015, 363, 2–18. [Google Scholar] [CrossRef]
- Chen, G.; Lu, Y.; Krantz, W.B.; Wang, R.; Fane, A.G. Optimization of operating conditions for a continuous membrane distillation crystallization process with zero salty water discharge. J. Memb. Sci. 2014, 450, 1–11. [Google Scholar] [CrossRef]
- Guan, G.; Wang, R.; Wicaksana, F.; Yang, X.; Fane, A.G. Analysis of membrane distillation crystallization system for high salinity brine treatment with zero discharge using Aspen flowsheet simulation. Ind. Eng. Chem. Res. 2012, 51, 13405–13413. [Google Scholar] [CrossRef]
- Zhang, H.; Liu, M.; Sun, D.; Li, B.; Li, P. Evaluation of commercial PTFE membranes for desalination of brine water through vacuum membrane distillation. Chem. Eng. Process. Process. Intensif. 2016, 110, 52–63. [Google Scholar] [CrossRef]
- Duong, H.C.; Gray, S.; Duke, M.; Cath, T.Y.; Nghiem, L.D. Scaling control during membrane distillation of coal seam gas reverse osmosis brine. J. Memb. Sci. 2015, 493, 673–682. [Google Scholar] [CrossRef]
- Duong, H.C.; Cooper, P.; Nelemans, B.; Cath, T.Y.; Nghiem, L.D. Optimising thermal efficiency of direct contact membrane distillation by brine recycling for small-scale seawater desalination. Desalination 2015, 374, 1–9. [Google Scholar] [CrossRef]
- Zou, T.; Kang, G.; Zhou, M.; Li, M.; Cao, Y. Investigation of flux attenuation and crystallization behavior in submerged vacuum membrane distillation (SVMD) for SWRO brine concentration. Chem. Eng. Process. Process Intensif. 2019, 143, 107567. [Google Scholar] [CrossRef]
- Hagedorn, A.; Fieg, G.; Koschikowski, J.; Mann, T.; Hagedorn, A.; Sc, M. Long-term experiences with field experiments on seawater desalination using membrane distillation. In Proceedings of the IDA World Congress on Desalination and Water Reuse, San Diego, CA, USA, September 2015. [Google Scholar]
- Khayet, M.; Essalhi, M.; Qtaishat, M.R.; Matsuura, T. Robust surface modified polyetherimide hollow fiber membrane for long-term desalination by membrane distillation. Desalination 2019, 466, 107–117. [Google Scholar] [CrossRef]
- Ray, S.S.; Lee, H.K.; Kwon, Y.N. Review on blueprint of designing anti-wetting polymeric membrane surfaces for enhanced membrane distillation performance. Polymers 2020, 12, 23. [Google Scholar]
- Gryta, M.; Barancewicz, M. Influence of morphology of PVDF capillary membranes on the performance of direct contact membrane distillation. J. Memb. Sci. 2010, 358, 158–167. [Google Scholar] [CrossRef]
- Shaffer, D.L.; Tousley, M.E.; Elimelech, M. Influence of polyamide membrane surface chemistry on gypsum scaling behavior. J. Memb. Sci. 2017, 525, 249–256. [Google Scholar] [CrossRef]
- Mat Nawi, N.I.; Bilad, M.R.; Zolkhiflee, N.; Nordin, N.A.H.; Lau, W.J.; Narkkun, T.; Faungnawakij, K.; Arahman, N.; Mahlia, T.M.I. Development of A Novel Corrugated Polyvinylidene difluoride Membrane via Improved Imprinting Technique for Membrane Distillation. Polymers 2019, 11, 865. [Google Scholar] [CrossRef] [PubMed]
- Abejón, R.; Saidani, H.; Deratani, A.; Richard, C.; Sánchez-Marcano, J. Concentration of 1,3-dimethyl-2-imidazolidinone in Aqueous Solutions by Sweeping Gas Membrane Distillation: From Bench to Industrial Scale. Membranes 2019, 9, 158. [Google Scholar] [CrossRef] [PubMed]
- Paterson, M.; Kennedy, J.F. Separation processes in the food and biotechnology industries: Principles and applications. Carbohydr. Polym. 1997, 34, 410. [Google Scholar] [CrossRef]
- Andrjesdóttir, Ó.; Ong, C.L.; Nabavi, M.; Paredes, S.; Khalil, A.S.G.; Michel, B.; Poulikakos, D. An experimentally optimized model for heat and mass transfer in direct contact membrane distillation. Int. J. Heat Mass Transf. 2013, 66, 855–867. [Google Scholar] [CrossRef]
- Company, G.E. Aspire (TM) Microfiltration Membranes—Data Sheet; General Electric Company: Mümliswil-Ramiswil, Switzerland, 2013. [Google Scholar]
- Parkhurst, D.L.; Appelo, C.A.J. Description of input and examples for PHREEQC Version 3—A computer program for speciation, batch-reaction, one-dimensional transport, and inverse geochemical calculations. US Geol. Surv. 2013. [Google Scholar] [CrossRef]
- Chesters, S.P.; Armstrong, M.W.; Golding, D.A.; Ostovar, H. Maximising RO recovery using a new antiscalant for high sulphate waters. Desalin. Water Treat. 2011, 25, 143–149. [Google Scholar] [CrossRef]
- Shams El Din, A.M.; El-Dahshan, M.E.; Mohammed, R.A. Inhibition of the thermal decomposition of HCO3− A novel approach to the problem of alkaline scale formation in seawater desalination plants. Desalination 2002, 142, 151–159. [Google Scholar] [CrossRef]
- Gryta, M. Alkaline scaling in the membrane distillation process. Desalination 2008, 228, 128–134. [Google Scholar] [CrossRef]
- El Din, A.M.S.; Mohammed, R.A. Brine and scale chemistry in MSF distillers. Desalination 1994, 99, 73–111. [Google Scholar] [CrossRef]
- Pokrovsky, O.S. Precipitation of calcium and magnesium carbonates from homogeneous supersaturated solutions. J. Cryst. Growth 1998, 186, 233–239. [Google Scholar] [CrossRef]
- Gryta, M. Polyphosphates used for membrane scaling inhibition during water desalination by membrane distillation. Desalination 2012, 285, 170–176. [Google Scholar] [CrossRef]
- Helalizadeh, A.; Müller-Steinhagen, H.; Jamialahmadi, M. Mixed salt crystallisation fouling. Chem. Eng. Process. Process Intensif. 2000, 39, 29–43. [Google Scholar] [CrossRef]
- Karakulski, K.; Gryta, M. Water demineralisation by NF/MD integrated processes. Desalination 2005, 177, 109–119. [Google Scholar] [CrossRef]
- Shirazi, M.M.A.; Kargari, A.; Ismail, A.F.; Matsuura, T. Computational Fluid Dynamic (CFD) opportunities applied to the membrane distillation process: State-of-the-art and perspectives. Desalination 2016, 377, 73–90. [Google Scholar] [CrossRef]
- Khayet, M.; Godino, M.P.; Mengual, J.I. Theoretical and experimental studies on desalination using the sweeping gas membrane distillation method. Desalination 2003, 157, 297–305. [Google Scholar] [CrossRef]
- Banat, F.; Jwaied, N.; Rommel, M.; Koschikowski, J.; Wieghaus, M. Desalination by a “compact SMADES” autonomous solarpowered membrane distillation unit. Desalination 2007, 217, 29–37. [Google Scholar] [CrossRef]
- Banat, F.; Jwaied, N.; Rommel, M.; Koschikowski, J.; Wieghaus, M. Performance evaluation of the “large SMADES” autonomous desalination solar-driven membrane distillation plant in Aqaba, Jordan. Desalination 2007, 217, 17–28. [Google Scholar] [CrossRef]
- Guillen-Burrieza, E.; Mavukkandy, M.O.; Bilad, M.R.; Arafat, H.A. Understanding wetting phenomena in membrane distillation and how operational parameters can affect it. J. Memb. Sci. 2016, 515, 163–174. [Google Scholar] [CrossRef]
- Arvidson, R.S. The dolomite problem; control of precipitation kinetics by temperature and saturation state. Am. J. Sci. 1999, 299, 257–288. [Google Scholar] [CrossRef]
- Gilron, J.; Ladizansky, Y.; Korin, E. Silica fouling in direct contact membrane distillation. Ind. Eng. Chem. Res. 2013, 52, 10521–10529. [Google Scholar] [CrossRef]
- Andrés-Mañas, J.A.; Ruiz-Aguirre, A.; Acién, F.G.; Zaragoza, G. Assessment of a pilot system for seawater desalination based on vacuum multi-effect membrane distillation with enhanced heat recovery. Desalination 2018, 443, 110–121. [Google Scholar] [CrossRef]
- Warsinger, D.M.; Servi, A.; Van Belleghem, S.; Gonzalez, J.; Swaminathan, J.; Kharraz, J.; Chung, H.W.; Arafat, H.A.; Gleason, K.K.; Lienhard, V.J.H. Combining air recharging and membrane superhydrophobicity for fouling prevention in membrane distillation. J. Memb. Sci. 2016, 505, 241–252. [Google Scholar] [CrossRef]
- Servi, A.T.; Guillen-Burrieza, E.; Warsinger, D.M.; Livernois, W.; Notarangelo, K.; Kharraz, J.; Lienhard, V.J.H.; Arafat, H.A.; Gleason, K.K.; Lienhard, J.H.; et al. The effects of iCVD film thickness and conformality on the permeability and wetting of MD membranes. J. Memb. Sci. 2016, 523, 470–479. [Google Scholar] [CrossRef]
- Gryta, M. Fouling in direct contact membrane distillation process. J. Memb. Sci. 2008, 325, 383–394. [Google Scholar] [CrossRef]
- Rezaei, M.; Warsinger, D.M.; Lienhard, V.J.H.; Samhaber, W.M. Wetting prevention in membrane distillation through superhydrophobicity and recharging an air layer on the membrane surface. J. Memb. Sci. 2017, 530, 42–52. [Google Scholar] [CrossRef]
- Smolders, K.; Franken, A.C.M. Terminology for Membrane Distillation. Desalination 1989, 72, 249–262. [Google Scholar] [CrossRef]
- Rezaei, M.; Warsinger, D.M.; Lienhard, V.J.H.; Duke, M.; Matsuura, T.; Samhaber, W.M. Wetting phenomenon in membrane distillation: Mechanisms, reversal, and prevention. Water Res. 2018. [Google Scholar] [CrossRef]
- Rezaei, M.; Samhaber, W.M. Wetting Behaviour of Superhydrophobic Membranes Coated with Nanoparticles in Membrane Distillation. Chem. Eng. Trans. 2016, 47, 373–378. [Google Scholar] [CrossRef]
- Sharqaway, M.H.; Lienhard, V.J.H.; Subair, S. Thermophysical Properties of Seawater: A Review of Existing Correlations and Data, Desalination and Water Treatment, Appendix. Desalin. Water Treat. 2010, 1–17. [Google Scholar] [CrossRef]
- Harvey, A.H.; Lemmon, E.W. NIST/ASME Steam Properties—STEAM User’s Guide. 2013. Available online: https://www.nist.gov/system/files/documents/srd/STEAM30-2.pdf (accessed on 28 August 2019).
- Pangarkar, B.L.; Sane, M.G.; Parjane, S.B.; Guddad, M. Vacuum Membrane Distillation for Desalination of Ground Water by using Flat Sheet Membrane. Int. J. Chem. Biol. Eng. 2011, 51, 13–18. [Google Scholar] [CrossRef]
- Lewis, E.L.; Perkin, R.G. The practical salinity scale 1978: Conversion of existing data. Deep Sea Res. Part A Oceanogr. Res. Pap. 1981, 28, 307–328. [Google Scholar] [CrossRef]
- IOC; SCOR; IAPSO. The International Thermodynamic Equation Of Seawater 2010 (TEOS-10): Calculation and Use of Thermodynamic Properties; UNESCO: Paris, France, 2010. [Google Scholar]
- Warsinger, D.M.; Servi, A.; Connors, G.B.; Mavukkandy, M.O.; Arafat, H.A.; Gleason, K.K.; Lienhard, J.H. Reversing membrane wetting in membrane distillation: Comparing dryout to backwashing with pressurized air. Environ. Sci. Water Res. Technol. 2017, 3, 930–939. [Google Scholar] [CrossRef]
- Warsinger, D.M.; Tow, E.W.; Swaminathan, J.; Lienhard, J.H.; Lienhard, V.J.H. Theoretical framework for predicting inorganic fouling in membrane distillation and experimental validation with calcium sulfate. J. Memb. Sci. 2017, 528, 381–390. [Google Scholar] [CrossRef]
- Sanmartino, J.A.; Khayet, M.; García-Payo, M.C.; El Bakouri, H.; Riaza, A. Desalination and concentration of saline aqueous solutions up to supersaturation by air gap membrane distillation and crystallization fouling. Desalination 2016, 393, 39–51. [Google Scholar] [CrossRef]
- Julian, H.; Ye, Y.; Li, H.; Chen, V. Scaling mitigation in submerged vacuum membrane distillation and crystallization (VMDC) with periodic air-backwash. J. Memb. Sci. 2018, 547, 19–33. [Google Scholar] [CrossRef]


| Substance | Molar Mass | g/m3 Tap Water | Added to Tap Water (g/m3) | Solution (g/m3) |
|---|---|---|---|---|
| Al2(SO4)3 | 342.13588 | - | 2 | 2 |
| BaCl2 | 208.236 | - | 0.45 | 0.45 |
| CaCl2 | 110.9864 | 285 | 286 | 571 |
| FeCl3 | 162.206 | - | 0.35 | 0.35 |
| HCL | 36.4609 | - | 750 | 750 |
| KCl | 74.5513 | 8.3 | 79.3 | 87.6 |
| MgCl2 | 95.211 | 105 | 95 | 200 |
| NaCl | 58.44277 | - | 2200 | 2200 |
| Na2CO3 | 105.98874 | 60 | 1927 | 1987 |
| NaF | 41.988173 | - | 4.5 | 4.5 |
| NaNO3 | 84.99467 | 31.8 | 550.2 | 582 |
| Na2SO4 | 142.03714 | 41.8 | 1244.2 | 1286 |
| Na3PO4 | 163.94067 | - | 5.8 | 5.8 |
| MnCl2 | 125.844 | - | 0.1 | 0.1 |
| SrCl2 | 158.526 | - | 4.7 | 4.7 |
| Na2SiO3 | 122.06324 | - | 250 | 250 |
| Physical Parameters | Results | Unit |
|---|---|---|
| pH value | 8.9 | - |
| electrical conductivity | 10,110 | µs/cm |
| Chemical parameters | ||
| bicarbonate | 858 | mg/L |
| calcium (Ca) | 17.4 | mg/L |
| magnesium (Mg) | 48.9 | mg/L |
| nitrate | 357 | mg/L |
| nitrite | 0.03 | mg/L |
| chloride () | 2470 | mg/L |
| sulfate | 1130 | mg/L |
| iron (Fe) | 0.03 | mg/L |
| manganese (Mn) | 0.01 | mg/L |
| aluminum (Al) | 0.05 | mg/L |
| sodium (Na) | 2430 | mg/L |
| potassium (K) | 62.7 | mg/L |
| Inorganic trace constituents | ||
| orthophosphate | 0.35 | mg/L |
| fluoride | 2 | mg/L |
| Elements (metals and semimetals) | ||
| barium (Ba) | 54 | µg/L |
| silicon (calculated as SiO2) | 40.4 | mg/L |
| strontium (Sr) | 862.1 | µg/L |
| Physical Parameters | Results | Unit |
|---|---|---|
| pH value | 9.12 | - |
| electrical conductivity | 81,900 | µs/cm |
| Chemical parameters | ||
| bicarbonate | 6750 | mg/L |
| calcium (Ca) | 1.7 | mg/L |
| magnesium (Mg) | 18.2 | mg/L |
| nitrate | 4150 | mg/L |
| nitrite | 0.7 | mg/L |
| chloride () | 28,700 | mg/L |
| sulfate | 13,100 | mg/L |
| iron (Fe) | <0.03 | mg/L |
| manganese (Mn) | <0.01 | mg/L |
| aluminum (Al) | <0.05 | mg/L |
| sodium (Na) | 28,900 | mg/L |
| potassium (K) | 784 | mg/L |
| Inorganic trace constituents | ||
| orthophosphate | 0.97 | mg/L |
| fluoride | 3.7 | mg/L |
| Elements (metals and semimetals) | ||
| barium (Ba) | 30.3 | µg/L |
| silicon (calculated as SiO2) | 14.9 | mg/L |
| strontium (Sr) | 161.2 | µg/L |
| Physical Parameters | Results | Unit |
|---|---|---|
| pH value | 7.47 | |
| electrical conductivity | 560 | µs/cm |
| Chemical parameters | ||
| bicarbonate | 33.4 | mg/L |
| calcium (Ca) | <1 | mg/L |
| magnesium (Mg) | 1.7 | mg/L |
| nitrate | 17.3 | mg/L |
| nitrite | 0.038 | mg/L |
| chloride () | 116 | mg/L |
| sulfate | 53.7 | mg/L |
| iron (Fe) | 0.03 | mg/L |
| manganese (Mn) | 0.01 | mg/L |
| aluminum (Al) | 0.05 | mg/L |
| sodium (Na) | 117 | mg/L |
| potassium (K) | 2.8 | mg/L |
| Inorganic trace constituents | ||
| orthophosphate | <0.02 | mg/L |
| fluoride | 0.28 | mg/L |
| Elements (metals and semimetals) | ||
| barium (Ba) | <20 | µg/L |
| silicon (calculated as SiO2) | 1.4 | mg/L |
| strontium (Sr) | 20.8 | µg/L |
| Parameters | Linz Water | NaCl Solution | Feed without Antiscalant | Feed with Antiscalant | Units |
|---|---|---|---|---|---|
| Permeate flux reduction | 0 | 0 | 44% | 60% | - |
| Initial permeate electrical conductivity | 2.8 | 6.76 | 10.0 | 14.7 | µS/cm |
| Final permeate electrical conductivity | 2 | 35.4 | 4.7 | 3.7 | µS/cm |
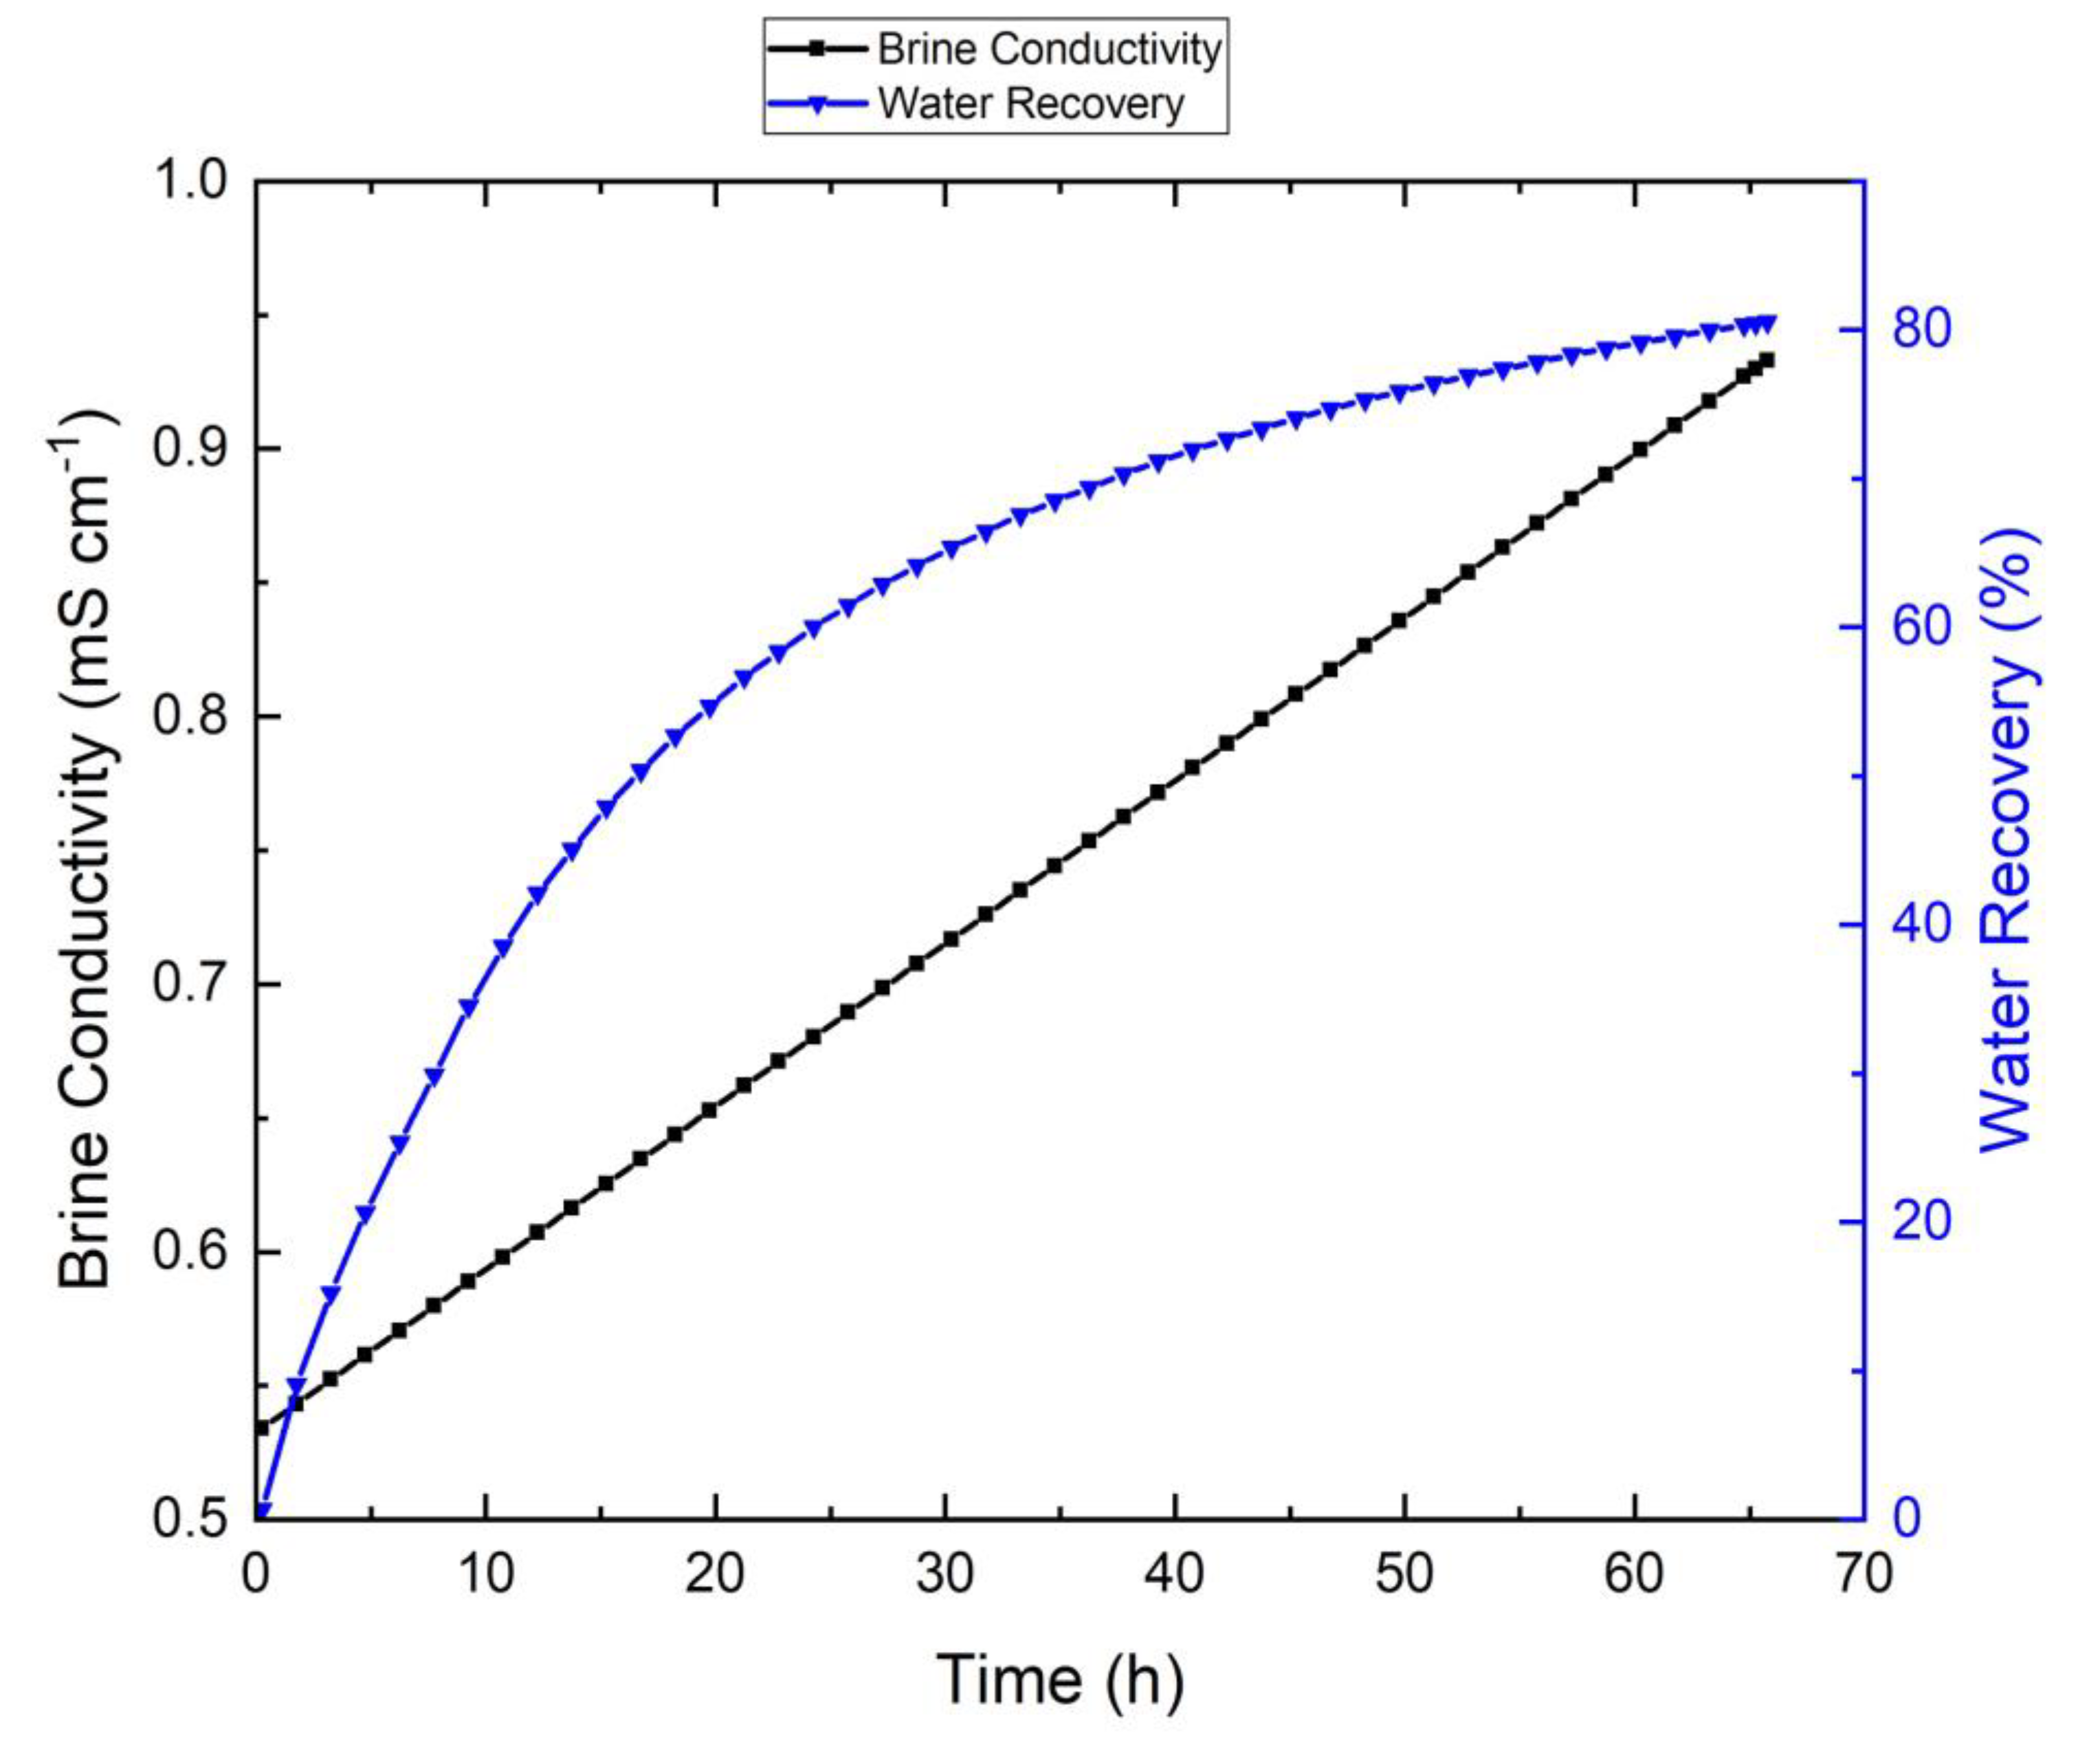
| Initial brine electrical conductivity | 534 | 10,000 | 10,100 | 9470 | µS/cm |
| Final brine electrical conductivity | 933 | 31,000 | 86,600 | 47,500 | µS/cm |
| Recovery | 81% | 70% | 91% | 88% | - |
| Operational time | 65 | 45 | 192 | 167 | h |
© 2020 by the authors. Licensee MDPI, Basel, Switzerland. This article is an open access article distributed under the terms and conditions of the Creative Commons Attribution (CC BY) license (http://creativecommons.org/licenses/by/4.0/).
Share and Cite
Rezaei, M.; Alsaati, A.; Warsinger, D.M.; Hell, F.; Samhaber, W.M. Long-Running Comparison of Feed-Water Scaling in Membrane Distillation. Membranes 2020, 10, 173. https://doi.org/10.3390/membranes10080173
Rezaei M, Alsaati A, Warsinger DM, Hell F, Samhaber WM. Long-Running Comparison of Feed-Water Scaling in Membrane Distillation. Membranes. 2020; 10(8):173. https://doi.org/10.3390/membranes10080173
Chicago/Turabian StyleRezaei, Mohammad, Albraa Alsaati, David M. Warsinger, Florian Hell, and Wolfgang M. Samhaber. 2020. "Long-Running Comparison of Feed-Water Scaling in Membrane Distillation" Membranes 10, no. 8: 173. https://doi.org/10.3390/membranes10080173
APA StyleRezaei, M., Alsaati, A., Warsinger, D. M., Hell, F., & Samhaber, W. M. (2020). Long-Running Comparison of Feed-Water Scaling in Membrane Distillation. Membranes, 10(8), 173. https://doi.org/10.3390/membranes10080173