The Influence of Graphene Addition on the Properties of Composite rGO/PAN Membranes and Their Potential Application for Water Disinfection

 , , and
Abstract

1. Introduction
2. Experimental
2.1. Materials
2.2. Synthesizing Graphene Oxide (GO) and Reduced Graphene Oxide (rGO)
2.3. Forming PAN Membranes
2.4. Forming GO/PAN Membranes
2.5. General Characterization
2.6. Transport Properties
2.7. Rejection Measurements
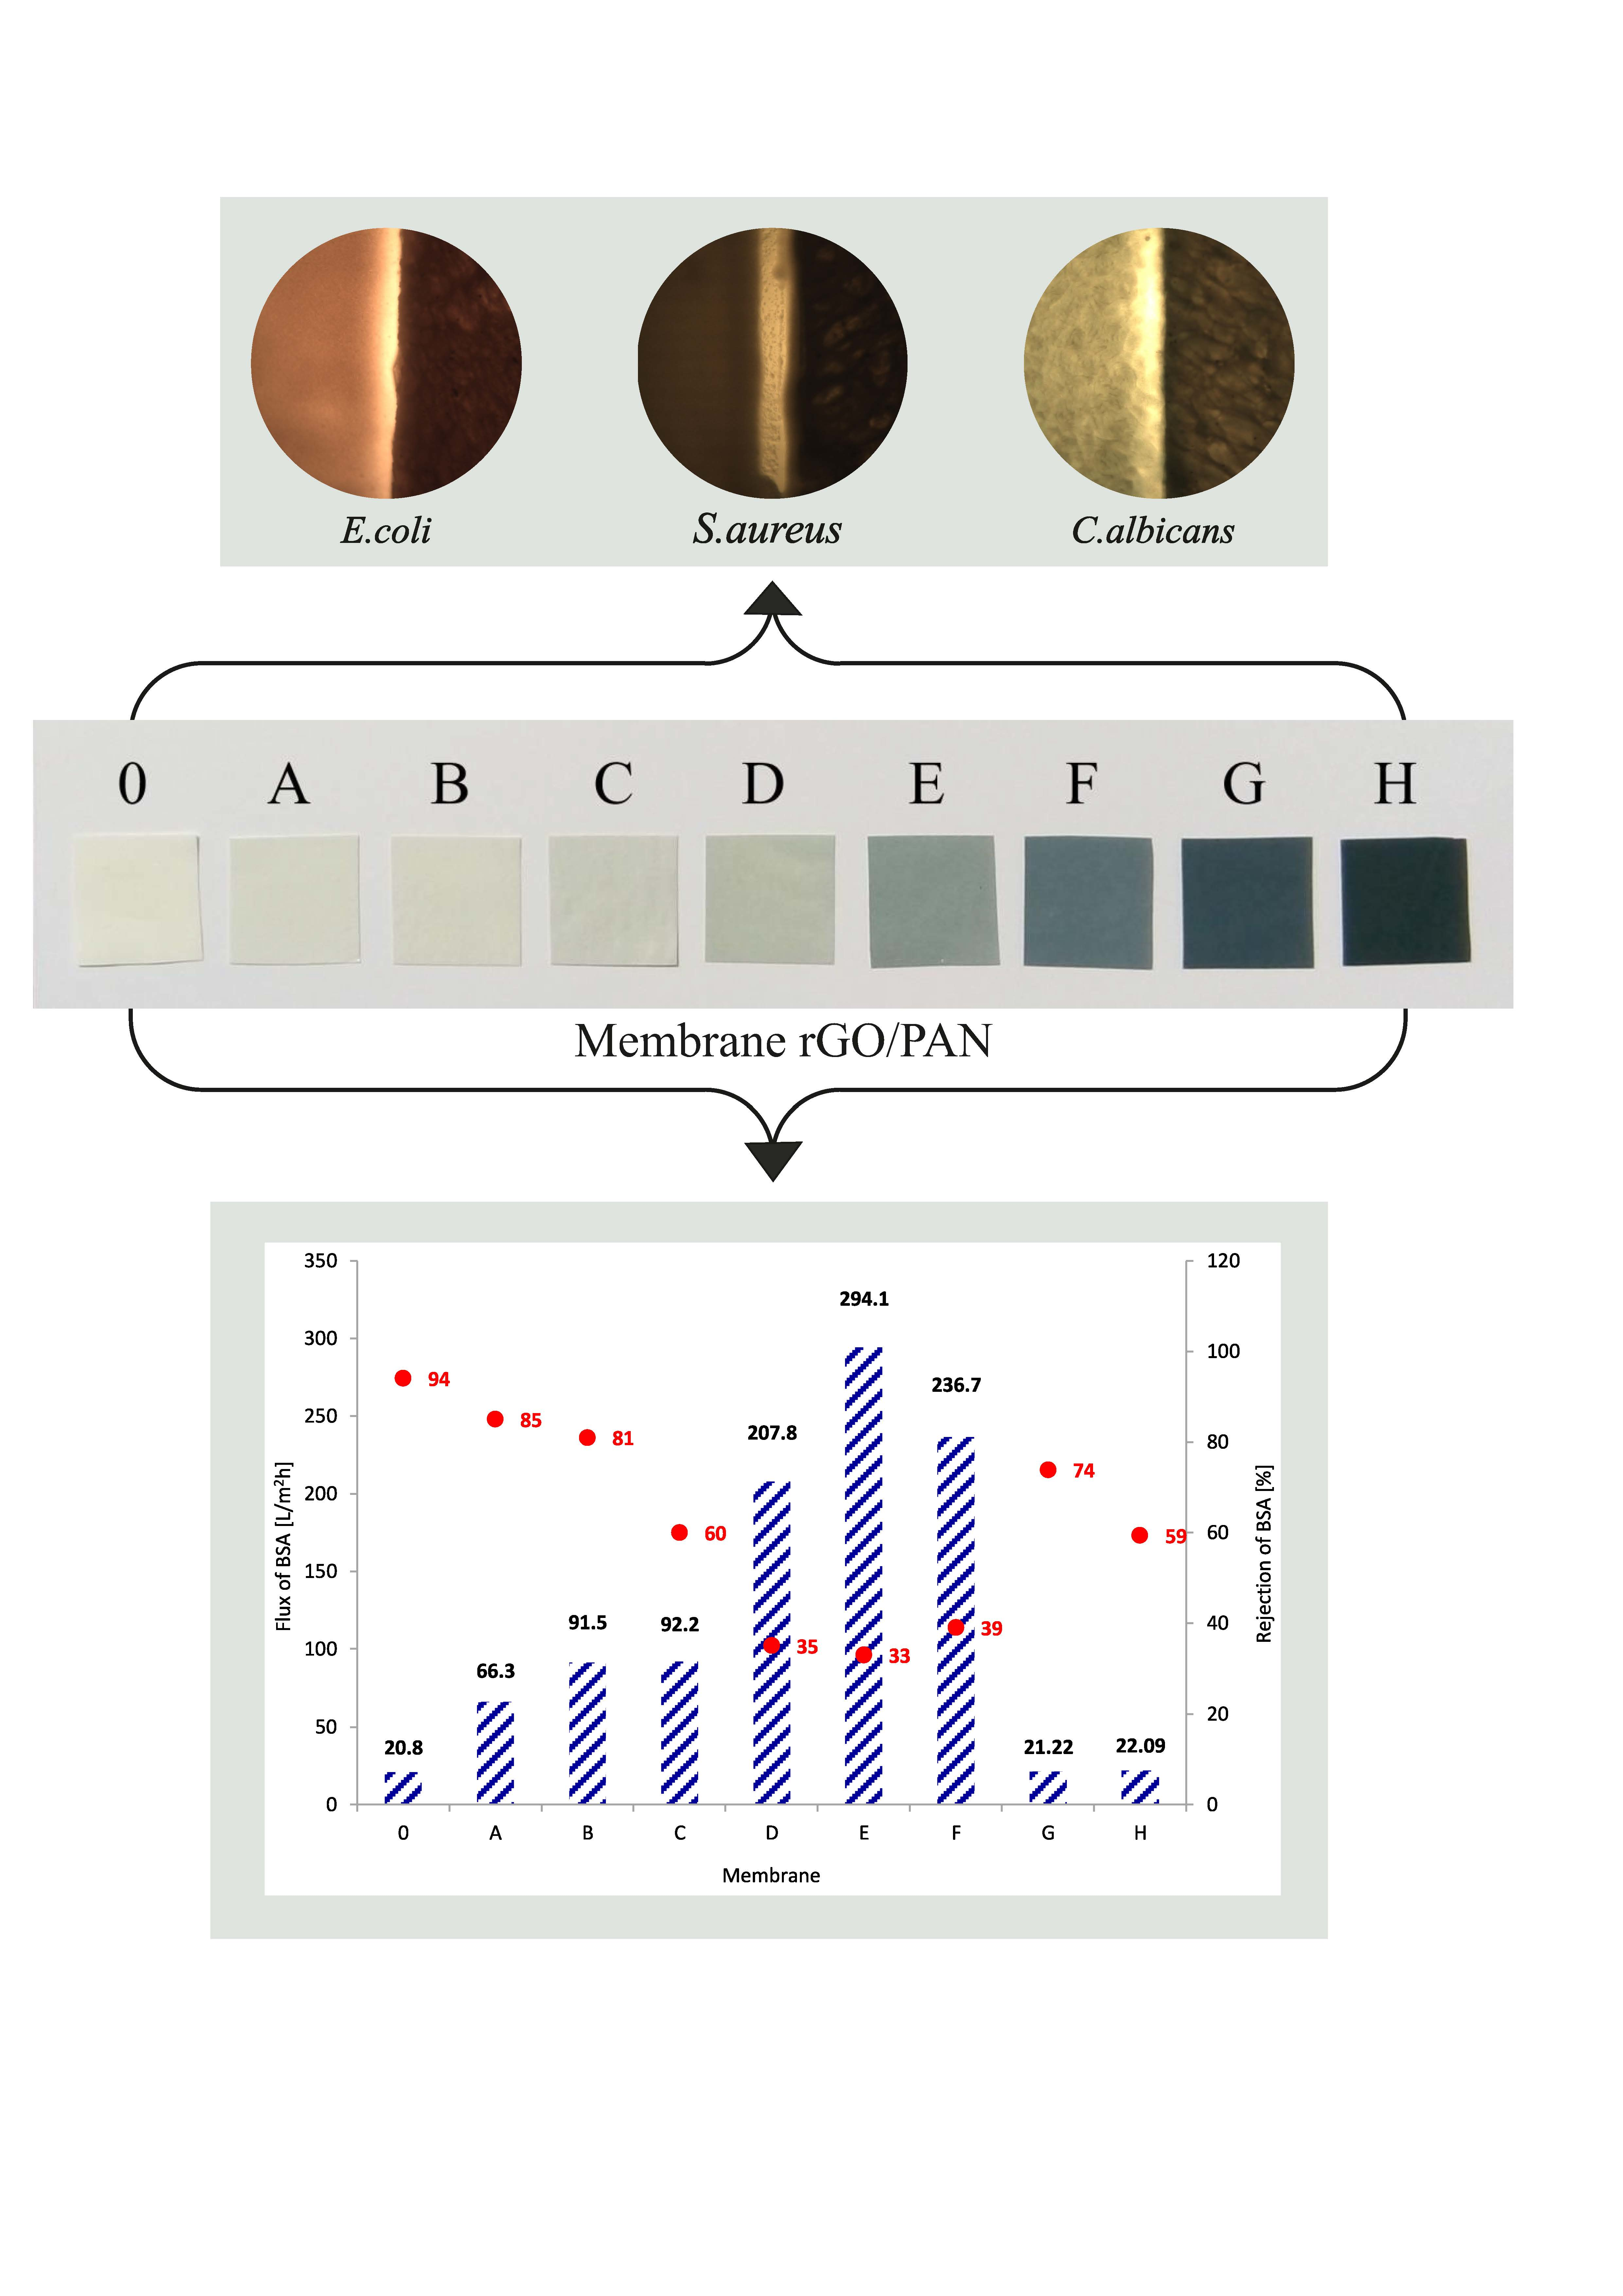
2.8. Microbiological Analysis
2.9. Analytical Methods
3. Results and Discussion
3.1. Characteristics of rGO
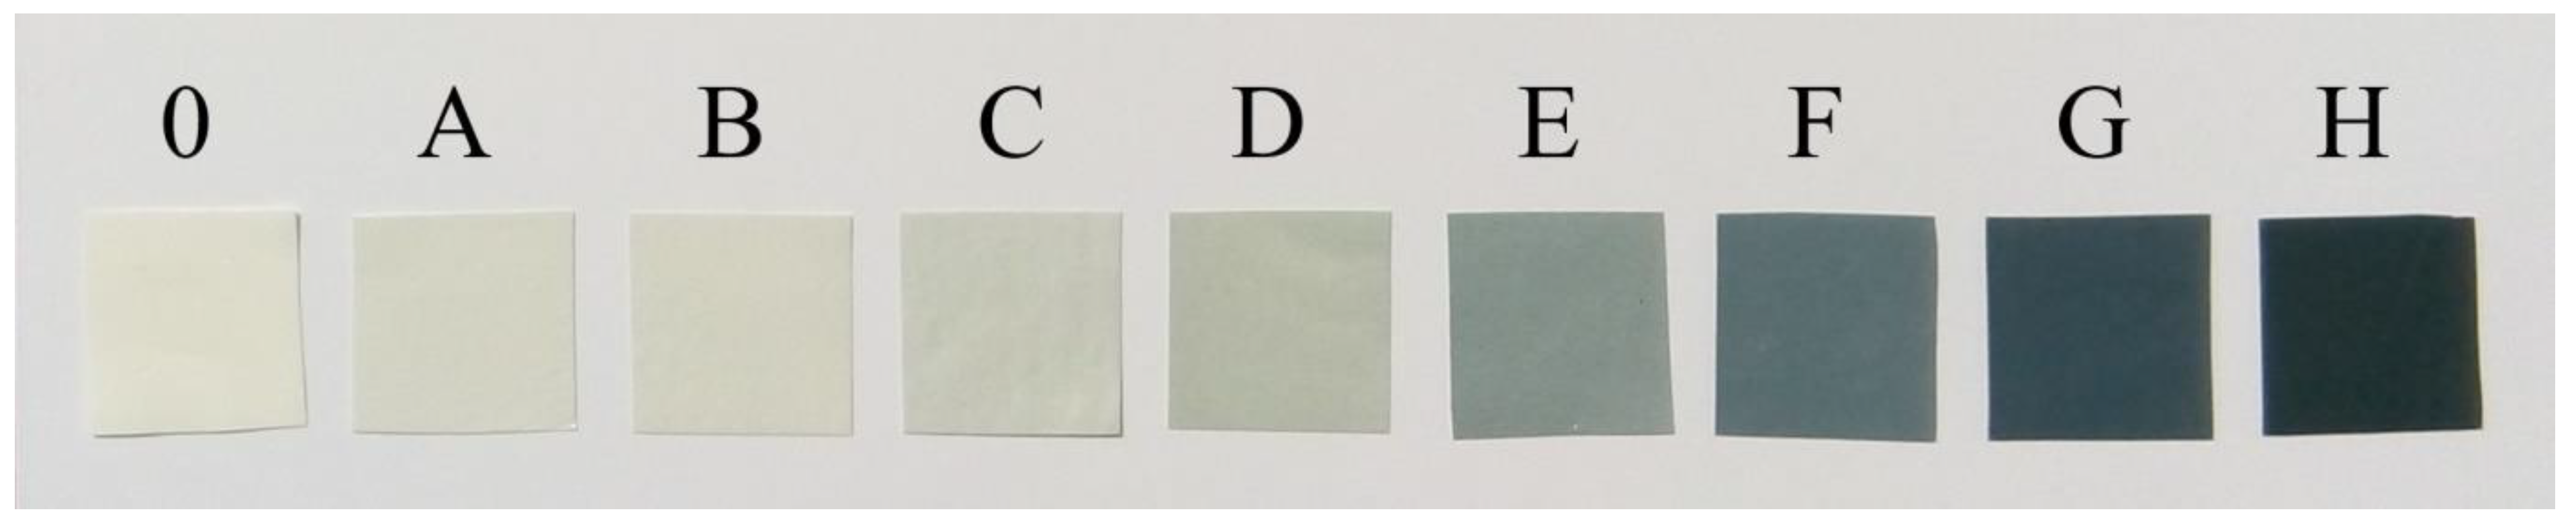
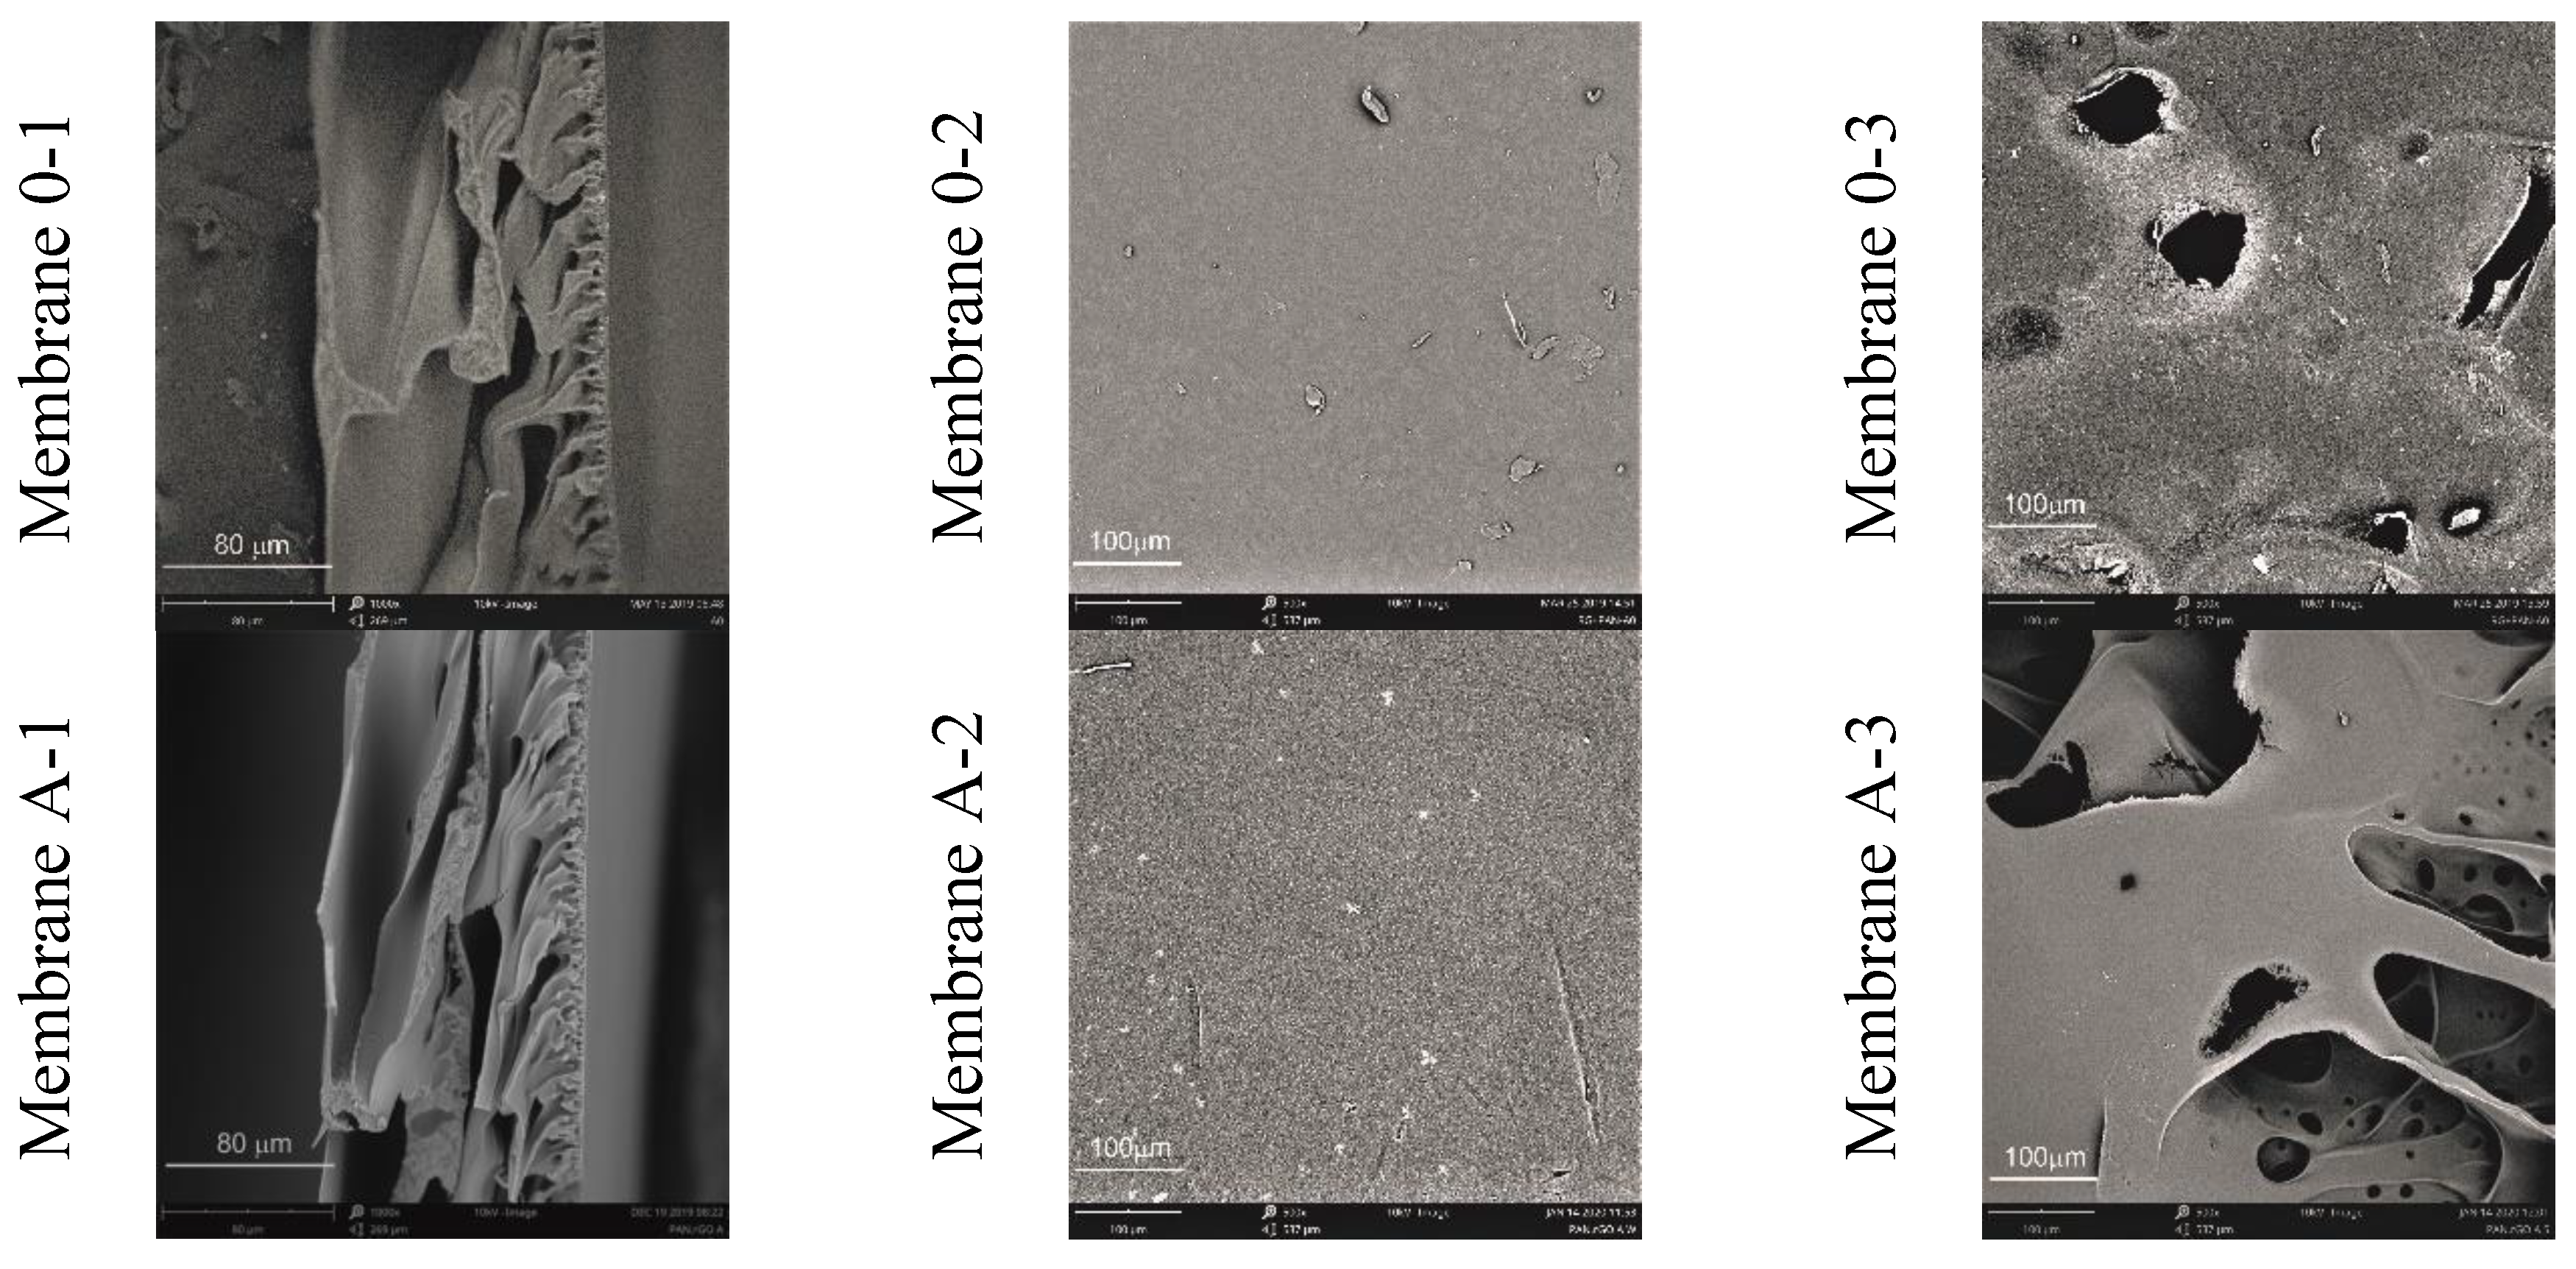
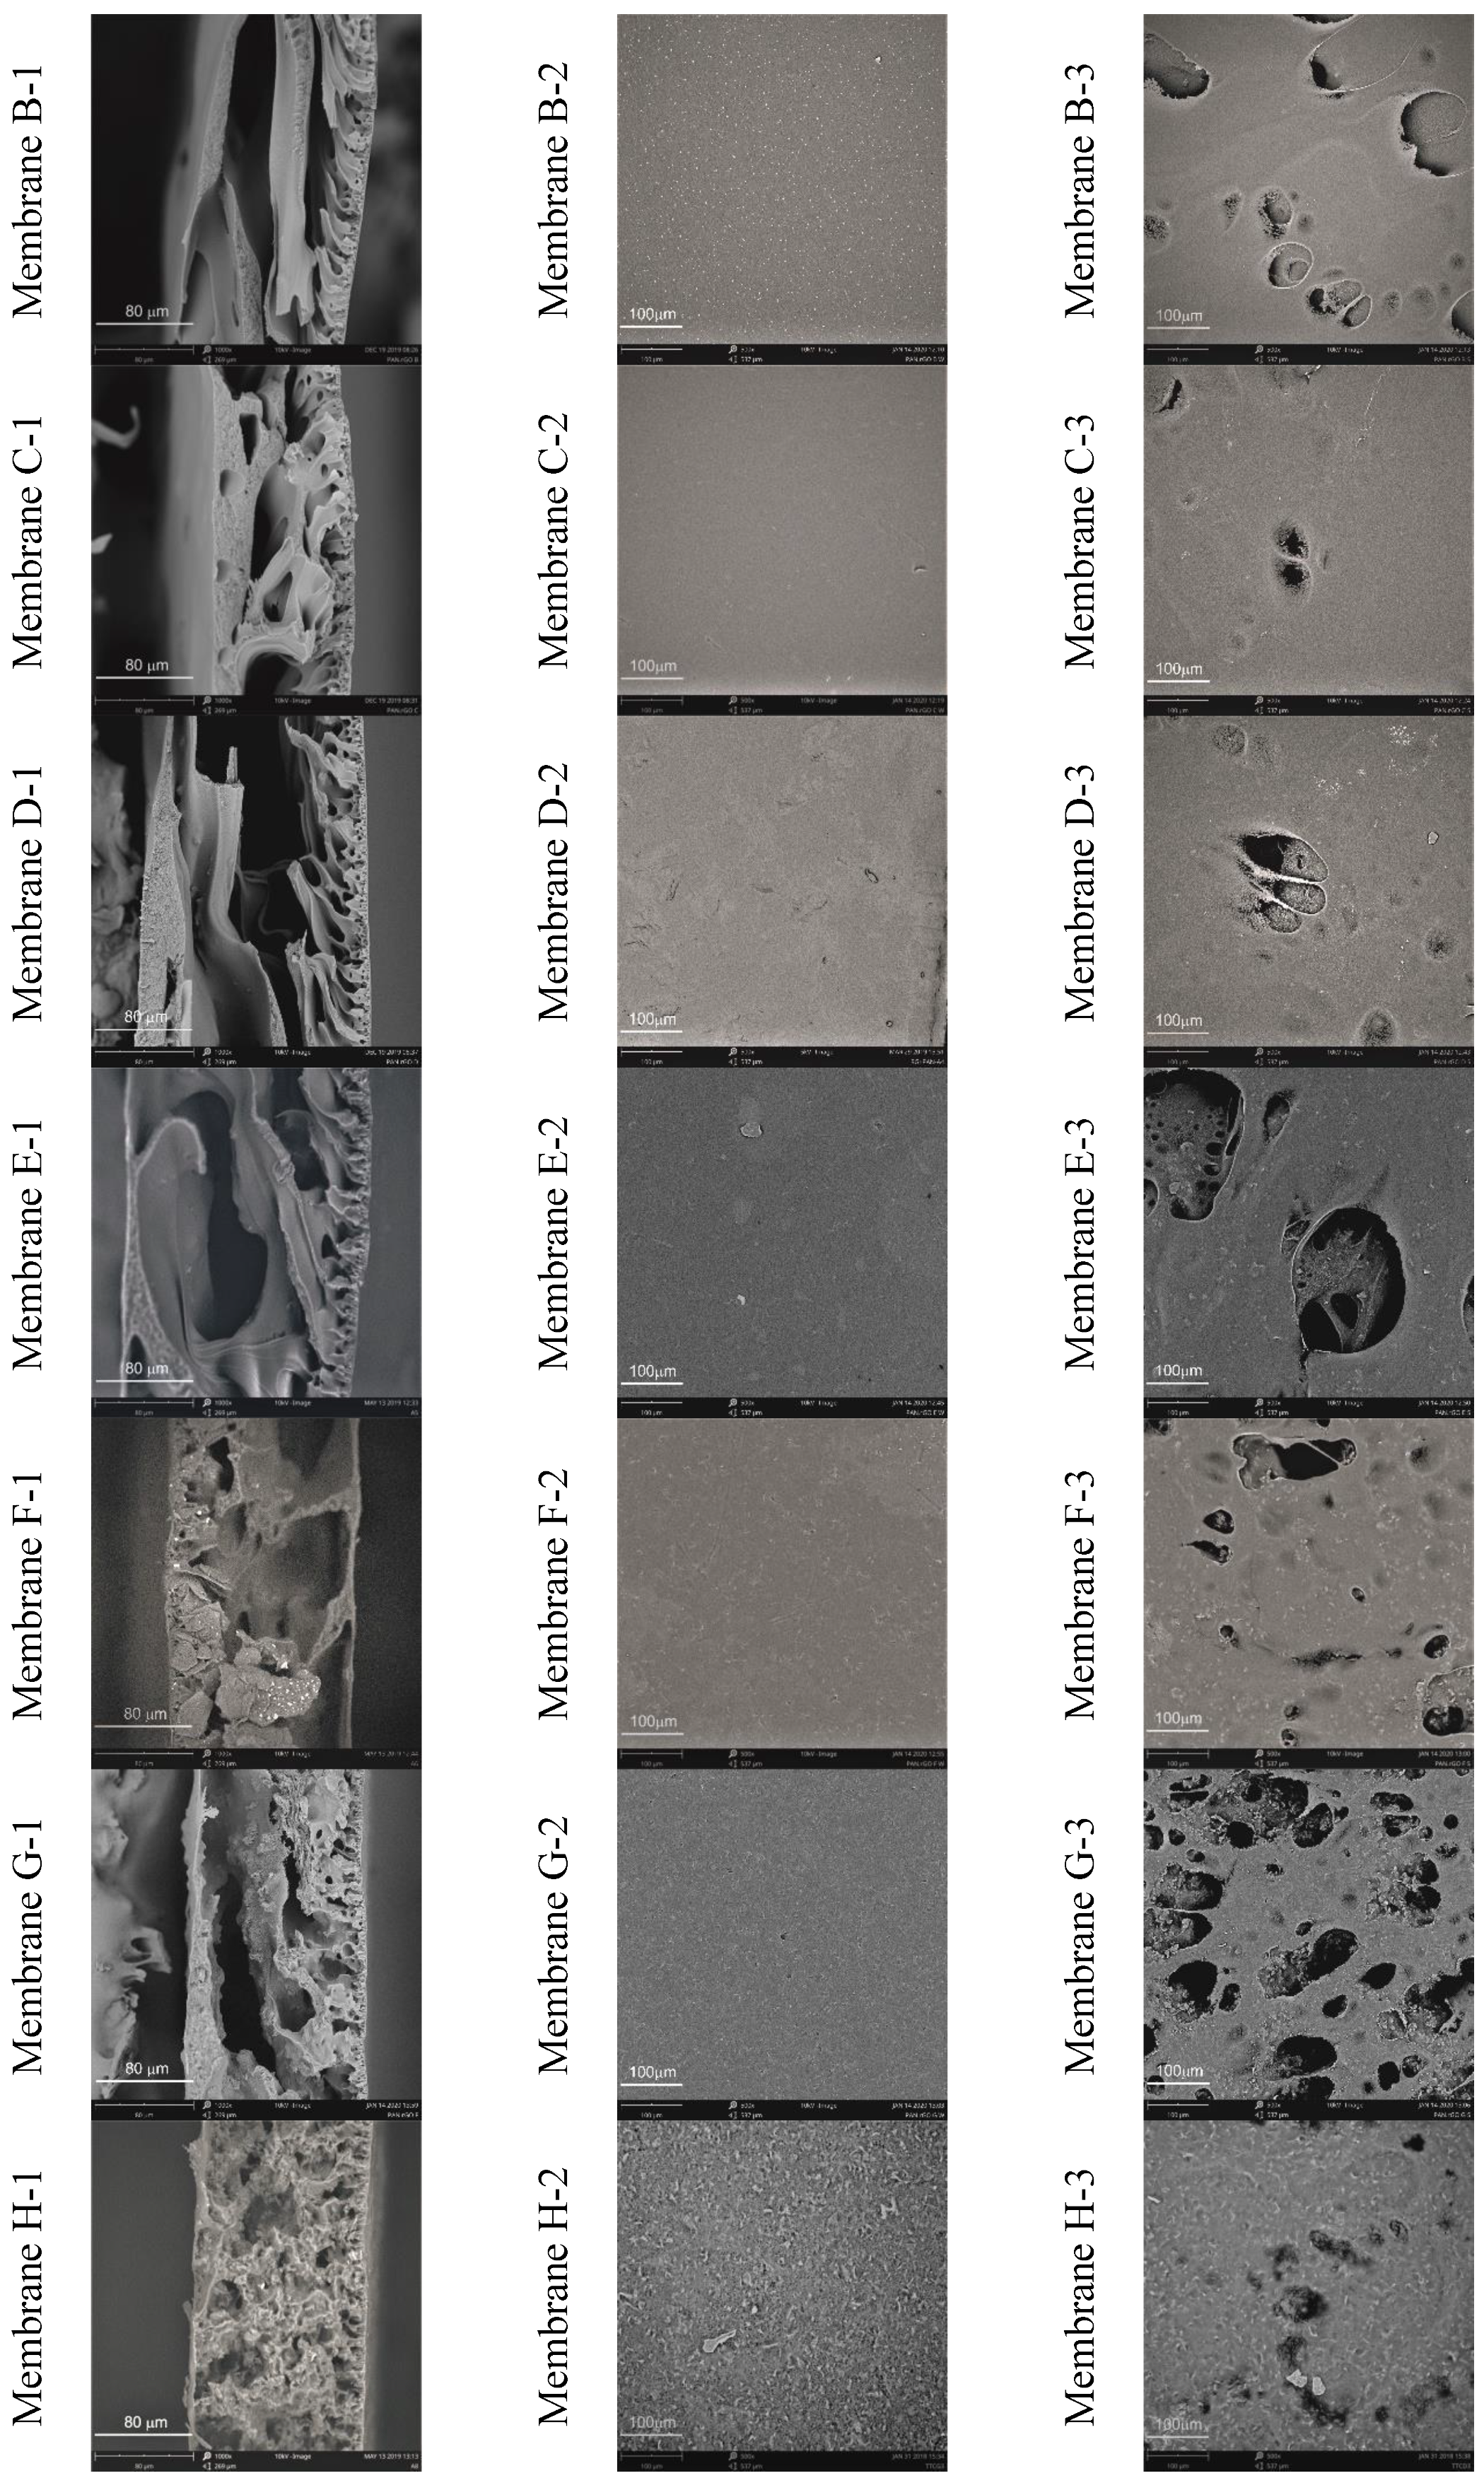
3.2. Membrane Characteristics
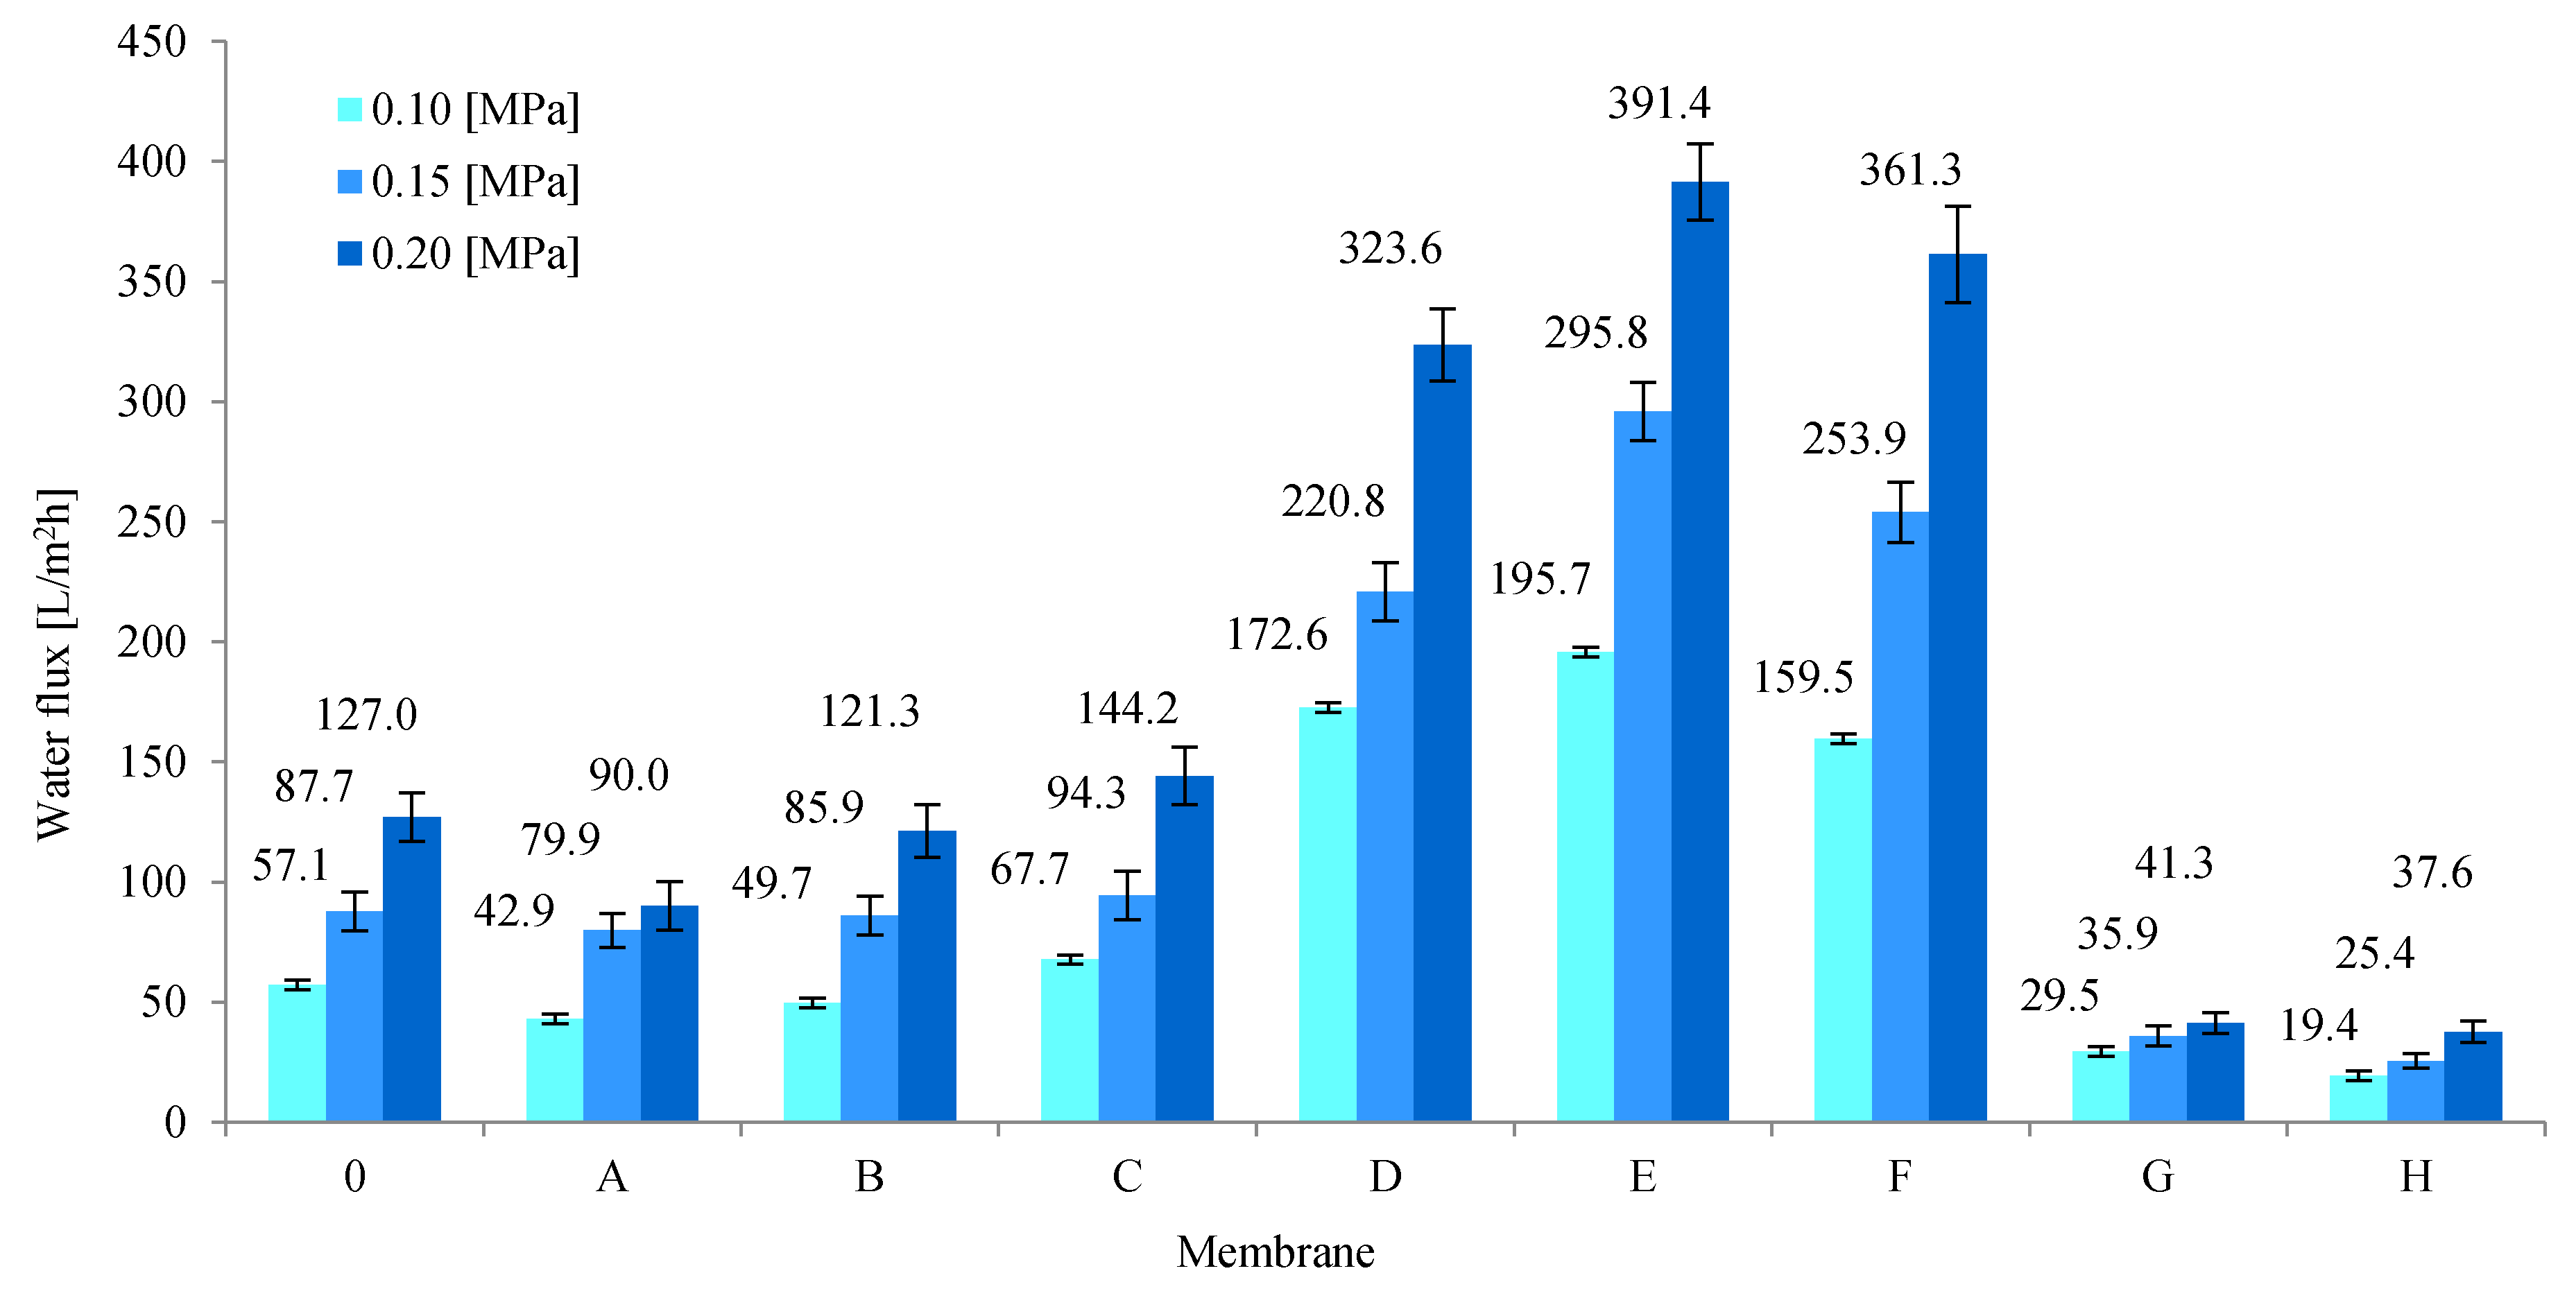
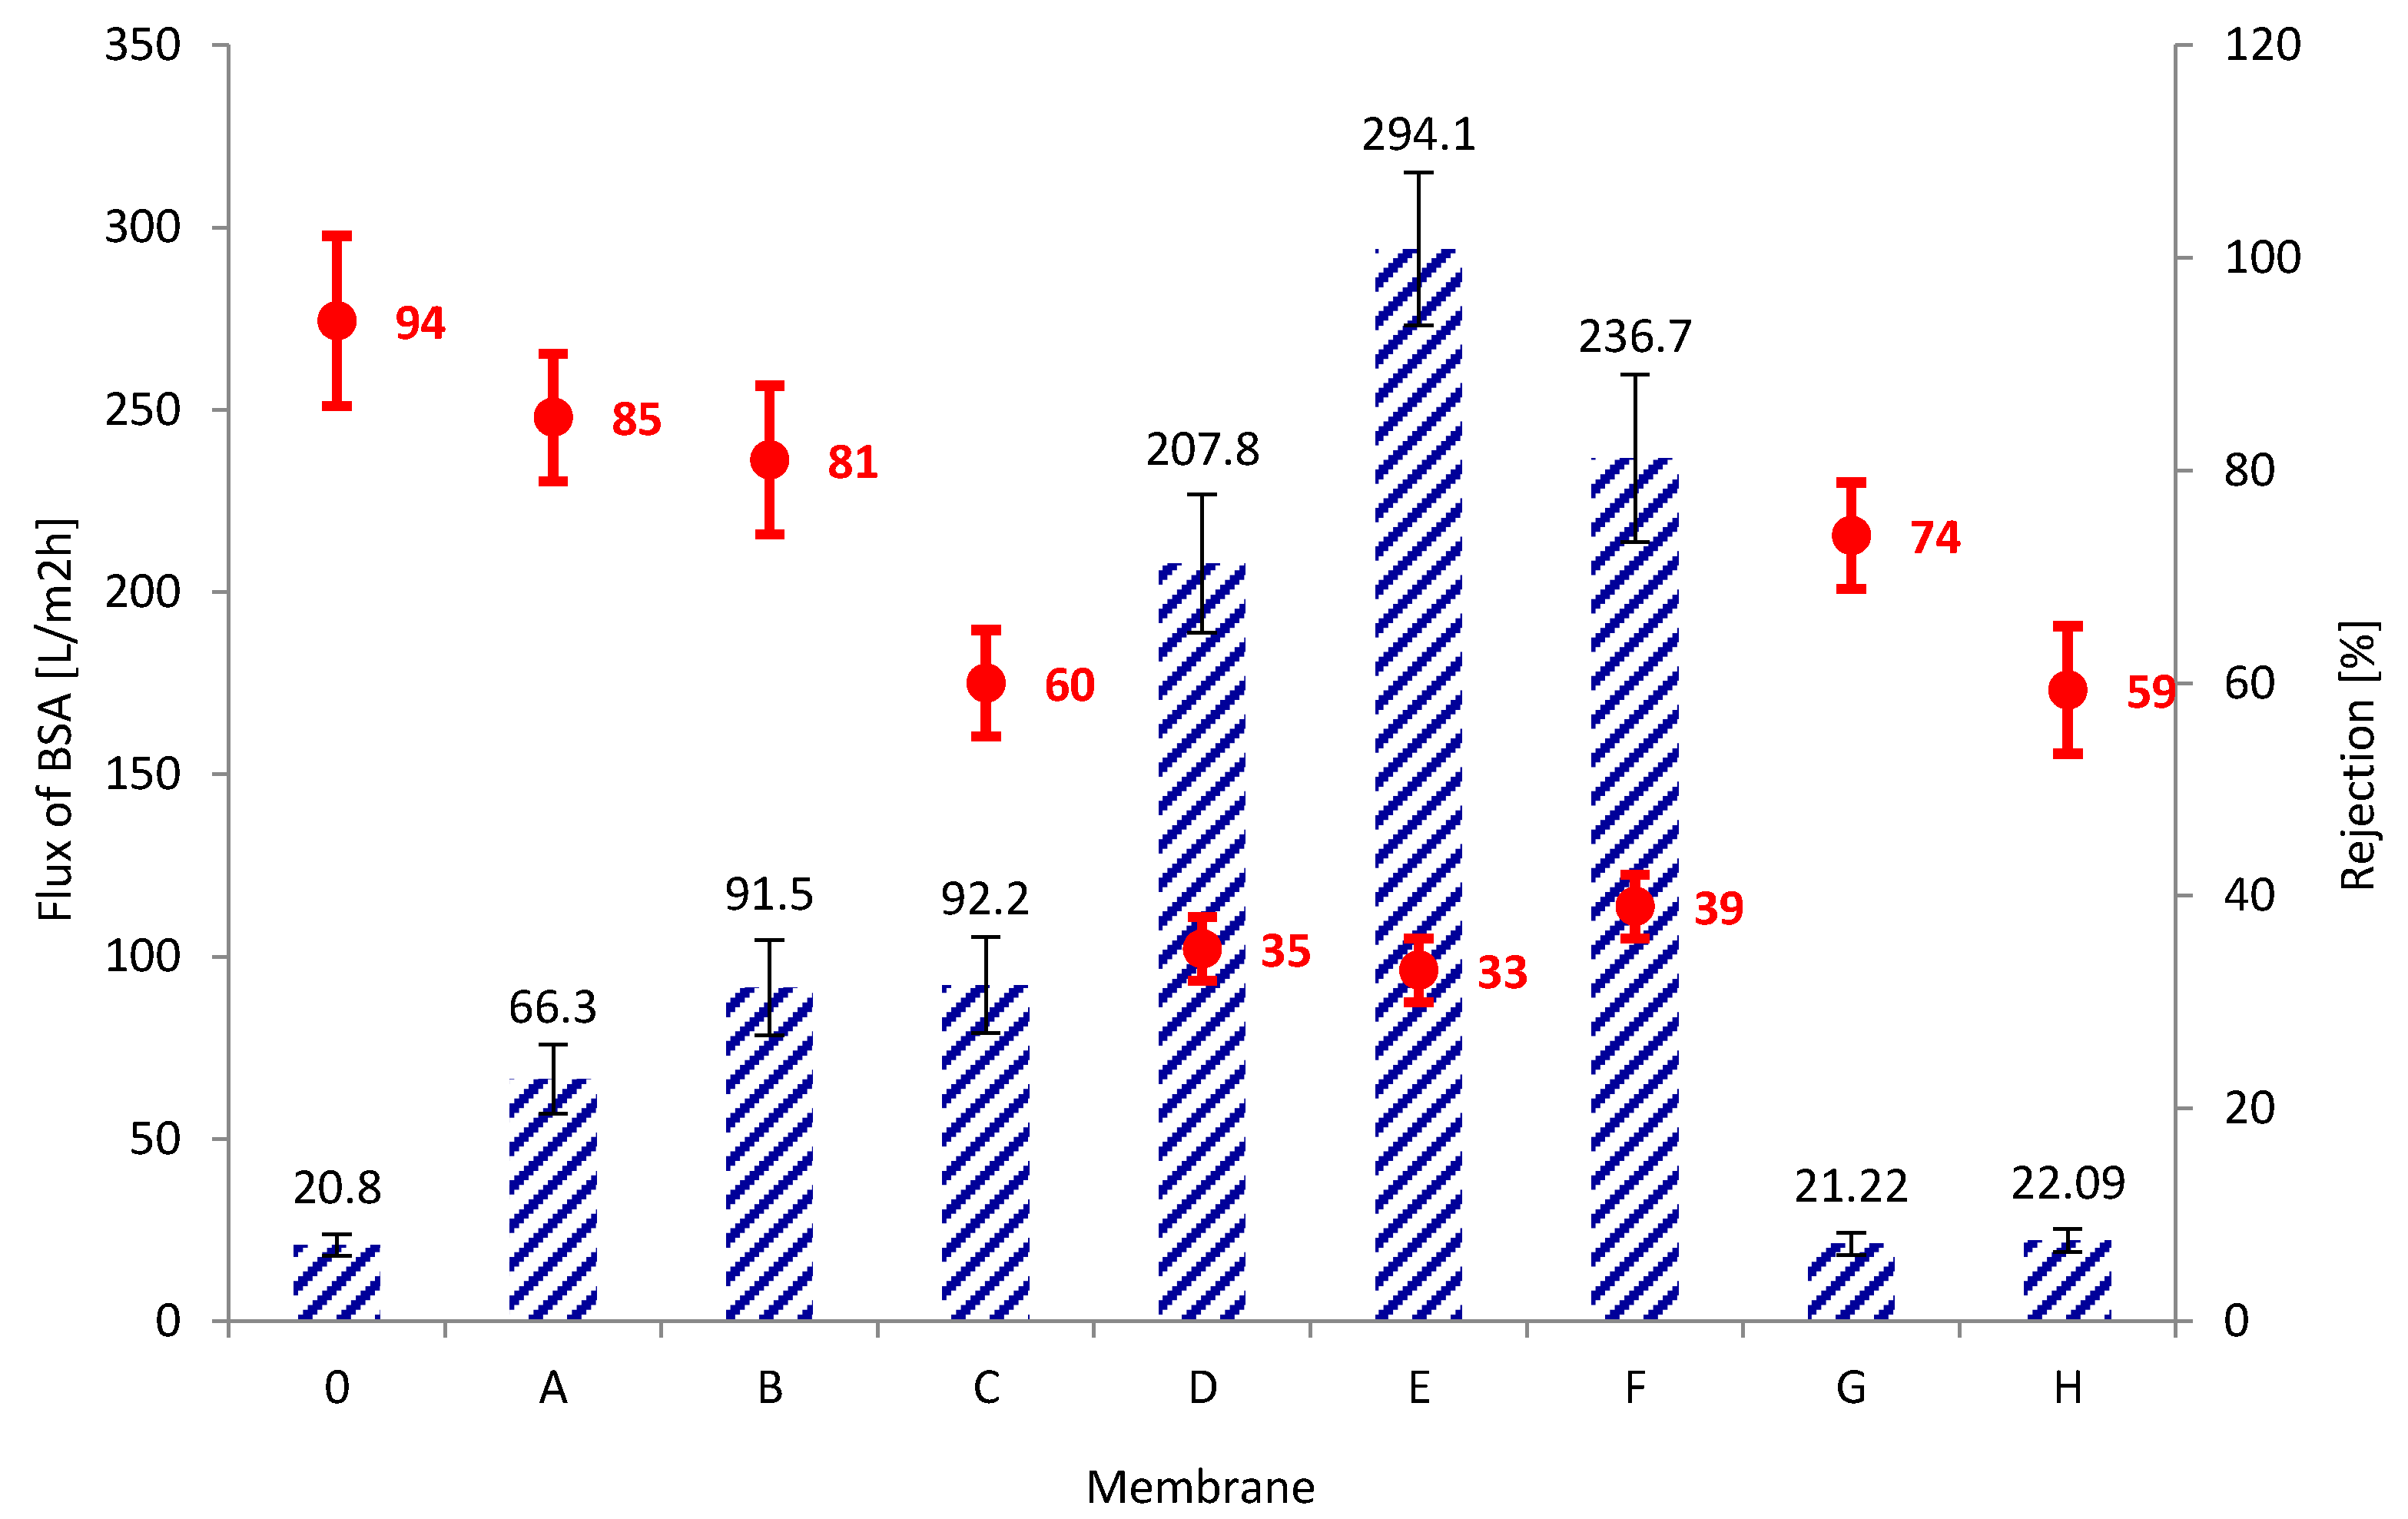
3.3. Transport and Separation Properties of the Membranes
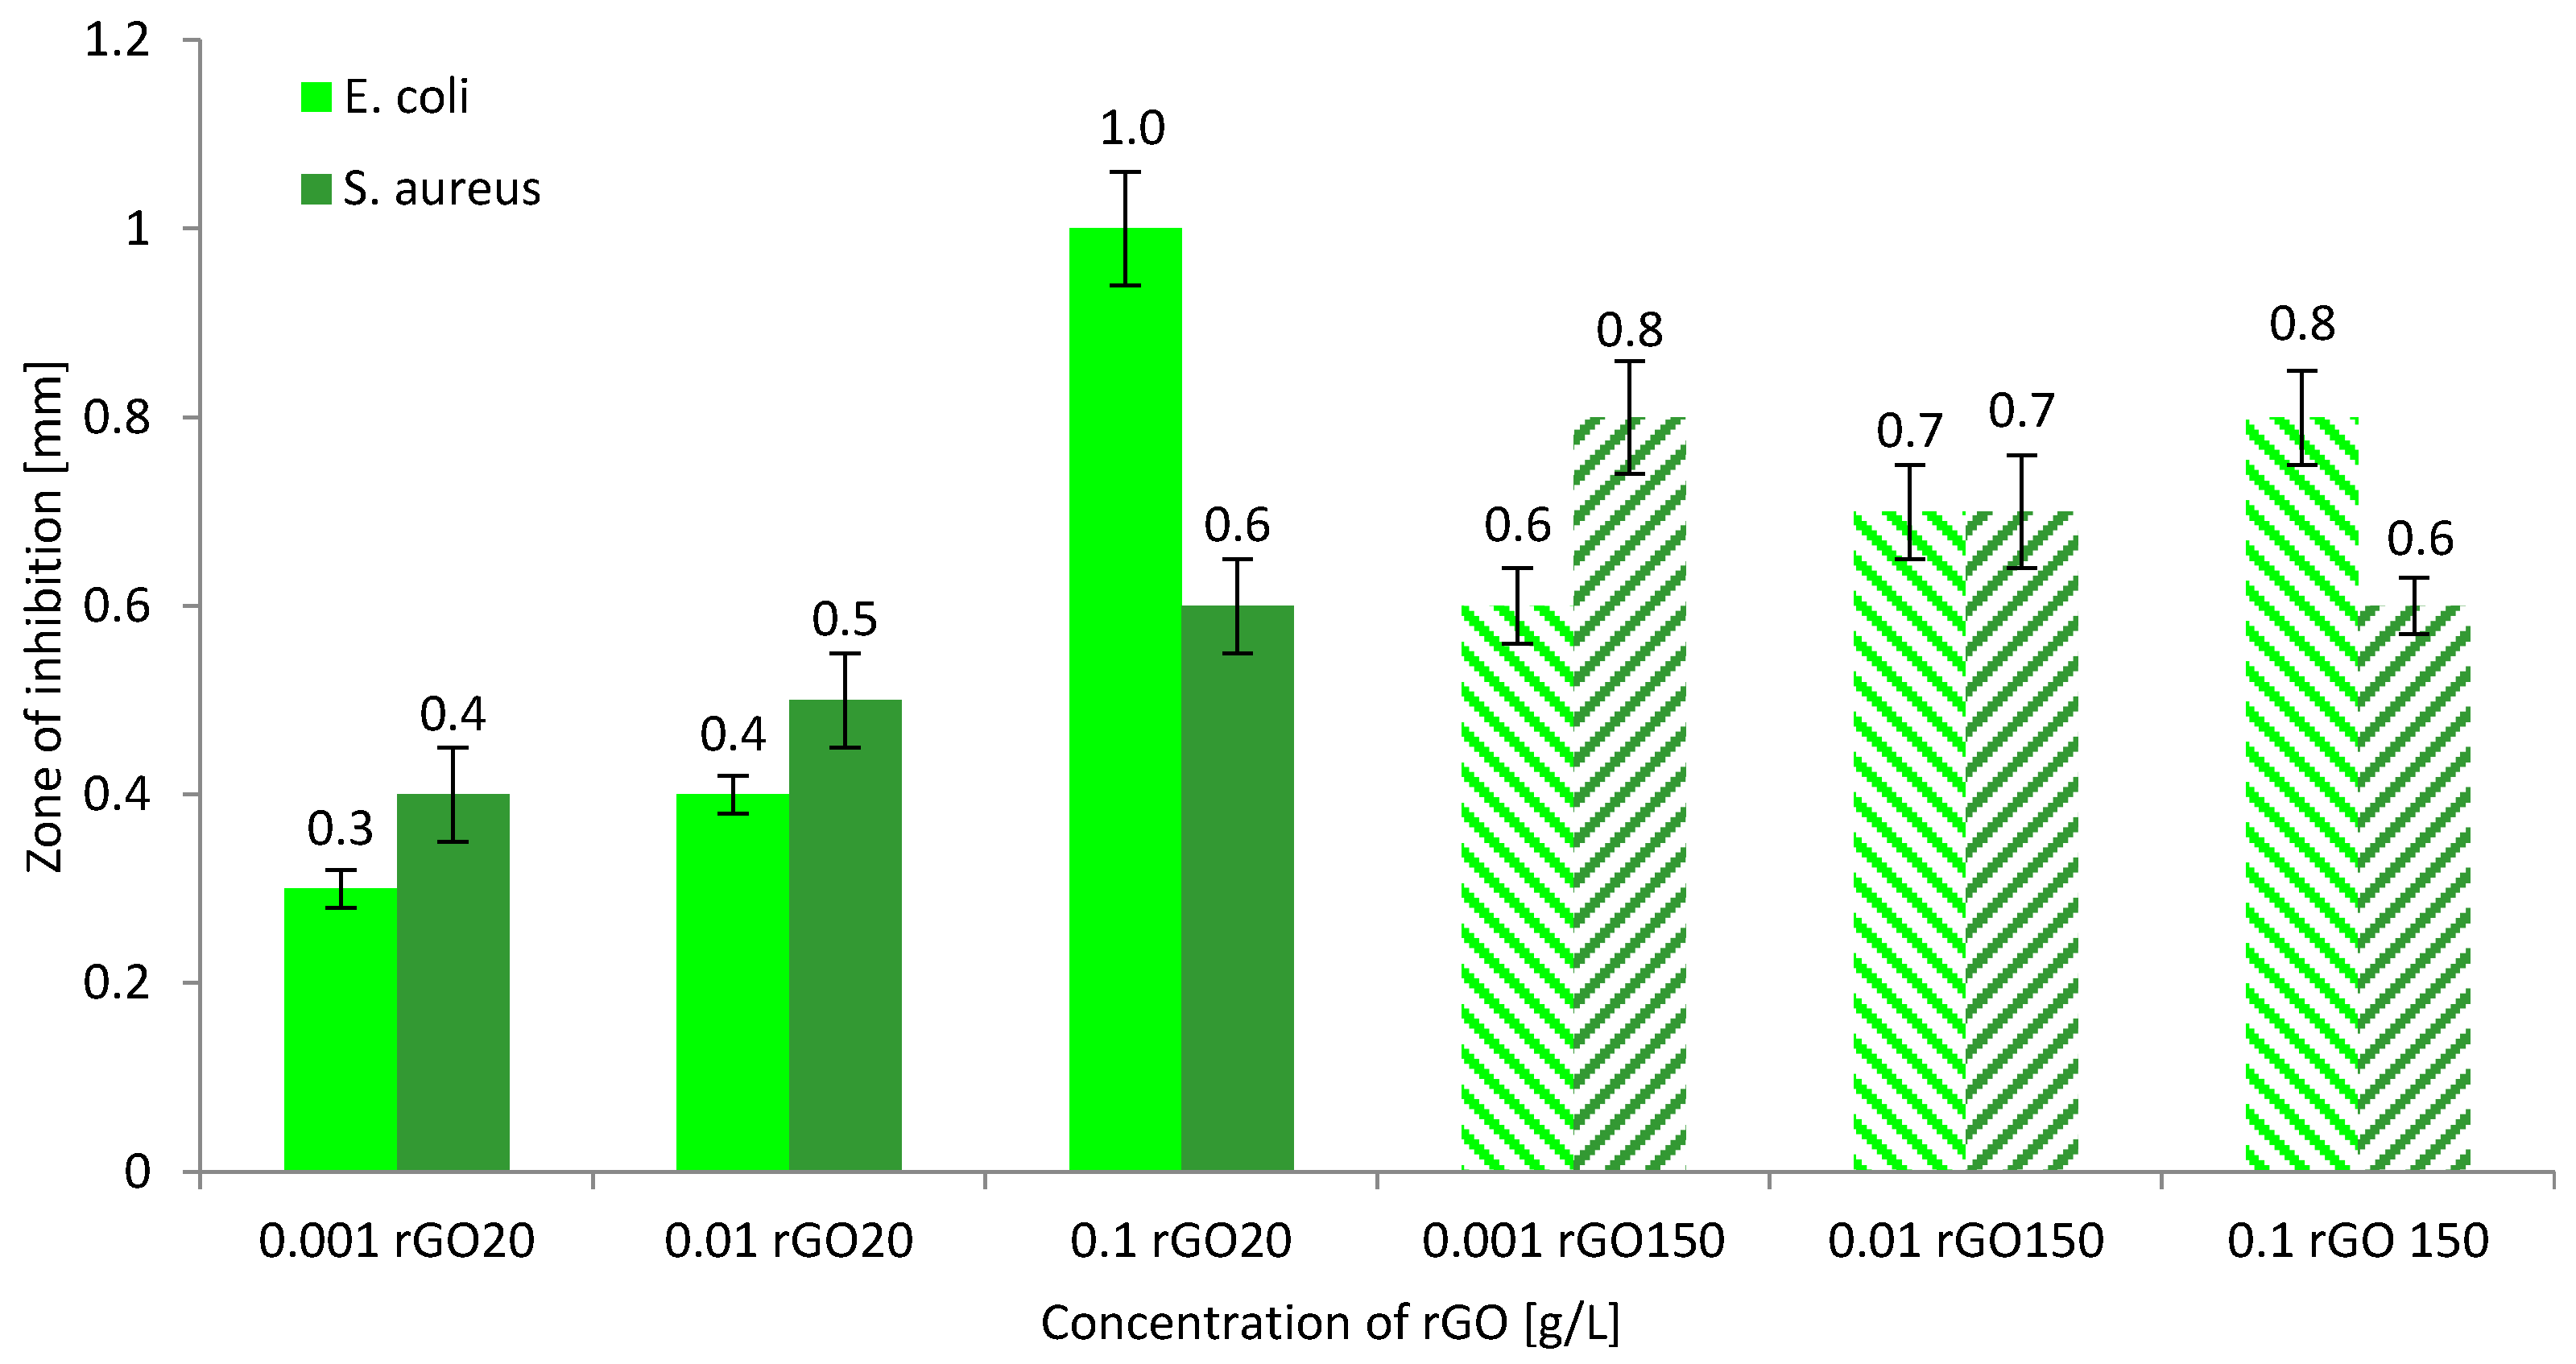
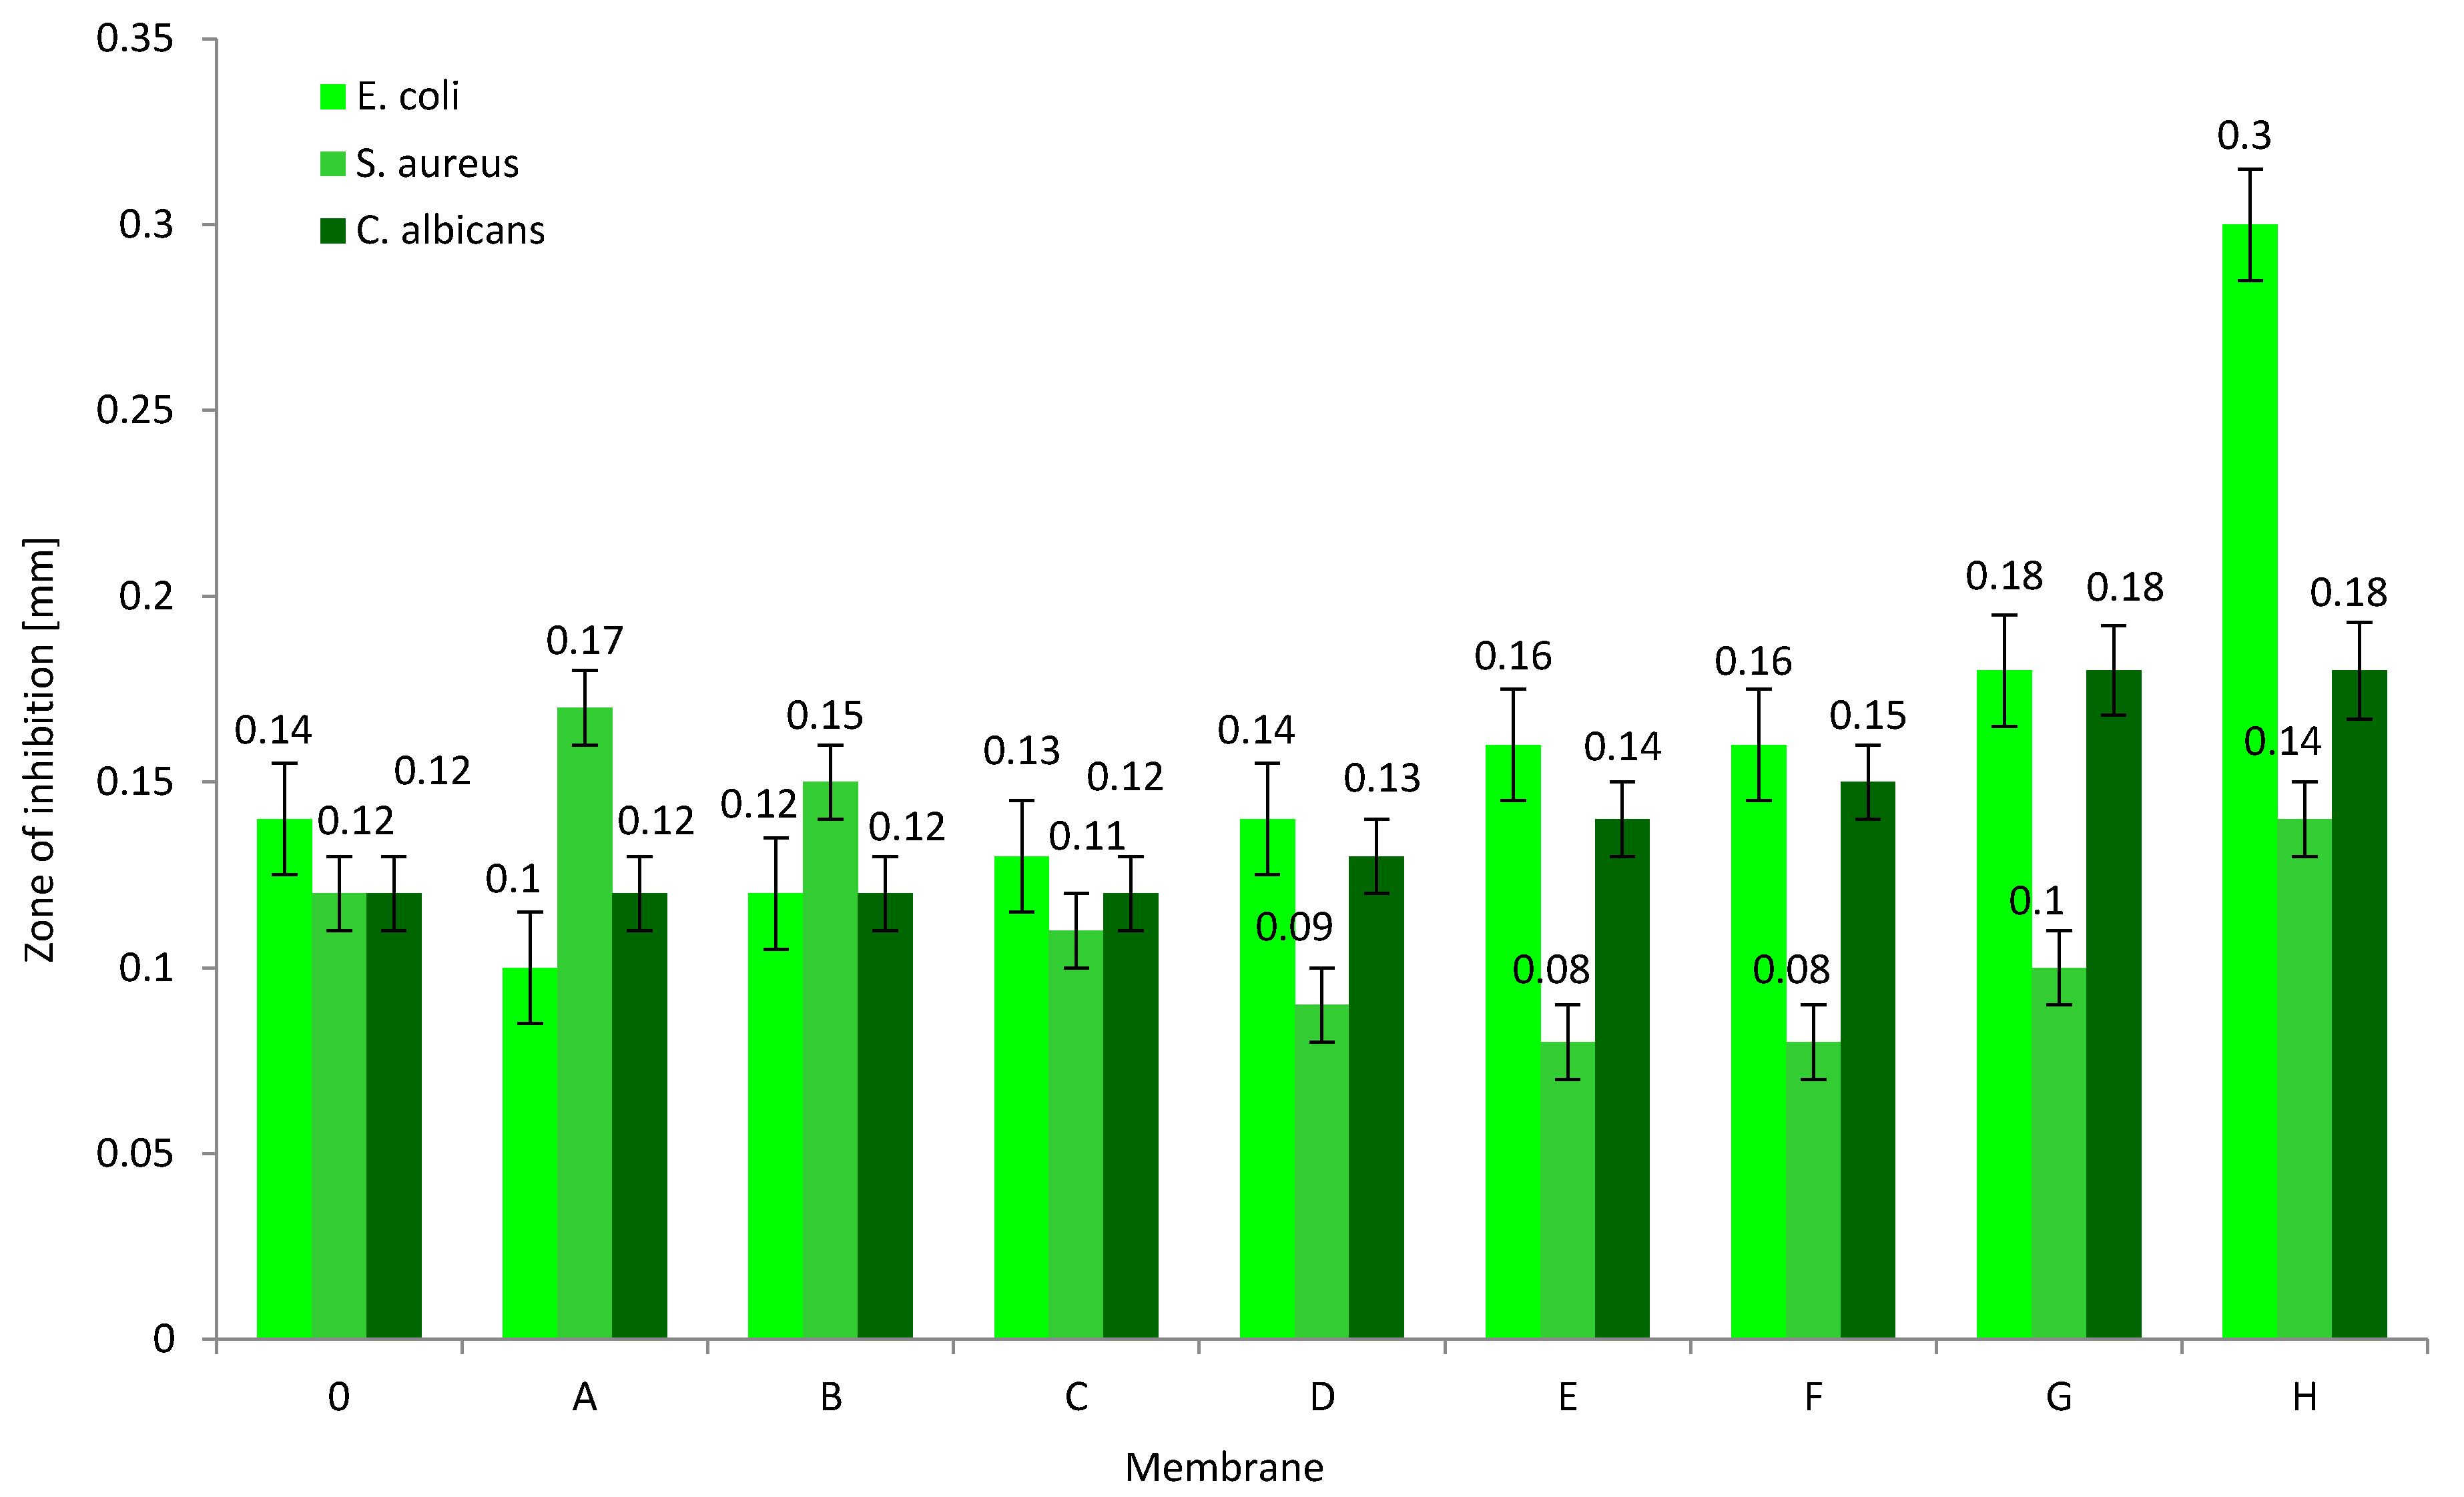
3.4. Biocidal Properties of rGO Solutions and Biostatic Properties of rGO/PAN Membranes
3.5. Structural Studies
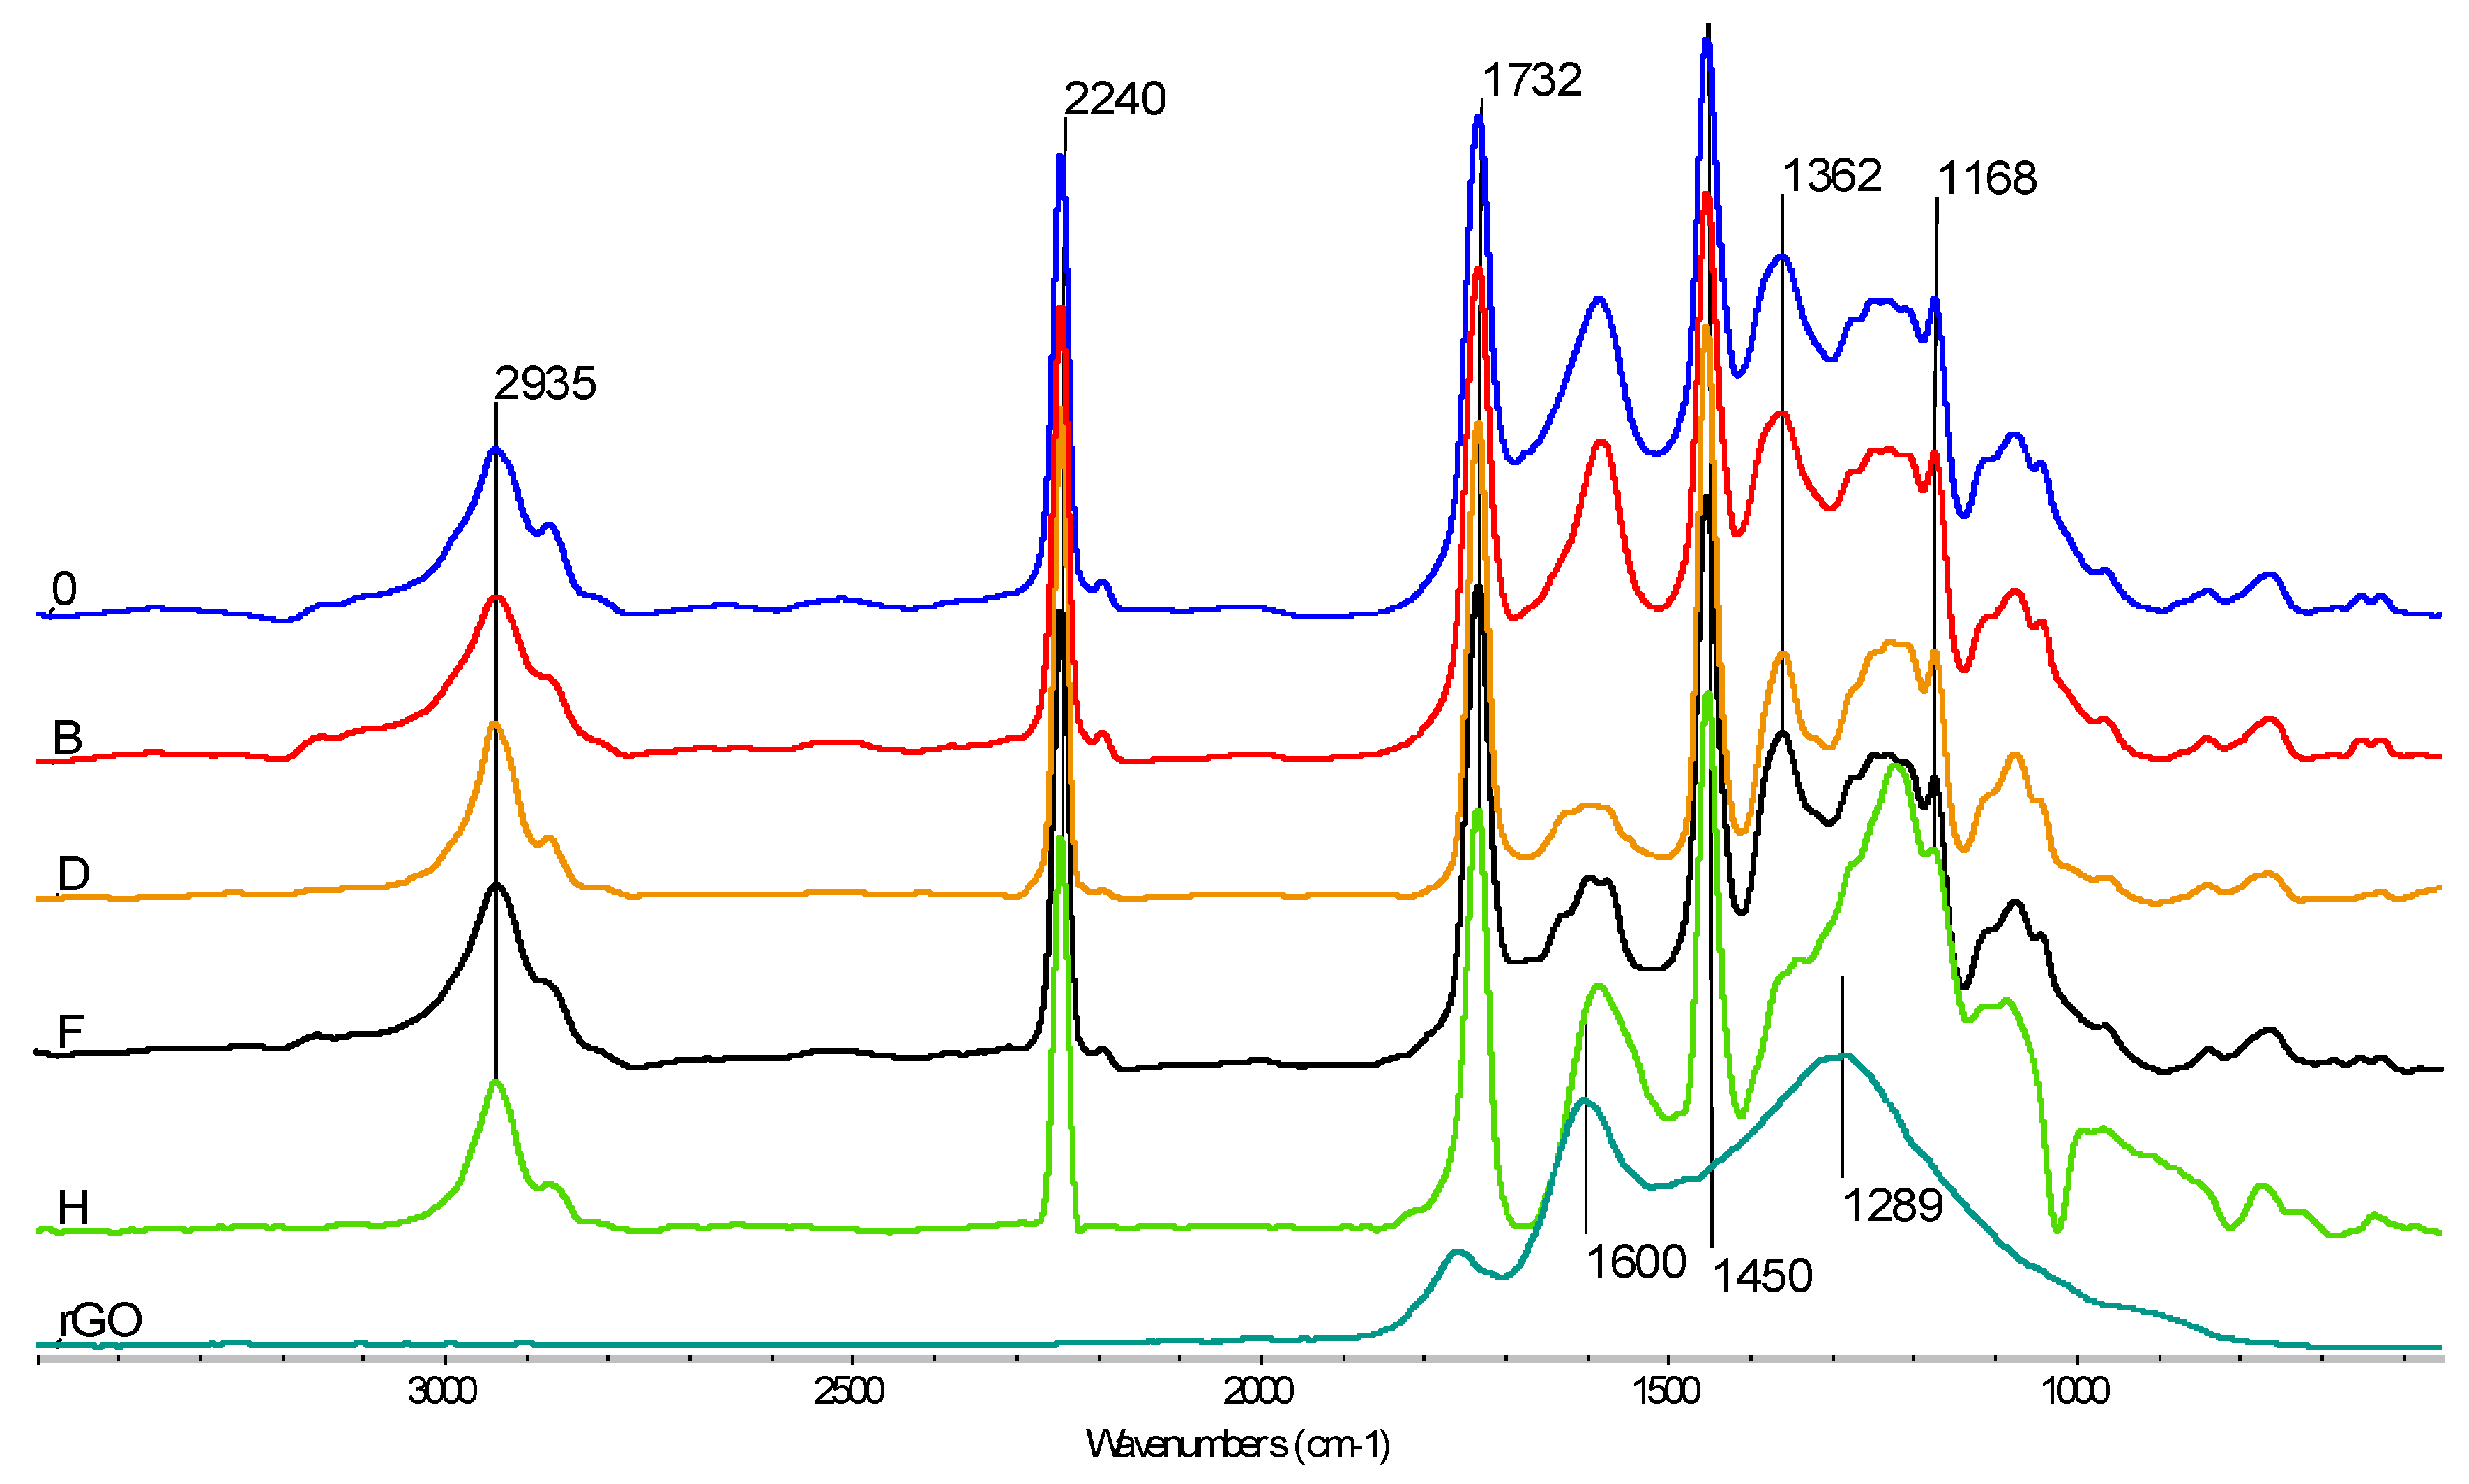
3.5.1. FTIR
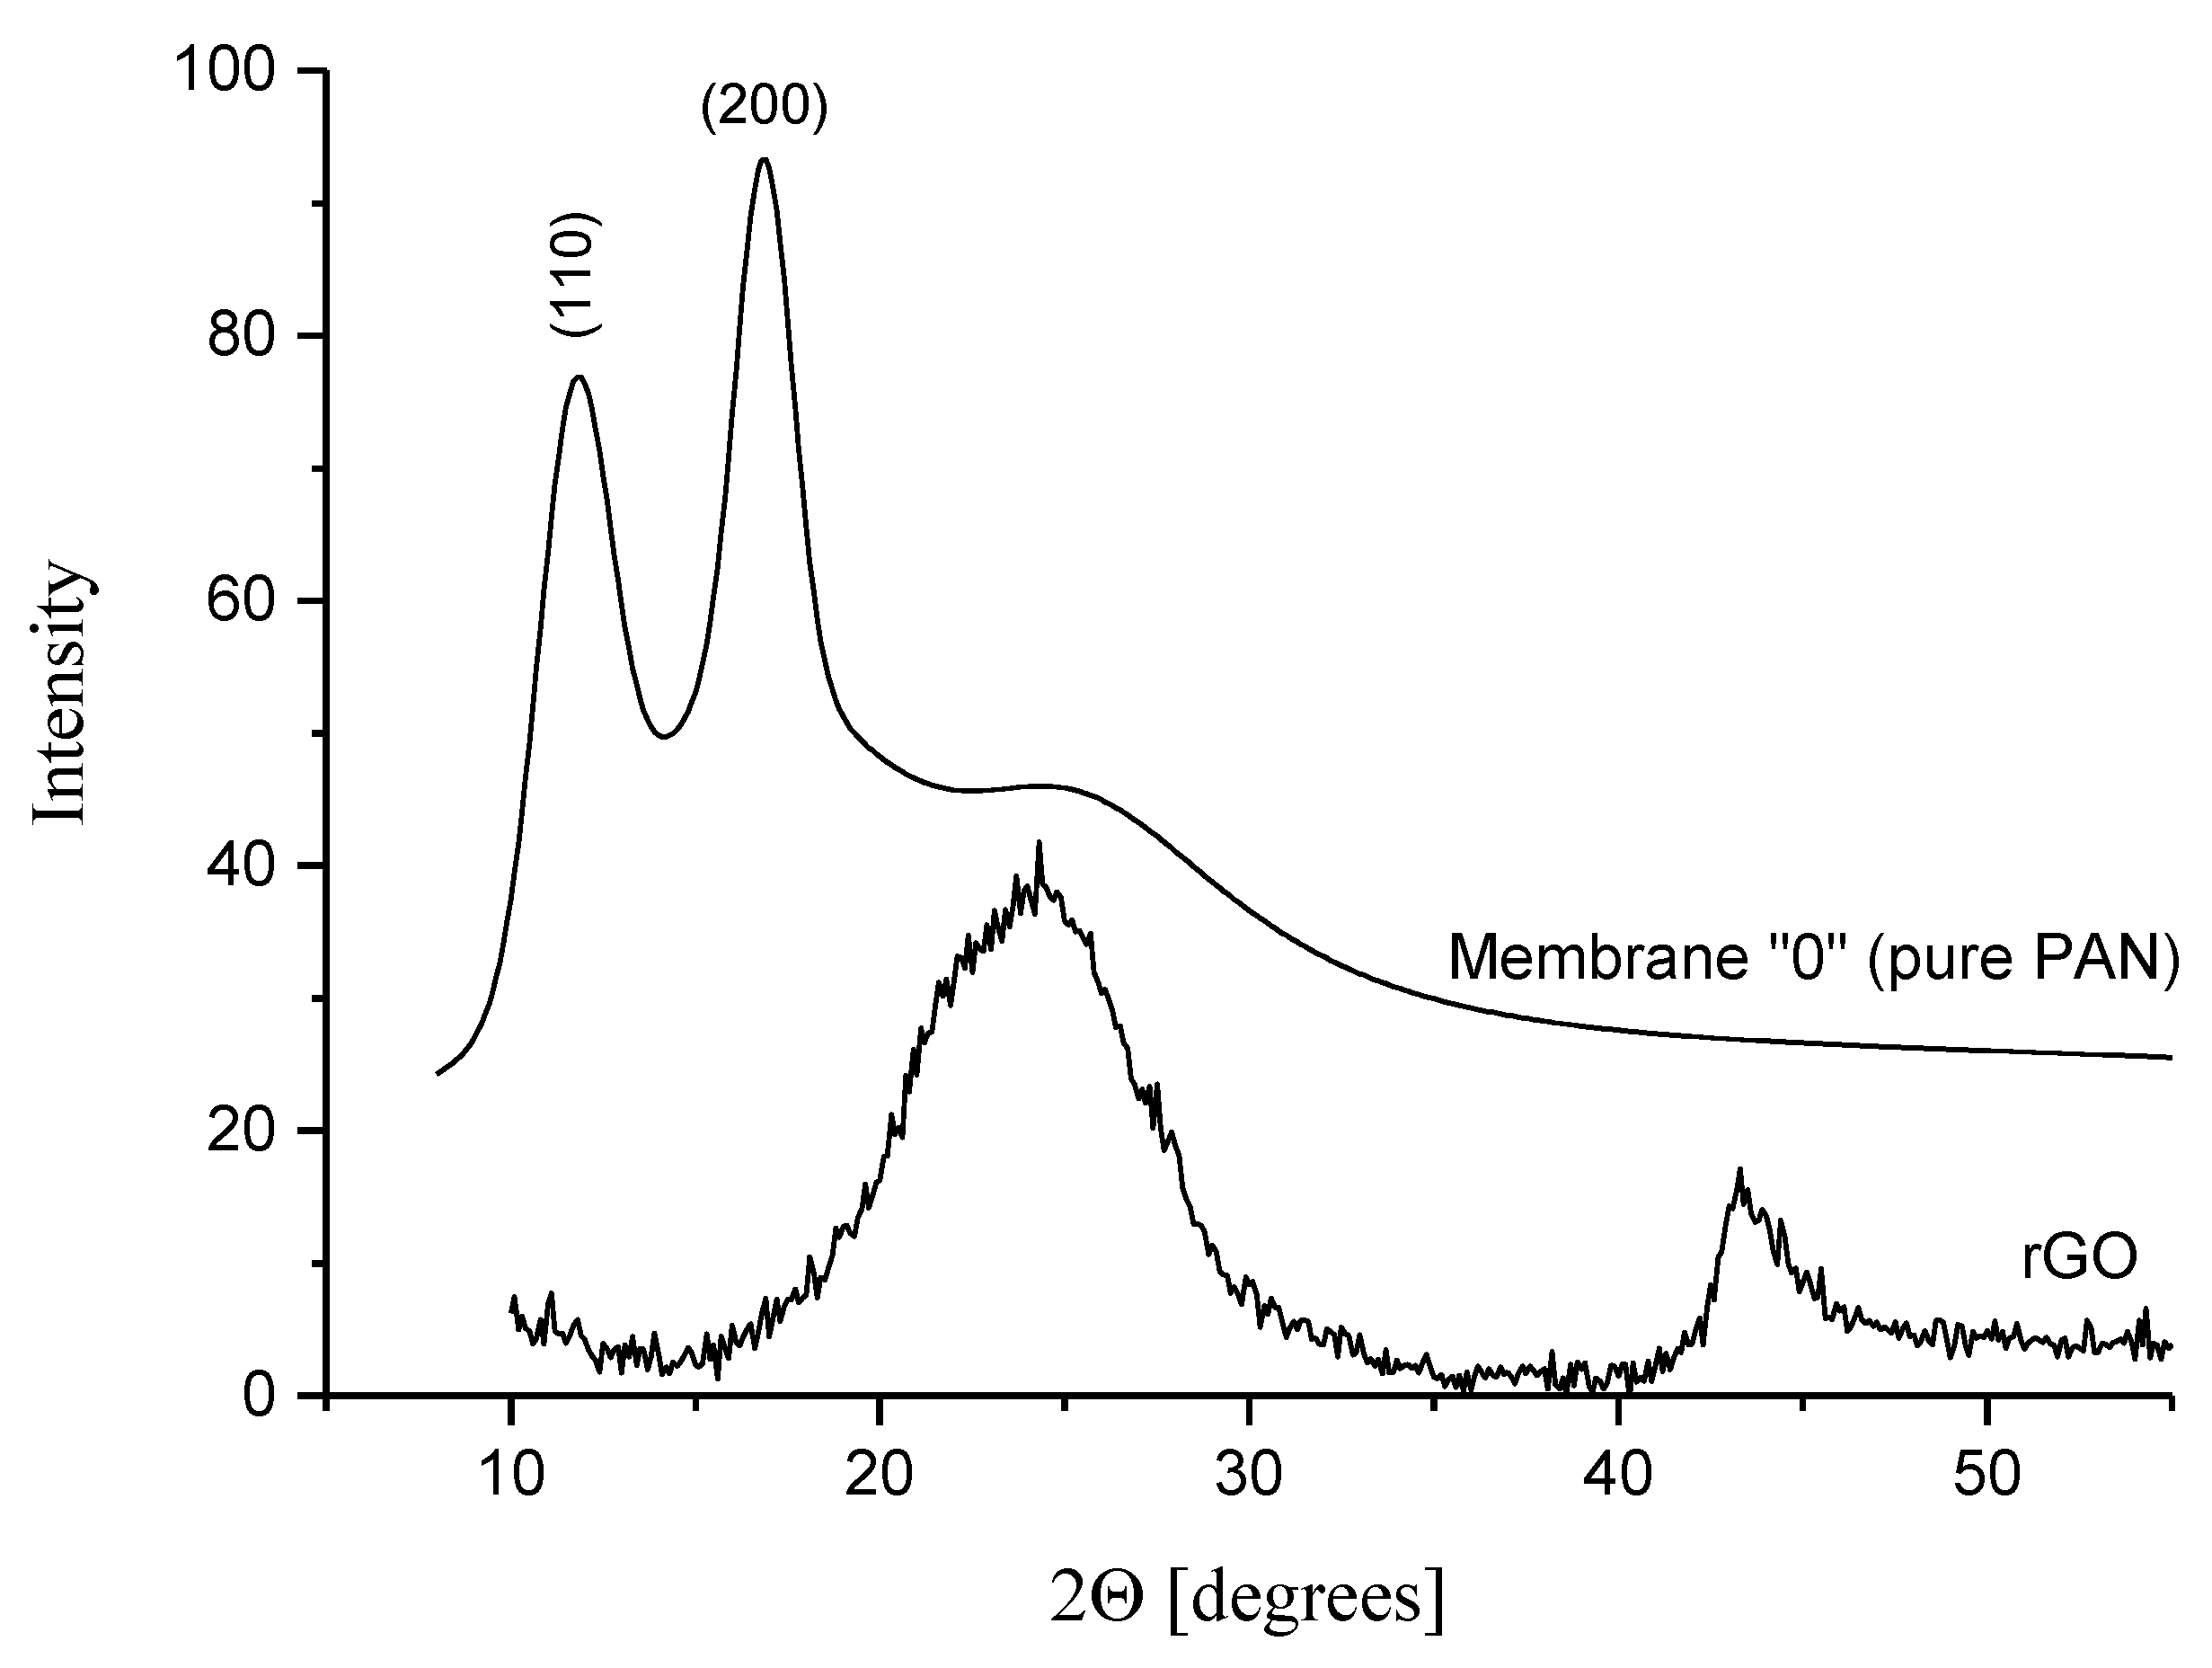
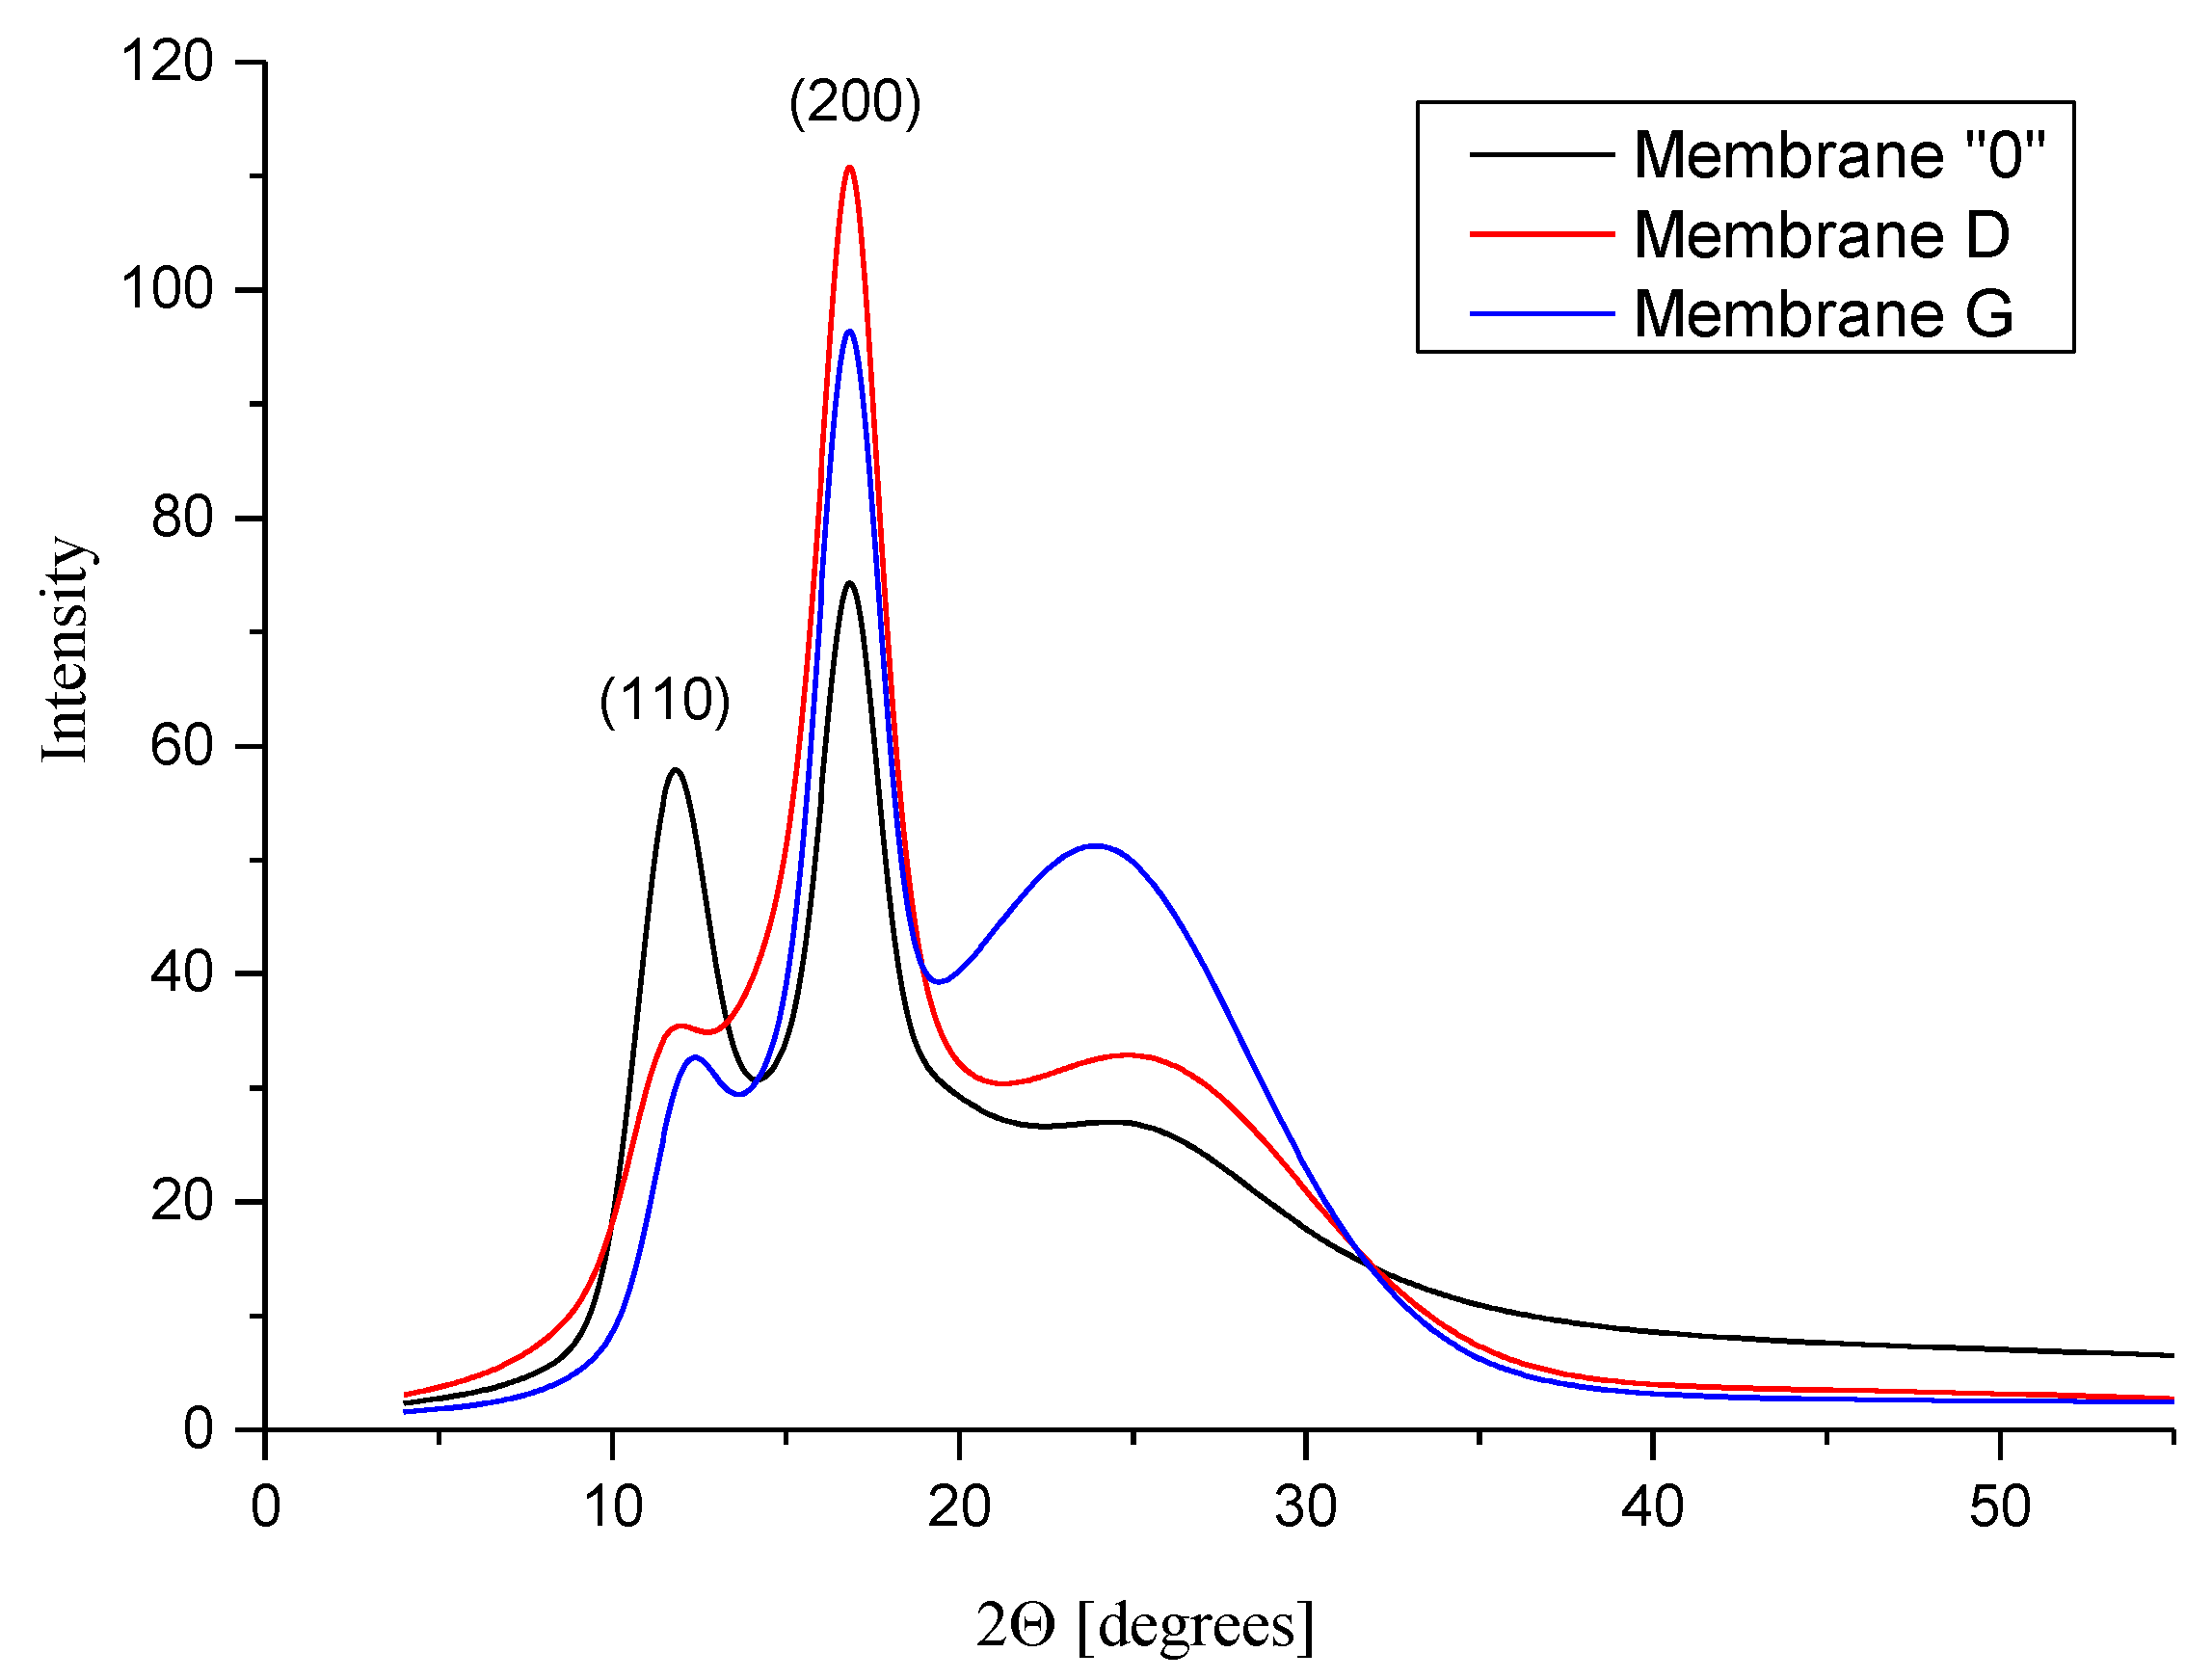
3.5.2. WAXS
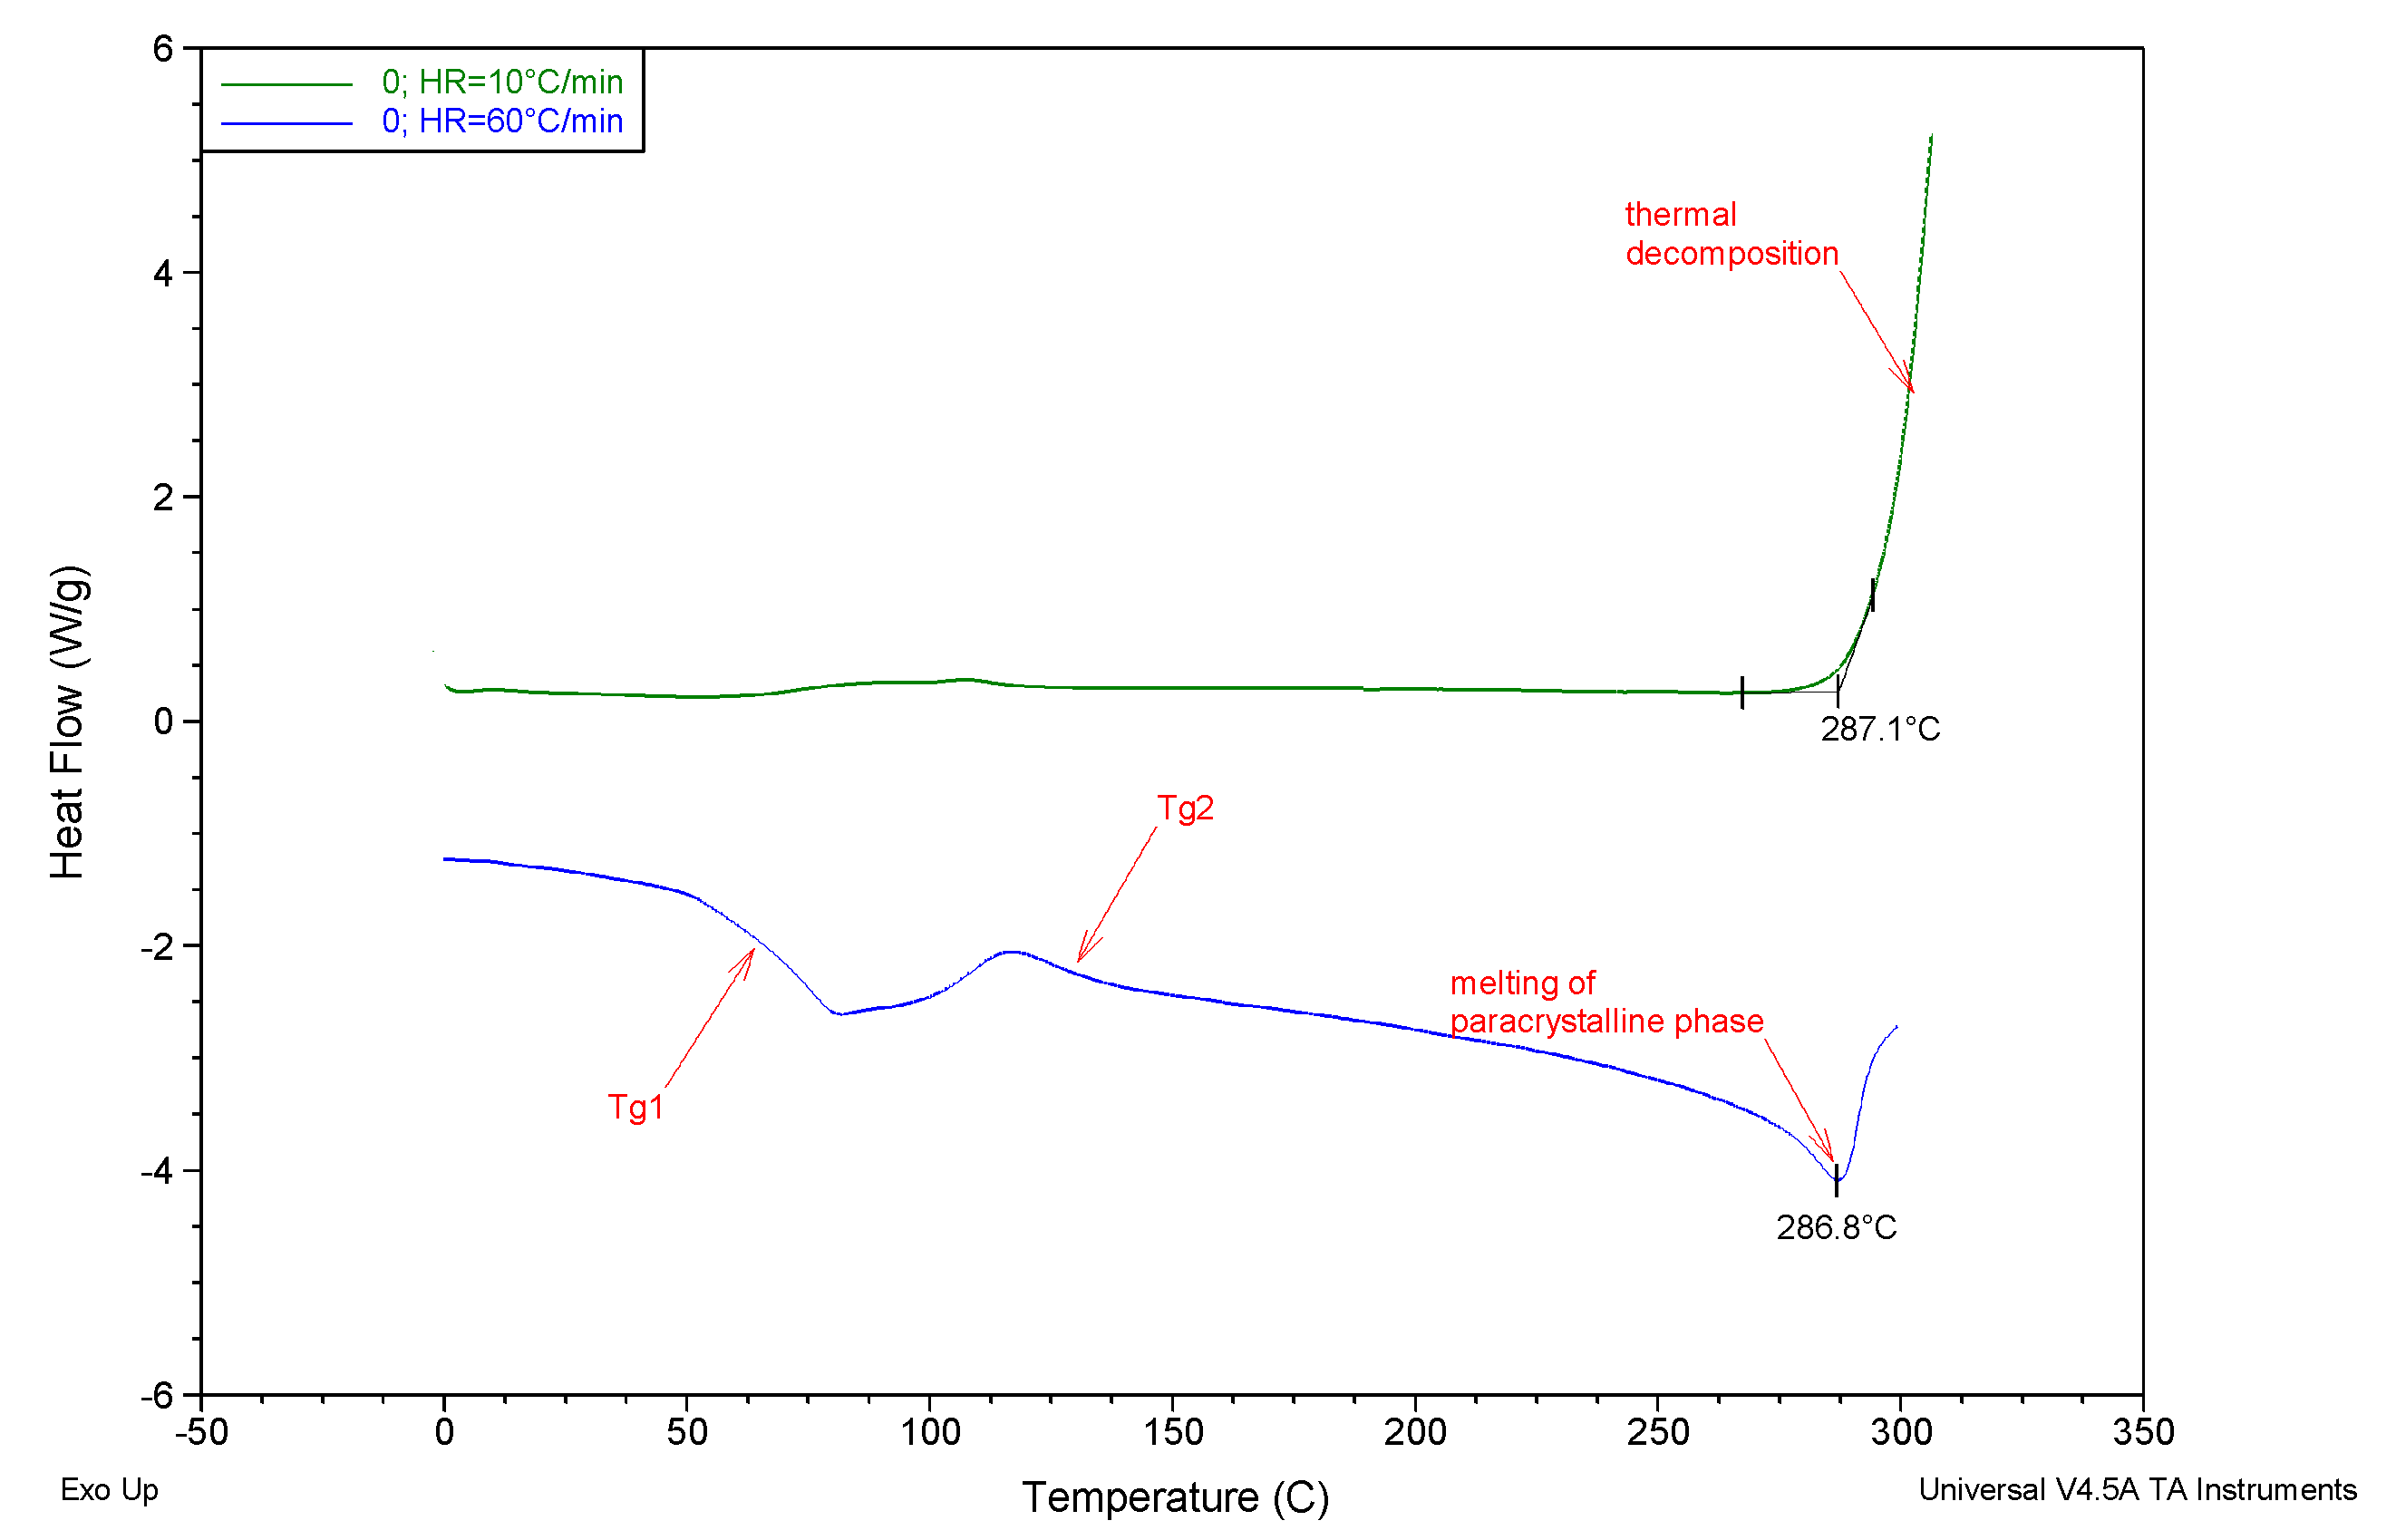
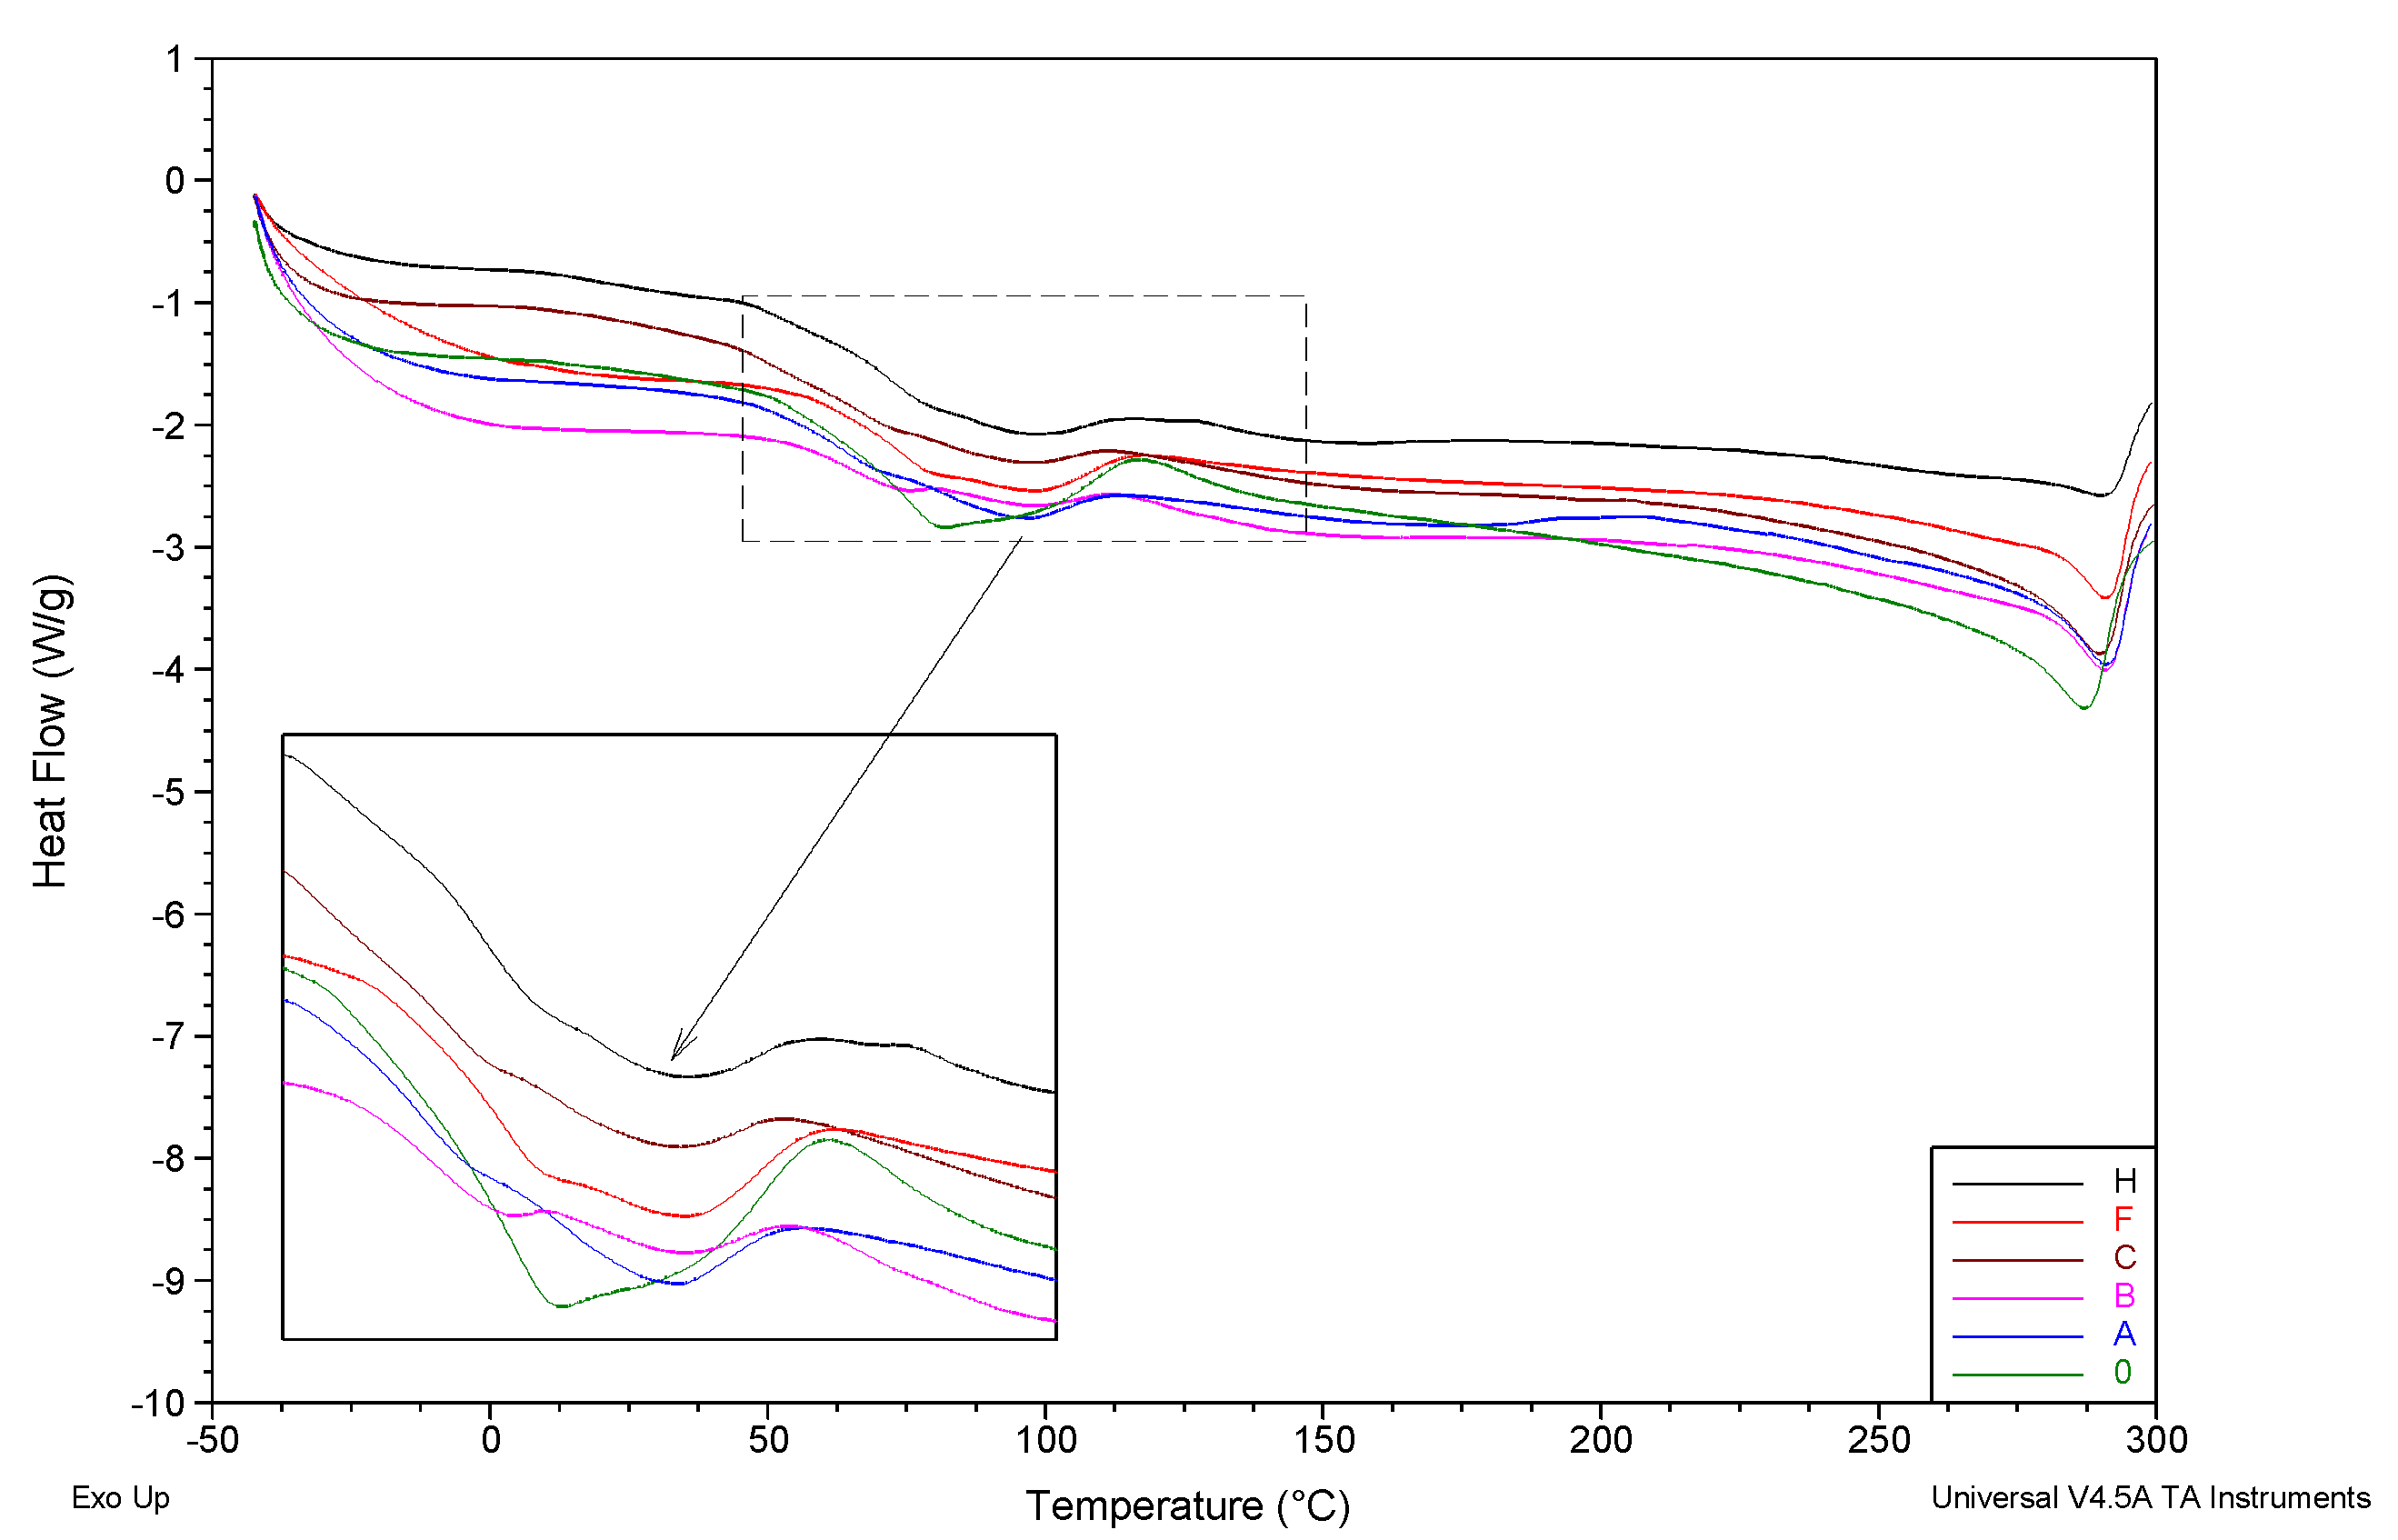
3.5.3. DSC
4. Conclusions
Author Contributions
Funding
Conflicts of Interest
References
- Li, Q.; Mahendra, S.; Lyon, D.Y.; Brunet, L.; Liga, M.V.; Li, D.; Alvarez, P.J.J. Antimicrobial nanomaterials for water disinfection and microbial control: Potential applications and implications. Water Res. 2008, 42, 4591–4602. [Google Scholar] [CrossRef] [PubMed]
- You, J.; Guo, Y.; Guo, R.; Liu, X. A review of visible light-active photocatalysts for water disinfection: Features and prospects. Chem. Eng. J. 2019, 373, 624–641. [Google Scholar] [CrossRef]
- Dutta, V.; Singh, P.; Shandilya, P.; Sharma, S.; Raizada, P.; Saini, A.K.; Gupta, V.K.; Hosseini-Bandegharaei, A.; Agarwal, S.; Rahmani-Sani, A. Review on advances in photocatalytic water disinfection utilizing graphene and graphene derivatives-based nanocomposites. J. Environ. Chem. Eng. 2019, 7, 103132. [Google Scholar] [CrossRef]
- Wu, Q.-Y.; Wan, L.-S.; Xu, Z.-K. Structure and performance of polyacrylonitrile membranes prepared via thermally induced phase separation. J. Memb. Sci. 2012, 409, 355–364. [Google Scholar] [CrossRef]
- Zhang, Q.; Damit, B.; Welch, J.; Park, H.; Wu, C.Y.; Sigmund, W. Microwave assisted nanofibrous air filtration for disinfection of bioaerosols. J. Aerosol Sci. 2010, 41, 880–888. [Google Scholar] [CrossRef]
- Konieczny, K. Disinfection of surface and ground waters with polymeric ultrafiltration membranes. Desalination 1998, 119, 251–258. [Google Scholar] [CrossRef]
- Kharaghani, D.; Kee Jo, Y.; Khan, M.Q.; Jeong, Y.; Cha, H.J.; Kim, I.S. Electrospun antibacterial polyacrylonitrile nanofiber membranes functionalized with silver nanoparticles by a facile wetting method. Eur. Polym. J. 2018, 108, 69–75. [Google Scholar] [CrossRef]
- Wang, S.; Bai, J.; Li, C.; Zhang, J. Functionalization of electrospun β-cyclodextrin/polyacrylonitrile (PAN) with silver nanoparticles: Broad-spectrum antibacterial property. Appl. Surf. Sci. 2012, 261, 499–503. [Google Scholar] [CrossRef]
- Yuan, M.; Teng, Z.; Wang, S.; Xu, Y.; Wu, P.; Zhu, Y.; Wang, C.; Wang, G. Polymeric carbon nitride modified polyacrylonitrile fabrics with efficient self-cleaning and water disinfection under visible light. Chem. Eng. J. 2019, 123506. [Google Scholar] [CrossRef]
- Tan, X.; Chen, C.; Hu, Y.; Wen, J.; Qin, Y.; Cheng, J.; Chen, Y. Novel AgNWs-PAN/TPU membrane for point-of-use drinking water electrochemical disinfection. Sci. Total Environ. 2018, 637–638, 408–417. [Google Scholar] [CrossRef]
- Mukherjee, M.; De, S. Investigation of antifouling and disinfection potential of chitosan coated iron oxide-PAN hollow fiber membrane using Gram-positive and Gram-negative bacteria. Mater. Sci. Eng. C 2017, 75, 133–148. [Google Scholar] [CrossRef] [PubMed]
- Krishnamoorthy, K.; Veerapandian, M.; Zhang, L.H.; Yun, K.; Kim, S.J. Antibacterial efficiency of graphene nanosheets against pathogenic bacteria via lipid peroxidation. J. Phys. Chem. C 2012, 116, 17280–17287. [Google Scholar] [CrossRef]
- Zhu, J.; Hou, J.; Zhang, Y.; Tian, M.; He, T.; Liu, J.; Chen, V. Polymeric antimicrobial membranes enabled by nanomaterials for water treatment. J. Memb. Sci. 2018, 550, 173–197. [Google Scholar] [CrossRef]
- Ji, H.; Sun, H.; Qu, X. Antibacterial applications of graphene-based nanomaterials: Recent achievements and challenges. Adv. Drug Deliv. Rev. 2016, 105, 176–189. [Google Scholar] [CrossRef] [PubMed]
- Zou, X.; Zhang, L.; Wang, Z.; Luo, Y. Mechanisms of the Antimicrobial Activities of Graphene Materials. J. Am. Chem. Soc. 2016, 138, 2064–2077. [Google Scholar] [CrossRef] [PubMed]
- Prusty, G.; Swain, S.K. Synthesis and Characterization of Conducting Gas Barrier Polyacrylonitrile/Graphite Nanocomposites. Polym. Compos. 2011, 32, 1336–1342. [Google Scholar] [CrossRef]
- Prince, J.A.; Bhuvana, S.; Anbharasi, V.; Ayyanar, N.; Boodhoo, K.V.K.; Singh, G. Ultra-wetting graphene-based membrane. J. Memb. Sci. 2016, 500, 76–85. [Google Scholar] [CrossRef]
- Mo, Y.; Yang, M.; Lu, Z.; Huang, F. Preparation and tribological performance of chemically-modified reduced graphene oxide/polyacrylonitrile composites. Compos. Part A Appl. Sci. Manuf. 2013, 54, 153–158. [Google Scholar] [CrossRef]
- Ruiz, V.; Pérez-Marquez, A.; Maudes, J.; Grande, H.-J.; Murillo, N. Enhanced photostability and sensing performance of graphene quantum dots encapsulated in electrospun polyacrylonitrile nanofibrous filtering membranes. Sens. Actuators B Chem. 2018, 262, 902–912. [Google Scholar] [CrossRef]
- Zhao, X.; Su, Y.; Chen, W.; Peng, J.; Jiang, Z. Grafting perfluoroalkyl groups onto polyacrylonitrile membrane surface for improved fouling release property. J. Memb. Sci. 2012, 415–416, 824–834. [Google Scholar] [CrossRef]
- Hummers, W.S.; Offeman, R.E. Preparation of Graphitic Oxide. J. Am. Chem. Soc. 1958, 80, 1339. [Google Scholar] [CrossRef]
- Hung, W.-S.; An, Q.-F.; De Guzman, M.; Lin, H.-Y.; Huang, S.-H.; Liu, W.-R.; Hu, C.-C.; Lee, K.-R.; Lai, J.-Y. Pressure-assisted self-assembly technique for fabricating composite membranes consisting of highly ordered selective laminate layers of amphiphilic graphene oxide. Carbon N. Y. 2014, 68, 670–677. [Google Scholar] [CrossRef]
- Fryczkowska, B.; Piprek, Z.; Sieradzka, M.; Fryczkowski, R.; Janicki, J.B. Preparation and Properties of Composite PAN/PANI Membranes. Int. J. Polym. Sci. 2017, 2017. [Google Scholar] [CrossRef]
- Zinadini, S.; Zinatizadeh, A.A.; Rahimi, M.; Vatanpour, V.; Zangeneh, H. Preparation of a novel antifouling mixed matrix PES membrane by embedding graphene oxide nanoplates. J. Memb. Sci. 2014, 453, 292–301. [Google Scholar] [CrossRef]
- Wypych, G. Handbook of Polymers; ChemTec Publishing: Toronto, ON, Canada, 2012; Volume 5, ISBN 9781895198478. [Google Scholar]
- Rabiej, M. Application of the particle swarm optimization method for the analysis of wide-angle X-ray diffraction curves of semicrystalline polymers. J. Appl. Crystallogr. 2017, 50, 221–230. [Google Scholar] [CrossRef]
- Khorramdel, H.; Dabiri, E.; Tabrizi, F.F.; Galehdari, M. Synthesis and characterization of graphene acid membrane with ultrafast and selective water transport channels. Sep. Purif. Technol. 2019, 212, 497–504. [Google Scholar] [CrossRef]
- Berg, J.; Tymoczko, J.; Stryer, L. Biochemistry, 5th ed.; Freeman WH & Company: New York, NY, USA, 2007; ISBN 0-7167-3051-0. [Google Scholar]
- Pham, V.T.H.; Truong, V.K.; Quinn, M.D.J.; Notley, S.M.; Guo, Y.; Baulin, V.A.; Al Kobaisi, M.; Crawford, R.J.; Ivanova, E.P. Graphene Induces Formation of Pores That Kill Spherical and Rod-Shaped Bacteria. ACS Nano 2015, 9, 8458–8467. [Google Scholar] [CrossRef]
- Li, J.; Wang, G.; Zhu, H.; Zhang, M.; Zheng, X.; Di, Z.; Liu, X.; Wang, X. Antibacterial activity of large-area monolayer graphene film manipulated by charge transfer. Sci. Rep. 2014, 4, 4359. [Google Scholar] [CrossRef]
- Hegab, H.M.; Elmekawy, A.; Zou, L.; Mulcahy, D.; Saint, C.P.; Ginic-Markovic, M. The controversial antibacterial activity of graphene-based materials. Carbon N. Y. 2016, 105, 362–376. [Google Scholar] [CrossRef]
- Gurunathan, S.; Han, J.W.; Abdal Dayem, A.; Eppakayala, V.; Kim, J.H. Oxidative stress-mediated antibacterial activity of graphene oxide and reduced graphene oxide in Pseudomonas aeruginosa. Int. J. Nanomedicine 2012, 7, 5901–5914. [Google Scholar] [CrossRef]
- Pinto, A.M.; Gonçalves, I.C.; Magalhães, F.D. Graphene-based materials biocompatibility: A review. Colloids Surf. B Biointerfaces 2013, 111, 188–202. [Google Scholar] [CrossRef] [PubMed]
- Karkooti, A.; Yazdi, A.Z.; Chen, P.; McGregor, M.; Nazemifard, N.; Sadrzadeh, M. Development of advanced nanocomposite membranes using graphene nanoribbons and nanosheets for water treatment. J. Memb. Sci. 2018, 560, 97–107. [Google Scholar] [CrossRef]
- Song, N.; Gao, X.; Ma, Z.; Wang, X.; Wei, Y.; Gao, C. A review of graphene-based separation membrane: Materials, characteristics, preparation and applications. Desalination 2018, 437, 59–72. [Google Scholar] [CrossRef]
- Shen, L.; Li, Y.; Zhao, W.; Wang, K.; Ci, X.; Wu, Y.; Liu, G.; Liu, C.; Fang, Z. Tuning F-doped degree of rGO: Restraining corrosion-promotion activity of EP/rGO nanocomposite coating. J. Mater. Sci. Technol. 2020, 44, 121–132. [Google Scholar] [CrossRef]
- Winey, K.I.; Vaia, R.A. Polymer nanocomposites. MRS Bull. 2007, 32, 314–358. [Google Scholar] [CrossRef]
- Michell, R.M.; Müller, A.J. Confined crystallization of polymeric materials. Prog. Polym. Sci. 2016, 54–55, 183–213. [Google Scholar] [CrossRef]
- Zhao, X.; Zhang, R.; Liu, Y.; He, M.; Su, Y.; Gao, C.; Jiang, Z. Antifouling membrane surface construction: Chemistry plays a critical role. J. Memb. Sci. 2018, 551, 145–171. [Google Scholar] [CrossRef]


| Type of Membrane | Amount of rGO [g] | Amount of PAN [g] | Amount of DMF [g] | Conc. of rGO [% w/w] | Conc. of PAN [% w/w] |
|---|---|---|---|---|---|
| 0 | 0 | 12.0 | 88.0 | 0 | 100.0 |
| A | 0.0135 | 12.0 | 87.9865 | 0.11 | 99.89 |
| B | 0.027 | 12.0 | 87.973 | 0.22 | 99.78 |
| C | 0.054 | 12.0 | 87.946 | 0.45 | 99.55 |
| D | 0.1 | 12.0 | 87.9 | 0.83 | 99.27 |
| E | 0.5 | 12.0 | 87.5 | 4.0 | 96.0 |
| F | 1.0 | 12.0 | 87.0 | 7.7 | 92.3 |
| G | 2.0 | 12.0 | 86.0 | 14.3 | 85.7 |
| H | 5.0 | 12.0 | 83.0 | 29.4 | 70.6 |
| Membrane | l [µm] | Ws [g/cm2] | dm [g/cm3] | U [%] | ε [%] | θ [deg] |
|---|---|---|---|---|---|---|
| 0 | 190.1 ± 9.3 | 0.00322 ± 0.00021 | 0.170 ± 0.016 | 249.0 ± 20.6 | 74.5 ± 2.3 | 52.0 ± 2.8 |
| A | 198.8 ± 13.9 | 0.00300 ± 0.00019 | 0.151 ± 0.009 | 259.1 ± 18.4 | 74.6 ± 3.7 | 49.5 ± 2.7 |
| B | 188.9 ± 12.1 | 0.00300 ± 0.00023 | 0.159 ± 0.007 | 261.5 ± 19.9 | 75.1 ± 3.5 | 47.3 ± 4.1 |
| C | 182.5 ± 8.6 | 0.00264 ± 0.00017 | 0.145 ± 0.015 | 289.5 ± 25.5 | 76.9 ± 4.0 | 48.2 ± 2.7 |
| D | 182.8 ± 13.1 | 0.00256 ± 0.00014 | 0.140 ± 0.008 | 325.1 ± 20.9 | 77.0 ± 4.3 | 45.2 ± 2.6 |
| E | 170.7 ± 9.8 | 0.00246 ± 0.00019 | 0.144 ± 0.016 | 329.8 ± 23.5 | 79.4 ± 2.6 | 40.7 ± 3.3 |
| F | 169.6 ± 14.5 | 0.00252 ± 0.00017 | 0.149 ± 0.015 | 329.0 ± 18.3 | 79.1 ± 1.9 | 42.9 ± 4.3 |
| G | 168.8 ± 12.9 | 0.00258 ± 0.00023 | 0.153 ± 0.015 | 241.1 ± 25.5 | 78.8 ± 3.4 | 45.8 ± 4.0 |
| H | 167.6 ± 8.6 | 0.00290 ± 0.00017 | 0.173 ± 0.013 | 209.3 ± 24.4 | 75.3 ± 2.0 | 47.3 ± 4.6 |
| Membrane | Tg1 [°C] | Tg2 [°C] | Tm [°C] |
|---|---|---|---|
| 0 | 68.6 | 125.7 | 287.2 |
| A | 64.8 | not visible | 290.8 |
| B | 63.8 | 120.3 | 290.7 |
| C | 64.7 | 124.6 | 289.9 |
| F | 70.2 | 125.3 | 290.7 |
| H | 69.4 | 119.5 | 290.2 |
© 2020 by the authors. Licensee MDPI, Basel, Switzerland. This article is an open access article distributed under the terms and conditions of the Creative Commons Attribution (CC BY) license (http://creativecommons.org/licenses/by/4.0/).
Share and Cite
Fryczkowska, B.; Machnicka, A.; Biniaś, D.; Ślusarczyk, C.; Fabia, J. The Influence of Graphene Addition on the Properties of Composite rGO/PAN Membranes and Their Potential Application for Water Disinfection. Membranes 2020, 10, 58. https://doi.org/10.3390/membranes10040058
Fryczkowska B, Machnicka A, Biniaś D, Ślusarczyk C, Fabia J. The Influence of Graphene Addition on the Properties of Composite rGO/PAN Membranes and Their Potential Application for Water Disinfection. Membranes. 2020; 10(4):58. https://doi.org/10.3390/membranes10040058
Chicago/Turabian StyleFryczkowska, Beata, Alicja Machnicka, Dorota Biniaś, Czesław Ślusarczyk, and Janusz Fabia. 2020. "The Influence of Graphene Addition on the Properties of Composite rGO/PAN Membranes and Their Potential Application for Water Disinfection" Membranes 10, no. 4: 58. https://doi.org/10.3390/membranes10040058
APA StyleFryczkowska, B., Machnicka, A., Biniaś, D., Ślusarczyk, C., & Fabia, J. (2020). The Influence of Graphene Addition on the Properties of Composite rGO/PAN Membranes and Their Potential Application for Water Disinfection. Membranes, 10(4), 58. https://doi.org/10.3390/membranes10040058