Analysis of Dynamics Targeting CNT-Based Drug Delivery through Lung Cancer Cells: Design, Simulation, and Computational Approach


Abstract

1. Introduction
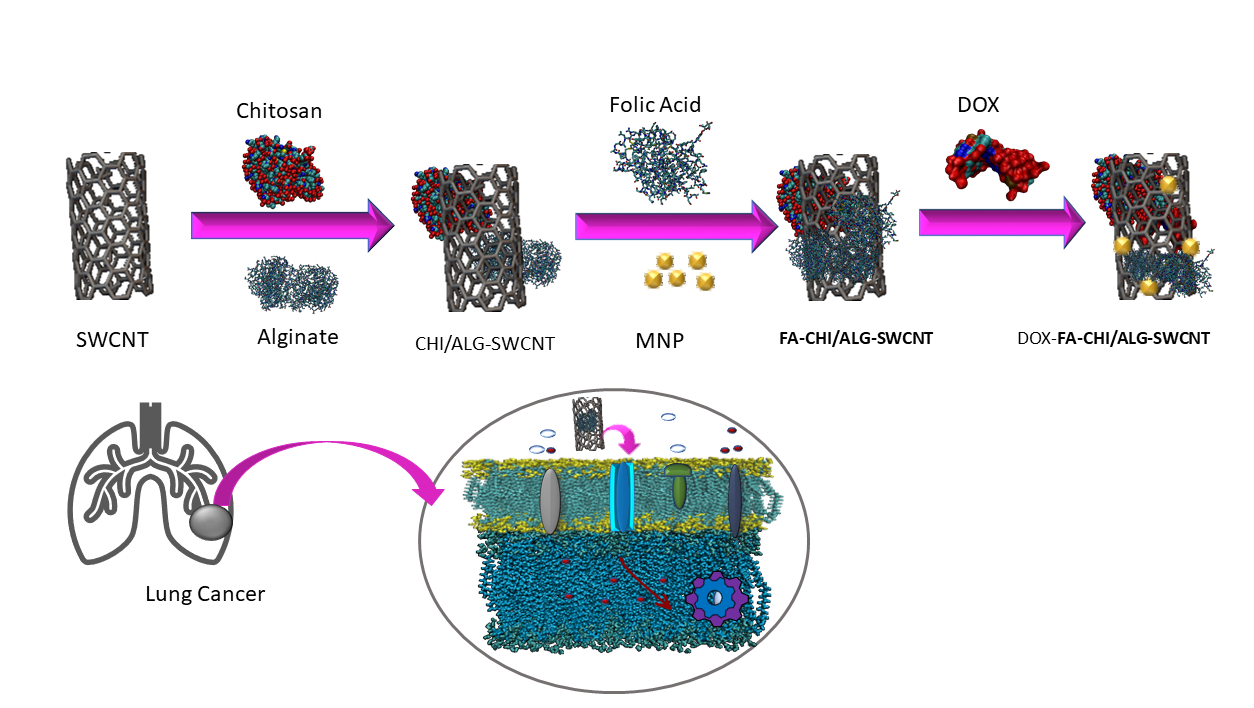
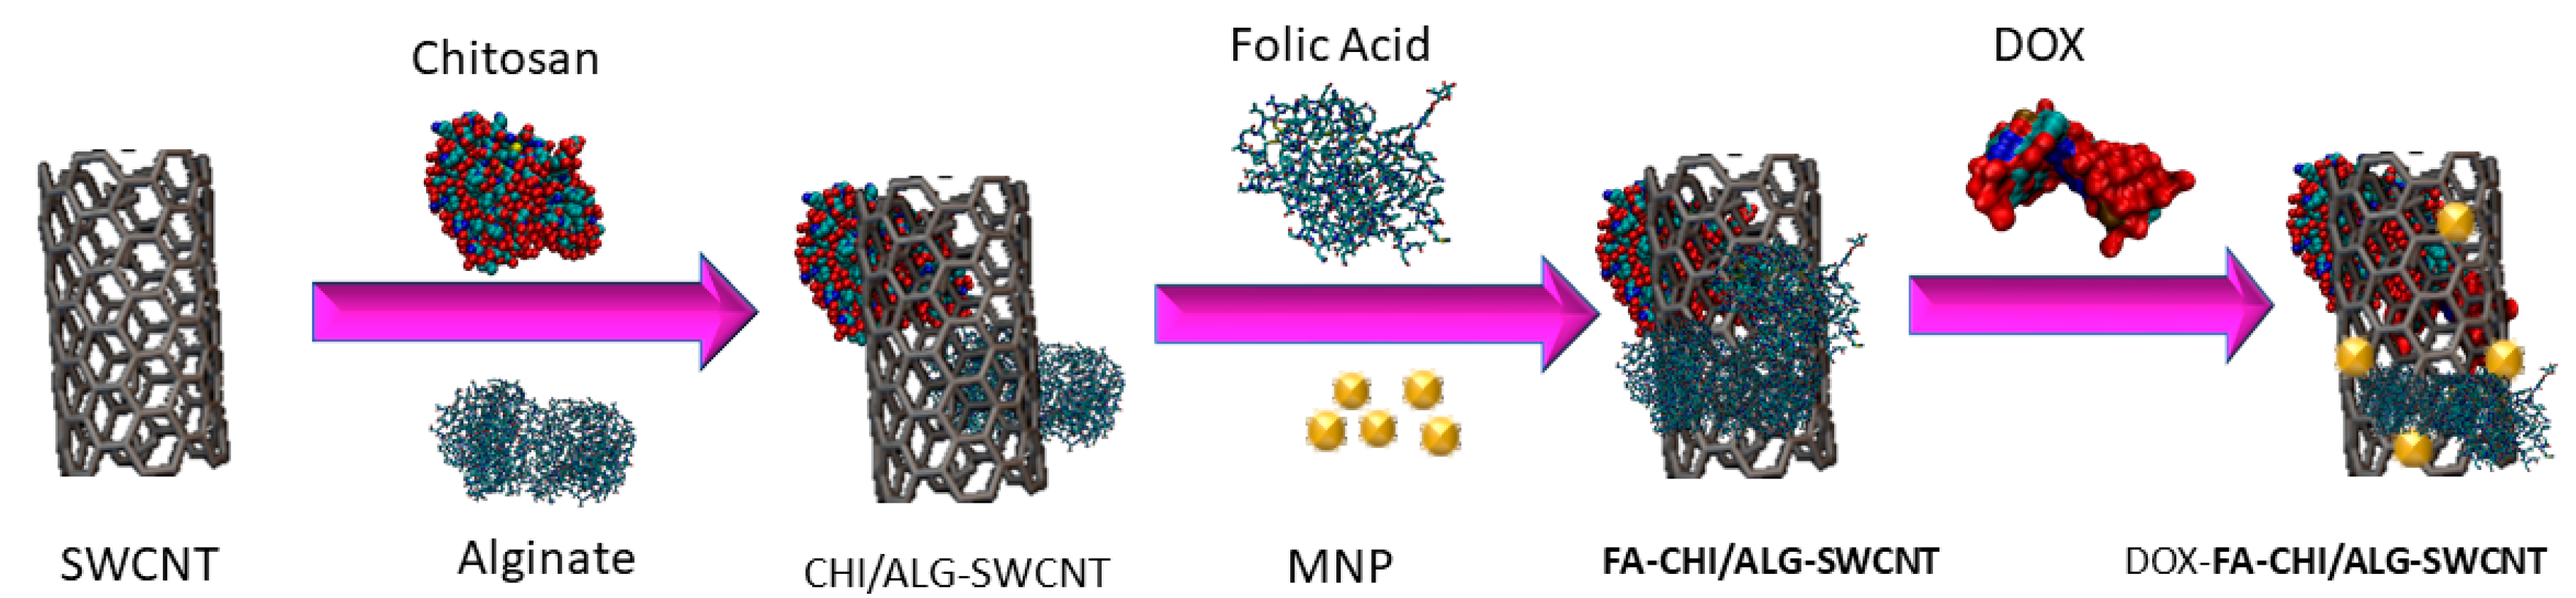
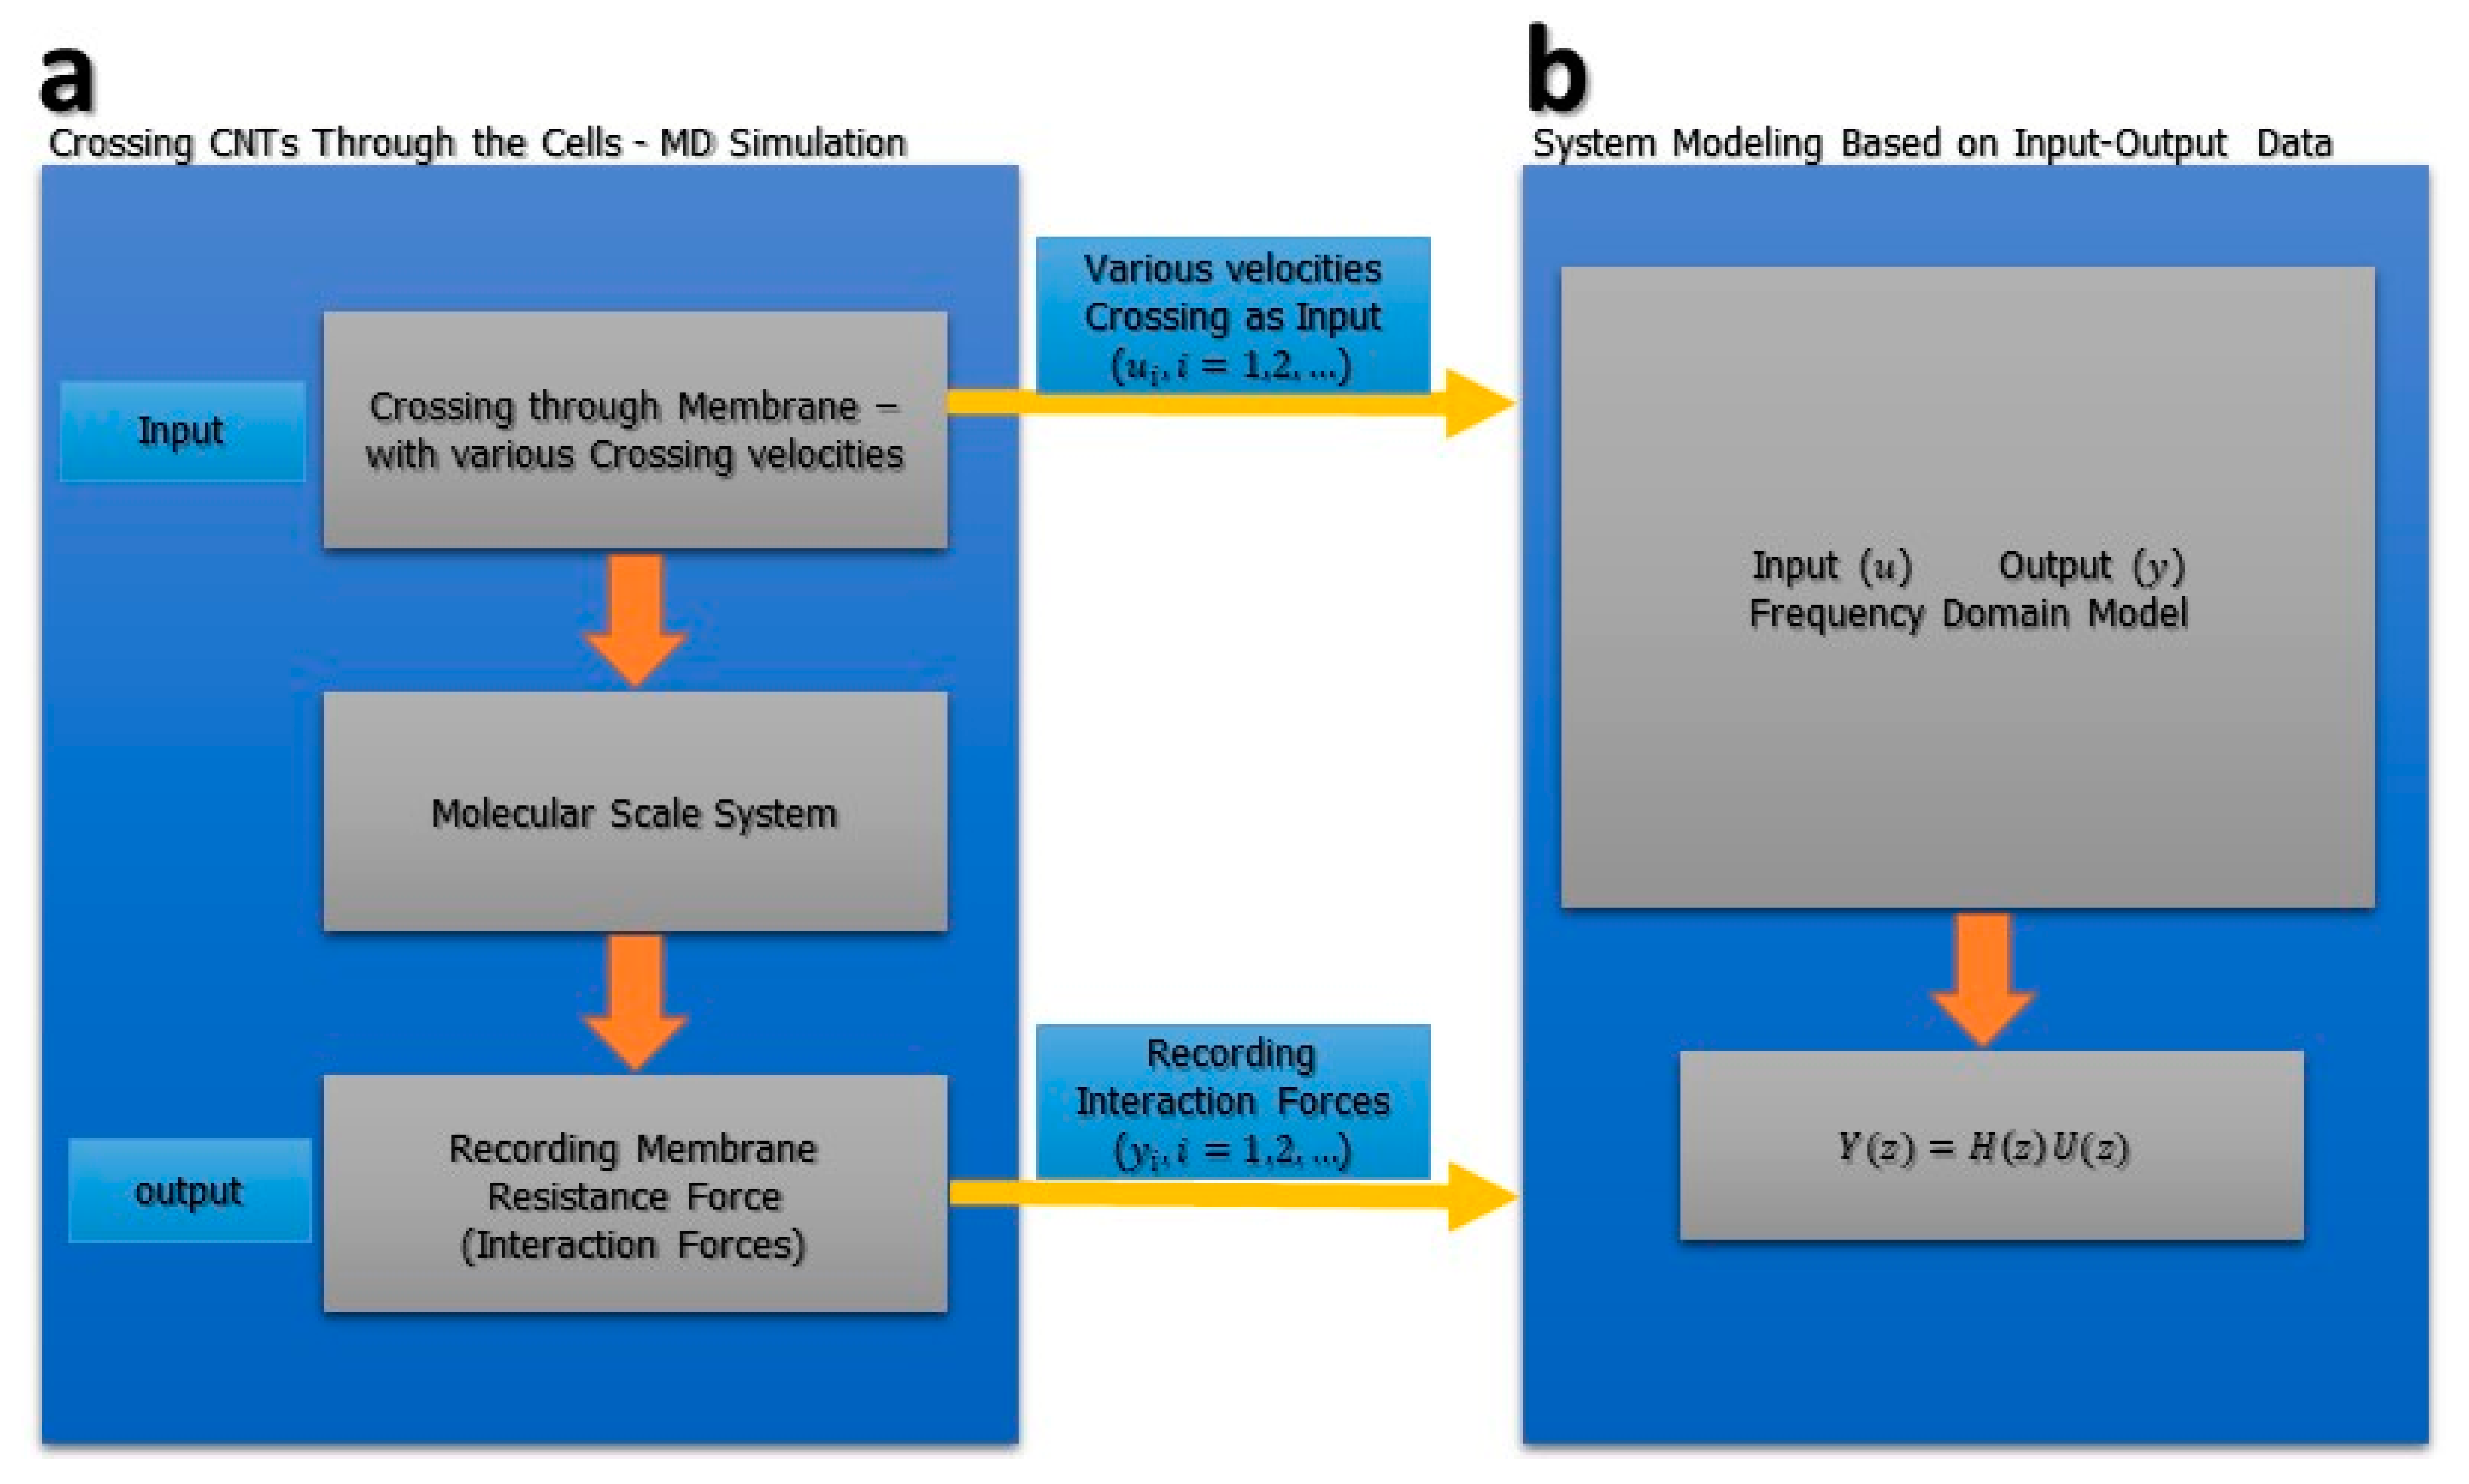
2. Methodology
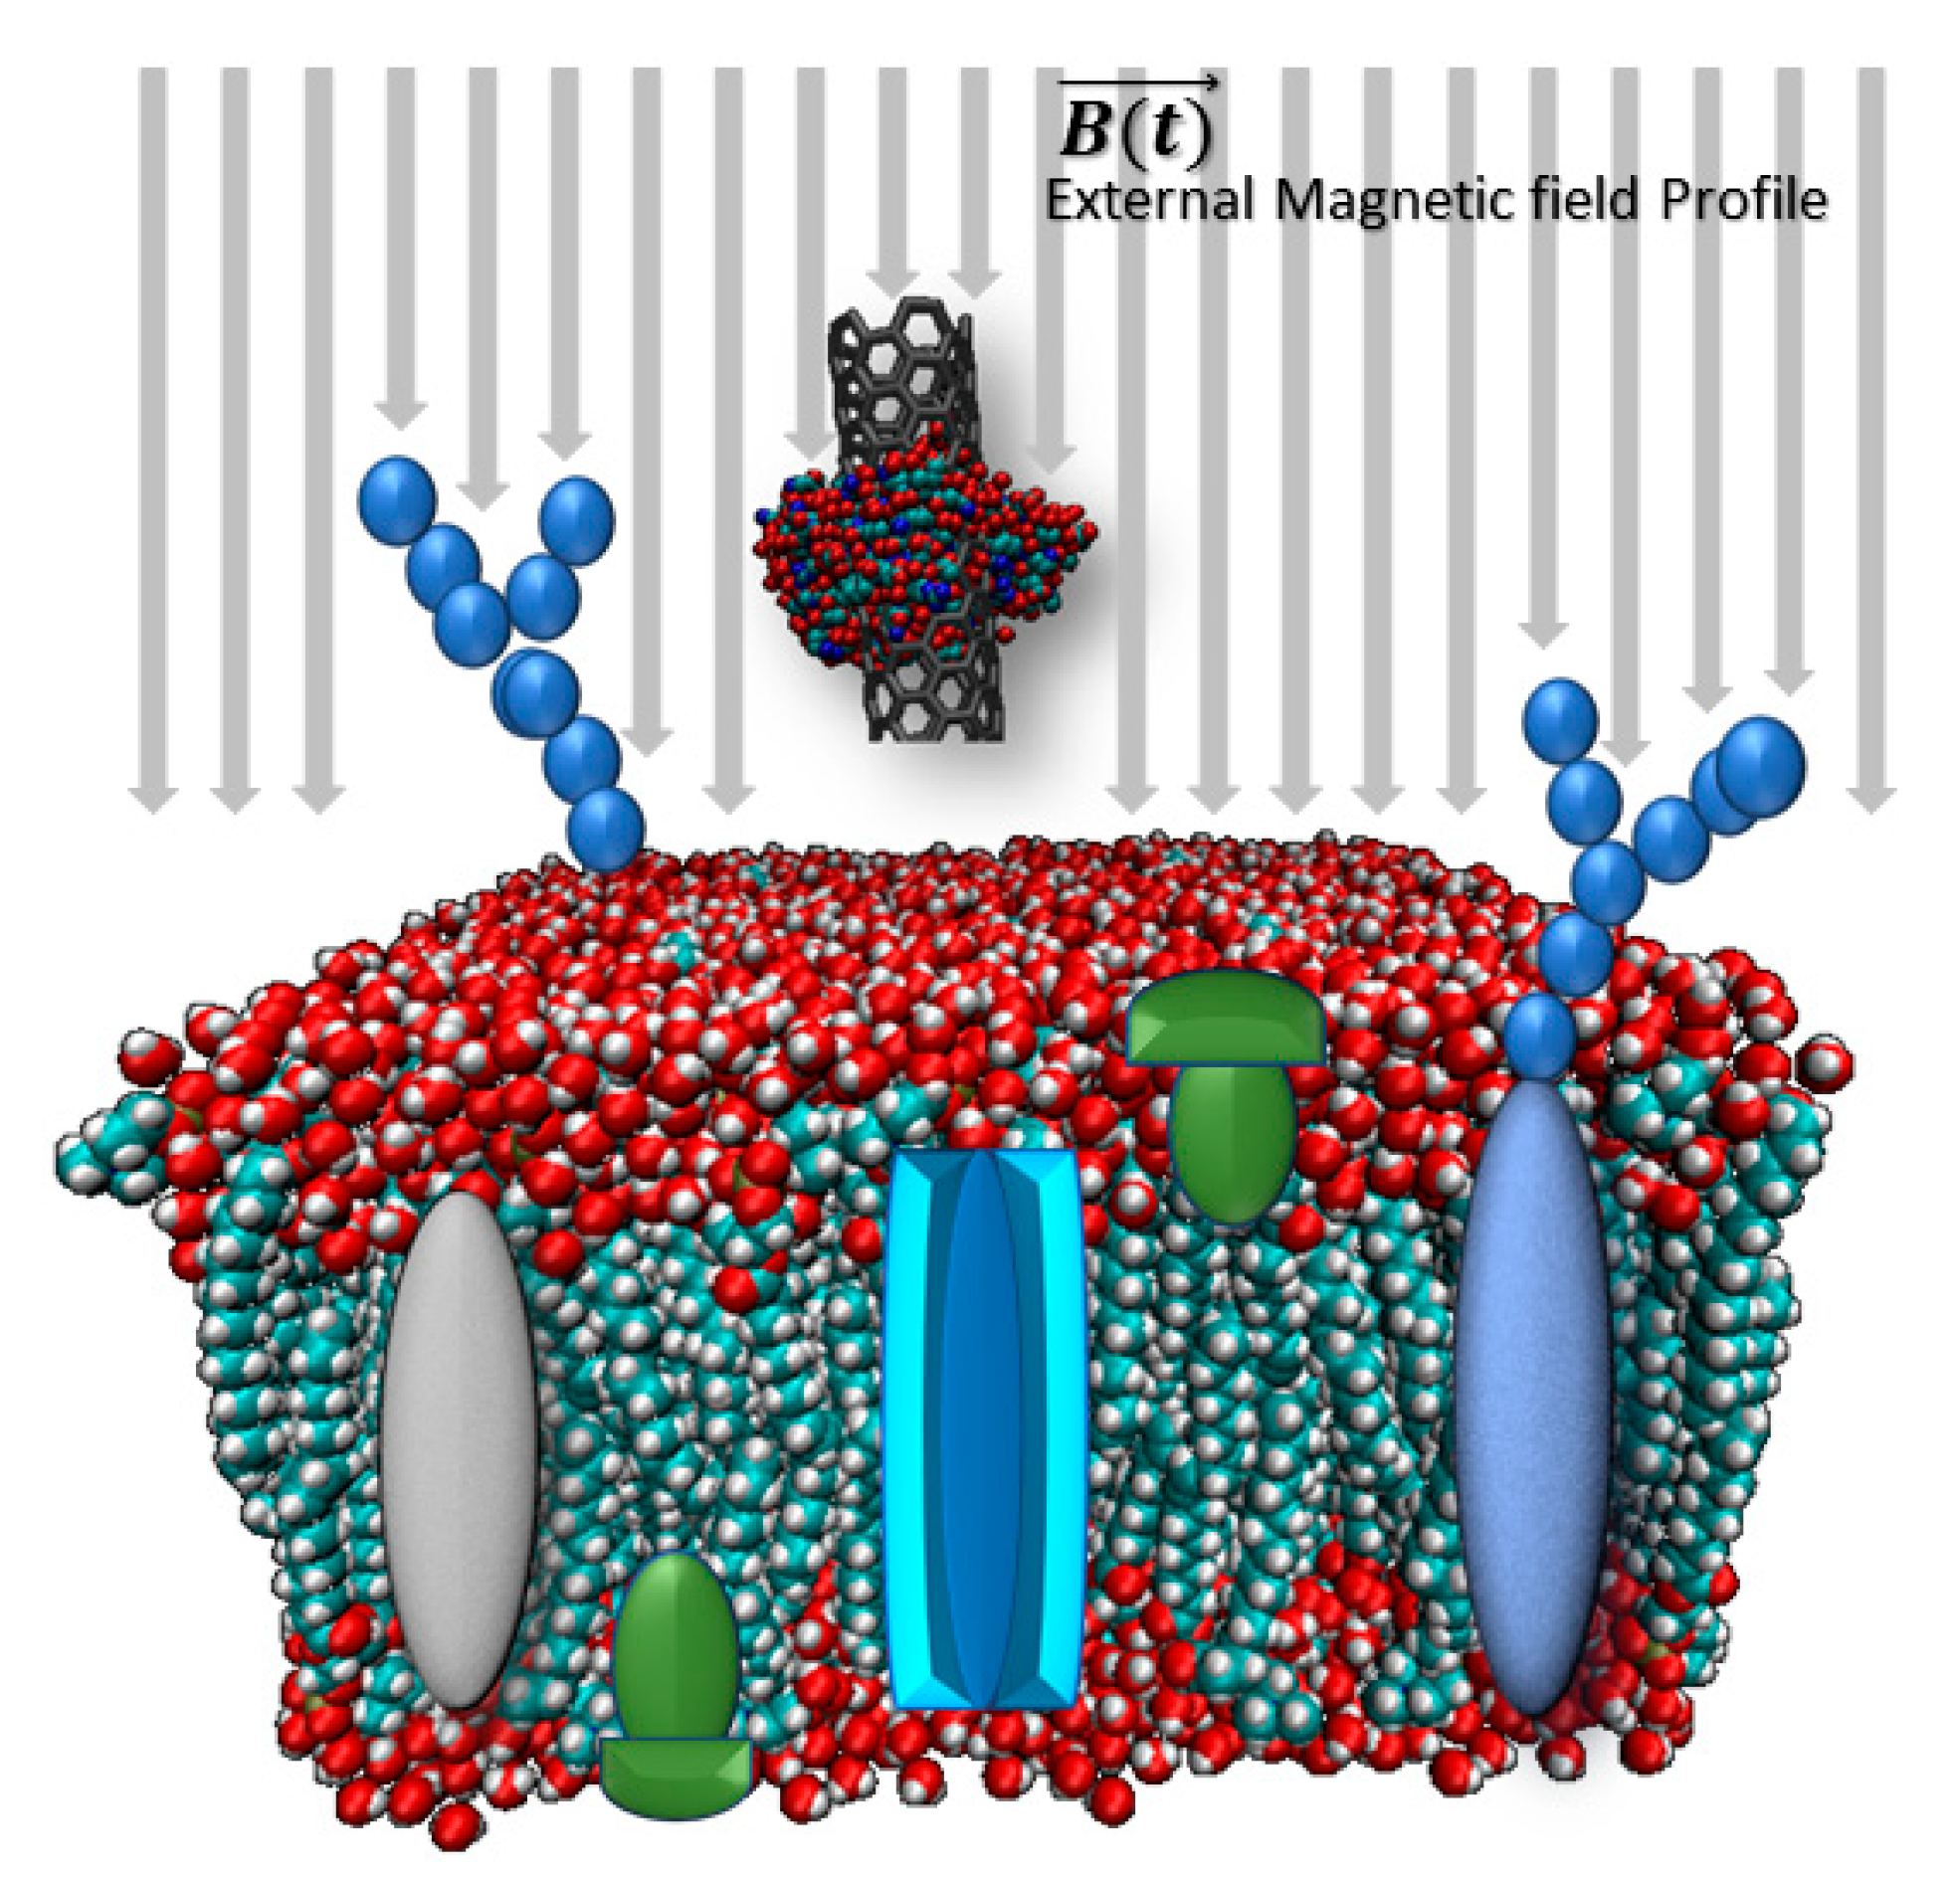
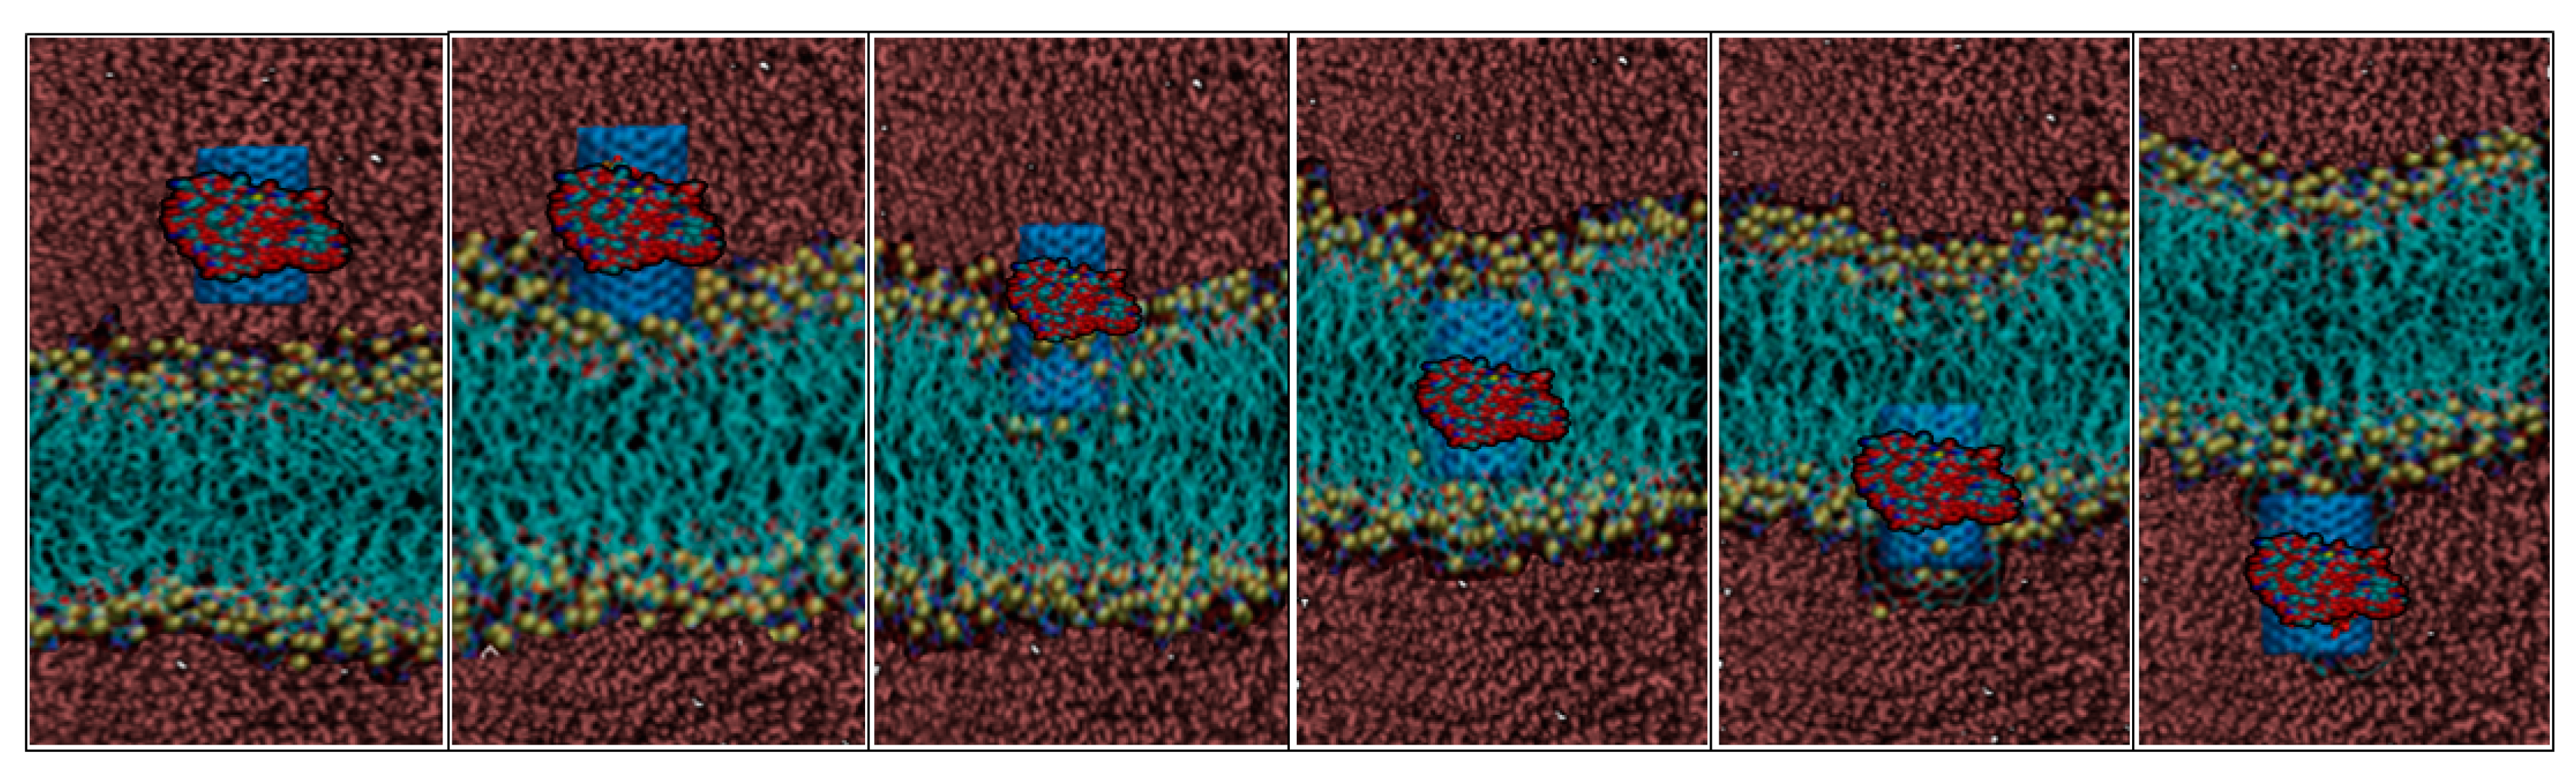
2.1. Crossing through the Cell Membrane
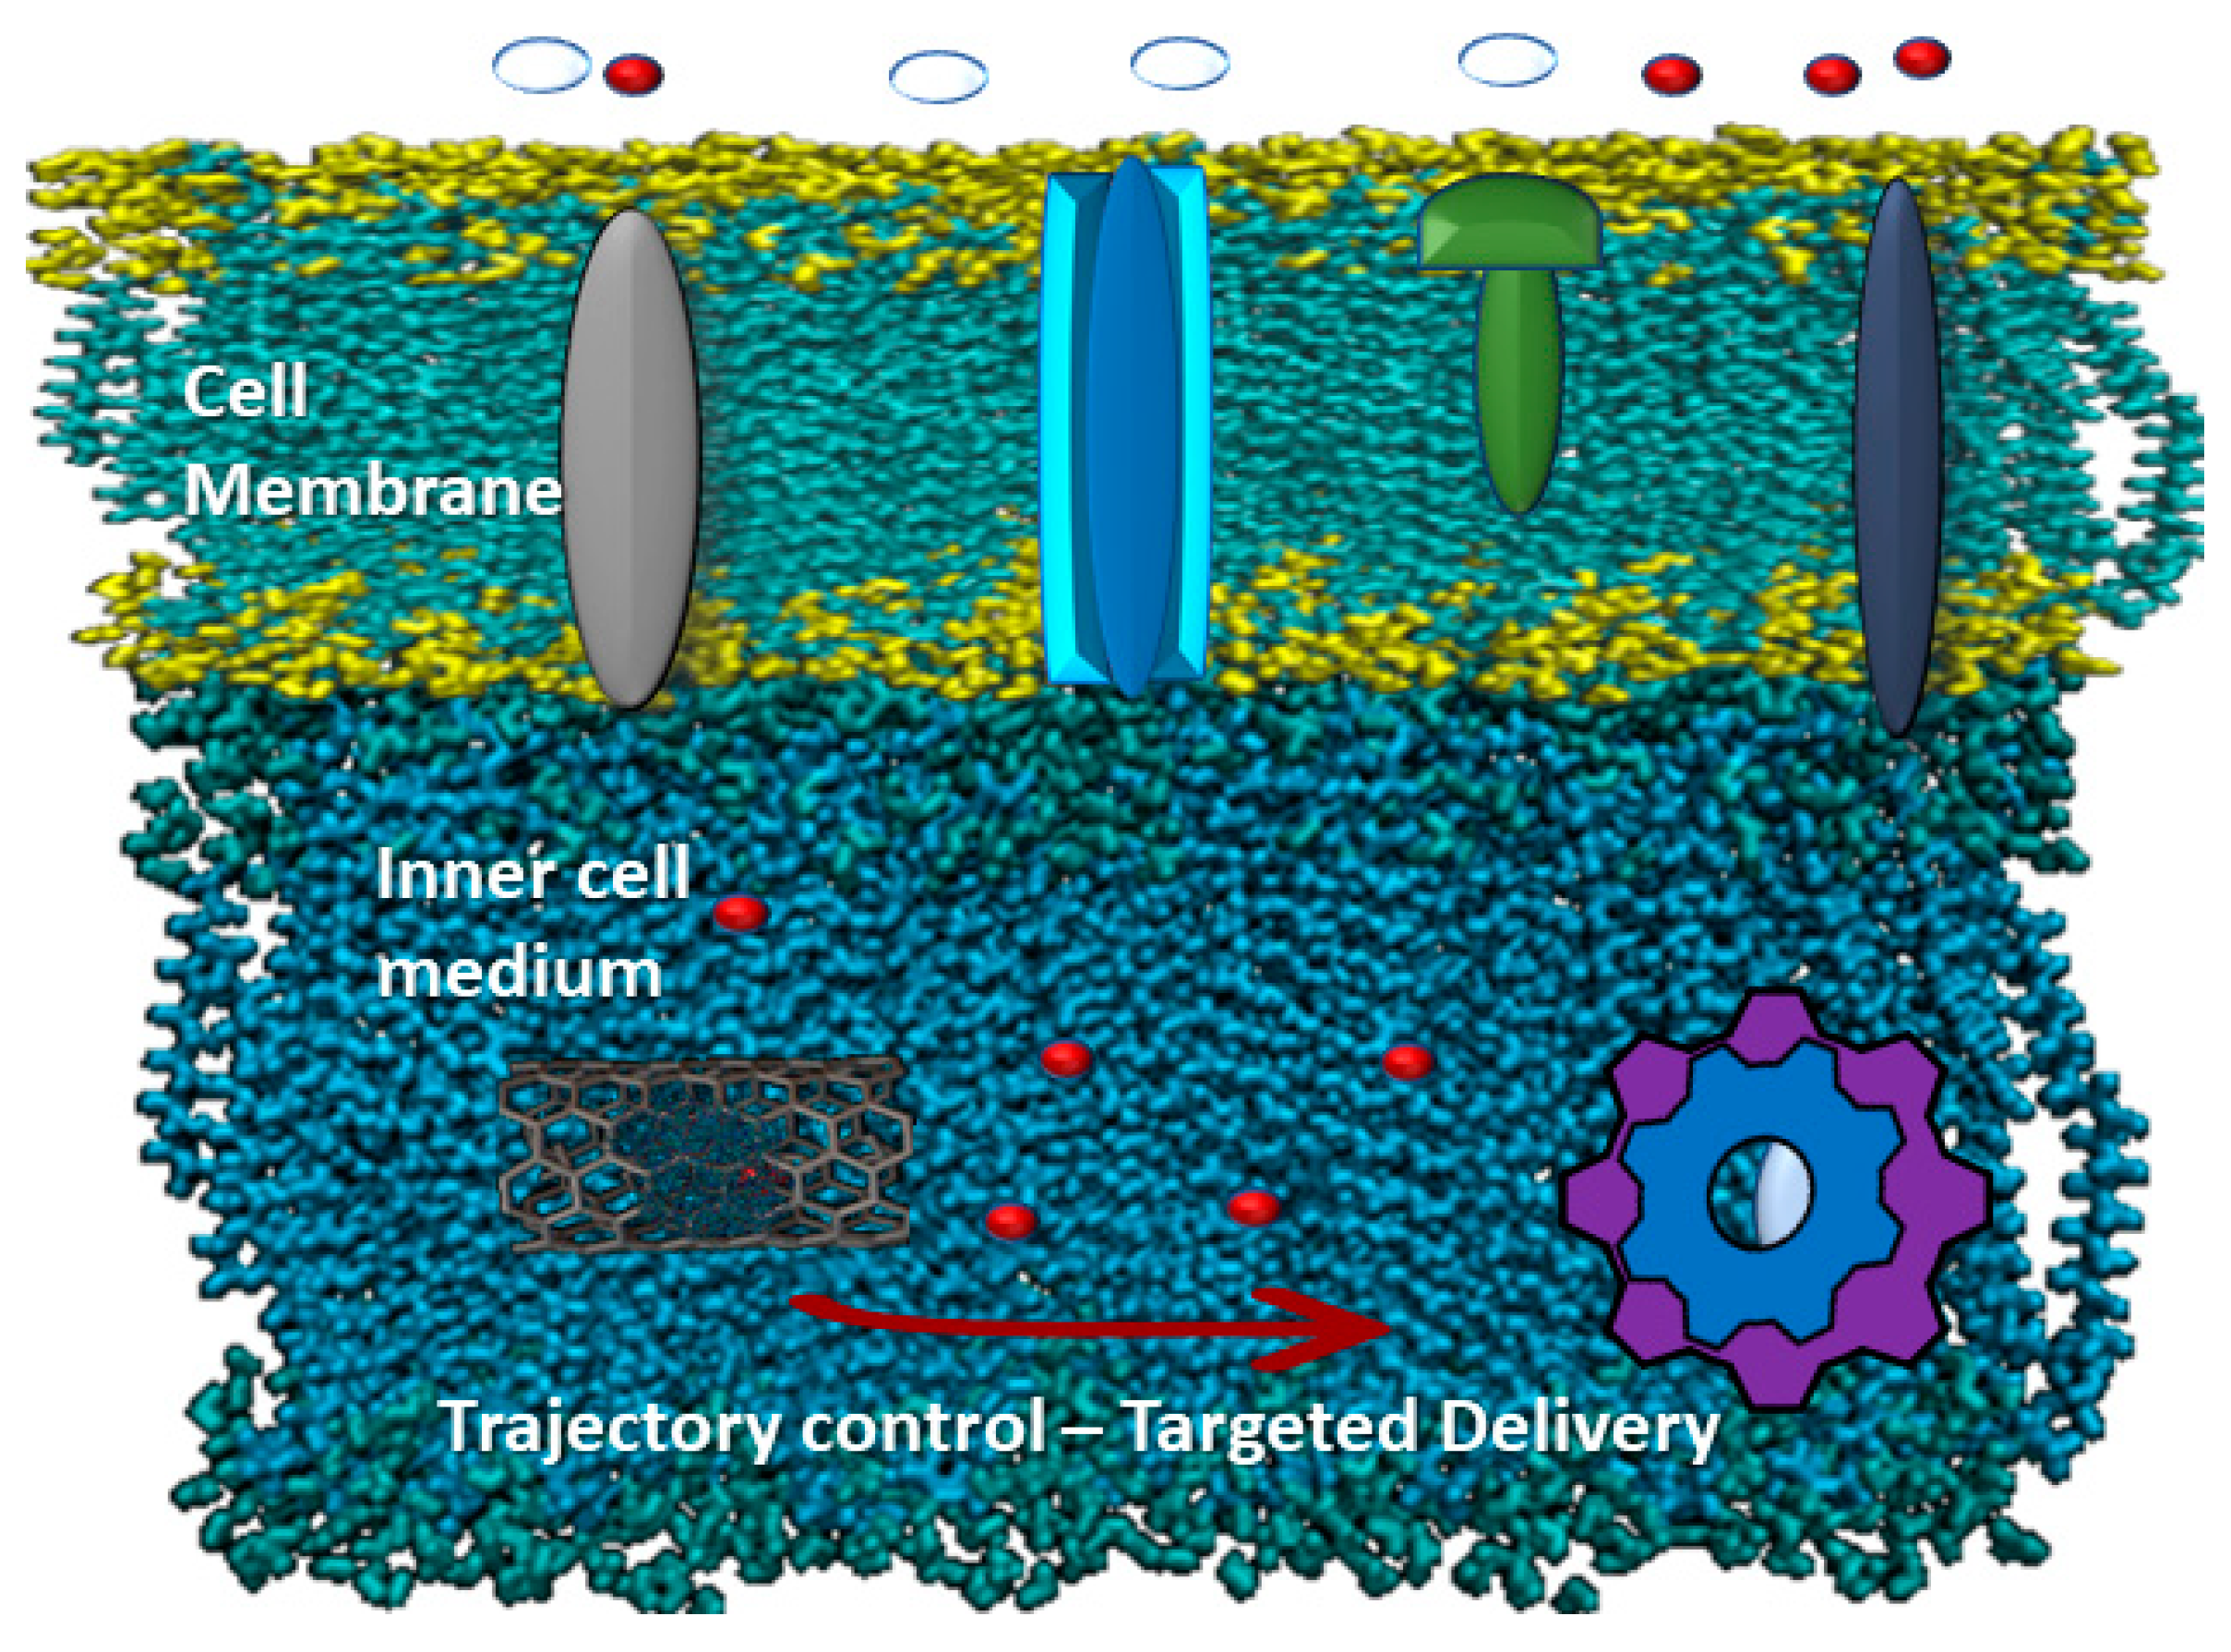
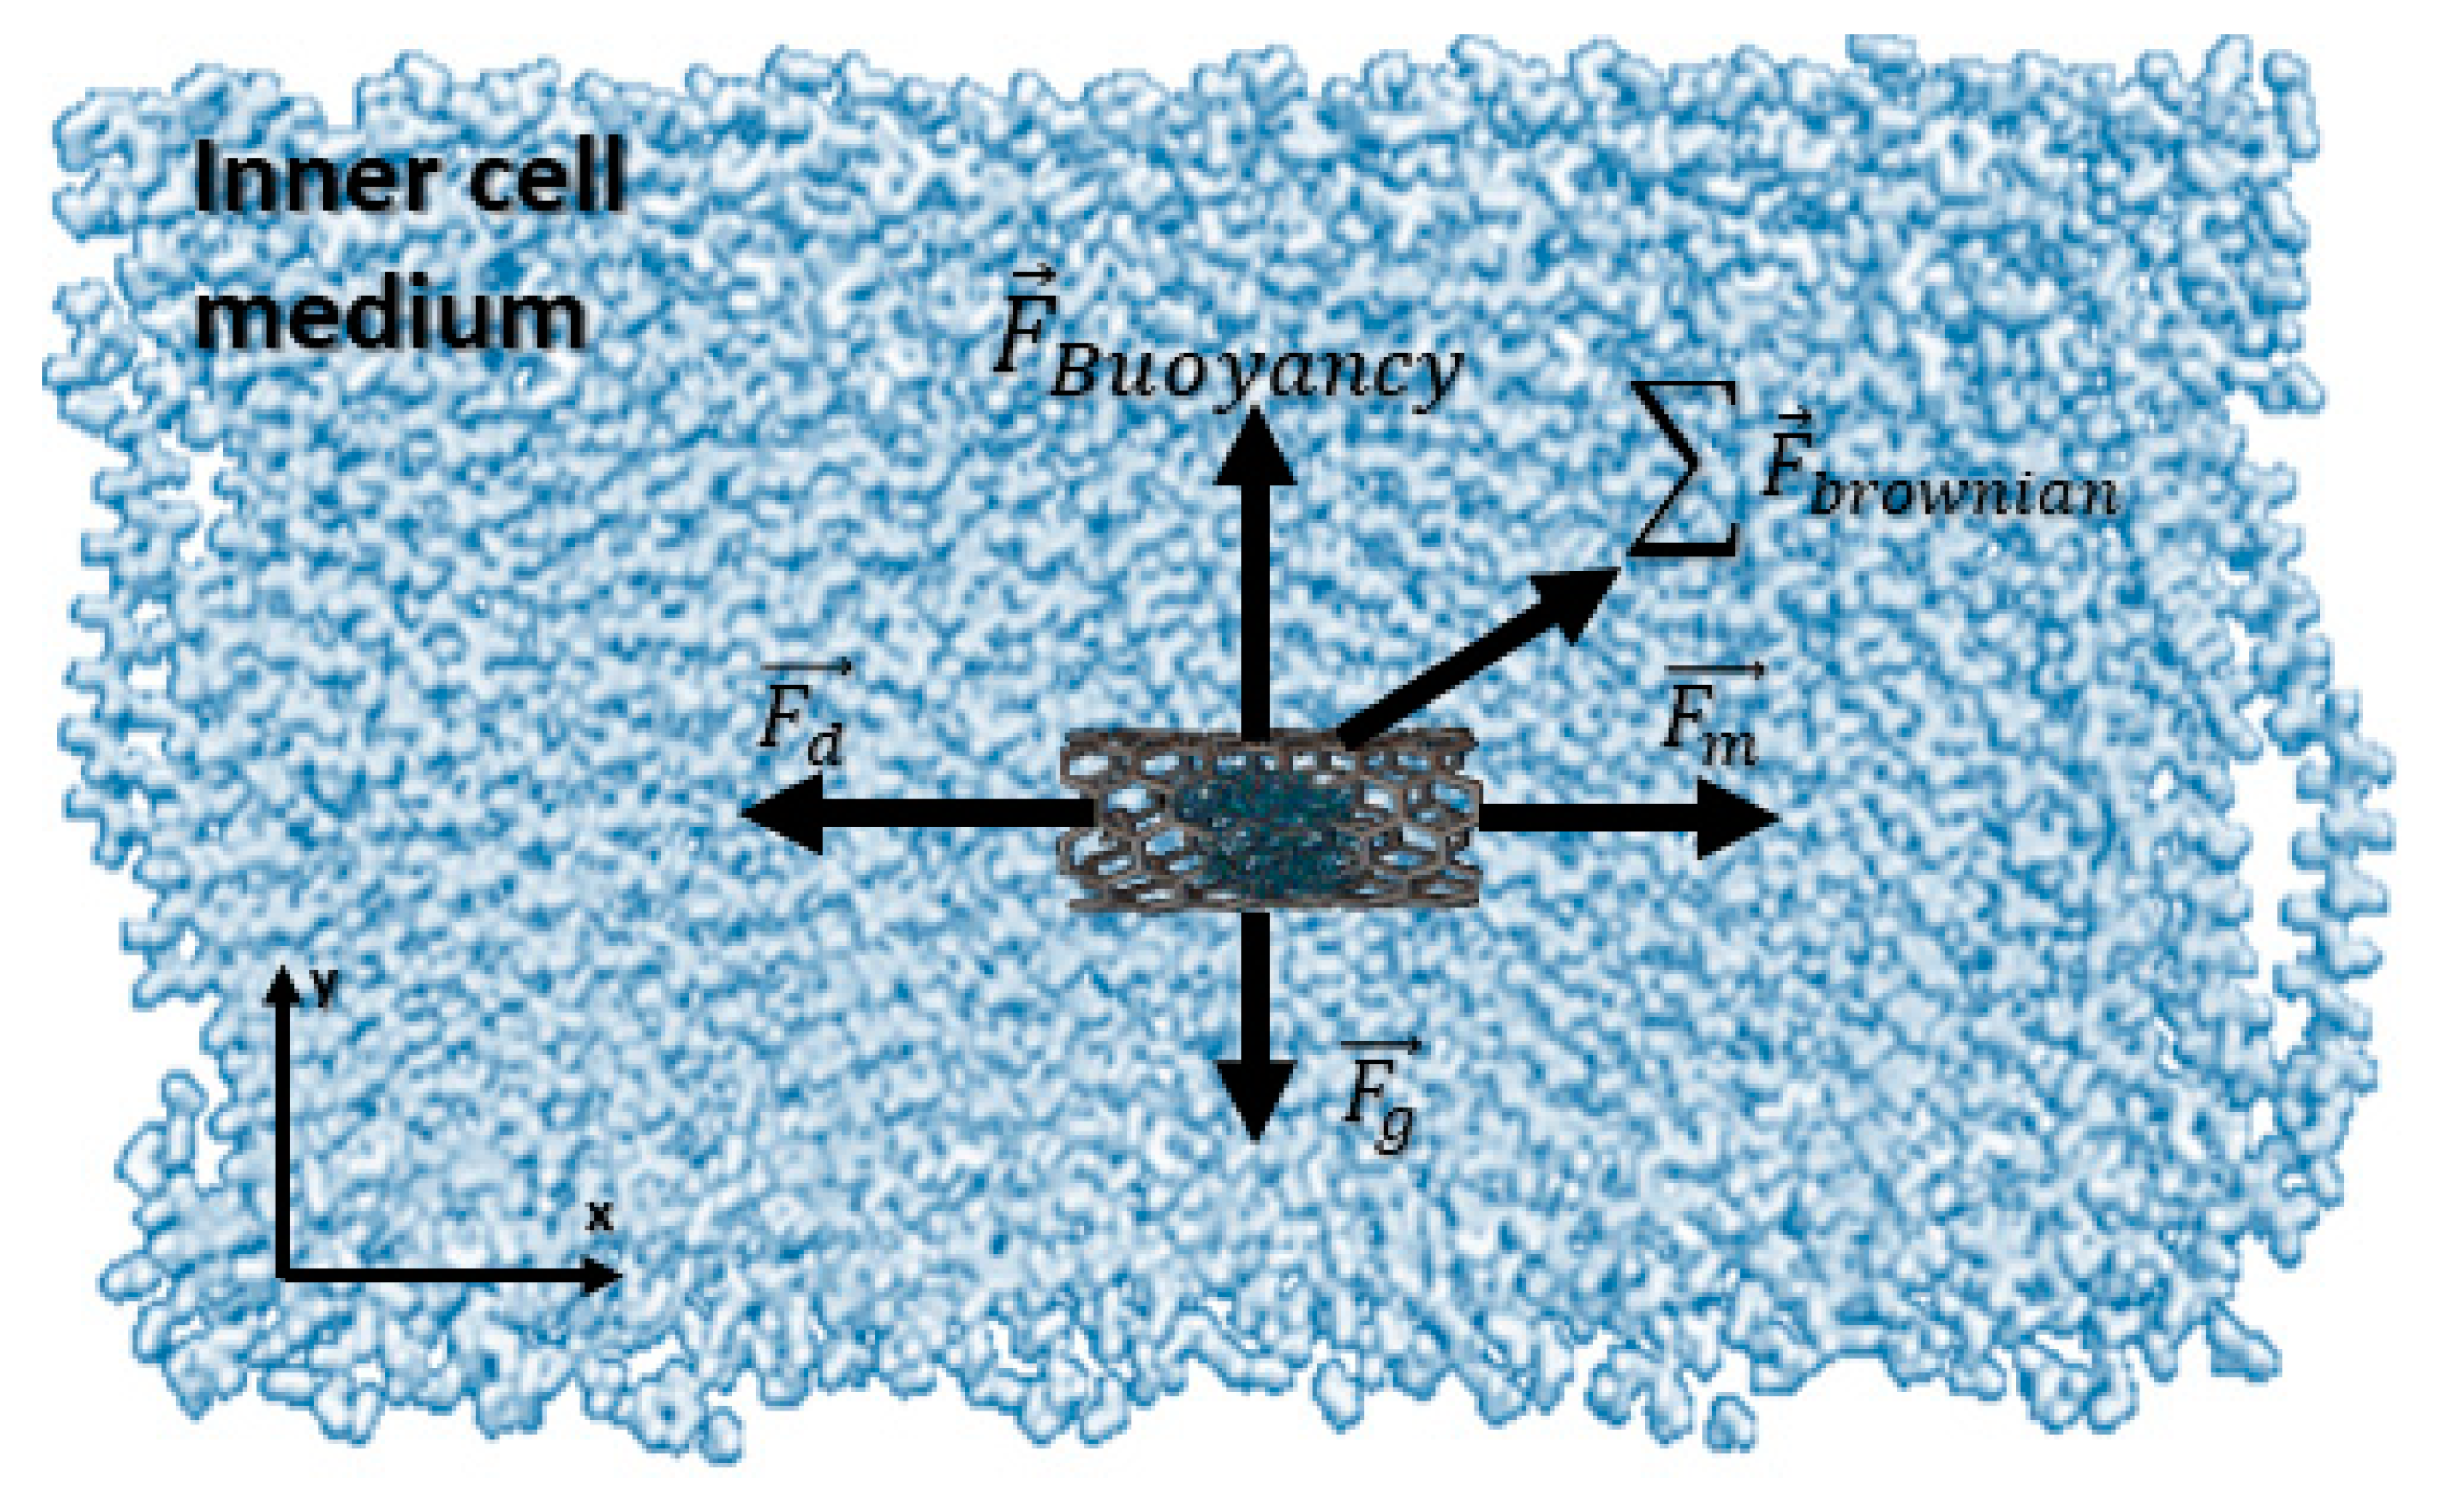
2.2. Controlling inside the Cell
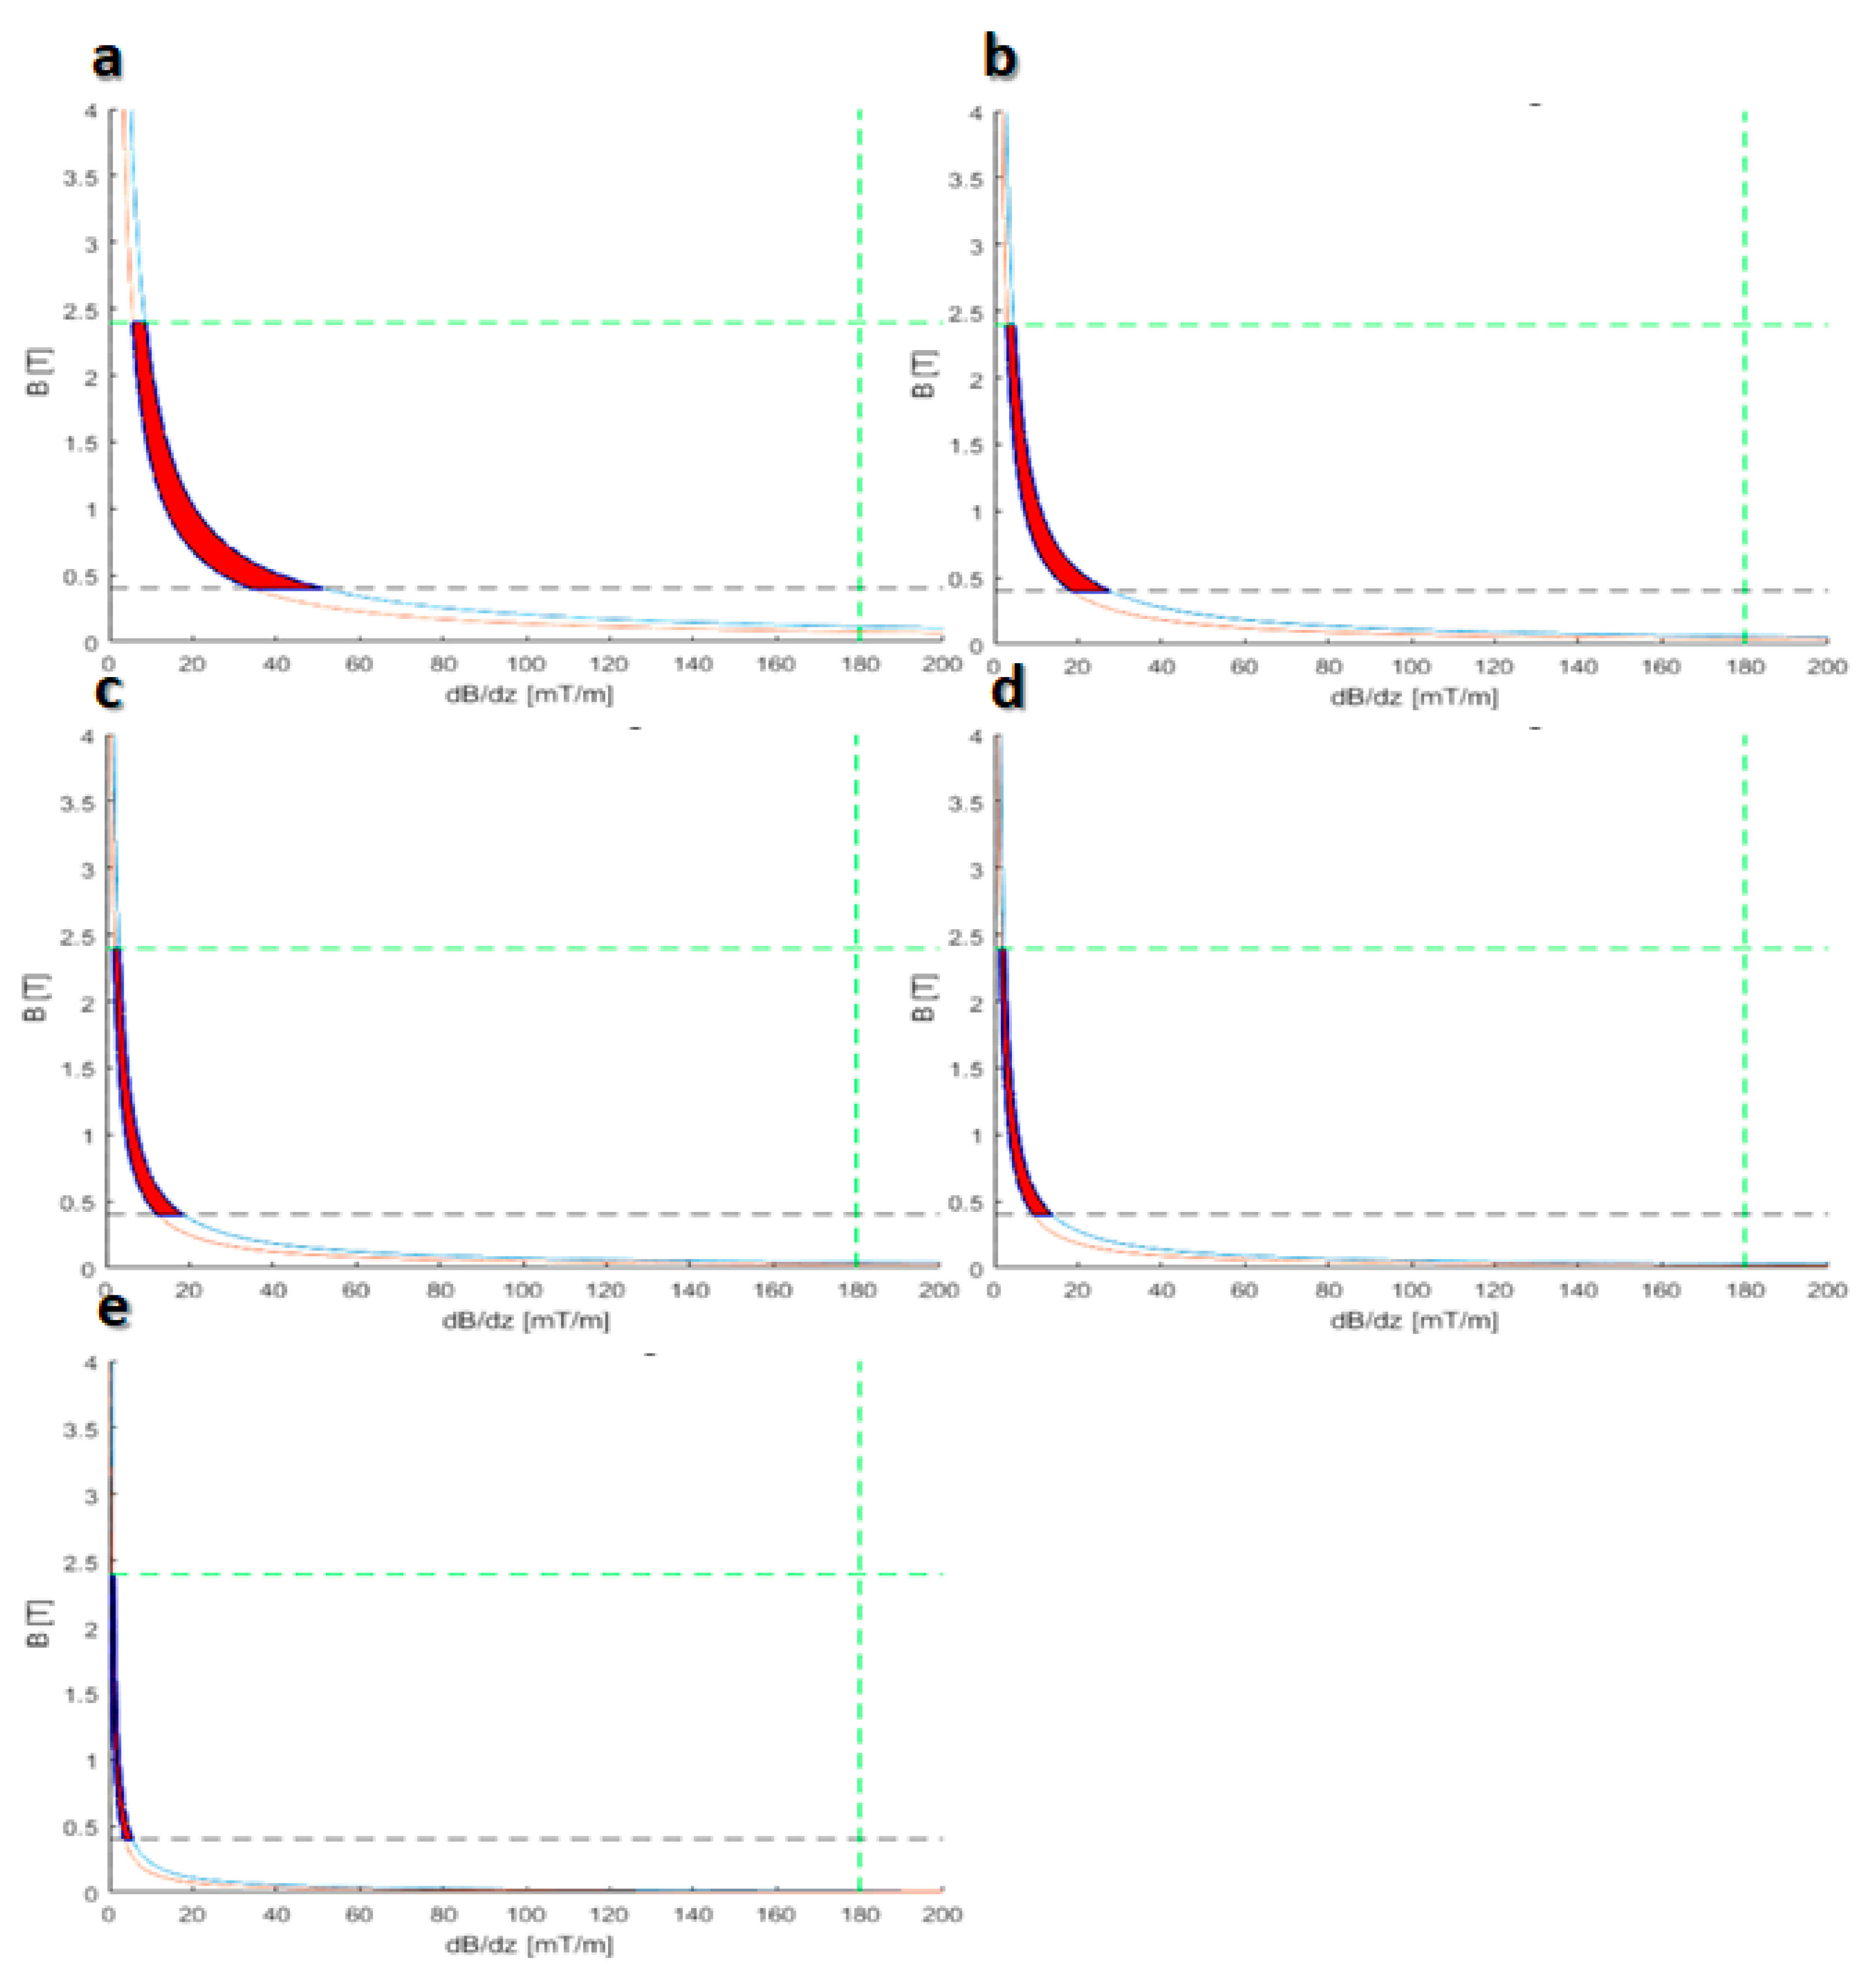
2.3. Profile of Magnetic Field
- Minimum the crossing time and energy;
- Controlling the maximum peak of the magnetic field to be in a healthy range;
- Controlling the maximum peak of the magnetic gradient to be in a healthy range;
- Proper trajectory control of the drug capsule inside the cell.
3. Mathematics and Modeling
3.1. Proposed Carbon NanoTube Model
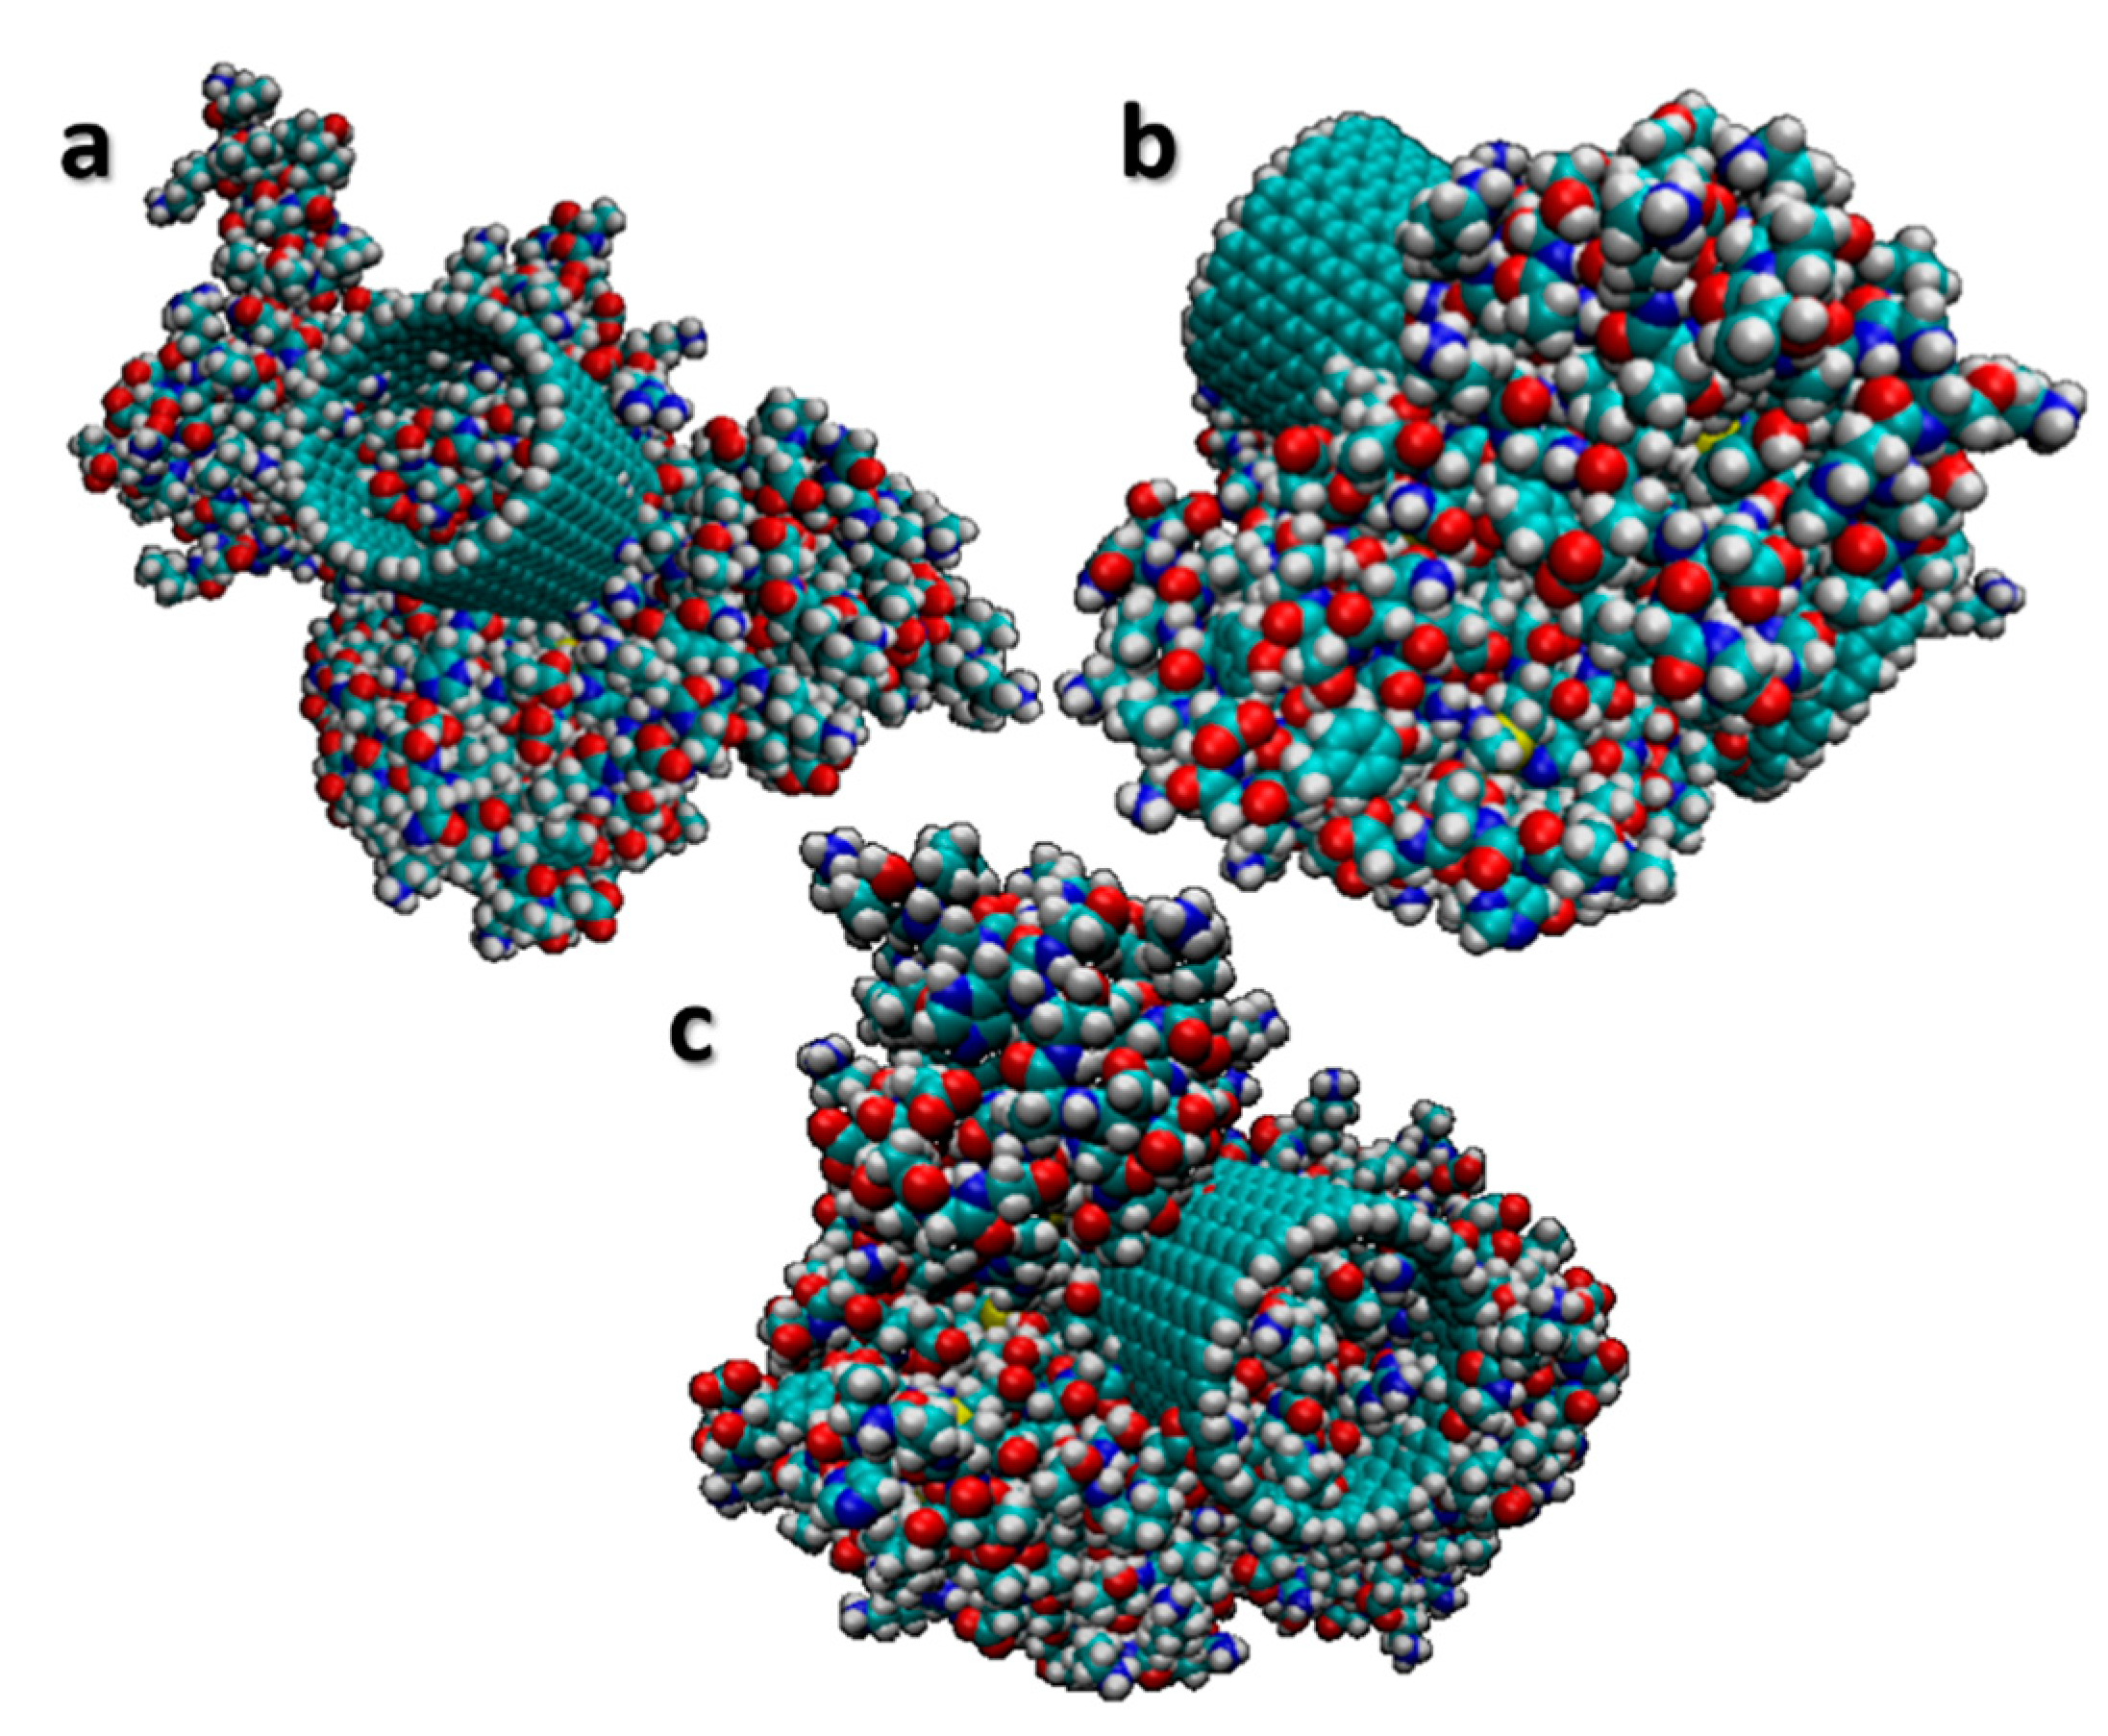
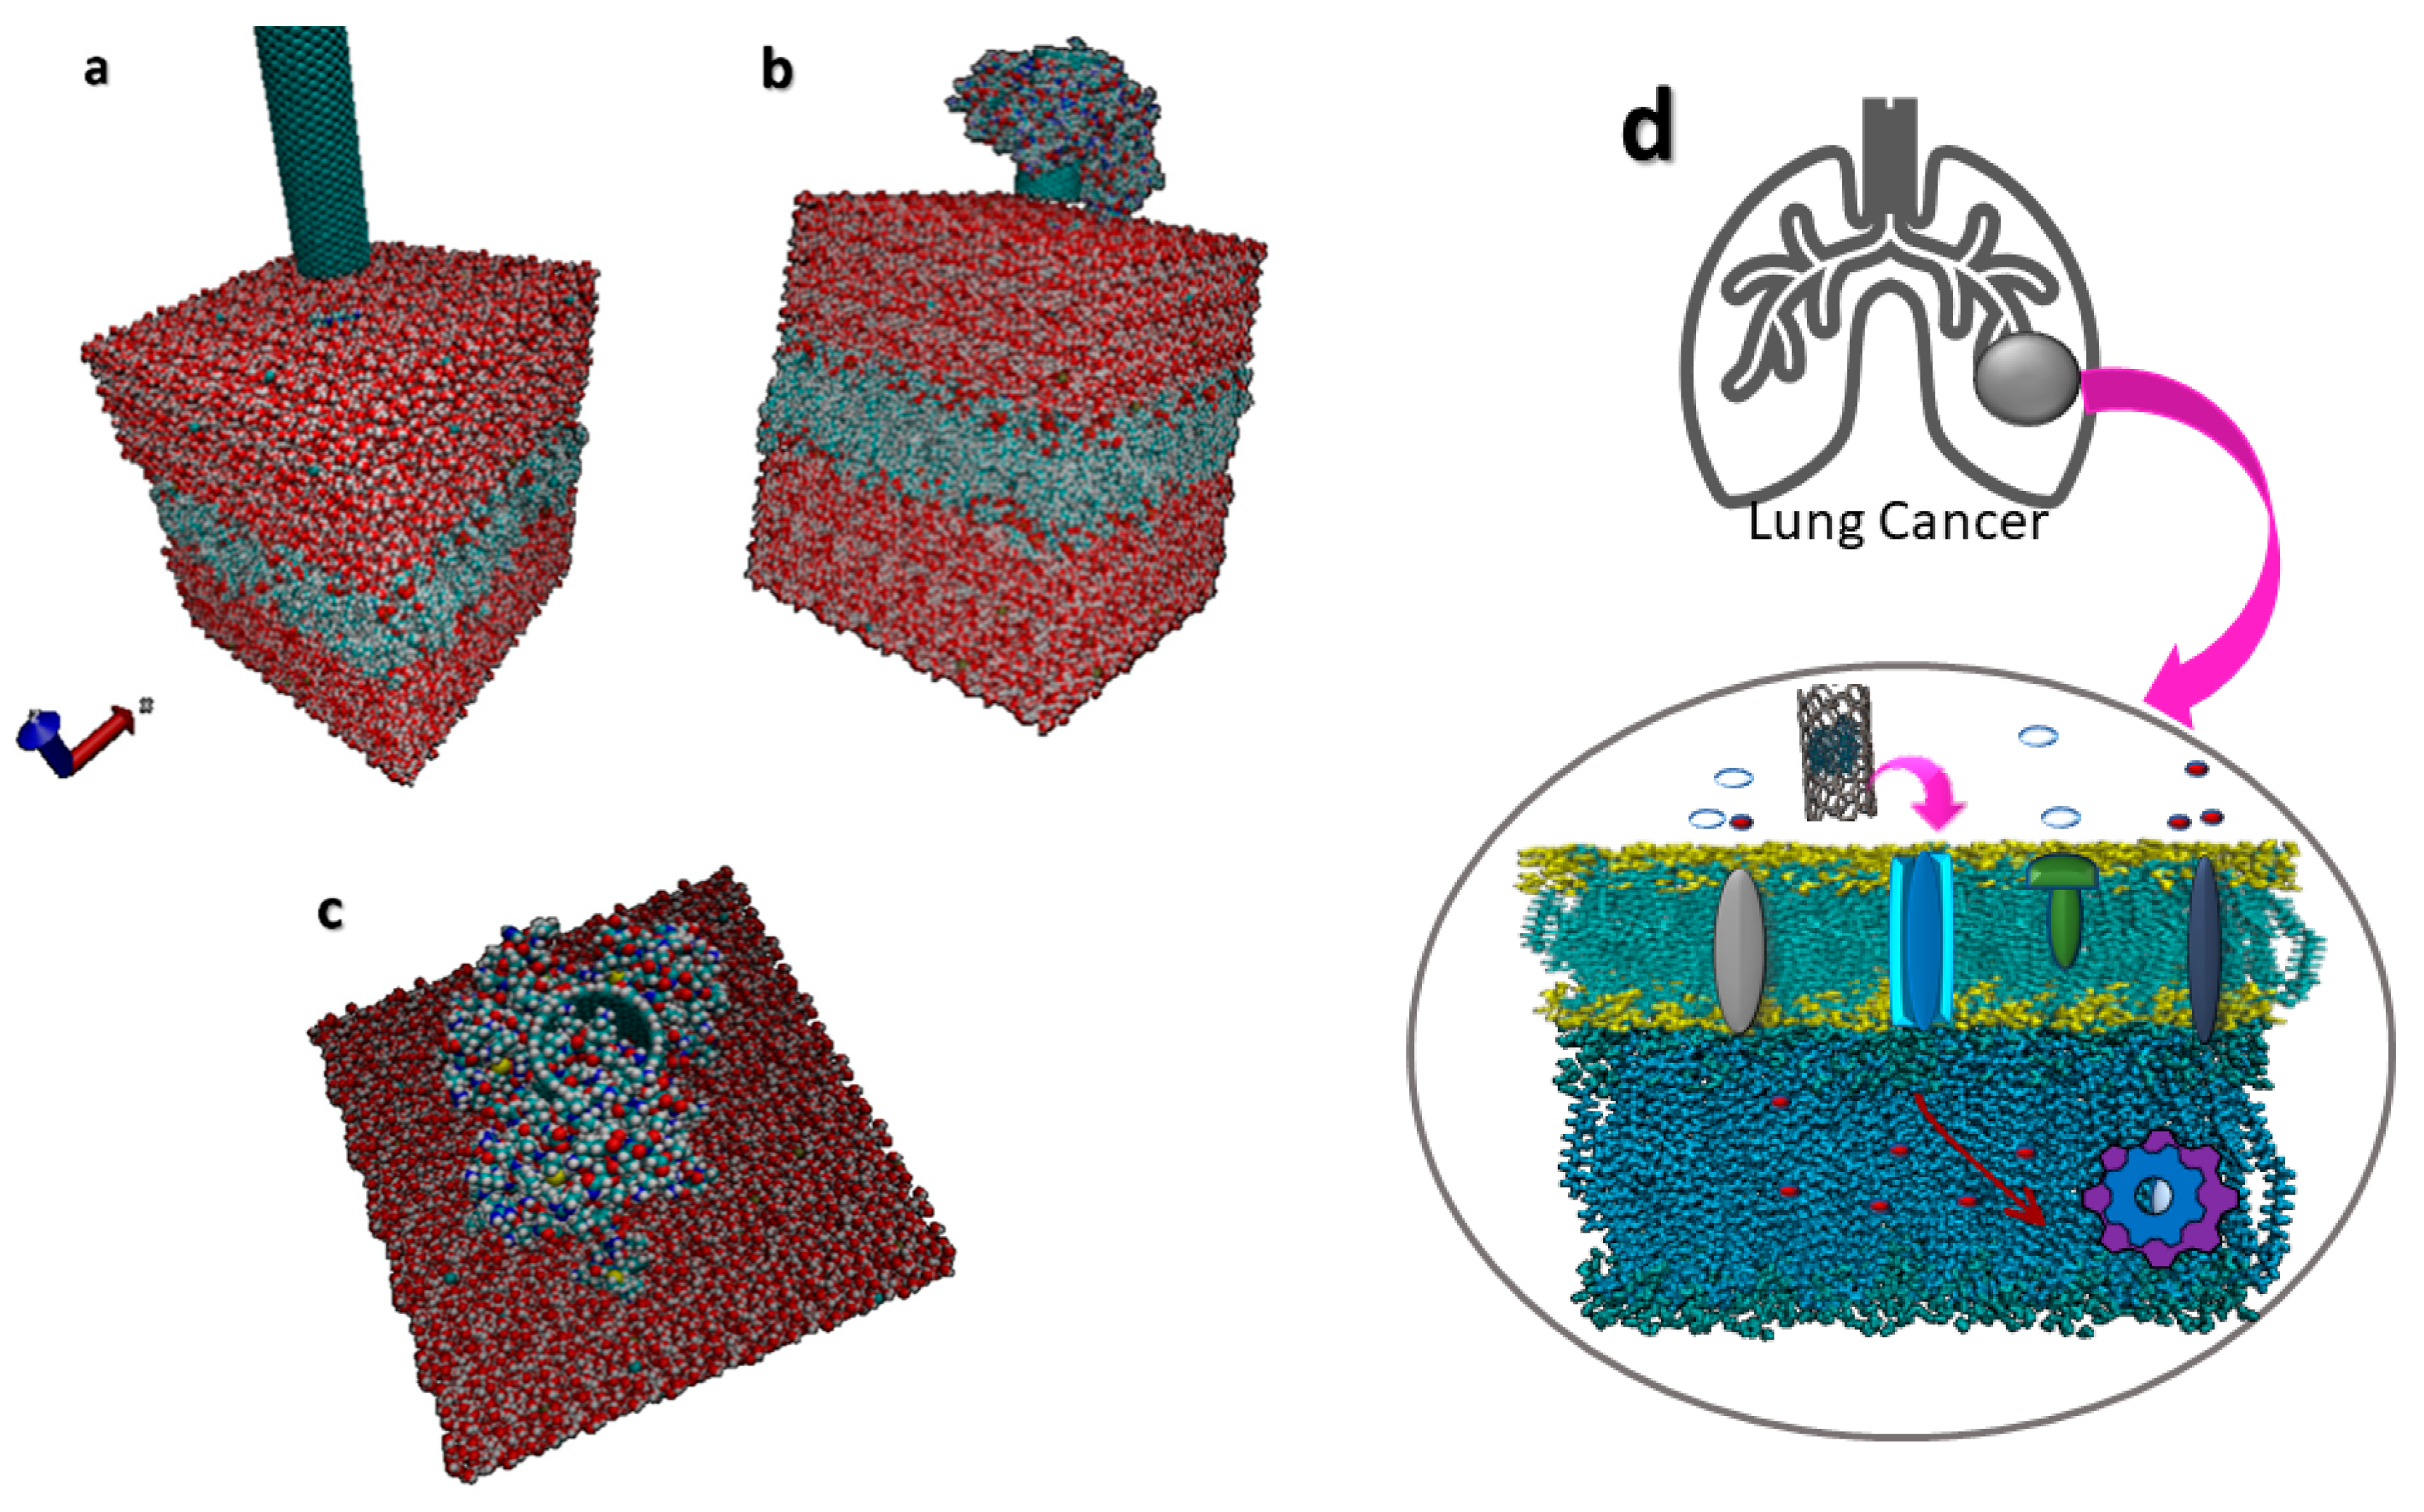
3.2. Molecular Scale Modeling of Lung Cell Membrane
3.3. Mathematical Modeling of Crossing through the Cell Membrane
3.4. Continuum Inner Cell Motion Dynamics: Mathematical Modeling
4. Optimal Designing
5. Results
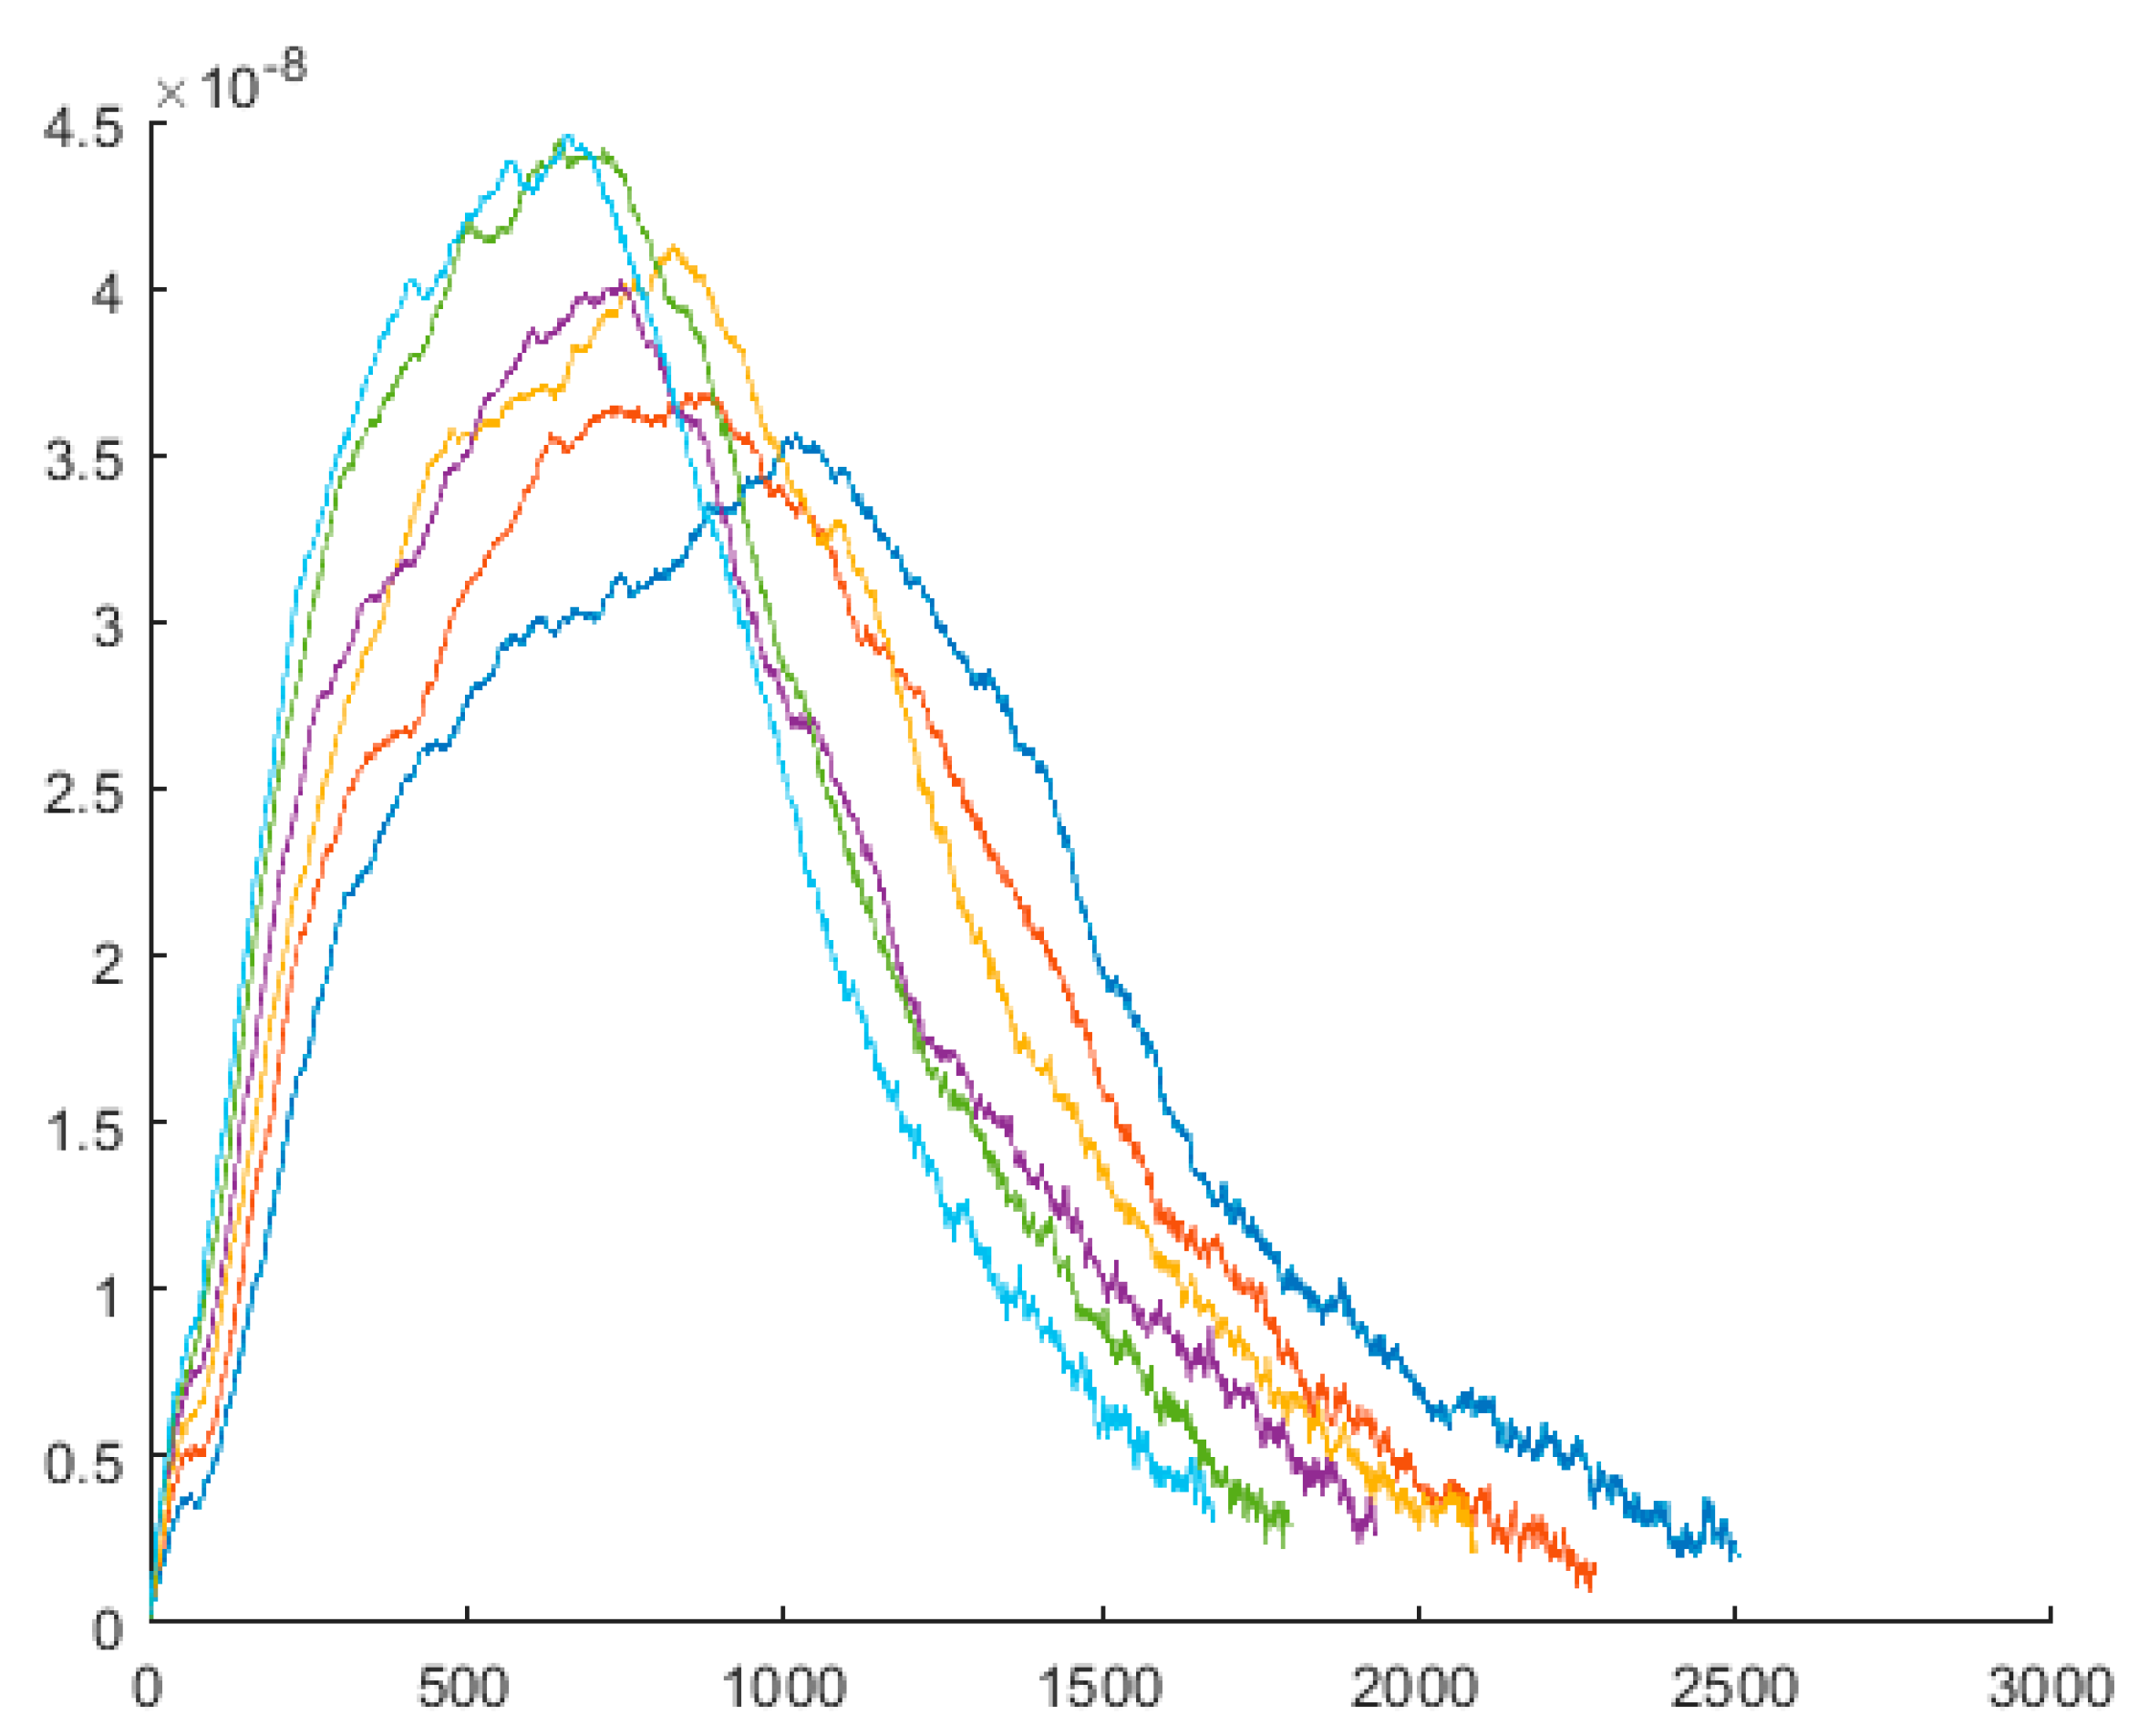
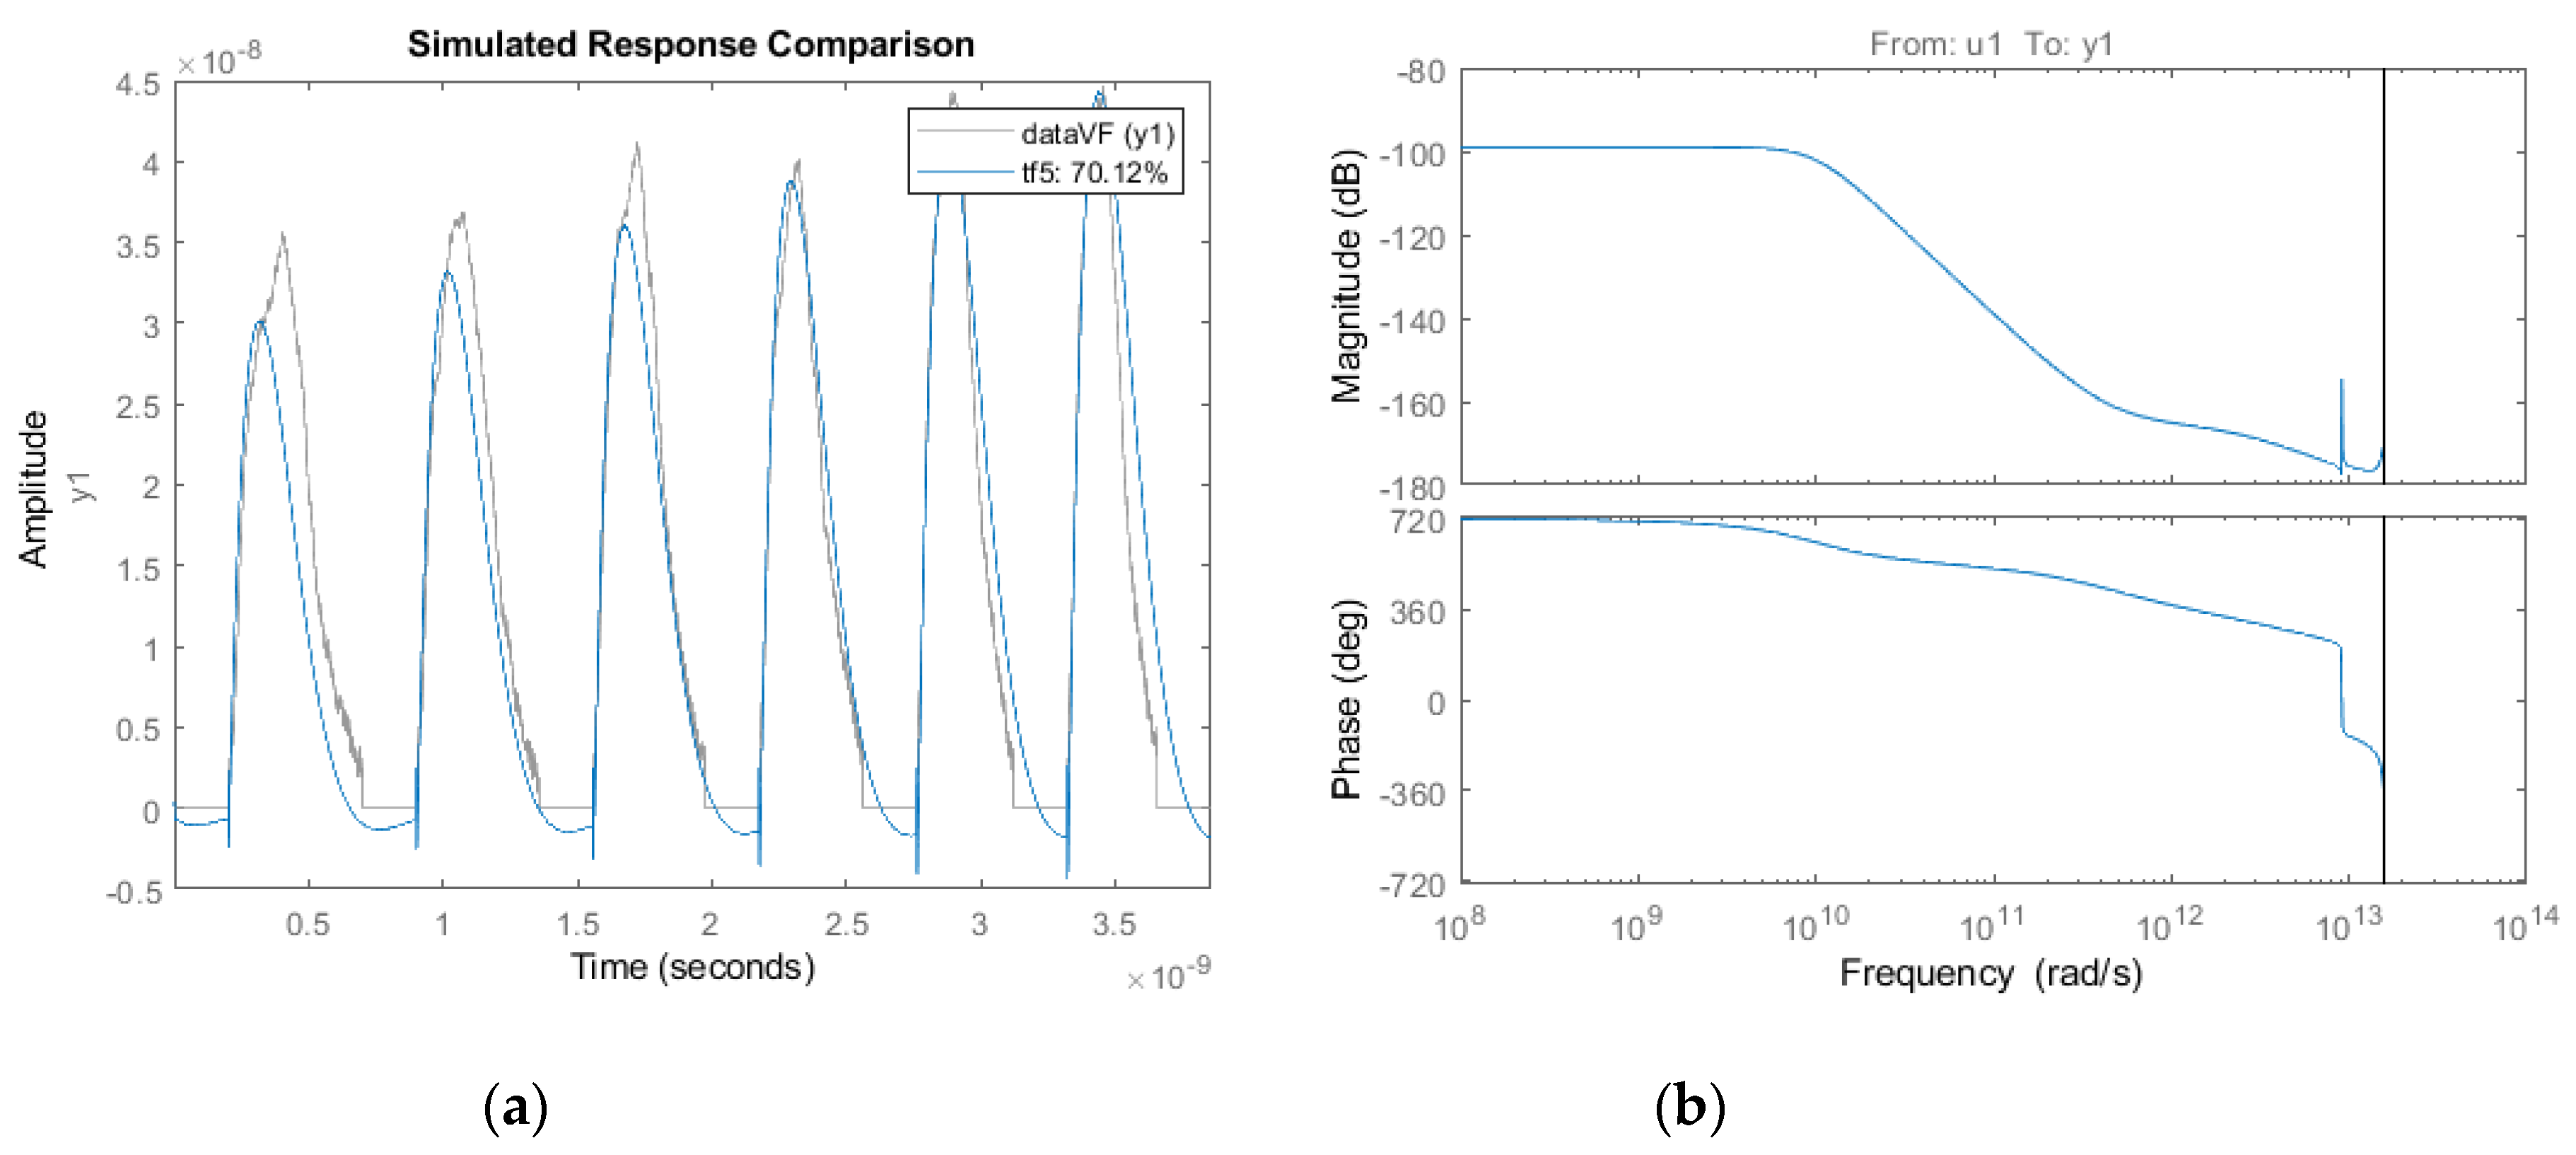
5.1. Results for Crossing through the Cell Membrane
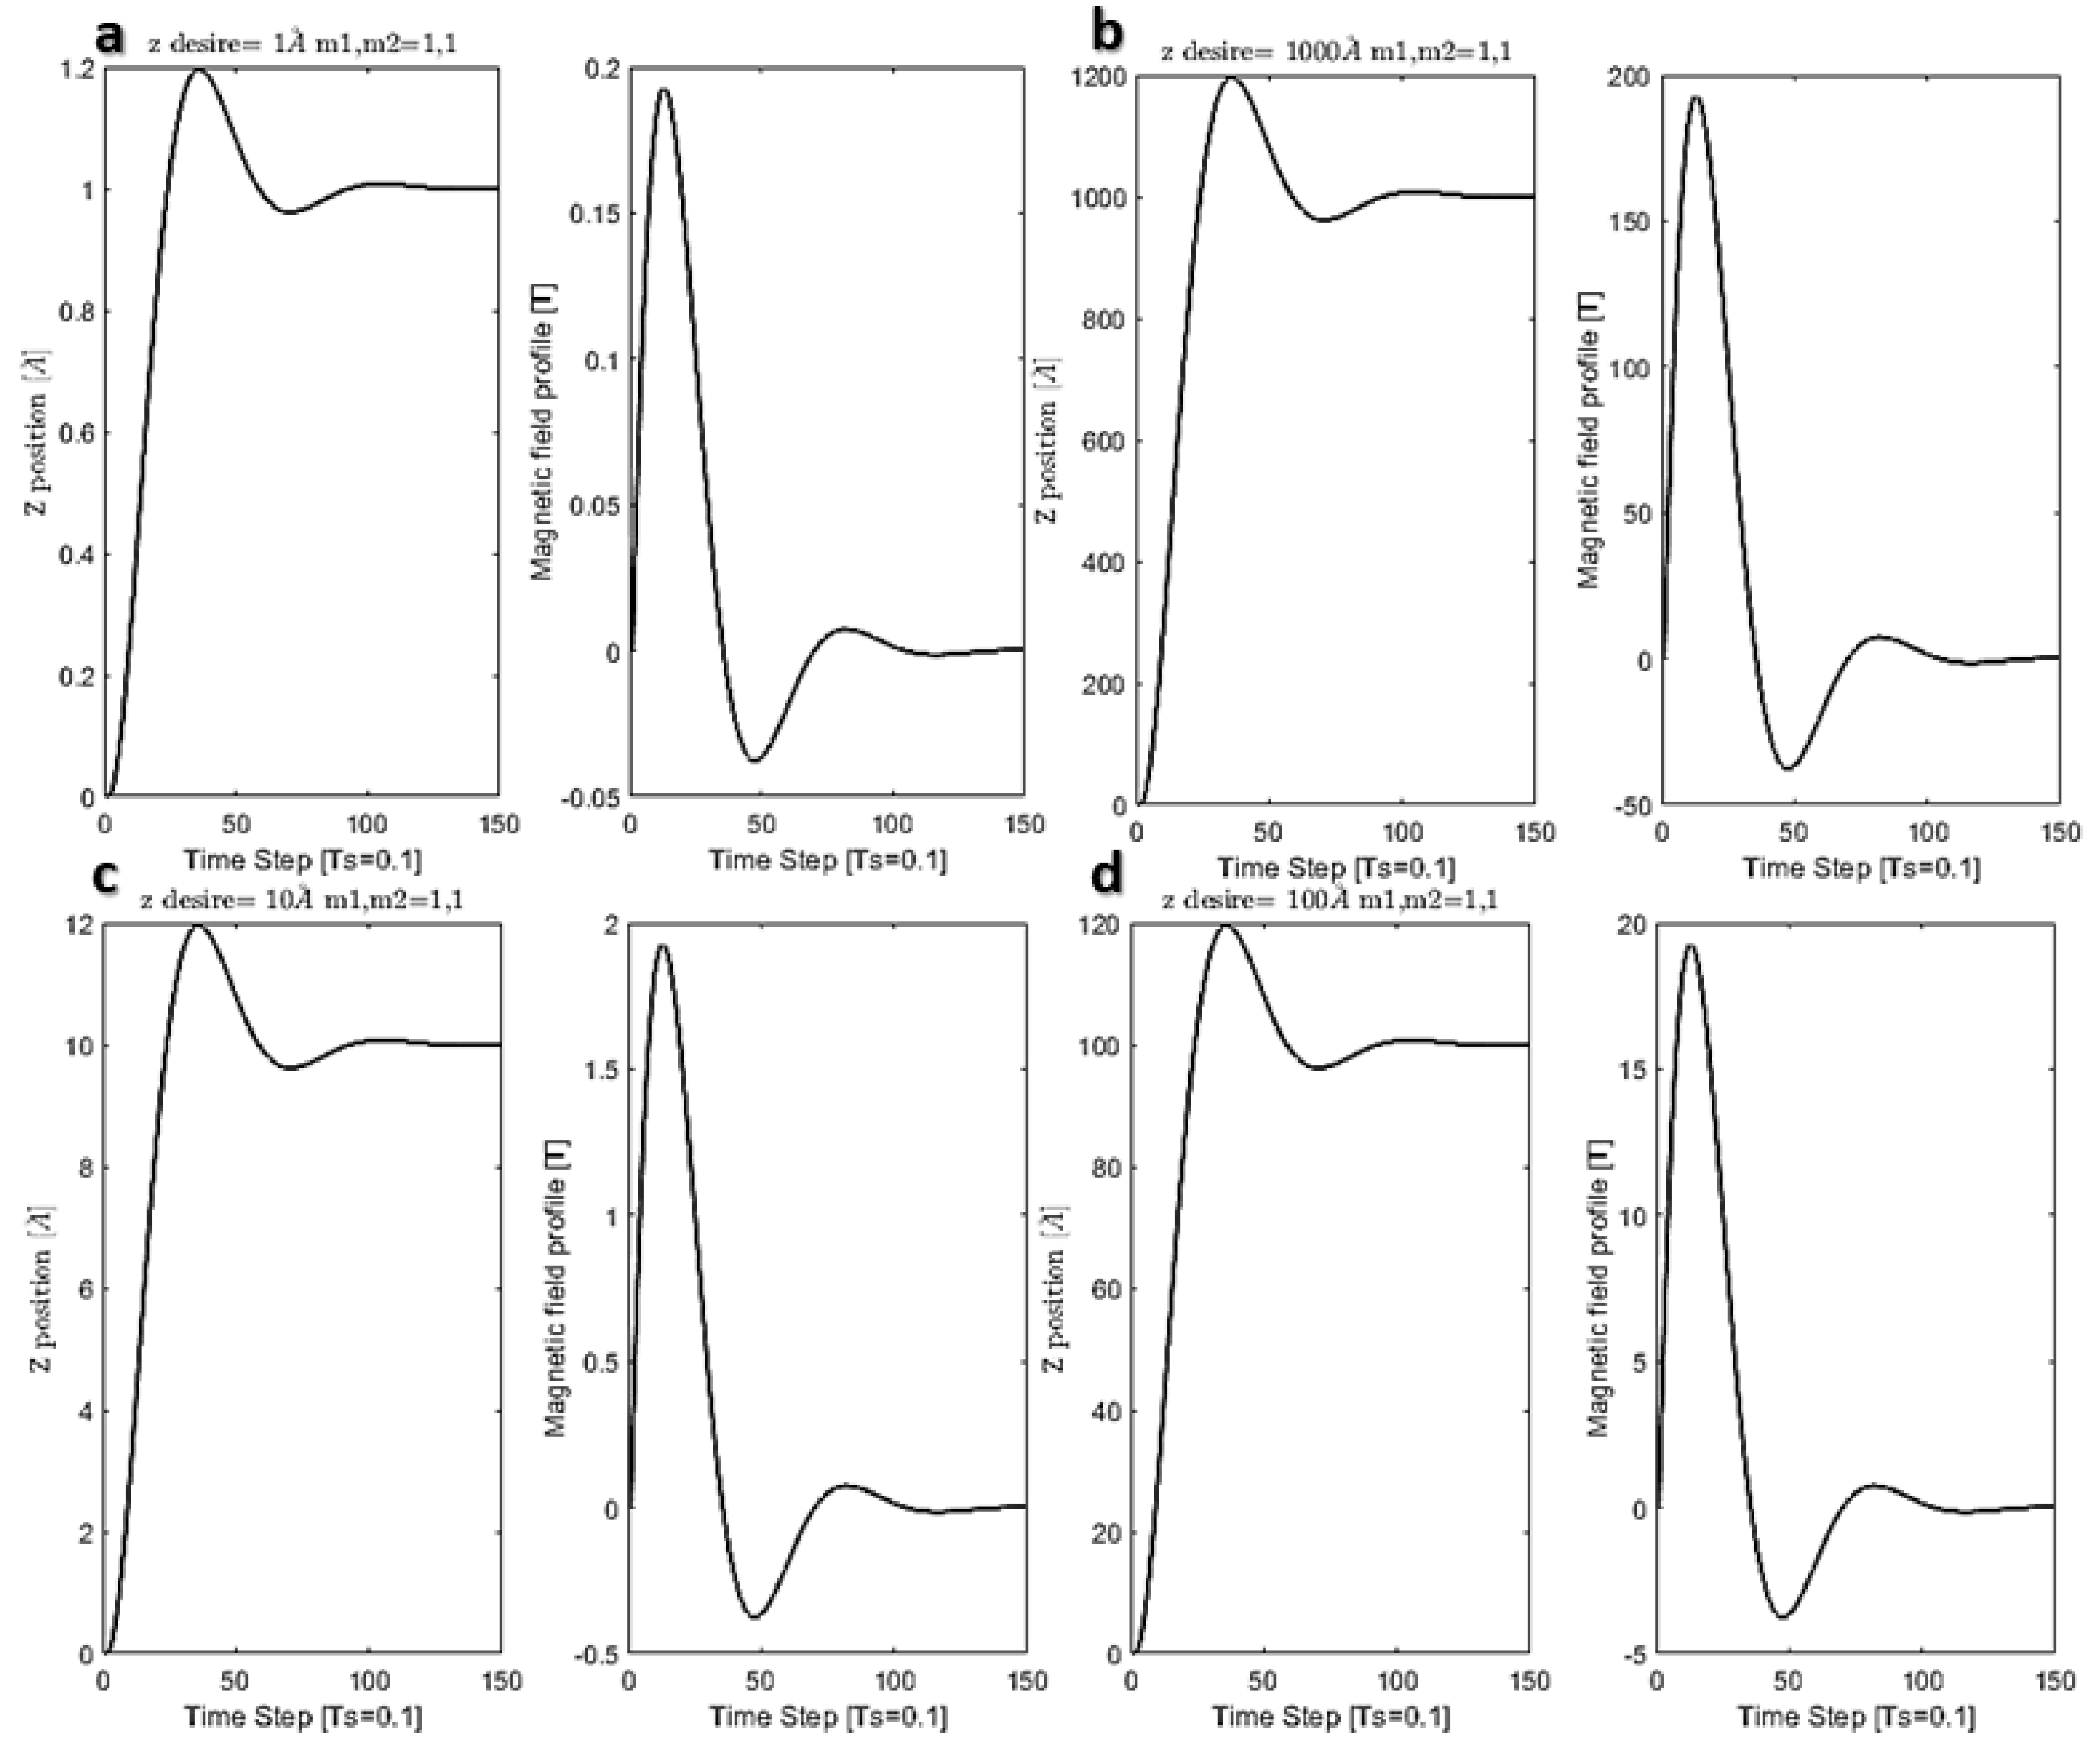
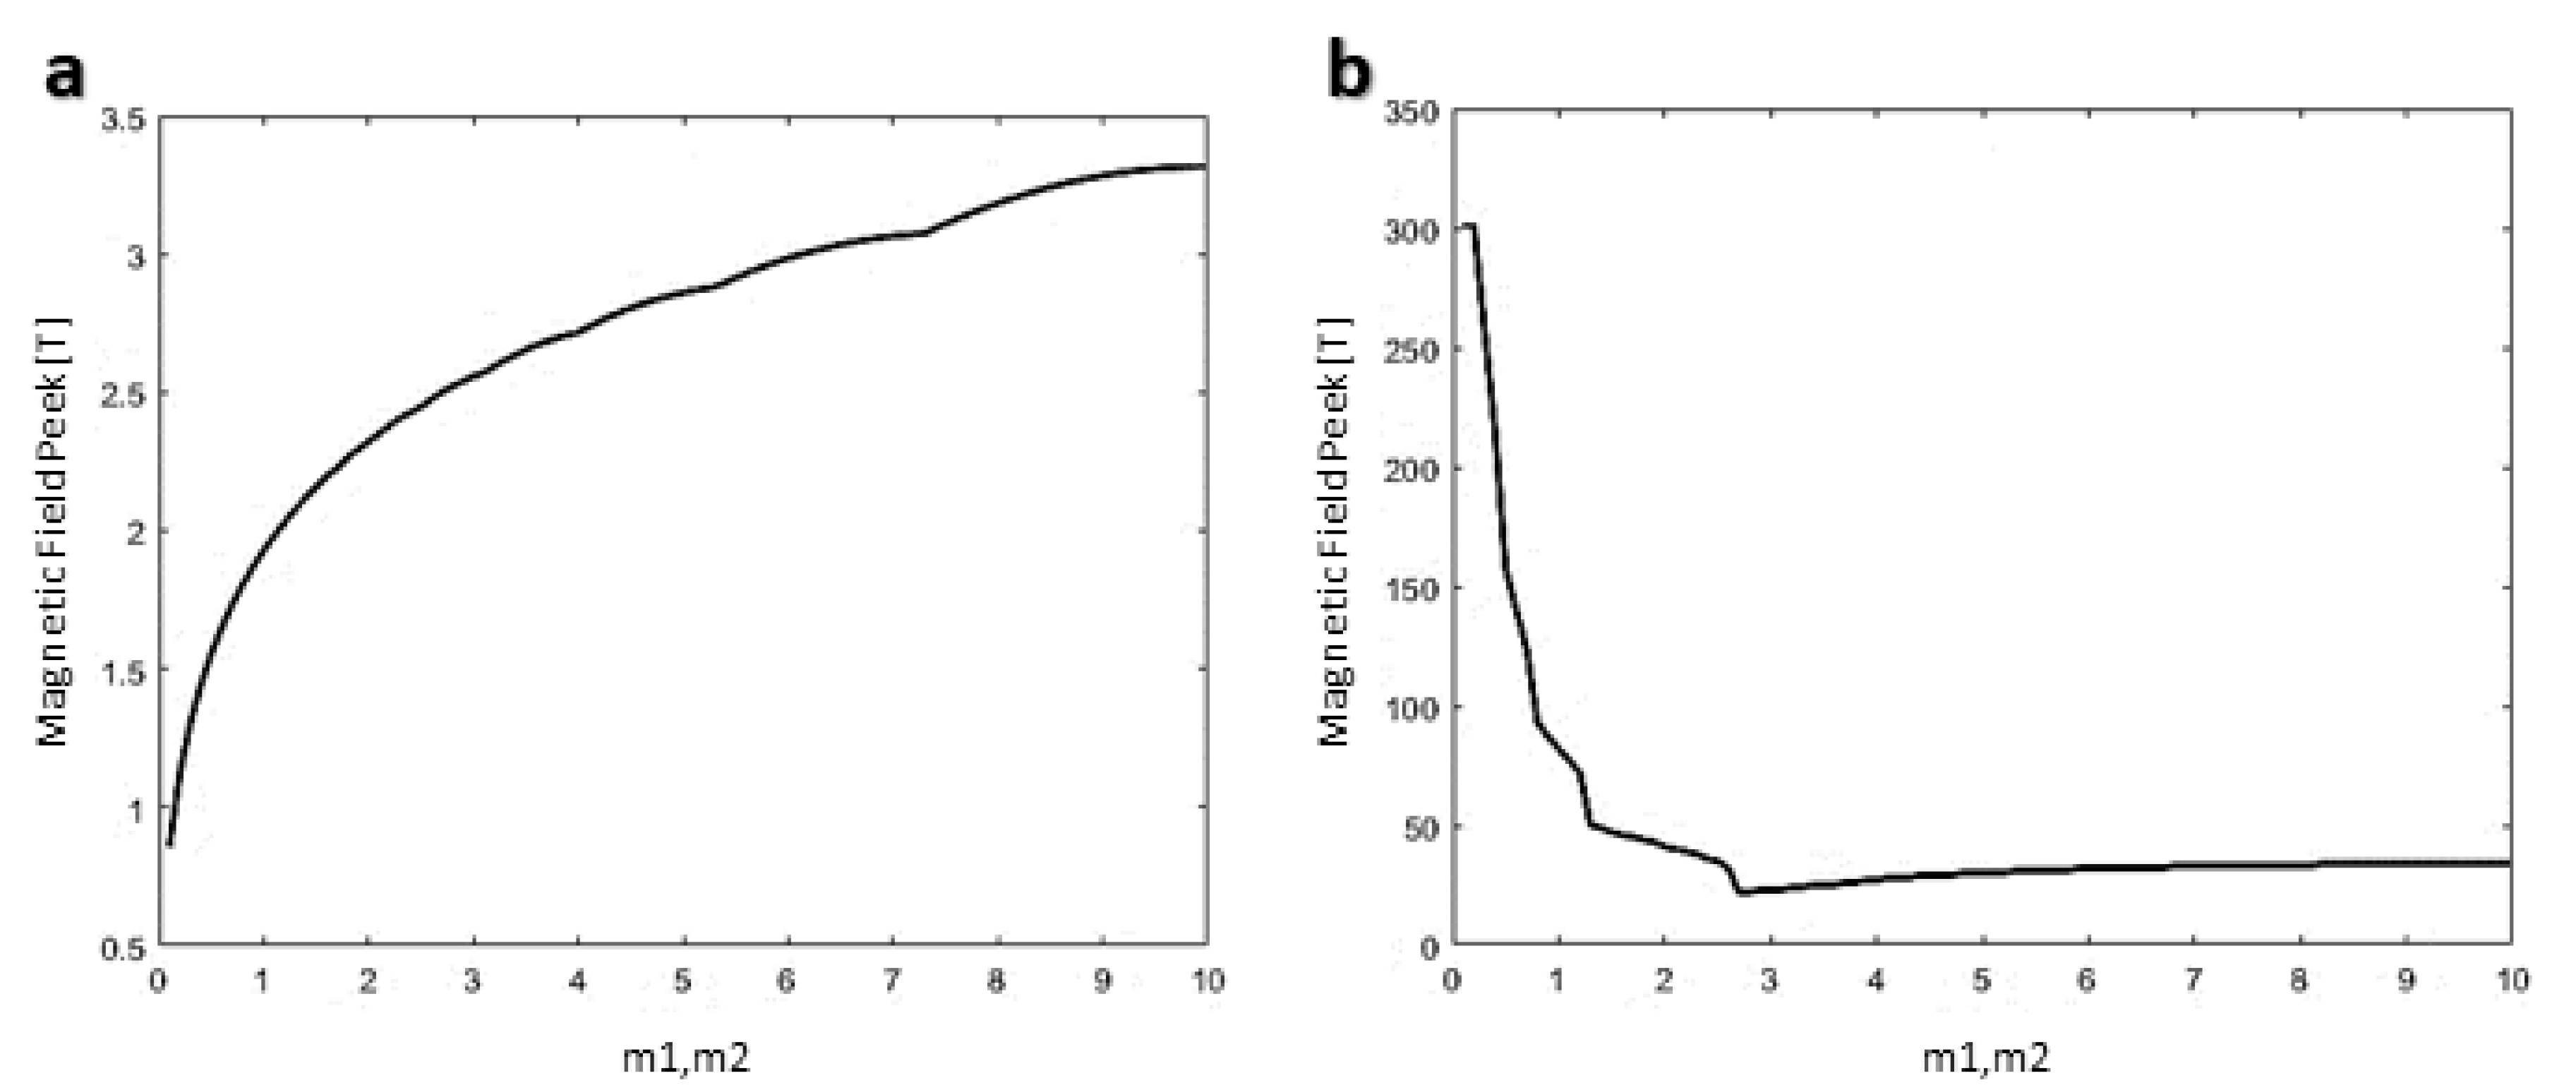
5.2. Results for Inner Cells Trajectory and Position Control
6. Conclusions
Author Contributions
Funding
Conflicts of Interest
References
- Molday, R.; Mackenzie, D. Immunospecific Ferromagnetic Iron-Dextran Reagents for the Labeling and Magnetic Separation of Cells. J. Immunol. Methods 1982, 52, 353–367. [Google Scholar] [CrossRef]
- Zhang, Y.; Kohler, N.; Zhang, M. Surface modification of superparamagnetic magnetite nanoparticles and their intracellular uptake. Biomaterials 2002, 23, 1553–1561. [Google Scholar] [CrossRef]
- Cooper, R.; Doyle, J.; Dunn, D.; Vellinger, J.; Todd, P. Multistage magnetic particle separator II. Classification of ferromagnetic particles. Sep. Sci. Technol. 2004, 39, 2809–2825. [Google Scholar] [CrossRef]
- Todd, P.; Cooper, R.; Doyle, J.; Dunn, S.; Vellinger, J.; Deuser, M. Multistage magnetic particle separator. J. Magn. Magn. Mater. 2001, 225, 294–300. [Google Scholar] [CrossRef]
- Lubbe, A.; Bergemann, C.; Brock, J.; McClure, D. Physiological aspects in magnetic drug-targeting. J. Magn. Magn. Mater. 1999, 194, 149–155. [Google Scholar] [CrossRef]
- Mehrafrooz, B.; Pedram, M.; Ghafar-Zadeh, E. An Improved Method for Magnetic Nanocarrier Drug Delivery across the Cell Membrane. Sensors 2018, 18, 381. [Google Scholar] [CrossRef] [PubMed]
- Zhao, X.; Cheng, L.; Jia, N.; Wang, R.; Liu, L.; Gao, C. Polyphenol-metal manipulated nanohybridization of CNT membranes with FeOOH nanorods for high-flux, antifouling and self-cleaning oil/water separation. J. Membr. Sci. 2020, 600, 117857. [Google Scholar] [CrossRef]
- Hans, M.; Lowman, A. Biodegradable nanoparticles for drug delivery and targeting. Curr. Opin. Solid State Mater. Sci. 2002, 6, 319–327. [Google Scholar] [CrossRef]
- Baghaei, B.; Saeb, M.; Jafari, S.; Khonakdar, H.; Rezaee, B.; Goodarzi, V.; Mohammadi, Y. Modeling and closed-loop control of particle size and initial burst of PLGA biodegradable nanoparticles for targeted drug delivery. J. Appl. Polym. Sci. 2017, 134. [Google Scholar] [CrossRef]
- Ebrahim, S.A.; Ashtari, A.; Pedram, M.Z.; Ebrahim, N.A. Publication trends in drug delivery and magnetic nanoparticles. Nanoscale Res. Lett. 2019, 14, 164. [Google Scholar] [CrossRef]
- Singh, A.P.; Biswas, A.; Shukla, A.; Maiti, P. Targeted therapy in chronic diseases using nanomaterial-based drug delivery vehicles. Signal Transduct. Target. Ther. 2019, 4, 1–21. [Google Scholar] [CrossRef] [PubMed]
- Kumar, R.M.; Rajesh, K.; Haldar, S.; Gupta, P.; Murali, K.; Roy, P.; Lahiri, D. Surface modification of CNT reinforced UHMWPE composite for sustained drug delivery. J. Drug Deliv. Sci. Technol. 2019, 52, 748–759. [Google Scholar] [CrossRef]
- Jordan, A.; Scholz, R.; Wust, P.; Fahling, H.; Felix, R. Magnetic fluid hyperthermia (MFH): Cancer treatment with AC magnetic field induced excitation of biocompatible superparamagnetic nanoparticles. J. Magn. Magn. Mater. 1999, 201, 413–419. [Google Scholar] [CrossRef]
- Hilger, I.; Fruhauf, K.; Andra, W.; Hiergeist, R.; Hergt, R.; Kaiser, W. Heating potential of iron oxides for therapeutic purposes in interventional radiology. Acad. Radiol. 2002, 9, 198–202. [Google Scholar] [CrossRef]
- Ebrahim, S.A.; Ashtari, A.; Pedram, M.Z.; Ebrahim, N.A.; Sanati-Nezhad, A. Publication Trends in Exosomes Nanoparticles for Cancer Detection. Int. J. Nanomed. 2020, 15, 4453. [Google Scholar] [CrossRef] [PubMed]
- Tiwaree, M.; Seal, P.; Borah, J.; Paul, N. Functionalization of Carbon Nanotubes and its Nanocomposites for Hyperthermia studies. Mater. Today Proc. 2019, 18, 1317–1323. [Google Scholar] [CrossRef]
- Zhang, W.; Zhang, Z.; Zhang, Y. The application of carbon nanotubes in target drug delivery systems for cancer therapies. Nanoscale Res. Lett. 2011, 6. [Google Scholar] [CrossRef]
- Wang, J.; Al-Jamal, K. Functionalized carbon nanotubes: Revolution in brain delivery. Nanomedicine 2015, 10, 2639–2642. [Google Scholar] [CrossRef]
- Nikitin, M.; Torno, M.; Chen, H.; Rosengart, A.; Nikitin, P. Quantitative real-time in vivo detection of magnetic nanoparticles by their nonlinear magnetization. J. Appl. Phys. 2008, 103. [Google Scholar] [CrossRef]
- Hamdi, M.; Ferreira, A. Computational Study of Superparamagnetic Nanocapsules Crossing the Blood-Brain Barrier: A Robotics Approach. In Proceedings of the 2012 IEEE/RSJ International Conference on Intelligent Robots and Systems, Vilamoura, Portugal, 7–12 October 2012; pp. 2313–2318. [Google Scholar]
- Pedram, M.; Shamloo, A.; GhafarZadeh, E.; Alasty, A. Modeling and Simulation of Crossing Magnetic NanoParticles Through Blood Brain Barrier (BBB). In Proceedings of the 2014 36th Annual International Conference of the IEEE Engineering in Medicine and Biology Society, Chicago, IL, USA, 26–30 August 2014; pp. 5280–5283. [Google Scholar]
- Zhang, X.; Meng, L.; Lu, Q.; Fei, Z.; Dyson, P. Targeted delivery and controlled release of doxorubicin to cancer cells using modified single wall carbon nanotubes. Biomaterials 2009, 30, 6041–6047. [Google Scholar] [CrossRef]
- Hajipour, M.; Santoso, M.; Rezaee, F.; Aghaverdi, H.; Mahmoudi, M.; Perry, G. Advances in Alzheimer’s Diagnosis and Therapy: The Implications of Nanotechnology. Trends Biotechnol. 2017, 35, 937–953. [Google Scholar] [CrossRef]
- Perez-Herrero, E.; Fernandez-Medarde, A. Advanced targeted therapies in cancer: Drug nanocarriers, the future of chemotherapy. Eur. J. Pharm. Biopharm. 2015, 93, 52–79. [Google Scholar] [CrossRef] [PubMed]
- Sharma, A.; Jha, N.K.; Dahiya, K.; Singh, V.K.; Chaurasiya, K.; Jha, A.N.; Jha, S.K.; Mishra, P.C.; Dholpuria, S.; Astya, R. Nanoparticulate RNA delivery systems in cancer. Cancer Rep. 2020, e1271. [Google Scholar] [CrossRef]
- Hajba, L.; Guttman, A. The use of magnetic nanoparticles in cancer theranostics: Toward handheld diagnostic devices. Biotechnol. Adv. 2016, 34, 354–361. [Google Scholar] [CrossRef]
- Ozgen, P.S.O.; Atasoy, S.; Kurt, B.Z.; Durmus, Z.; Yigit, G.; Dag, A. Glycopolymer decorated multiwalled carbon nanotubes for dual targeted breast cancer therapy. J. Mater. Chem. B 2020, 8, 3123–3137. [Google Scholar] [CrossRef]
- Liu, Z.; Robinson, J.; Tabakman, S.; Yang, K.; Dai, H. Carbon materials for drug delivery & cancer therapy. Mater. Today 2011, 14, 316–323. [Google Scholar] [CrossRef]
- Heister, E.; Neves, V.; Lamprecht, C.; Silva, S.; Coley, H.; McFadden, J. Drug loading, dispersion stability, and therapeutic efficacy in targeted drug delivery with carbon nanotubes. Carbon 2012, 50, 622–632. [Google Scholar] [CrossRef]
- Nielsen, H.; Madsen, H. Modelling the heat consumption in district heating systems using a grey-box approach. Energy Build. 2006, 38, 63–71. [Google Scholar] [CrossRef]
- Nelles, O. Nonlinear System Identification: From Classical Approaches to Neural Networks and Fuzzy Models; Springer Science & Business Media: Berlin/Heidelberg, Germany, 2013. [Google Scholar]
- Cao, Q.; Han, X.; Li, L. Numerical analysis of magnetic nanoparticle transport in microfluidic systems under the influence of permanent magnets. J. Phys. D Appl. Phys. 2012, 45, 465001. [Google Scholar] [CrossRef]
- Pankhurst, Q.A.; Connolly, J.; Jones, S.; Dobson, J. Applications of magnetic nanoparticles in biomedicine. J. Phys. D Appl. Phys. 2003, 36, R167. [Google Scholar] [CrossRef]
- Al-Sharafi, A.; Sahin, A.Z.; Yilbas, B.S.; Shuja, S. Marangoni convection flow and heat transfer characteristics of water–CNT nanofluid droplets. Numer. Heat Transf. Part A Appl. 2016, 69, 763–780. [Google Scholar] [CrossRef]
- Guo, S.; Deng, Y.; Zhao, L.; Chan, H.; Zhao, X. Effect of patterned micro-magnets on superparamagnetic beads in microchannels. J. Phys. D Appl. Phys. 2008, 41, 105008. [Google Scholar] [CrossRef]
- Haverkort, J.; Kenjereš, S.; Kleijn, C. Magnetic particle motion in a Poiseuille flow. Phys. Rev. E 2009, 80, 016302. [Google Scholar] [CrossRef] [PubMed]
Publisher’s Note: MDPI stays neutral with regard to jurisdictional claims in published maps and institutional affiliations. |


| Parameter | Definition | Value |
|---|---|---|
| the permeability of vacuum | ||
| Particle volume | ||
| magnetic susceptibility |
| Parameters | Value |
|---|---|
© 2020 by the authors. Licensee MDPI, Basel, Switzerland. This article is an open access article distributed under the terms and conditions of the Creative Commons Attribution (CC BY) license (http://creativecommons.org/licenses/by/4.0/).
Share and Cite
Sohrabi, N.; Alihosseini, A.; Pirouzfar, V.; Pedram, M.Z. Analysis of Dynamics Targeting CNT-Based Drug Delivery through Lung Cancer Cells: Design, Simulation, and Computational Approach. Membranes 2020, 10, 283. https://doi.org/10.3390/membranes10100283
Sohrabi N, Alihosseini A, Pirouzfar V, Pedram MZ. Analysis of Dynamics Targeting CNT-Based Drug Delivery through Lung Cancer Cells: Design, Simulation, and Computational Approach. Membranes. 2020; 10(10):283. https://doi.org/10.3390/membranes10100283
Chicago/Turabian StyleSohrabi, Nafiseh, Afshar Alihosseini, Vahid Pirouzfar, and Maysam Zamani Pedram. 2020. "Analysis of Dynamics Targeting CNT-Based Drug Delivery through Lung Cancer Cells: Design, Simulation, and Computational Approach" Membranes 10, no. 10: 283. https://doi.org/10.3390/membranes10100283
APA StyleSohrabi, N., Alihosseini, A., Pirouzfar, V., & Pedram, M. Z. (2020). Analysis of Dynamics Targeting CNT-Based Drug Delivery through Lung Cancer Cells: Design, Simulation, and Computational Approach. Membranes, 10(10), 283. https://doi.org/10.3390/membranes10100283