The Agnostic Role of Site of Metastasis in Predicting Outcomes in Cancer Patients Treated with Immunotherapy

 , , ,
, , ,  , ,
, ,  and add
Show full author list
and add
Show full author list
Abstract
1. Introduction
2. Materials and Methods
2.1. Patients, Treatment, and Outcomes
2.2. Statistical Analysis
3. Results
4. Discussion
5. Conclusions
Supplementary Materials
Author Contributions
Funding
Conflicts of Interest
References
- Emens, L.A.; Kok, M.; Ojalvo, L.S. Targeting the programmed cell death-1 pathway in breast and ovarian cancer. Curr. Opin. Obstet. Gynecol. 2016, 28, 142–147. [Google Scholar] [CrossRef] [PubMed]
- Chae, Y.K.; Arya, A.; Iams, W.; Cruz, M.R.; Chandra, S.; Choi, J.; Giles, F. Current landscape and future of dual anti-CTLA4 and PD-1/PD-L1 blockade immunotherapy in cancer; lessons learned from clinical trials with melanoma and non-small cell lung cancer (NSCLC). J. Immunother. Cancer 2018, 6, 39. [Google Scholar] [CrossRef] [PubMed]
- La-Beck, N.M.; Jean, G.W.; Huynh, C.; Alzghari, S.K.; Lowe, D.B. Immune checkpoint inhibitors: New insights and current place in Cancer therapy. Pharmacotherapy 2015, 35, 963–976. [Google Scholar] [CrossRef]
- Balar, A.V.; Galsky, M.D.; Rosenberg, J.E.; Powles, T.; Petrylak, D.P.; Bellmunt, J.; Loriot, Y.; Necchi, A.; Hoffman-Censits, J.; Perez-Gracia, J.L.; et al. Atezolizumab as first-line treatment in cisplatin-ineligible patients with locally advanced and metastatic urothelial carcinoma: A single-arm, multicentre, phase 2 trial. Lancet 2017, 389, 67–76. [Google Scholar] [CrossRef]
- Motzer, R.J.; Escudier, B.; McDermott, D.F.; George, S.; Hammers, H.J.; Srinivas, S.; Tykodi, S.S.; Sosman, J.A.; Procopio, G.; Plimack, E.R.; et al. Nivolumab versus Everolimus in advanced renal-cell carcinoma. N. Engl. J. Med. 2015, 373, 1803–1813. [Google Scholar] [CrossRef] [PubMed]
- Michot, J.M.; Bigenwald, C.; Champiat, S.; Collins, M.; Carbonnel, F.; Postel-Vinay, S.; Berdelou, A.; Varga, A.; Bahleda, R.; Hollebecque, A.; et al. Immune-related adverse events with immune checkpoint blockade: A comprehensive review. Eur. J. Cancer 2016, 54, 139–148. [Google Scholar] [CrossRef] [PubMed]
- Tay, R.; Prelaj, A.; Califano, R. Immune checkpoint blockade for advanced non small cell lung cancer: Challenging clinical scenarios. J. Thorac. Dis. 2018, 10, 1494–1502. [Google Scholar] [CrossRef]
- Wang, C.; Yu, X.; Wang, W. A meta-analysis of efficacy and safety of antibodies targeting PD-1/PD-L1 in treatment of advanced nonsmall cell lung cancer. Medicine 2016, 95, 5539. [Google Scholar] [CrossRef]
- McDermott, D.; Lebbe, C.; Hodi, F.S.; Maio, M.; Weber, J.S.; Wolchok, J.D.; Thompson, J.A.; Balch, C.M. Durable benefit and the potential for long-term survival with immunotherapy in advanced melanoma. Cancer Treat. Rev. 2014, 40, 1056–1064. [Google Scholar] [CrossRef]
- Martini, D.J.; Hamieh, L.; McKay, R.R.; Harshman, L.C.; Brandao, R.; Norton, C.K.; Steinharter, J.A.; Krajewski, K.M.; Gao, X.; Schutz, F.A.; et al. Durable clinical benefit in metastatic renal cell carcinoma patients who discontinue PD-1/PD-L1therapy for immune-related adverse events. Cancer Immunol. Res. 2018, 6, 402–408. [Google Scholar] [CrossRef]
- Mu, C.Y.; Huang, J.A.; Chen, Y.; Chen, C.; Zhang, X.G. High expression of PD-L1 in lung cancer may contribute to poor prognosis and tumor cells immune escape through suppressing tumor infiltrating dendritic cells maturation. Med. Oncol. 2011, 28, 682–688. [Google Scholar] [CrossRef] [PubMed]
- Thompson, R.H.; Gillett, M.D.; Cheville, J.C.; Lohse, C.M.; Dong, H.; Webster, W.S.; Krejci, K.G.; Lobo, J.R.; Sengupta, S.; Chen, L.; et al. Costimulatory B7-H1 in renal cell carcinoma patients: Indicator of tumor aggressiveness and potential therapeutic target. Proc. Natl. Acad. Sci. USA 2004, 101, 17174–17179. [Google Scholar] [CrossRef] [PubMed]
- Huang, Y.; Zhang, S.D.; McCrudden, C.; Chan, K.W.; Lin, Y.; Kwok, H.F. The prognostic significance of PD-L1 in bladder cancer. Oncol. Rep. 2015, 33, 3075–3084. [Google Scholar] [CrossRef] [PubMed]
- Herbst, R.S.; Soria, J.C.; Kowanetz, M.; Fine, G.D.; Hamid, O.; Gordon, M.S.; Sosman, J.A.; McDermott, D.F.; Powderly, J.D.; Gettinger, S.N.; et al. Predictive correlates of response to the anti-PD-L1 antibody MPDL3280A in cancer patients. Nature 2014, 515, 563–567. [Google Scholar] [CrossRef]
- Reck, M.; Rodríguez-Abreu, D.; Robinson, A.G.; Hui, R.; Csőszi, T.; Fülöp, A.; Gottfried, M.; Peled, N.; Tafreshi, A.; Cuffe, S.; et al. Pembrolizumab versus Chemotherapy for PD-L1-Positive Non- Small-Cell Lung Cancer. N. Engl. J. Med. 2016, 375, 1823–1833. [Google Scholar] [CrossRef]
- Reck, M.; Rodríguez-Abreu, D.; Robinson, A.G.; Hui, R.; Csőszi, T.; Fülöp, A.; Gottfried, M.; Peled, N.; Tafreshi, A.; Cuffe, S.; et al. OA14.01 KEYNOTE-024 3-Year Survival Update: Pembrolizumab Vs Platinum-Based Chemotherapy for Advanced Non–Small-Cell Lung Cancer. J. Thorac. Oncol. 2019, 14, S243. [Google Scholar] [CrossRef]
- Reck, M.; Rodríguez-Abreu, D.; Robinson, A.G.; Hui, R.; Csőszi, T.; Fülöp, A.; Gottfried, M.; Peled, N.; Tafreshi, A.; Cuffe, S.; et al. Updated Analysis of KEYNOTE-024: Pembrolizumab Versus Platinum-Based Chemotherapy for Advanced Non-Small-Cell Lung Cancer with PD-L1 Tumor Proportion Score of 50% or Greater. J. Clin. Oncol. 2019, 37, 537–546. [Google Scholar] [CrossRef]
- Mok, T.S.K.; Wu, Y.L.; Kudaba, I.; Kowalski, D.M.; Cho, B.C.; Turna, H.Z.; Castro, G.J.r.; Srimuninnimit, V.; Laktionov, K.K.; Bondarenko, I.; et al. Pembrolizumab versus chemotherapy for previously untreated, PD-L1- expressing, locally advanced or metastatic non-small-cell lung cancer (KEYNOTE-042): A randomised, open-label, controlled, phase 3 trial. Lancet 2019, 393, 1819–1830. [Google Scholar] [CrossRef]
- Gandhi, L.; Rodríguez-Abreu, D.; Gadgeel, S.; Esteban, E.; Felip, E.; De Angelis, F.; Domine, M.; Clingan, P.; Hochmair, M.J.; Powell, S.F.; et al. Pembrolizumab plus Chemotherapy in Metastatic Non-Small-Cell Lung Cancer. N. Engl. J. Med. 2018, 378, 2078–2092. [Google Scholar] [CrossRef]
- Gadgeel, S.M.; Garassino, M.C.; Esteban, E.; Speranza, G.; Felip, E.; Maximilian, J.; Hochmair, M.J.; Powell, S.F.; Cheng, S.Y.; Bischoff, H.; et al. KEYNOTE-189: Updated OS and progression after the next line of therapy (PFS2) with pembrolizumab (pembro) plus chemo with pemetrexed and platinum verso placebo plus chemo for metastatic nonsquamous NSCLC. J. Clin. Oncol. 2019, 37, 9013. [Google Scholar] [CrossRef]
- Schmid, P.; Adams, S.; Rugo, H.S.; Schneeweiss, A.; Barrios, C.H.; Iwata, H.; Diéras, V.; Hegg, R.; Im, S.A.; Shaw Wright, G.; et al. Atezolizumab plus nab-paclitaxel as first-line treatment for unresectable, locally advanced or metastatic triple-negative breast cancer (IMpassion130): Updated efficacy results from a randomised, double-blind, placebo-controlled, phase 3 trial. Lancet Oncol. 2020, 21, 44–59. [Google Scholar] [CrossRef]
- Bensch, F.; van der Veen, E.L.; Lub-de Hooge, M.N.; Jorritsma-Smit, A.; Boellaard, R.; Kok, I.C.; Oosting, S.F.; Schröder, C.P.; Hiltermann, T.J.N.; van der Wekken, A.J.; et al. Zr-atezolizumab imaging as a non-invasive approach to assess clinical response to PD-L1 blockade in cancer. Nat. Med. 2018, 24, 1852–1858. [Google Scholar] [CrossRef] [PubMed]
- Adams, S.; Diamond, J.R.; Hamilton, E.; Pohlmann, P.R.; Tolaney, S.M.; Chang, C.W.; Zhang, W.; Iizuka, K.; Foster, P.G.; Molinero, L.; et al. Atezolizumab Plus nab-Paclitaxel in the Treatment of Metastatic Triple-Negative Breast Cancer With 2-Year Survival Follow-up: A Phase 1b Clinical Trial. JAMA Oncol. 2019, 5, 334–342. [Google Scholar] [CrossRef] [PubMed]
- Emens, L.A.; Cruz, C.; Eder, J.P.; Braiteh, F.; Chung, C.; Tolaney, S.M.; Kuter, I.; Nanda, R.; Cassier, P.A.; Delord, J.P.; et al. Long-term Clinical Outcomes and Biomarker Analyses of Atezolizumab Therapy for Patients with Metastatic Triple-Negative Breast Cancer: A Phase 1 Study. JAMA Oncol. 2019, 5, 74–82. [Google Scholar] [CrossRef] [PubMed]
- Hellmann, M.D.; Paz-Ares, L.; Bernabe Caro, R.; Zurawski, B.; Kim, S.W.; Carcereny Costa, E.; Park, K.; Alexandru, A.; Lupinacci, L.; de la Mora Jimenez, E.; et al. Nivolumab plus Ipilimumab in Advanced Non-Small-Cell Lung Cancer. N. Engl. J. Med. 2019, 381, 2020–2031. [Google Scholar] [CrossRef]
- Gadgeel, S.M.; Lukas, R.V.; Goldschmidt, J.; Conkling, P.; Park, K.; Cortinovis, D.; de Marinis, F.; Rittmeyer, A.; Patel, J.D.; von Pawel, J.; et al. Atezolizumab in patients with advanced non-small cell lung cancer and history of asymptomatic, treated brain metastases: Exploratory analyses of the phase III OAK study. Lung Cancer 2019, 128, 105–112. [Google Scholar] [CrossRef]
- Loi, S.; Giobbie-Hurder, A.; Gombos, A.; Bachelot, T.; Hui, R.; Curigliano, G.; Campone, M.; Biganzoli, L.; Bonnefoi, H.; Jerusalem, G.; et al. Pembrolizumab plus trastuzumab in trastuzumab-resistant, advanced, HER2-positive breast cancer (PANACEA): A single-arm, multicentre, phase 1b-2 trial. Lancet Oncol. 2019, 20, 371–382. [Google Scholar] [CrossRef]
- Nanda, R.; Chow, L.Q.; Dees, E.C.; Berger, R.; Gupta, S.; Geva, R.; Pusztai, L.; Pathiraja, K.; Aktan, G.; Cheng, J.D.; et al. Pembrolizumab in Patients with Advanced Triple-Negative Breast Cancer: Phase Ib KEYNOTE-012 Study. J. Clin. Oncol. 2016, 34, 2460–2467. [Google Scholar] [CrossRef]
- Adams, S.; Schmid, P.; Rugo, H.S.; Winer, E.P.; Loirat, D.; Awada, A.; Cescon, D.W.; Iwata, H.; Campone, M.; Nanda, R.; et al. Pembrolizumab monotherapy for previously treated metastatic triple-negative breast cancer: Cohort A of the phase II KEYNOTE-086 study. Ann. Oncol. 2019, 30, 397–404. [Google Scholar] [CrossRef]
- Botticelli, A.; Onesti, C.E.; Zizzari, I.; Cerbelli, B.; Sciattella, P.; Occhipinti, M.; Roberto, M.; Di Pietro, F.; Bonifacino, A.; Ghidini, M.; et al. The sexist behaviour of immune checkpoint inhibitors in cancer therapy? Oncotarget 2017, 8, 99336–99346. [Google Scholar] [CrossRef]
- Cortellini, A.; Bersanelli, M.; Santini, D.; Buti, S.; Tiseo, M.; Cannita, K.; Perrone, F.; Giusti, R.; De Tursi, M.; Zoratto, F.; et al. Another side of the association between body mass index (BMI) and clinical outcomes of cancer patients receiving programmed cell death protein-1 (PD-1)/ Programmed cell death-ligand 1 (PD-L1) checkpoint inhibitors: A multicentre analysis of immune-related adverse events. Eur. J. Cancer 2020, 128, 17–26. [Google Scholar] [CrossRef] [PubMed]
- Toulmonde, M.; Penel, N.; Adam, J.; Chevreau, C.; Blay, J.Y.; Le Cesne, A.; Bompas, E.; Piperno-Neumann, S.; Cousin, S.; Grellety, T.; et al. Use of PD-1 Targeting, Macrophage Infiltration, and IDO Pathway Activation in Sarcomas: A Phase 2 Clinical Trial. JAMA Oncol. 2018, 4, 93–97. [Google Scholar] [CrossRef] [PubMed]
- Vojvodic, J.; Mihajlovic, G.; Vojvodic, P.; Radomirovic, D.; Vojvodic, A.; Vlaskovic-Jovicevic, T.; Peric-Hajzler, Z.; Matovic, D.; Dimitrijevic, S.; Sijan, G.; et al. The Impact of Immunological Factors on Depression Treatment—Relation Between Antidepressants and Immunomodulation Agents. Open Access Maced. J. Med. Sci. 2019, 7, 3064–3069. [Google Scholar] [CrossRef] [PubMed]
- Morello, S.; Capone, M.; Sorrentino, C.; Giannarelli, D.; Madonna, G.; Mallardo, D.; Grimaldi, A.M.; Pinto, A.; Ascierto, P.A. Soluble CD73 as biomarker in patients with metastatic melanoma patients treated with nivolumab. J. Transl. Med. 2017, 15, 244. [Google Scholar] [CrossRef] [PubMed]
- Passarelli, A.; Tucci, M.; Mannavola, F.; Felici, C.; Silvestris, F. The metabolic milieu in melanoma: Role of immune suppression by CD73/adenosine. Tumour Biol. 2019, 42, 1010428319837138. [Google Scholar] [CrossRef] [PubMed]
- Allard, B.; Longhi, M.S.; Robson, S.C.; Stagg, J. The ectonucleotidases CD39 and CD73: Novel checkpoint inhibitor targets. Immunol. Rev. 2017, 276, 121–144. [Google Scholar] [CrossRef]
- Vieyra-Lobato, M.R.; Vela-Ojeda, J.; Montiel-Cervantes, L.; López-Santiago, R.; Moreno-Lafont, M.C. Description of CD8+ Regulatory T Lymphocytes and Their Specific Intervention in Graft-versus-Host and Infectious Diseases, Autoimmunity, and Cancer. J. Immunol. Res. 2018, 3758713. [Google Scholar] [CrossRef]
- Cerbelli, B.; Botticelli, A.; Pisano, A.; Pernazza, A.; Campagna, D.; De Luca, A.; Ascierto, P.A.; Pignataro, M.G.; Pelullo, M.; Rocca, C.D.; et al. CD73 expression and pathologic response to neoadjuvant chemotherapy in triple negative breast cancer. Virchows Arch. 2019. [Google Scholar] [CrossRef]
- Botticelli, A.; Zizzari, I.; Mazzuca, F.; Ascierto, P.A.; Putignani, L.; Marchetti, L.; Napoletano, C.; Nuti, M.; Marchetti, P. Cross-talk between microbiota and immune fitness to steer and control response to anti PD-1/PDL-1 treatment. Oncotarget 2017, 8, 8890–8899. [Google Scholar] [CrossRef]
- Botticelli, A.; Vernocchi, P.; Marini, F.; Quagliariello, A.; Cerbelli, B.; Reddel, S.; Del Chierico, F.; Di Pietro, F.; Giusti, R.; Tomassini, A.; et al. Gut metabolomics profiling of non-small cell lung cancer (NSCLC) patients under immunotherapy treatment. J. Transl. Med. 2020, 18, 49. [Google Scholar] [CrossRef]
- Routy, B.; Le Chatelier, E.; Derosa, L.; Duong, C.P.M.; Alou, M.T.; Daillère, R.; Fluckiger, A.; Messaoudene, M.; Rauber, C.; Roberti, M.P.; et al. Gut microbiome influences efficacy of PD-1-based immunotherapy against epithelial tumors. Science 2018, 359, 91–97. [Google Scholar] [CrossRef] [PubMed]
- Cortellini, A.; Buti, S.; Santini, D.; Perrone, F.; Giusti, R.; Tiseo, M.; Bersanelli, M.; Michiara, M.; Grassadonia, A.; Brocco, D.; et al. Clinical Outcomes of Patients with Advanced Cancer and Pre-Existing Autoimmune Diseases Treated with Anti-Programmed Death-1 Immunotherapy: A Real-World Transverse Study. Oncologist 2019, 24, 327–337. [Google Scholar] [CrossRef]
- Bilen, M.A.; Shabto, J.M.; Martini, D.J.; Liu, Y.; Lewis, C.; Collins, H.; Akce, M.; Kissick, H.; Carthon, B.C.; Shaib, W.L.; et al. Sites of metastasis and association with clinical outcome in advanced stage cancer patients treated with immunotherapy. BMC Cancer 2019, 19, 857. [Google Scholar] [CrossRef] [PubMed]
- Botticelli, A.; Salati, M.; Di Pietro, F.R.; Strigari, L.; Cerbelli, B.; Zizzari, I.G.; Giusti, R.; Mazzotta, M.; Mazzuca, F.; Roberto, M.; et al. A nomogram to predict survival in non-small cell lung cancer patients treated with Nivolumab. J. Transl. Med. 2019, 17, 99. [Google Scholar] [CrossRef]
- Tumeh, P.C.; Hellmann, M.D.; Hamid, O.; Tsai, K.K.; Loo, K.L.; Gubens, M.A.; Rosenblum, M.; Harview, C.L.; Taube, J.M.; Handley, N.; et al. Liver Metastasis and Treatment Outcome with Anti-PD-1 Monoclonal Antibody in Patients with Melanoma and NSCLC. Cancer Immunol. Res. 2017, 5, 417–424. [Google Scholar] [CrossRef] [PubMed]
- Achrol, A.S.; Rennert, R.C.; Anders, C.; Soffietti, R.; Ahluwalia, M.S.; Nayak, L.; Peters, S.; Arvold, N.D.; Harsh, G.R.; Steeg, P.S.; et al. Brain metastases. Nat. Rev. Dis. Primers 2019, 5, 5. [Google Scholar] [CrossRef]
- McGranahan, T.; Gordon, L.; Nagpal, S. History and current state of immunotherapy in glioma and brain metastasis. Ther. Adv. Med. Oncol. 2017, 9, 347–368. [Google Scholar] [CrossRef]
- Walsh, M.C.; Kim, N.; Kadono, Y.; Rho, J.; Lee, S.Y.; Lorenzo, J.; Choi, Y. Osteoimmunology: Interplay Between the Immune System and Bone Metabolism. Annu. Rev. Immunol. 2006, 24, 33–63. [Google Scholar] [CrossRef]
- Takayanagi, H. Osteoimmunology and the effects of the immune system on bone. Nat. Rev. Rheumatol. 2009, 5, 667–676. [Google Scholar] [CrossRef]


| Characteristics | Patients N | (%) |
|---|---|---|
| Gender | ||
| Male | 187 | 64% |
| Female | 104 | 36% |
| Histology | ||
| NSCLC ¹ squamous | 56 | 19% |
| NSCLC ¹ non squamous | 99 | 34% |
| Melanoma | 101 | 35% |
| RCC ² | 28 | 10% |
| Other | 7 | 2% |
| Metastatic Sites | ||
| 1 | 103 | 35% |
| 2 | 104 | 36% |
| 3 | 84 | 29% |
| Sites of Metastases | ||
| Lymph node | 140 | 48% |
| Liver | 59 | 20% |
| Lung | 185 | 64% |
| Bone | 75 | 26% |
| Brain | 42 | 14% |
| ECOG PS ³ | ||
| 0 | 146 | 50% |
| 1 | 102 | 35% |
| 2 | 42 | 15% |
| Characteristics | Patients N | (%) |
|---|---|---|
| Immunotherapy Regimen | ||
| Nivolumab | 219 | 75% |
| Pembrolizumab | 60 | 21% |
| Atezolizumab | 11 | 4% |
| Avelumab | 1 | 0% |
| Durvalumab | 0 | 0% |
| Line of Treatment with Immunotherapy | ||
| 1st | 94 | 32% |
| 2nd | 147 | 51% |
| 3rd | 33 | 11% |
| 4th | 11 | 4% |
| 5th or more | 4 | 2% |
| Best Response to Immunotherapy | ||
| PD | 79 | 43% |
| CR | 15 | 8% |
| PR | 53 | 29% |
| NV | 5 | 3% |
| SD | 31 | 17% |
| ALL | 183 | 100% |
| Characteristics | OS | PFS | ||
|---|---|---|---|---|
| Hazard Ratio (95% CI) | p-Value | Hazard Ratio (95% CI) | p-Value | |
| Age ≥ 70 | 0.833 (0.568 to 1.191) | 0.302 | 1.044 (0.759 to 1.449) | 0.7716 |
| Gender | 1.140 (0.797 to 1.653) | 0.4571 | 1.174 (0.874 to 1.618) | 0.2705 |
| Tumor burden | 0.545 (0.369 to 0.749) | 0.0004 | 0.635 (0.448 to 0.817) | 0.0011 |
| Lymphnodes | 1.173 (0.833 to 1.691) | 0.3413 | 1.215 (0.919 to 1.673) | 0.1585 |
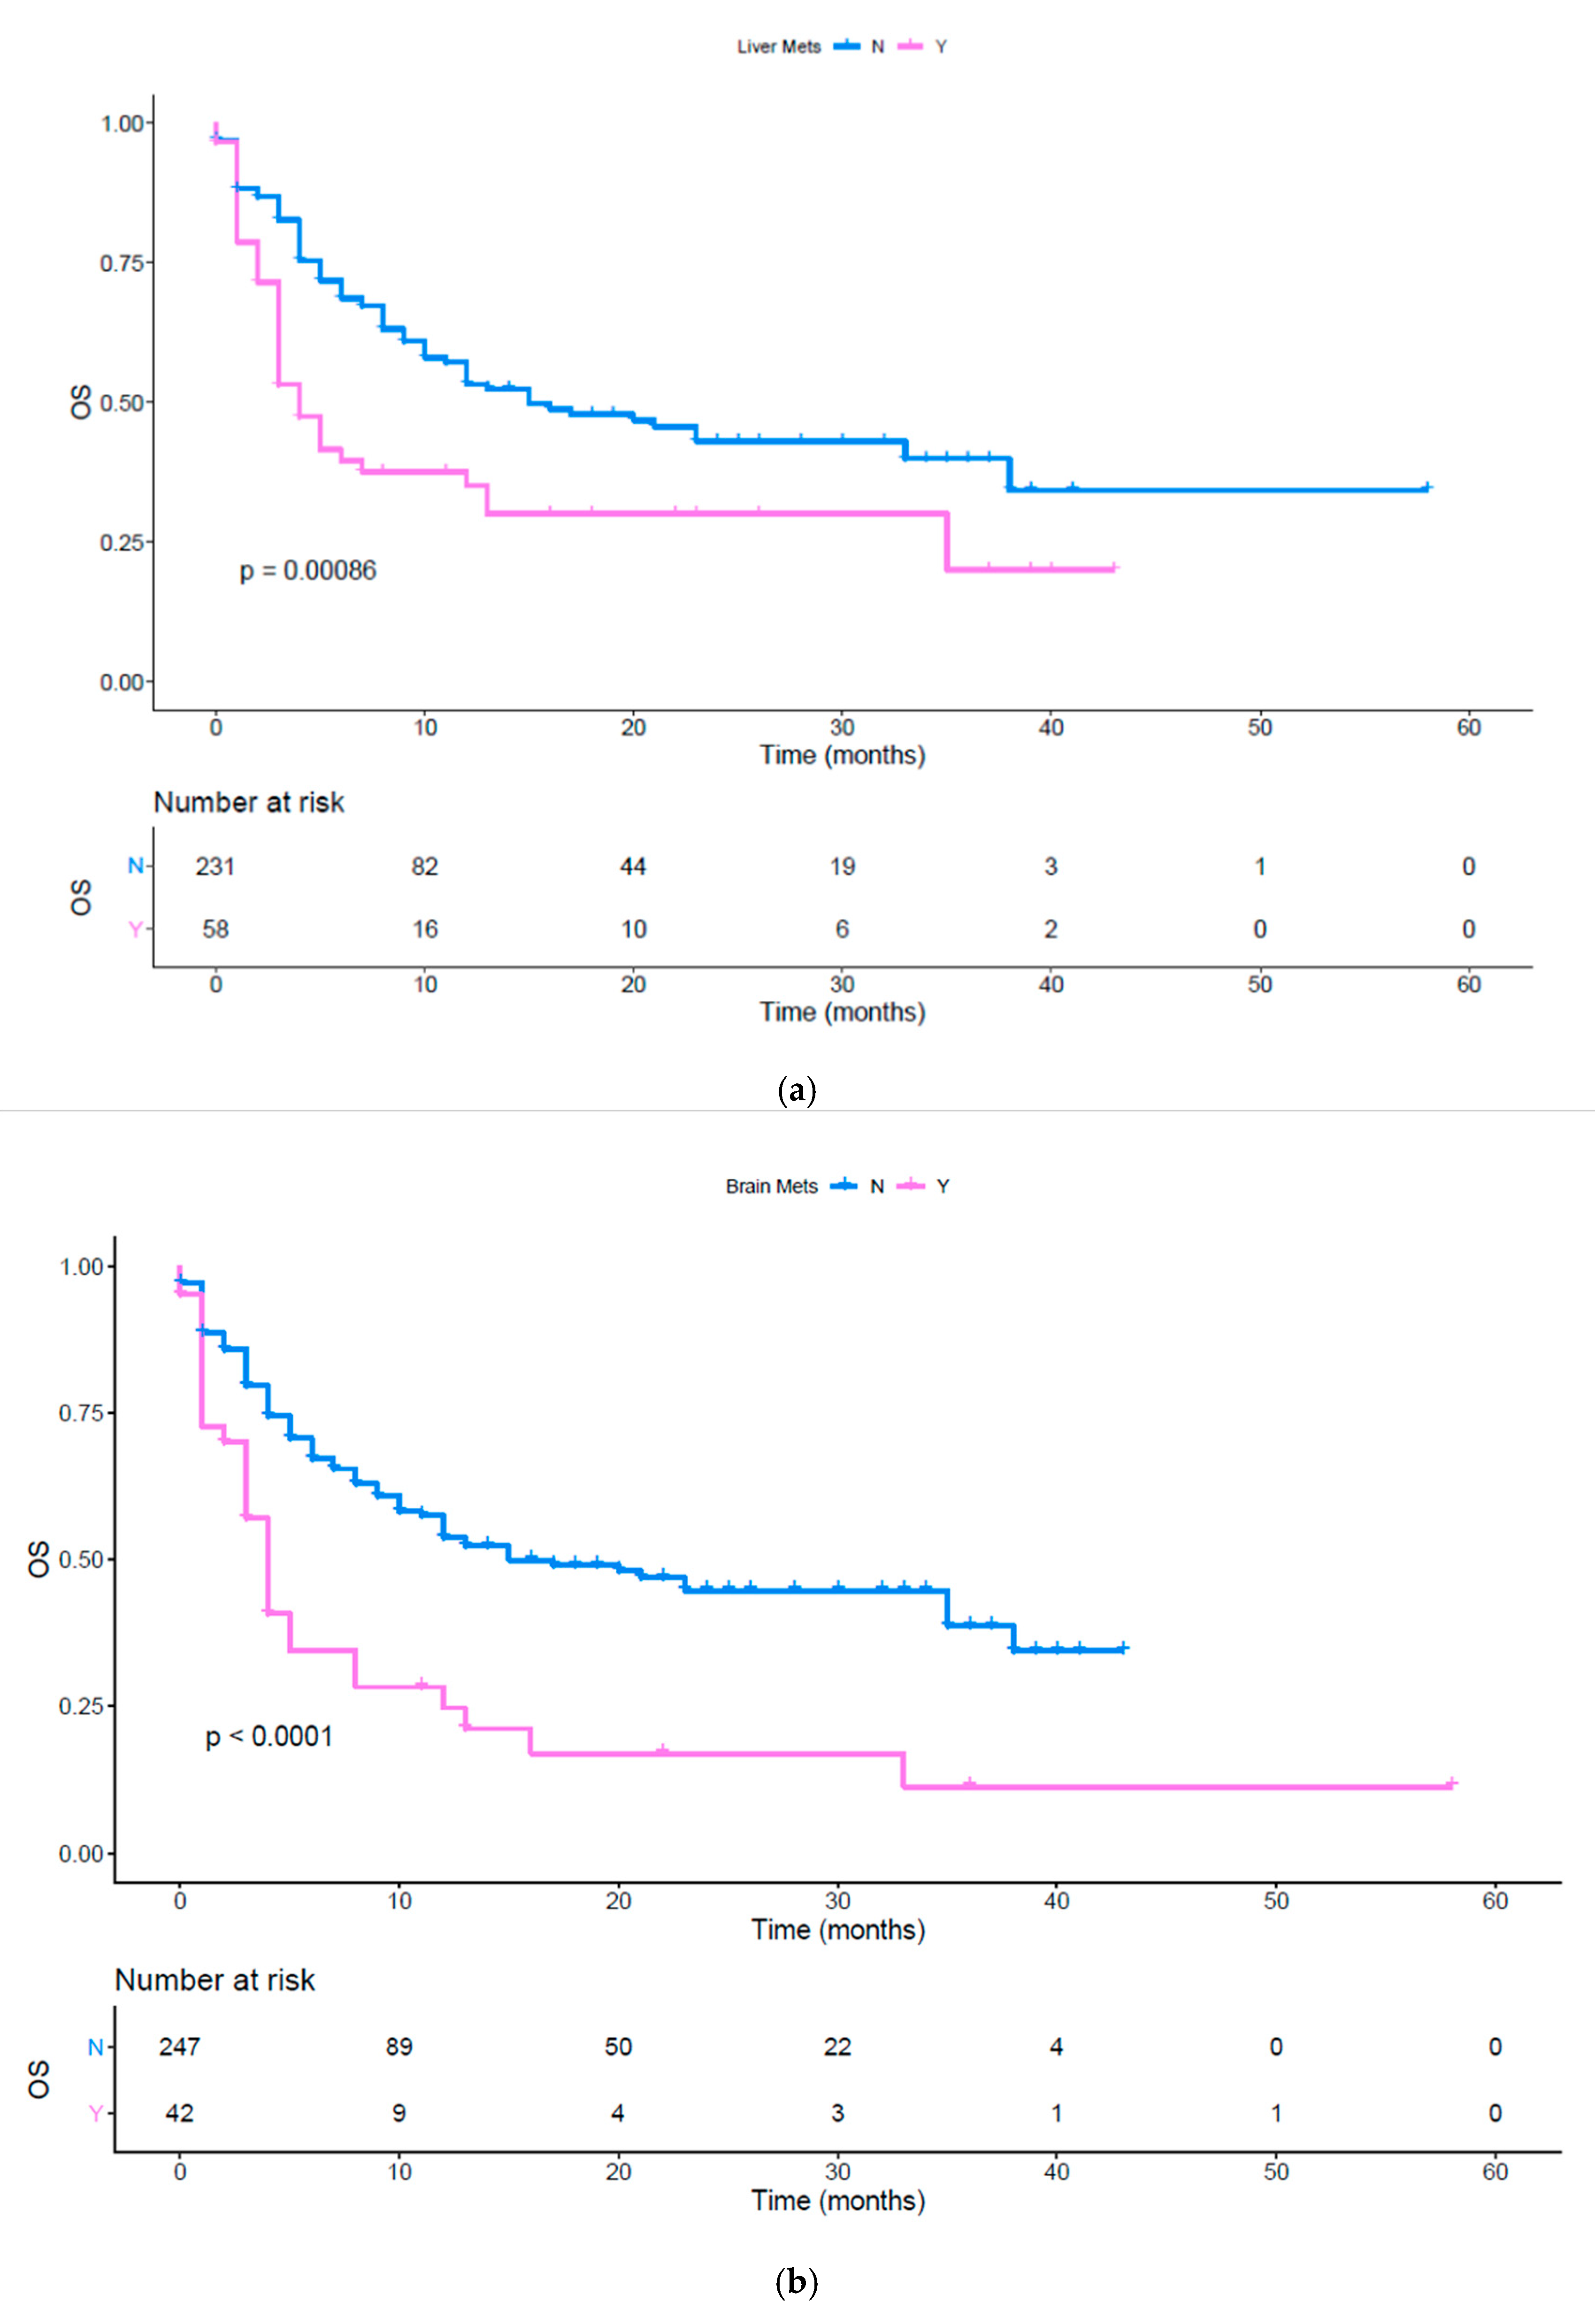
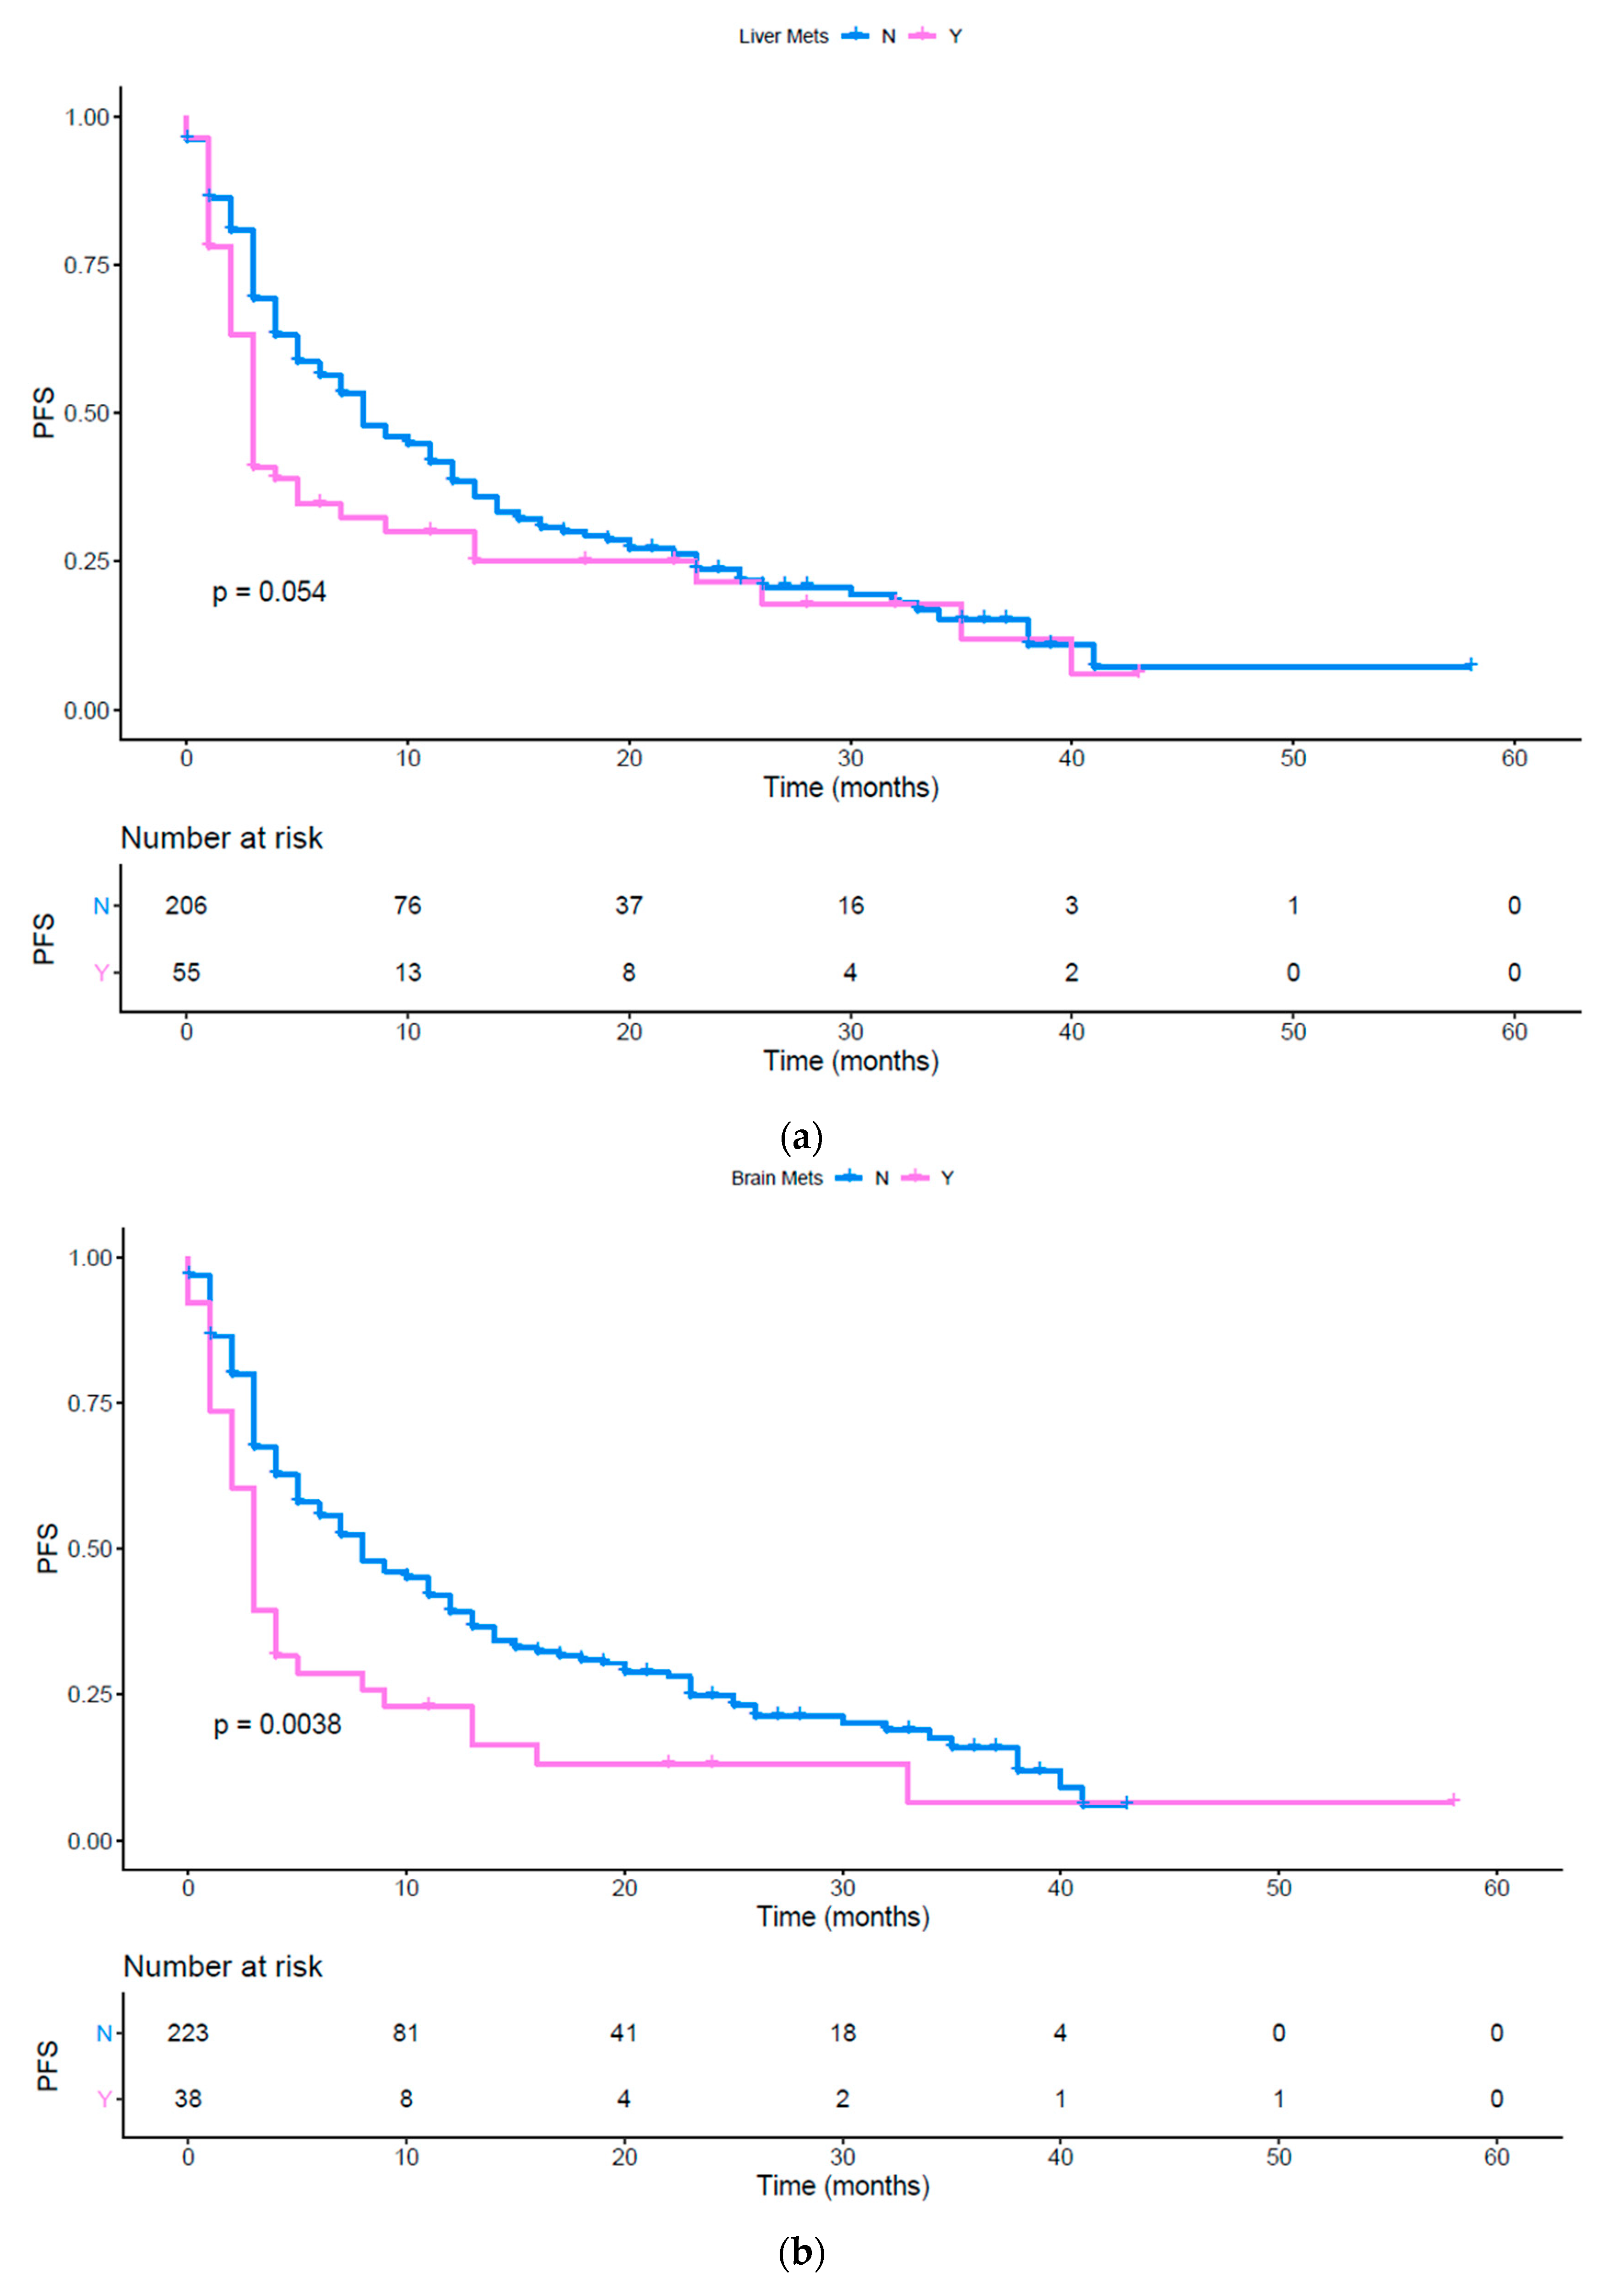
| Liver | 0.546 (0.293 to 0.727) | 0.0009 | 0.728 (0.458 to 1.005) | 0.0535 |
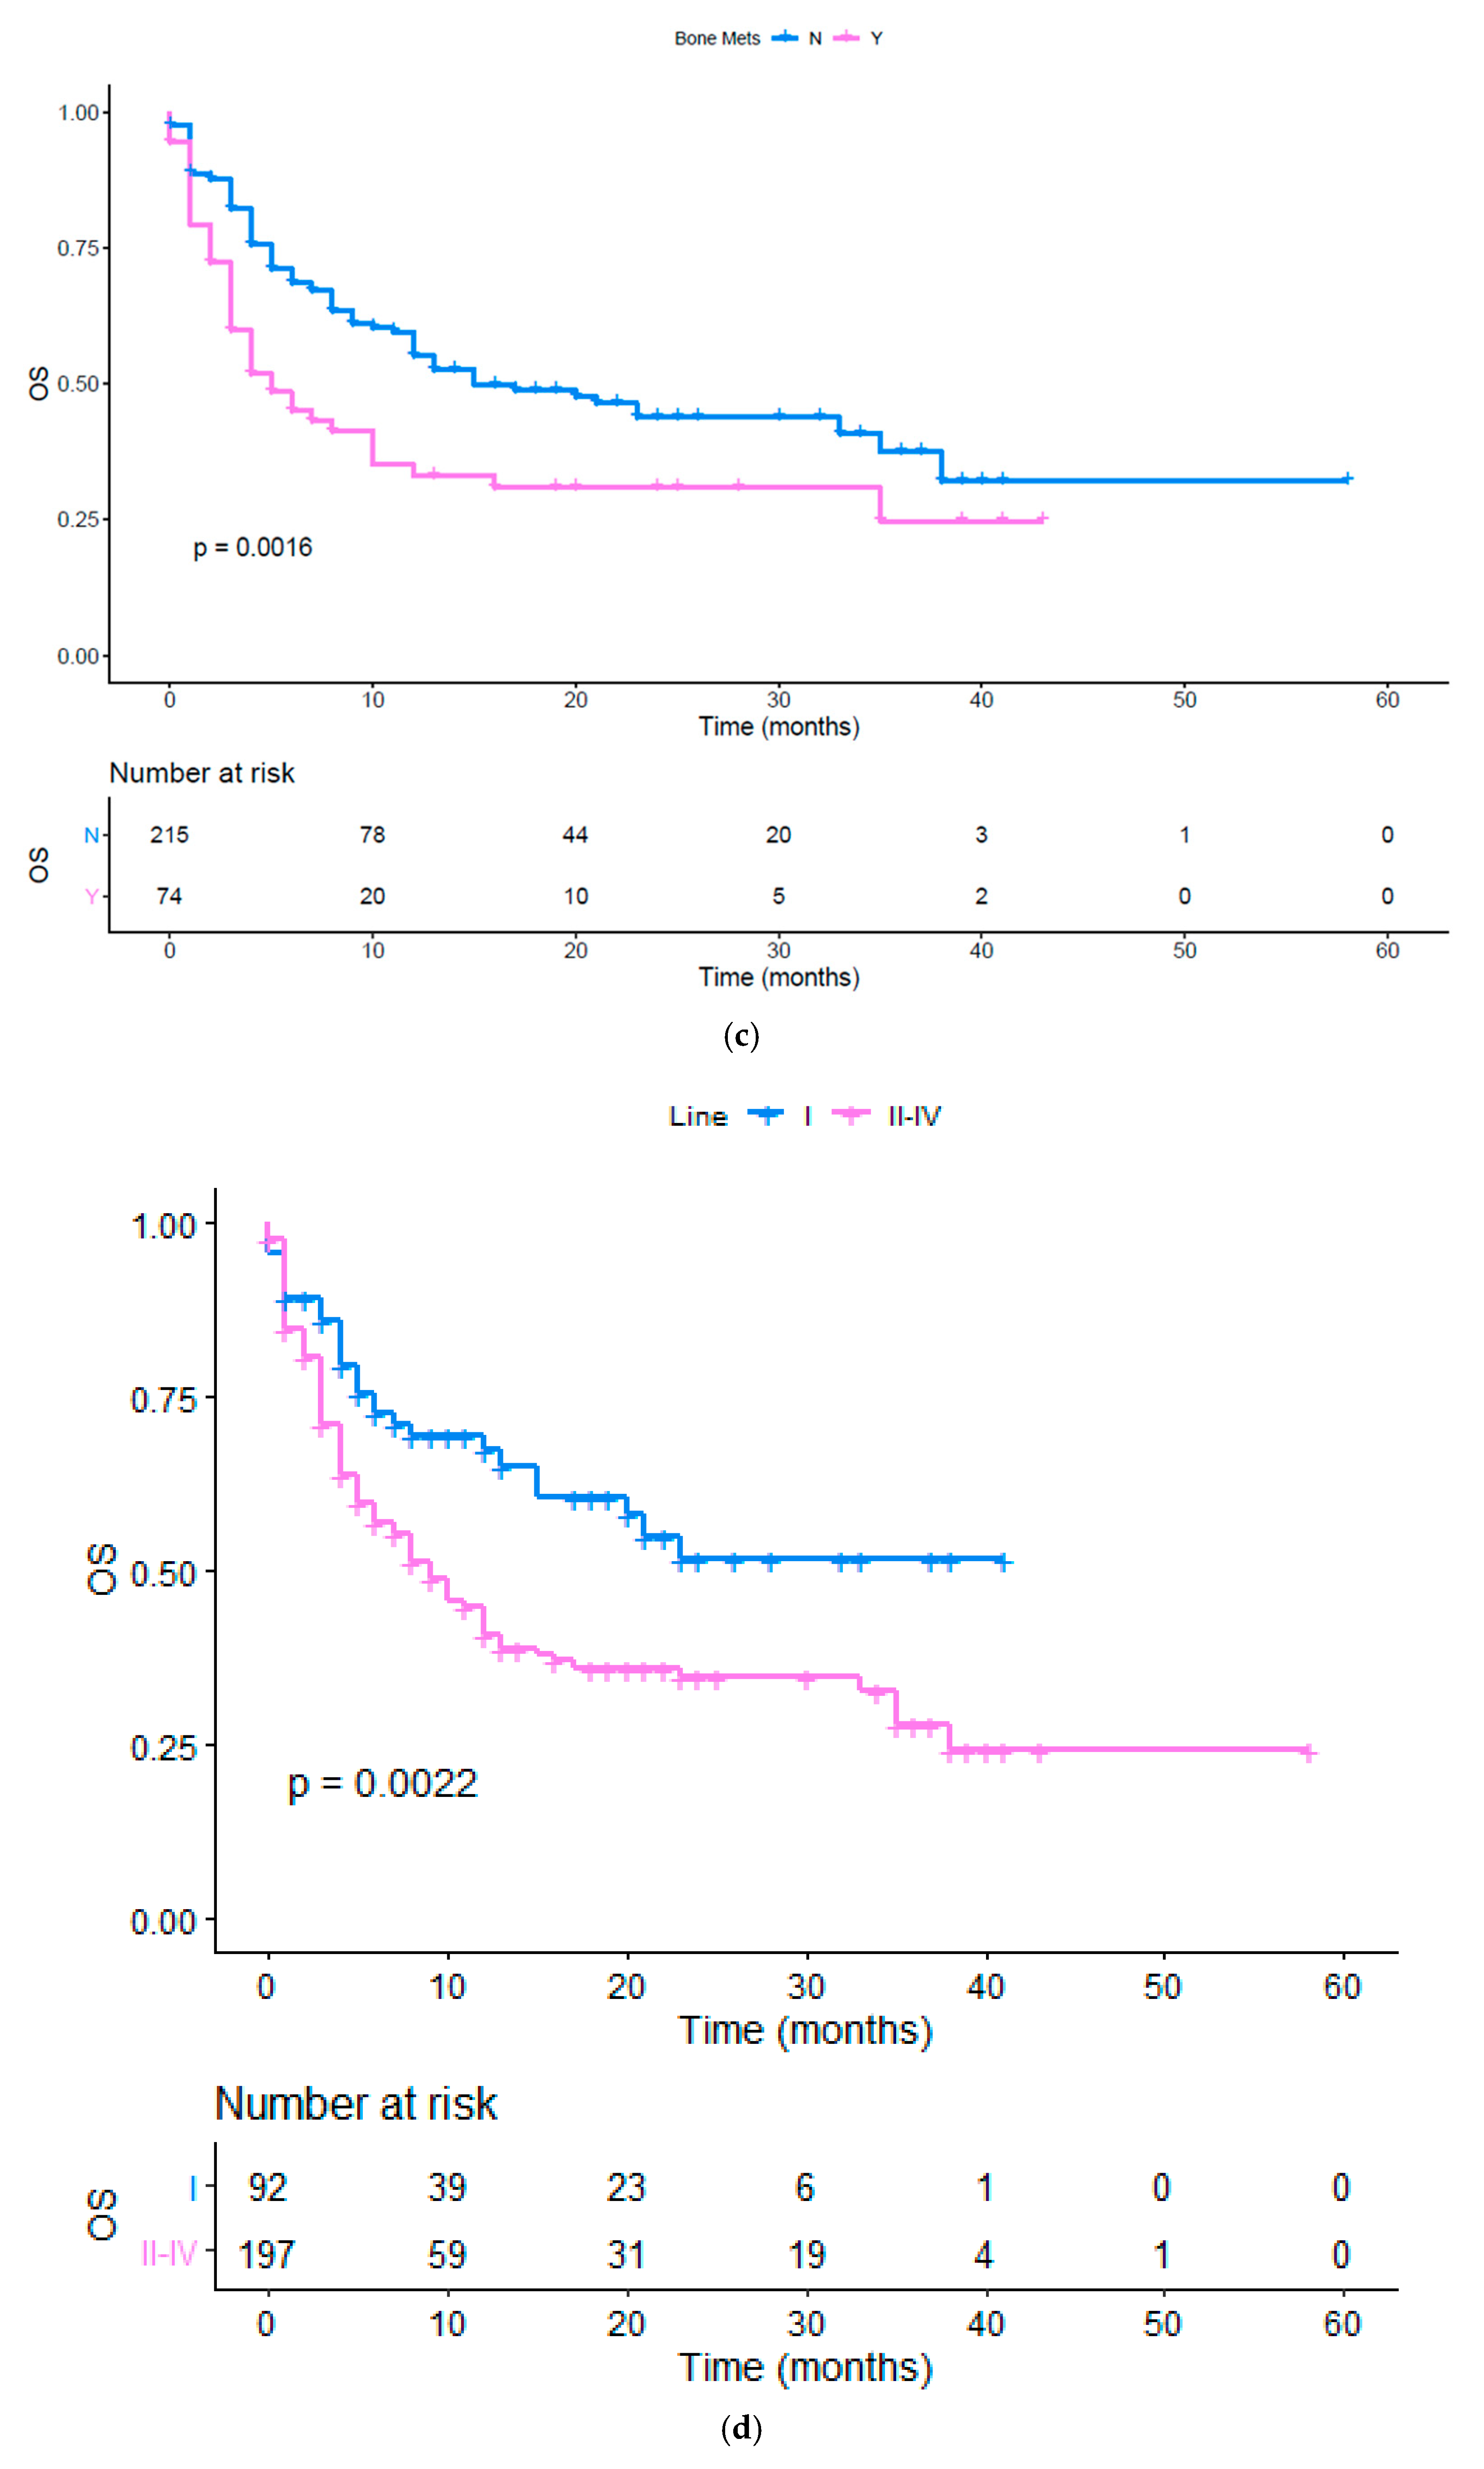
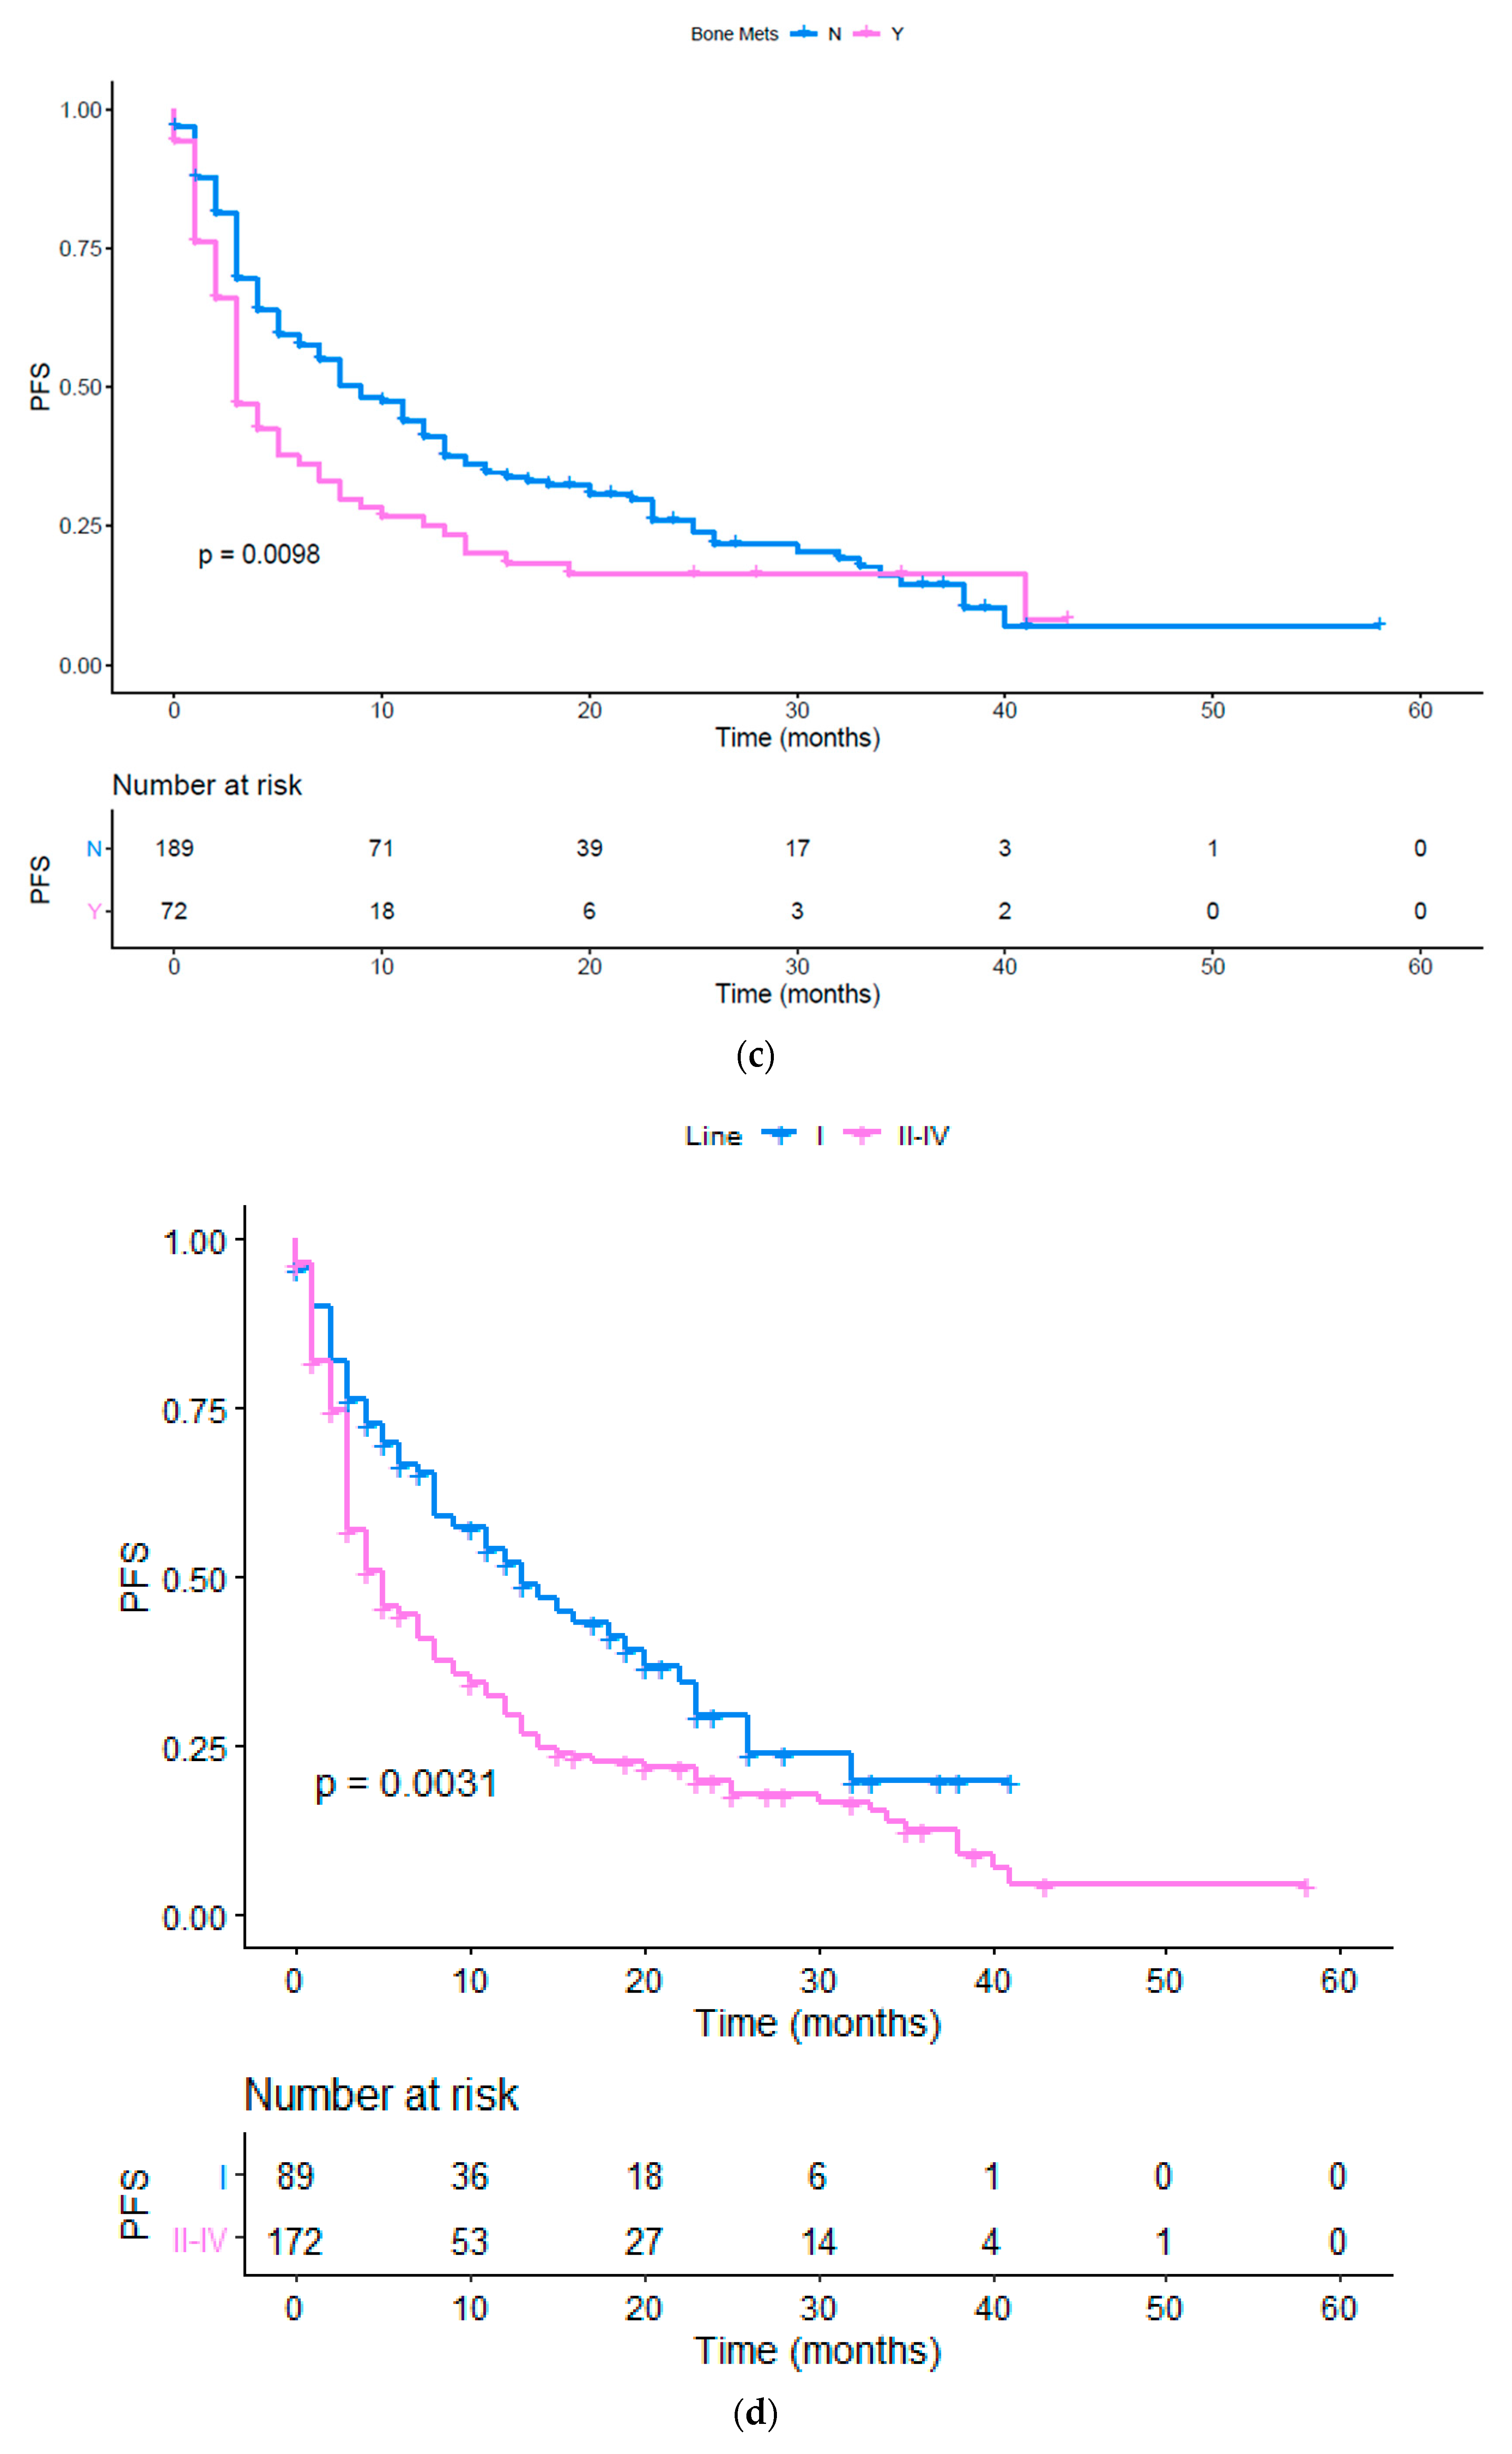
| Bone | 0.575 (0.334 to 0.774) | 0.0016 | 0.679 (0.436 to 0.892) | 0.0098 |
| Brain | 0.431 (0.168 to 0.507) | <0.0001 | 0.593 (0.307 to 0.796) | 0.0038 |
| Other met sites | 1.476 (1.022 to 2.140) | 0.0375 | 1.518 (1.131 to 2.113) | 0.0063 |
| N of metastatic sites > 2 | 0.818 (0.312 to 1.999) | 0.6198 | 1.303 (0.609 to 2.746) | 0.5025 |
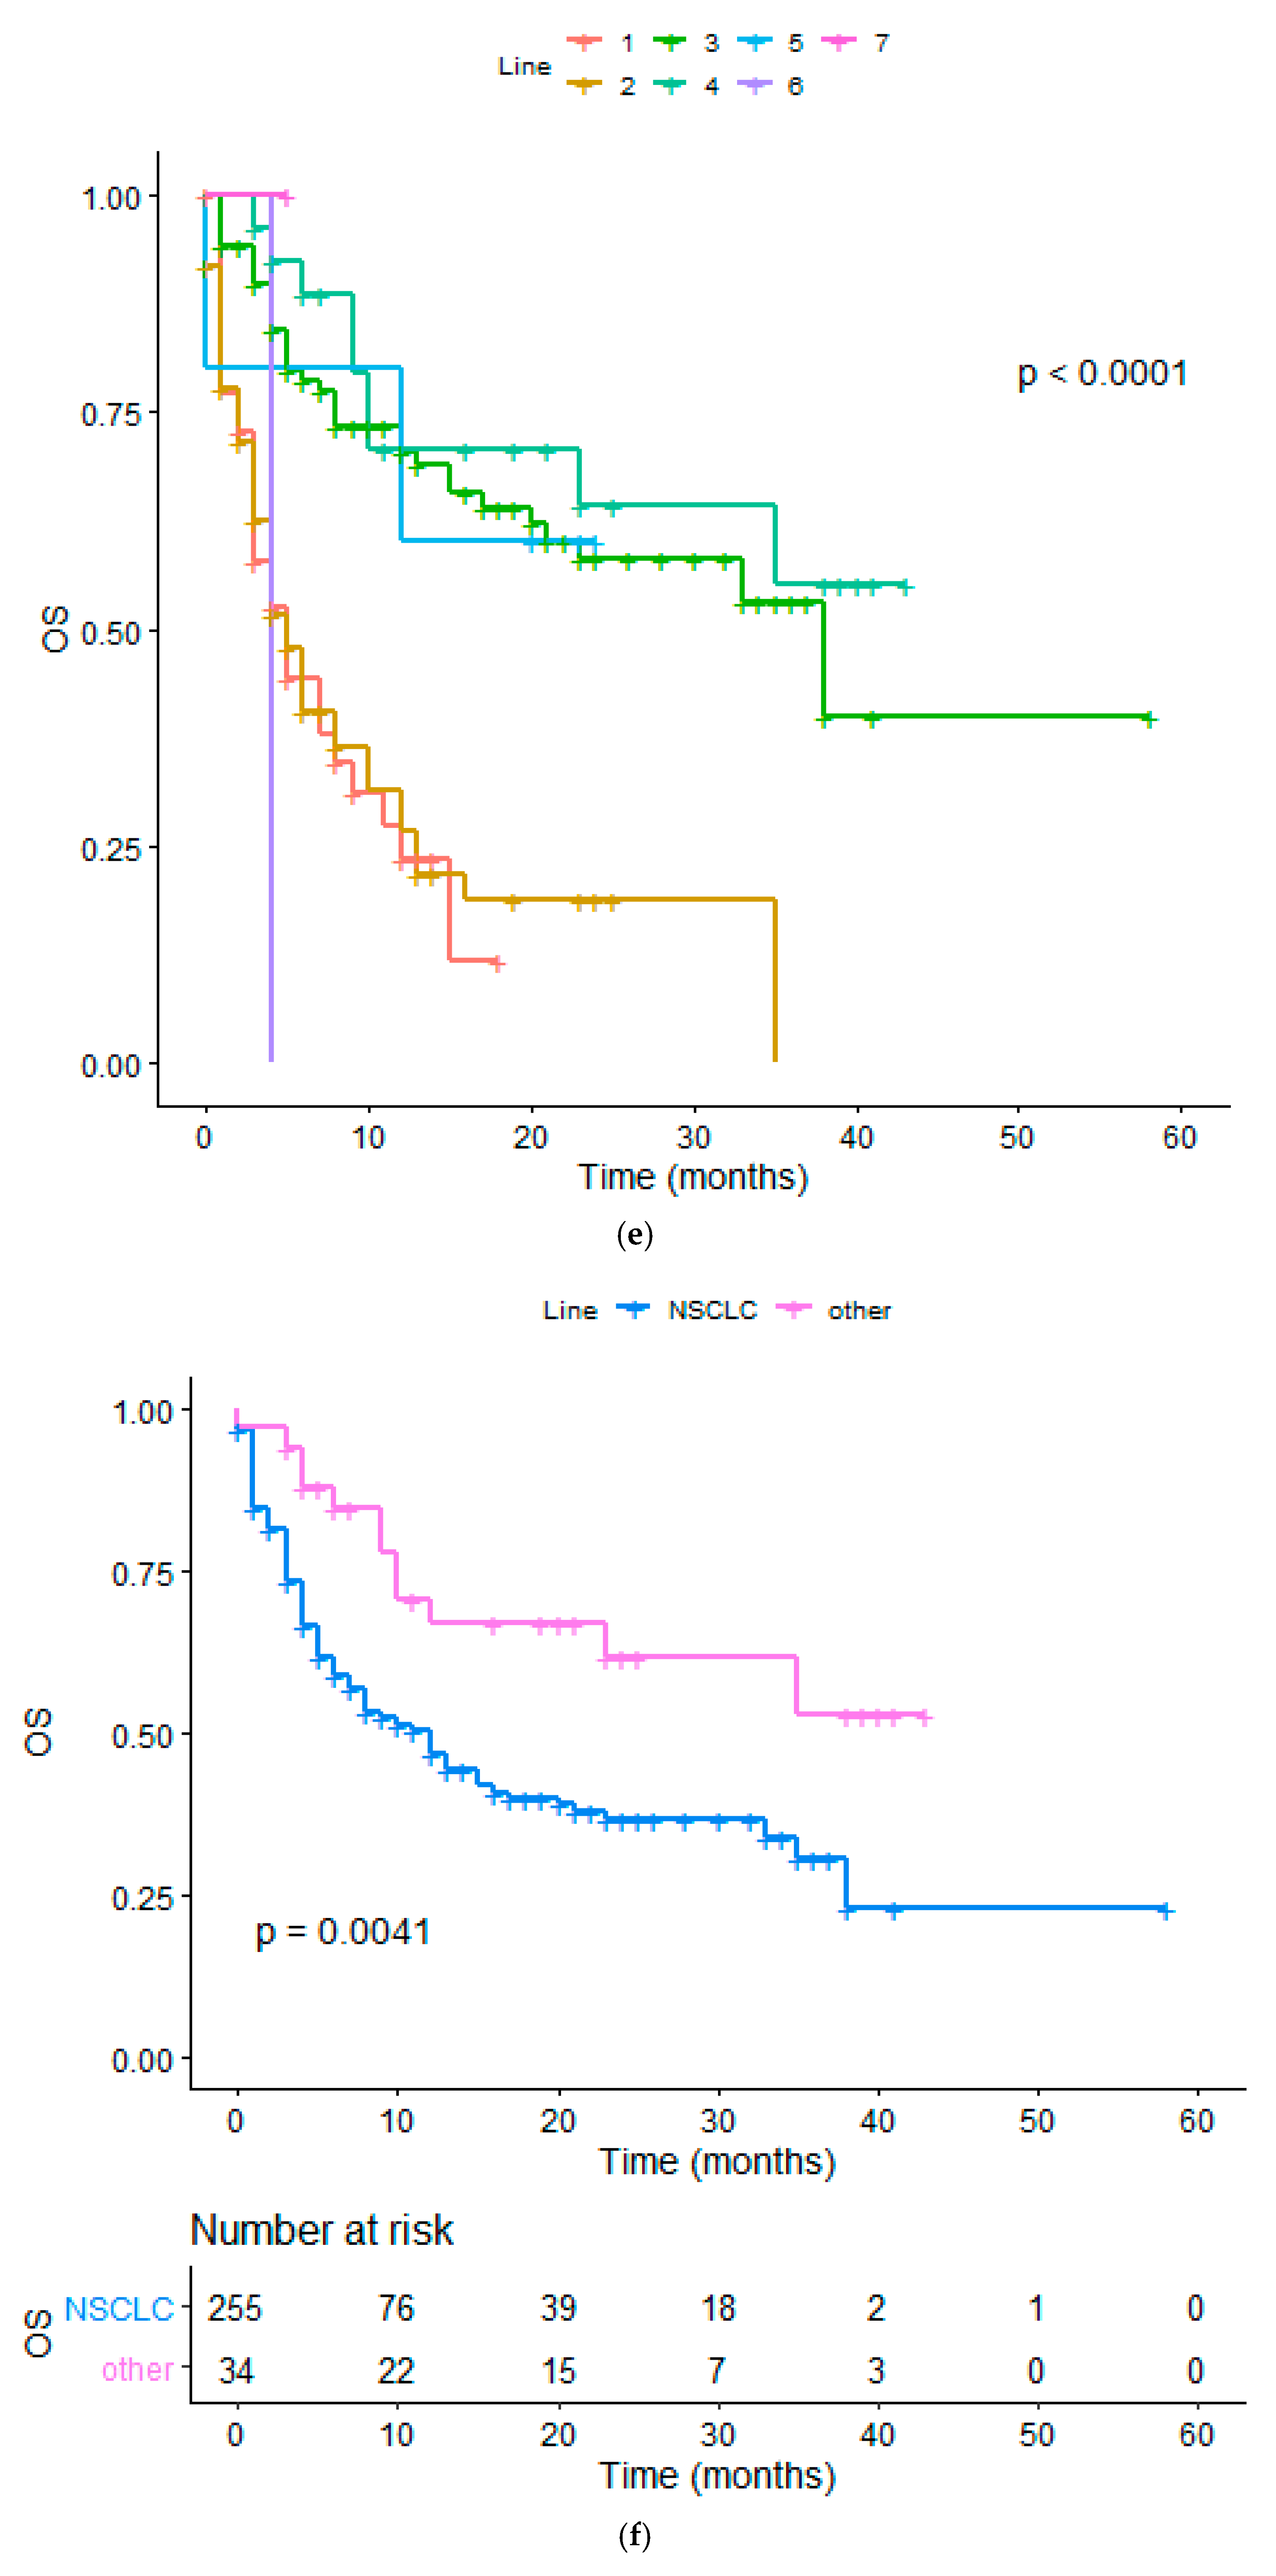
| Diagnosis(NSCLC vs. other) | 2.277 (1.254 to 3.143) | 0.0034 | 2.093 (1.320 to 2.822) | 0.0007 |
| ECOG PS ≥ 1 | 0.281 (0.170 to 0.356) | <0.0001 | 0.446 (0.275 to 0.518) | <0.0001 |
| Line (I vs. II or more) | 0.566 (0.398 to 0.831) | 0.0032 | 0.632 (0.459 to 0.854) | 0.0031 |
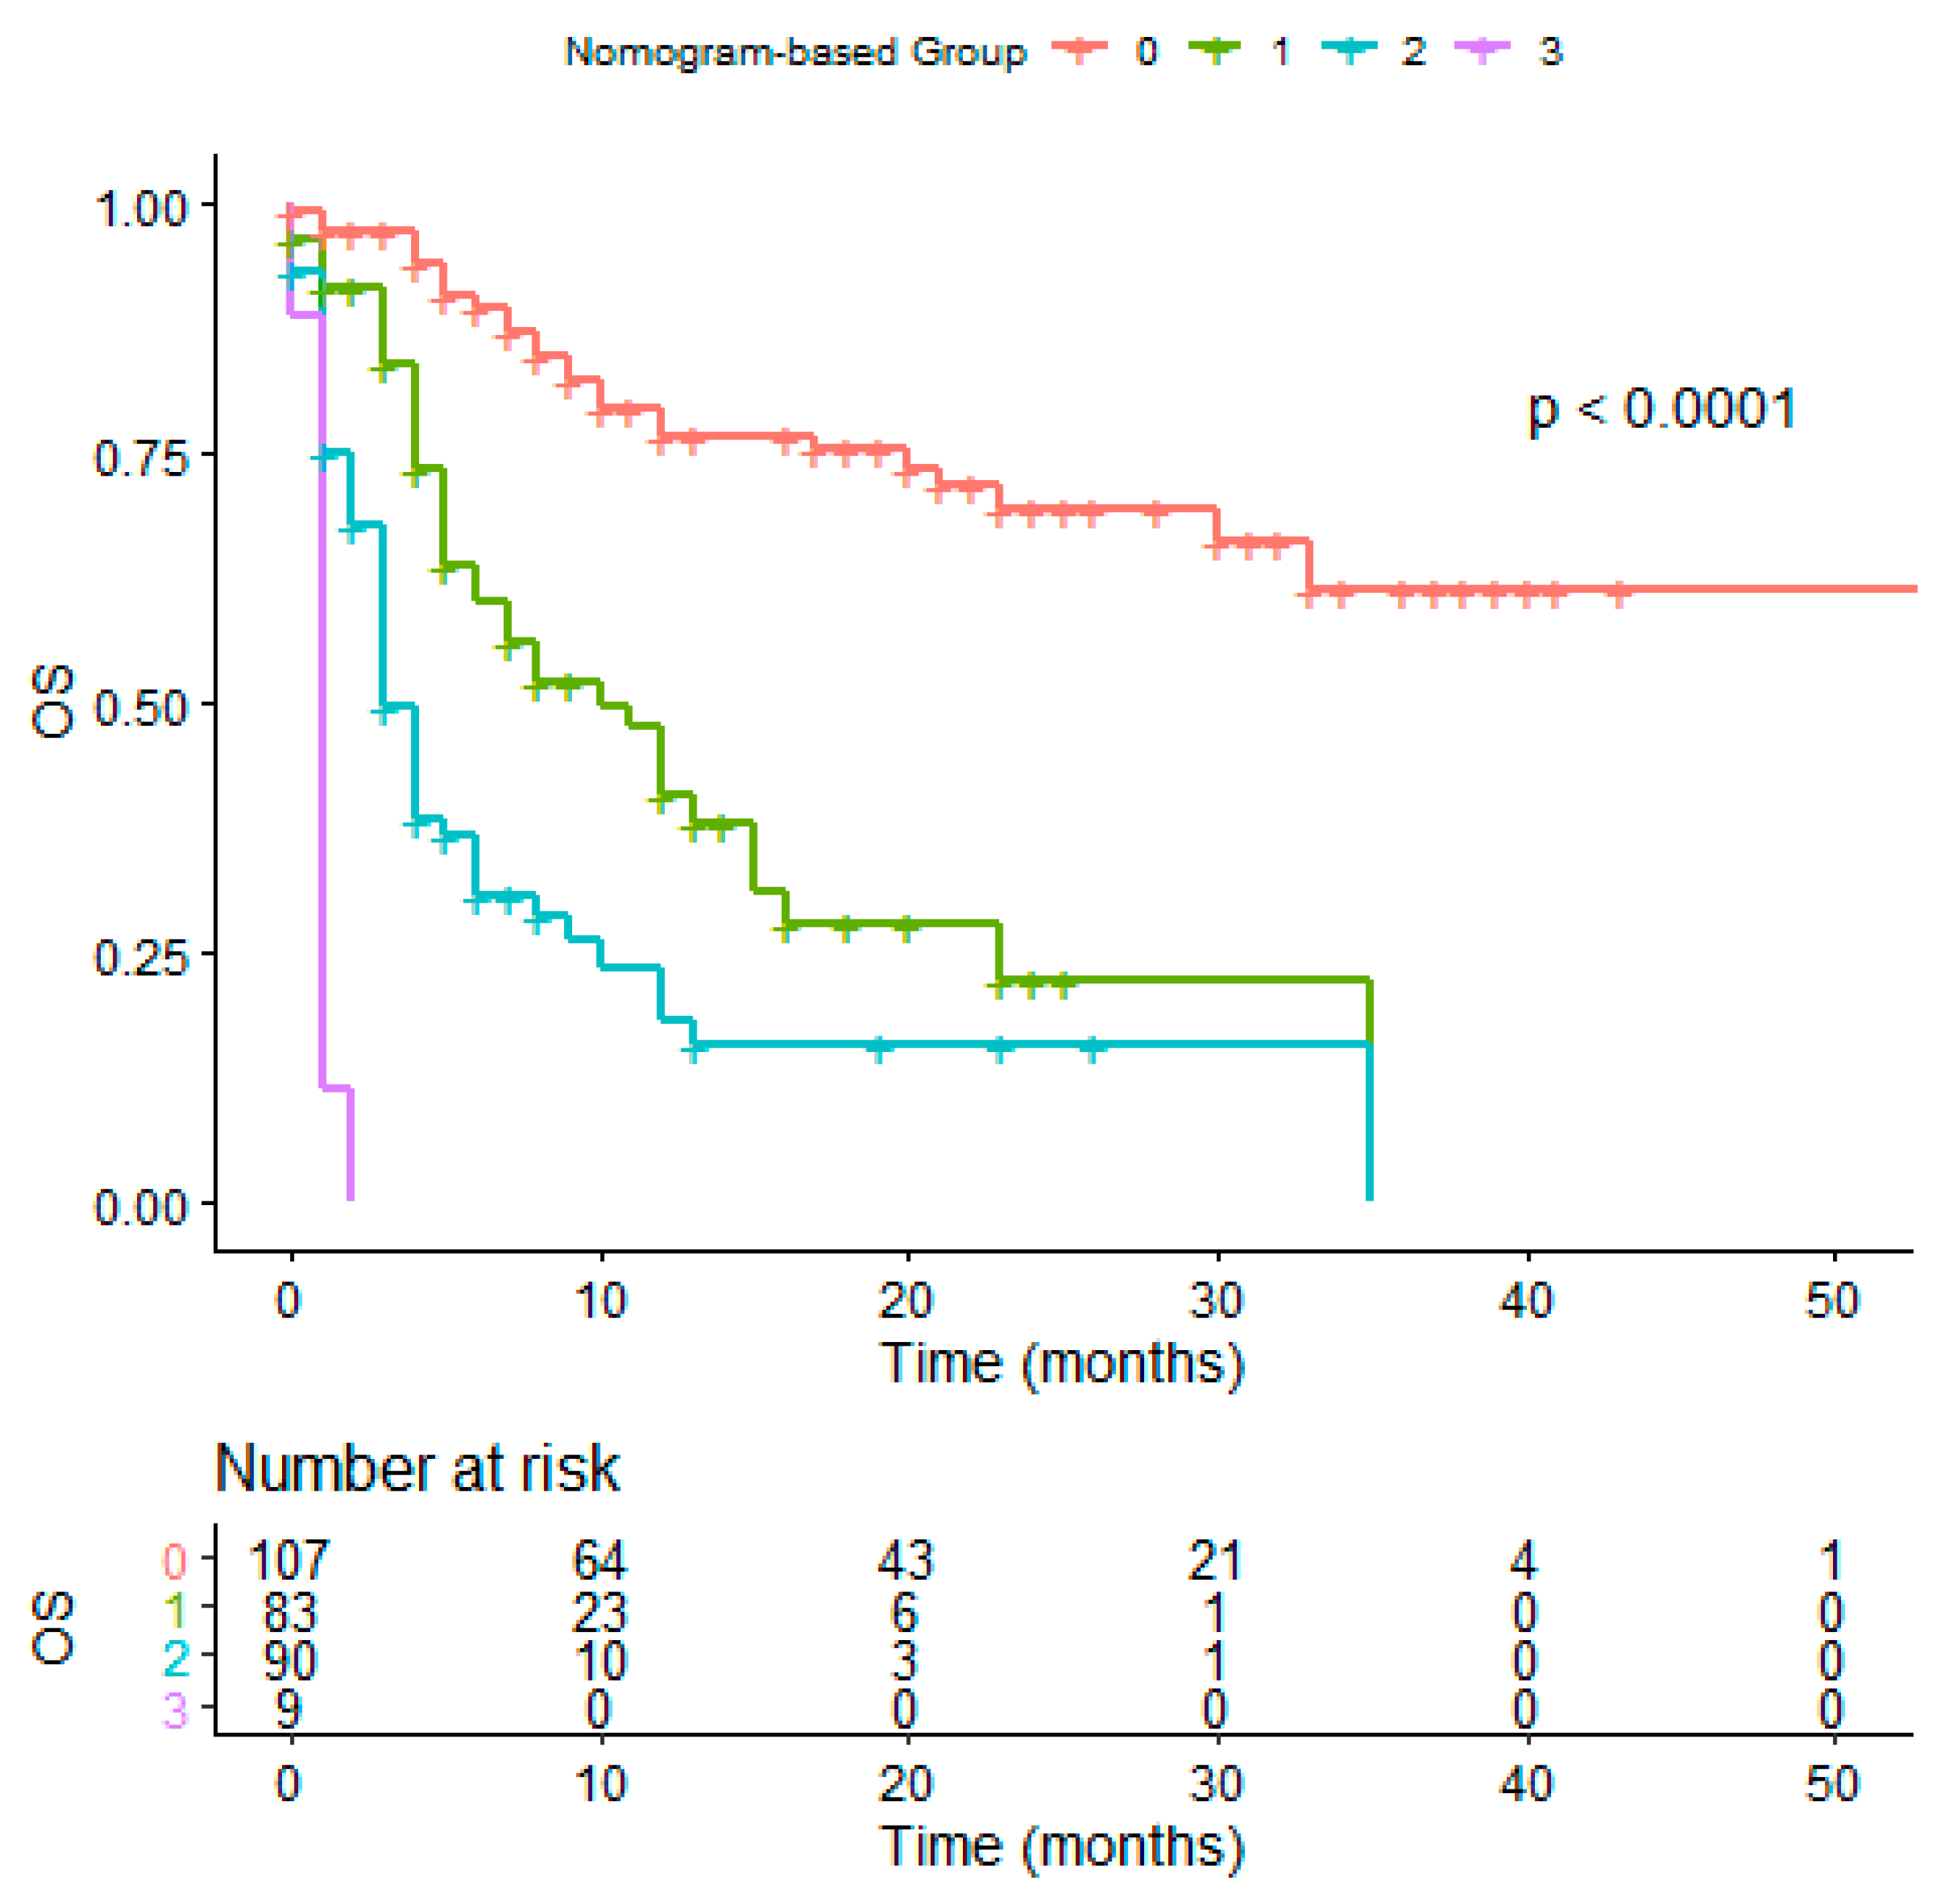
| Characteristics | 24-M OS Group 1 (%) | 24-M OS Group 2 (%) |
|---|---|---|
| Tumor burden (low vs. high) | 49.7 | 31.5 |
| Liver met. (no vs. yes) | 42.6 | 30.5 |
| Bone met. (no vs. yes) | 43.5 | 31 |
| Brain met. (no vs. yes) | 44.5 | 17 |
| ECOG PS (0 vs. ≥1) | 60 | 20.4 |
| Diagnosis (other vs. NSCLC) | 58.6 | 17.1 |
| Line (1st vs. 2nd or more) | 51.4 | 34.3 |
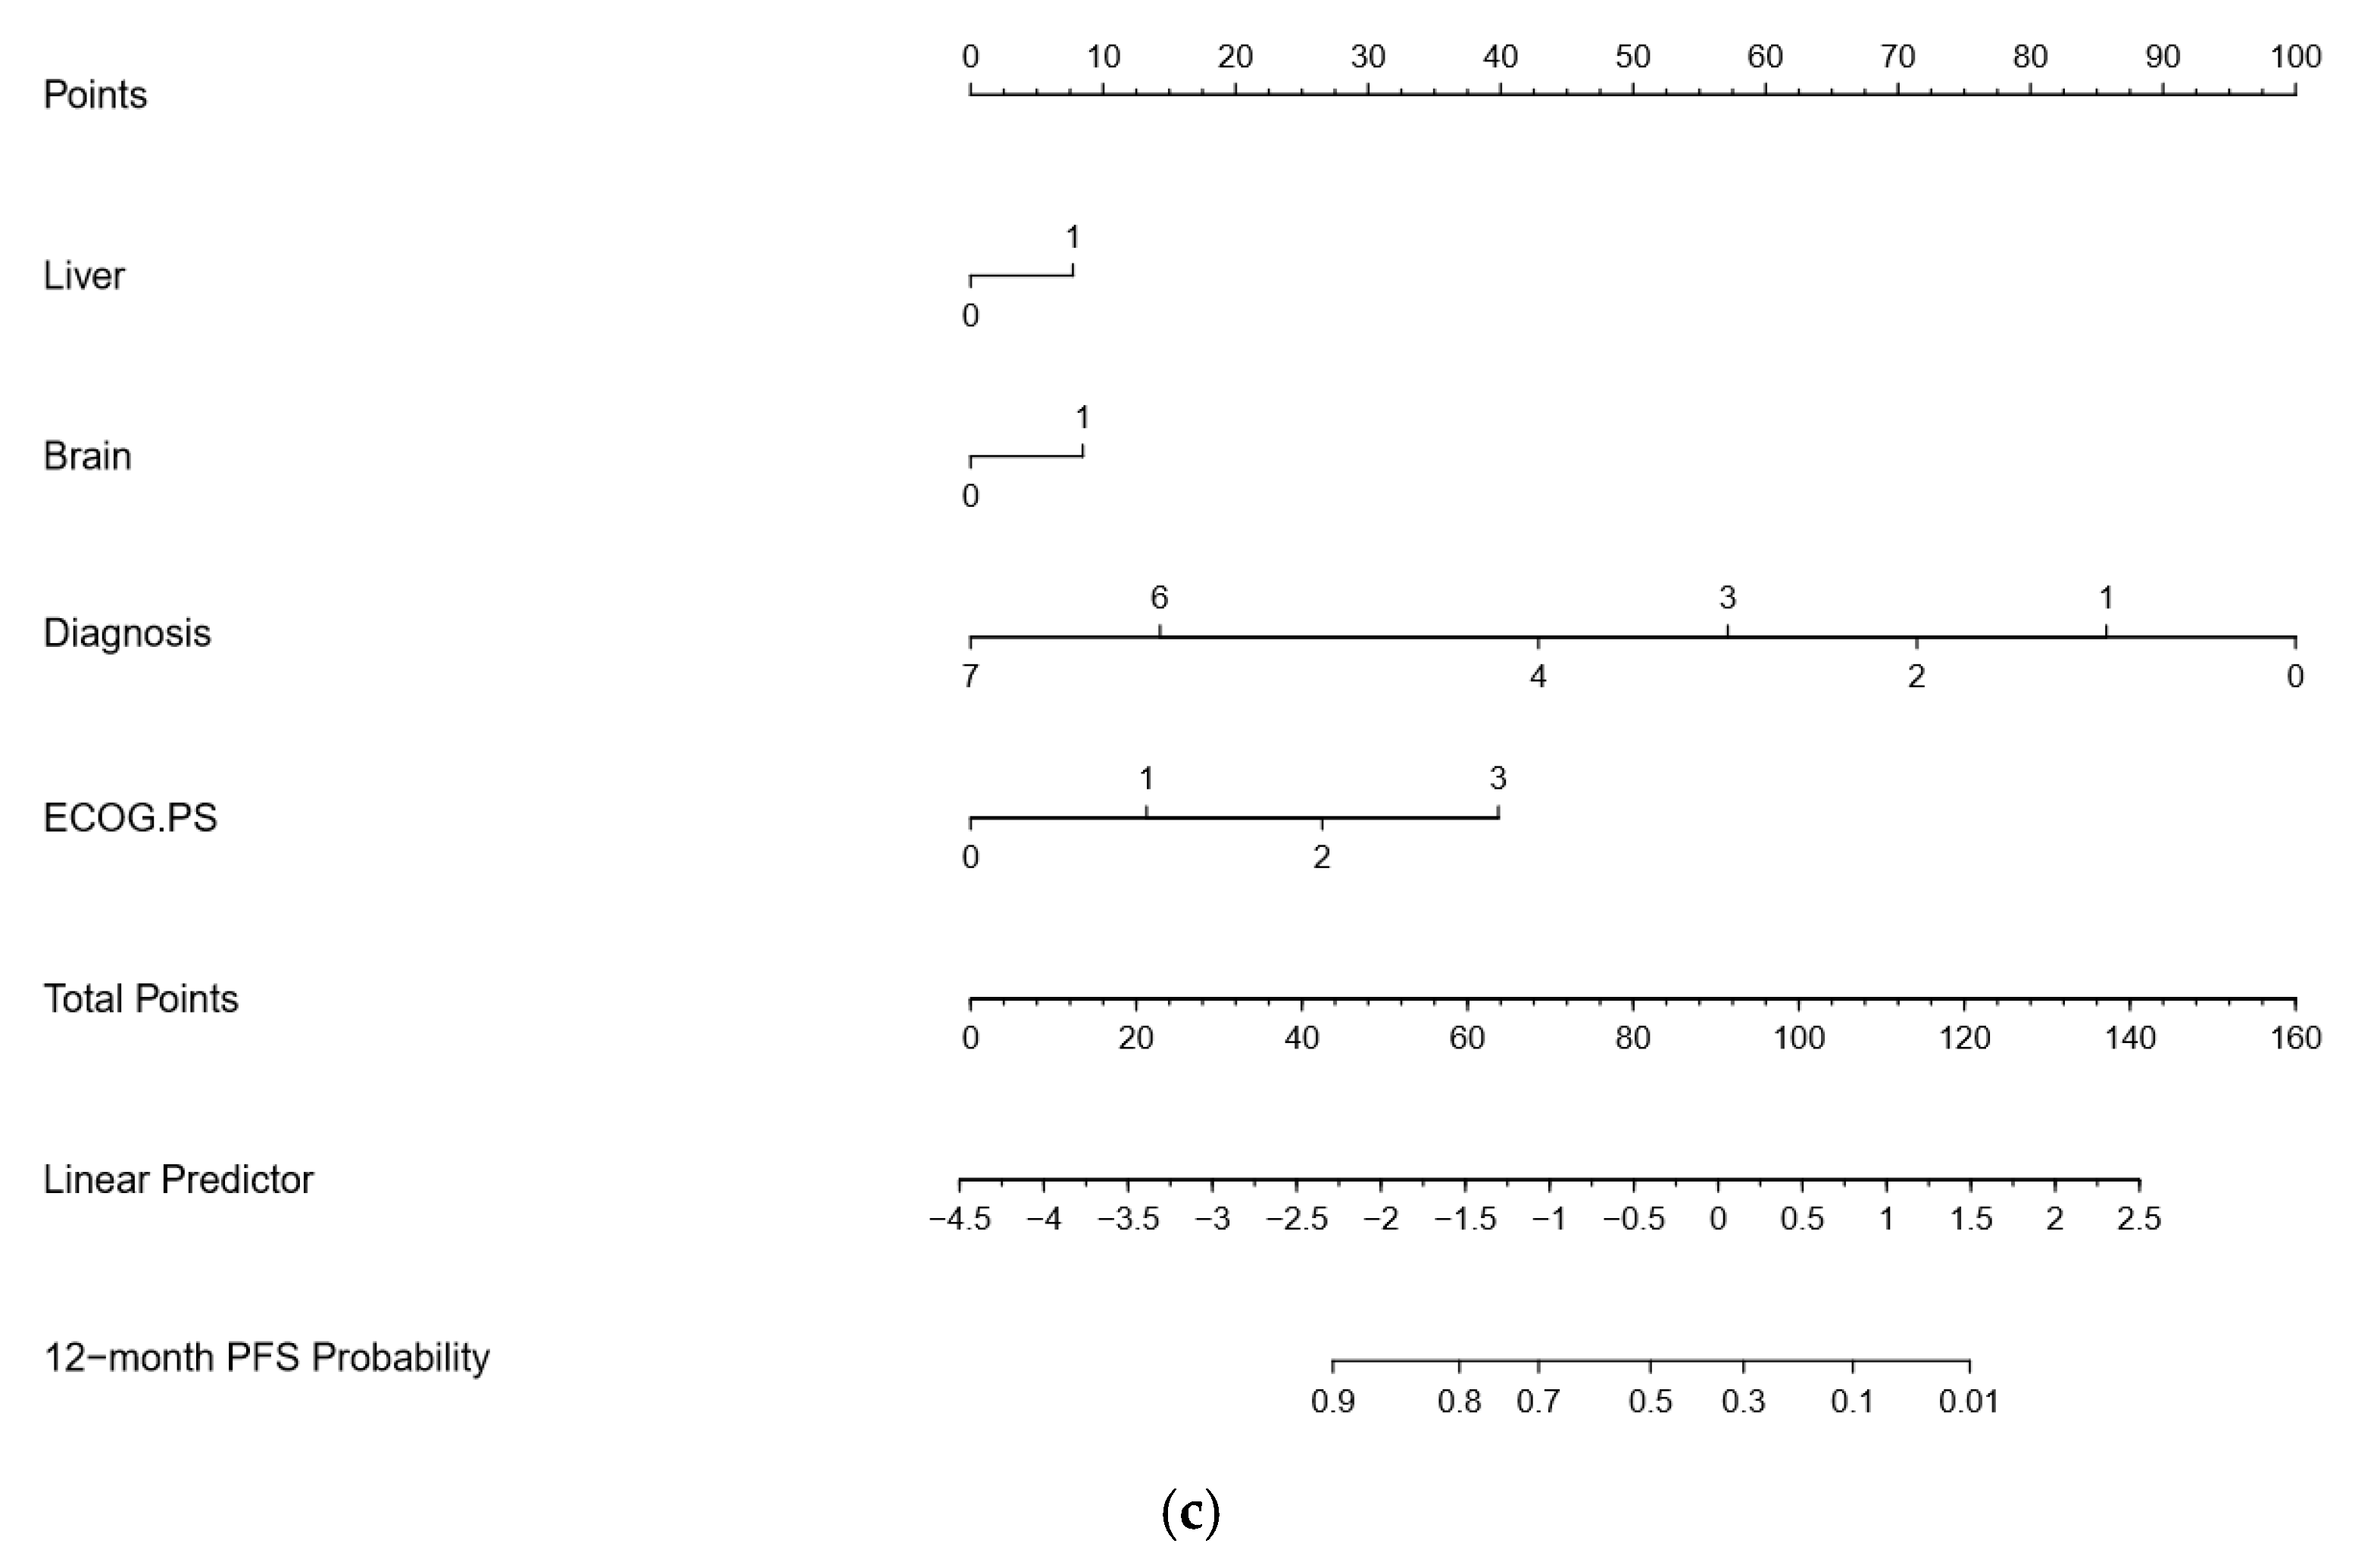
| MVA for Overall Survival (p < 0.0001) | ||||
|---|---|---|---|---|
| Covariate | b | Exp (b) | 95% CI of Exp (b) | p |
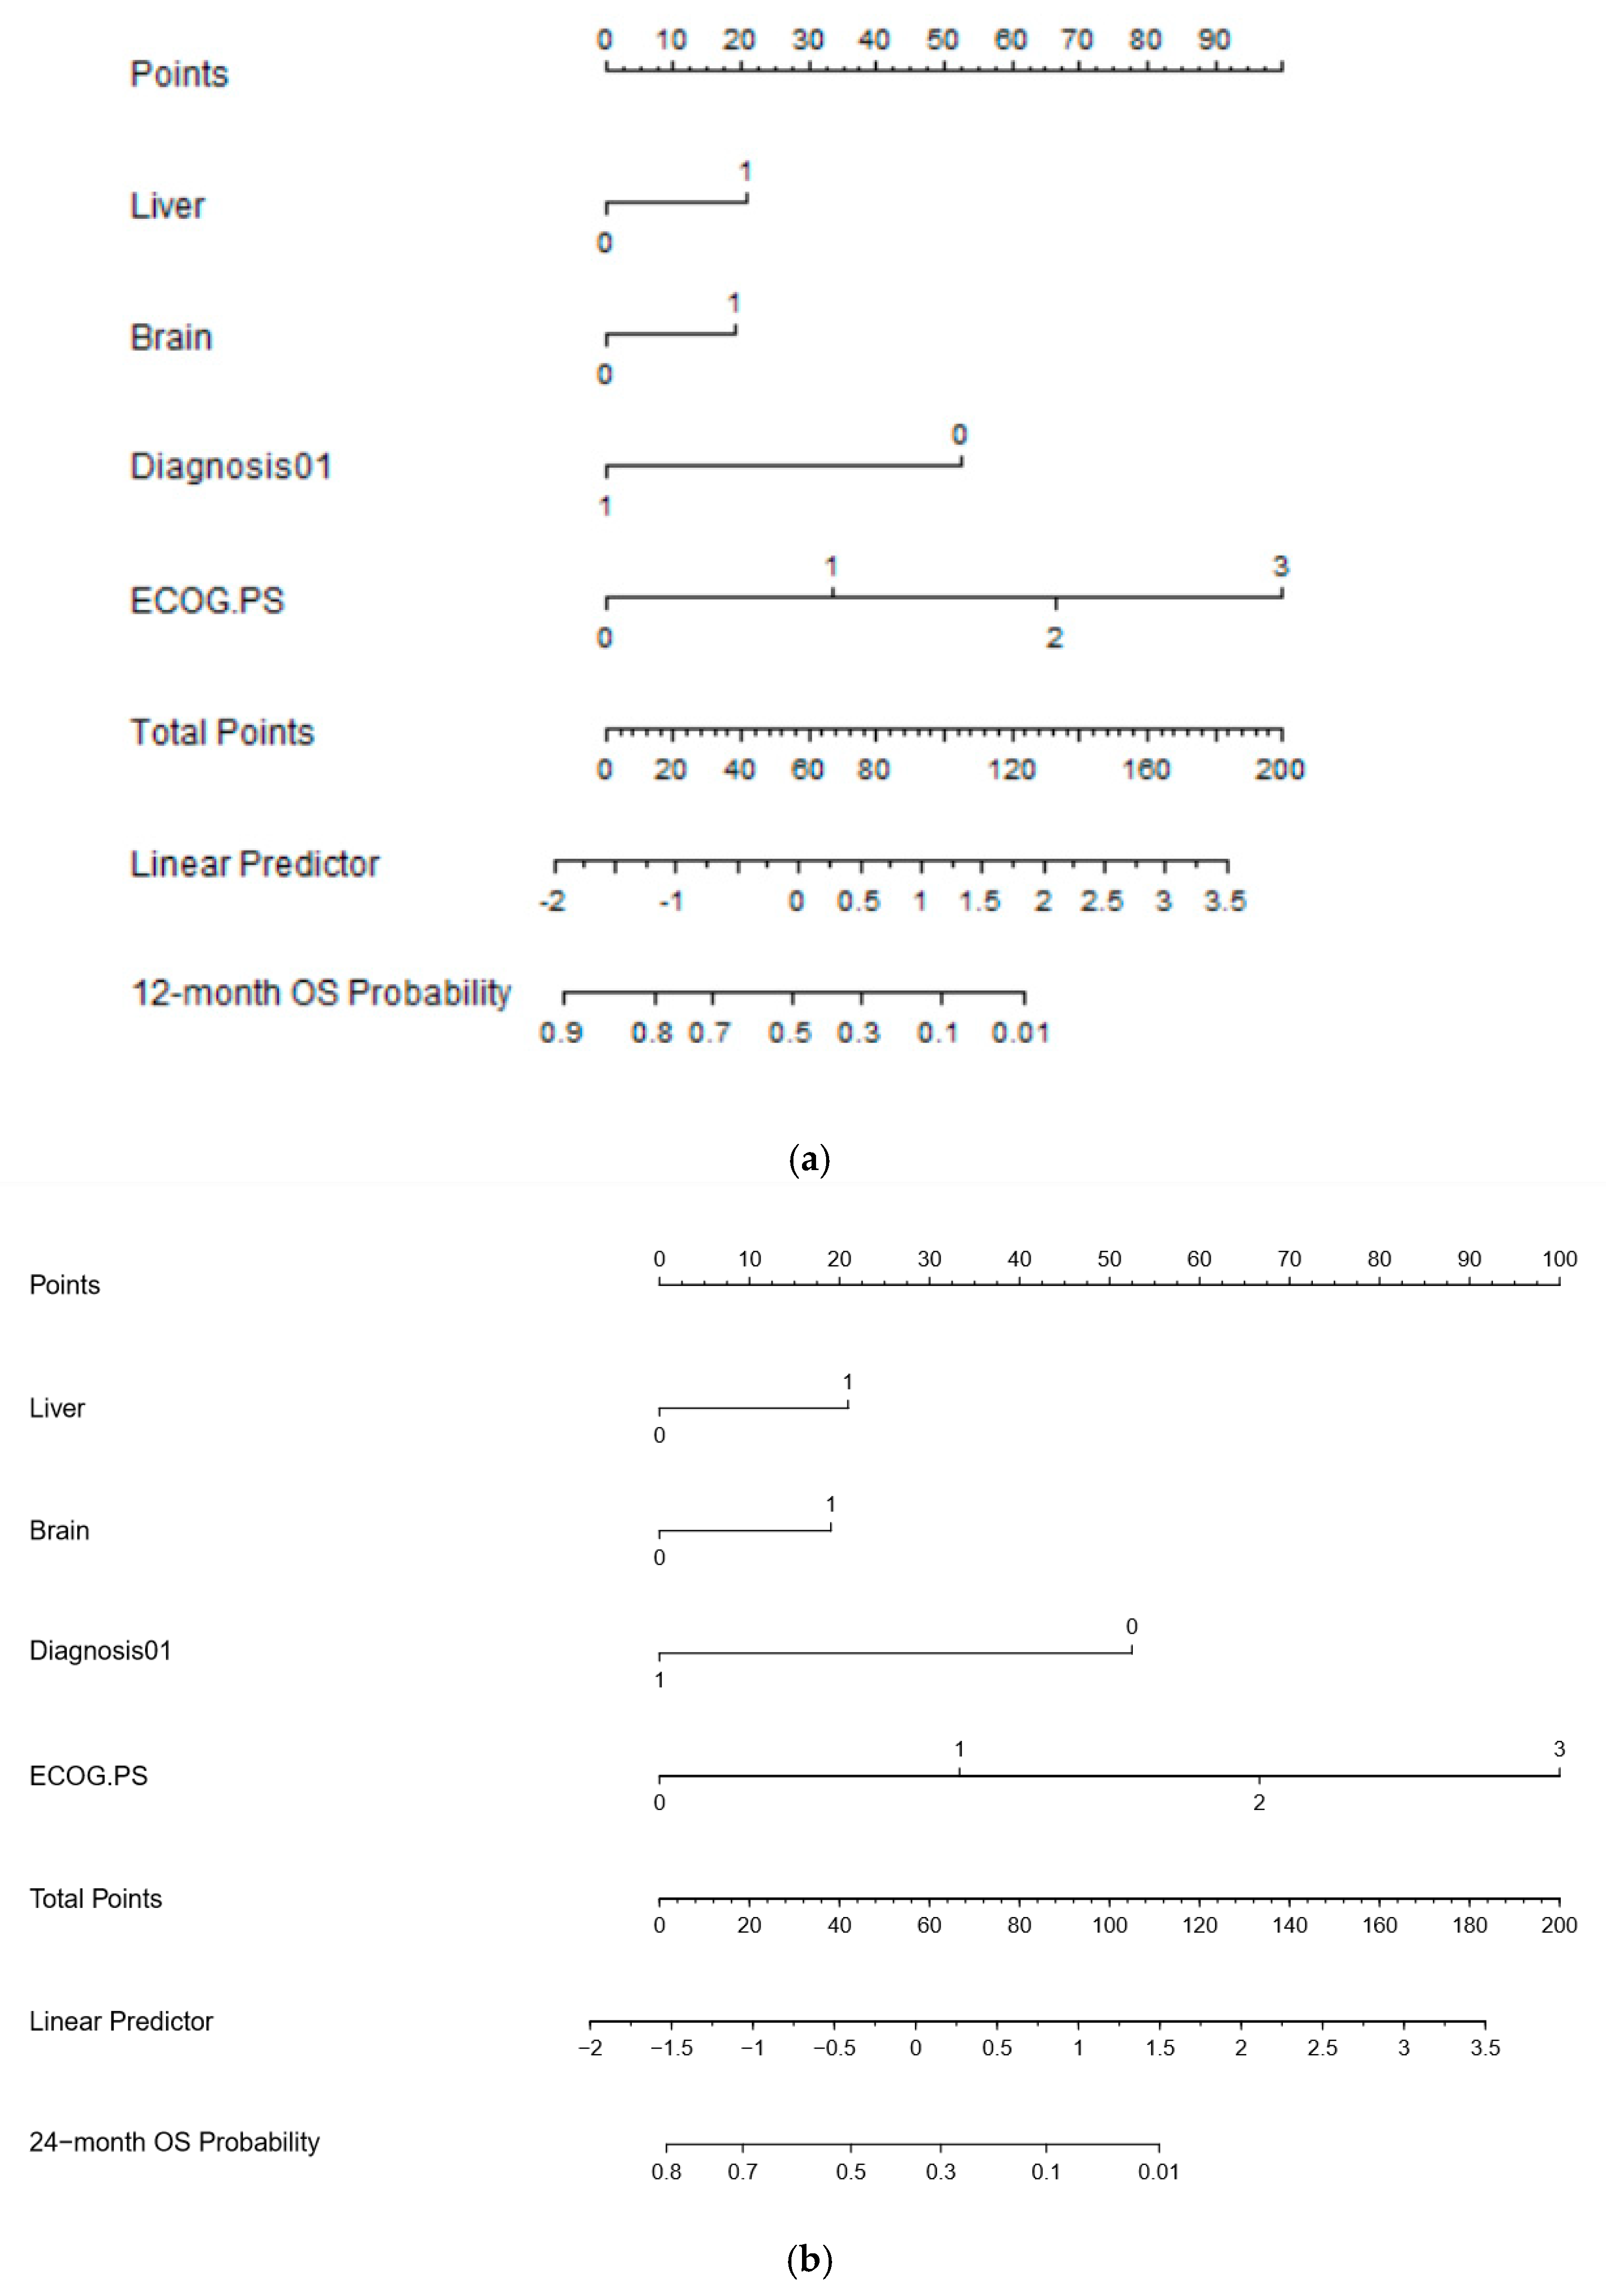
| Liver | 0.5512 | 1.7353 | 1.1824 to 2.5467 | 0.0051 |
| Brain | 0.4889 | 1.6306 | 1.0786 to 2.4650 | 0.0211 |
| NSCLC vs. others | −1.3823 | 0.251 | 0.1707 to 0.3691 | <0.0001 |
| ECOG PS | 0.8449 | 2.3278 | 1.8642 to 2.9067 | <0.0001 |
| MVA for PFS (p < 0.0001) | ||||
|---|---|---|---|---|
| Covariate | b | Exp (b) | 95% CI of Exp (b) | p |
| Liver | 0.4003 | 1.4923 | 1.0563 to 2.1082 | 0.0239 |
| Brain | 0.4151 | 1.5145 | 1.0359 to 2.2142 | 0.0088 |
| NSCLC vs. others | −0.6067 | 0.5451 | 0.4642 to 0.6402 | <0.0001 |
| ECOG PS | 0.8243 | 2.2802 | 1.6958 to 3.0660 | <0.0001 |
© 2020 by the authors. Licensee MDPI, Basel, Switzerland. This article is an open access article distributed under the terms and conditions of the Creative Commons Attribution (CC BY) license (http://creativecommons.org/licenses/by/4.0/).
Share and Cite
Botticelli, A.; Cirillo, A.; Scagnoli, S.; Cerbelli, B.; Strigari, L.; Cortellini, A.; Pizzuti, L.; Vici, P.; De Galitiis, F.; Di Pietro, F.R.; et al. The Agnostic Role of Site of Metastasis in Predicting Outcomes in Cancer Patients Treated with Immunotherapy. Vaccines 2020, 8, 203. https://doi.org/10.3390/vaccines8020203
Botticelli A, Cirillo A, Scagnoli S, Cerbelli B, Strigari L, Cortellini A, Pizzuti L, Vici P, De Galitiis F, Di Pietro FR, et al. The Agnostic Role of Site of Metastasis in Predicting Outcomes in Cancer Patients Treated with Immunotherapy. Vaccines. 2020; 8(2):203. https://doi.org/10.3390/vaccines8020203
Chicago/Turabian StyleBotticelli, Andrea, Alessio Cirillo, Simone Scagnoli, Bruna Cerbelli, Lidia Strigari, Alessio Cortellini, Laura Pizzuti, Patrizia Vici, Federica De Galitiis, Francesca Romana Di Pietro, and et al. 2020. "The Agnostic Role of Site of Metastasis in Predicting Outcomes in Cancer Patients Treated with Immunotherapy" Vaccines 8, no. 2: 203. https://doi.org/10.3390/vaccines8020203
APA StyleBotticelli, A., Cirillo, A., Scagnoli, S., Cerbelli, B., Strigari, L., Cortellini, A., Pizzuti, L., Vici, P., De Galitiis, F., Di Pietro, F. R., Cerbelli, E., Ghidini, M., D’Amati, G., Della Rocca, C., Mezi, S., Gelibter, A., Giusti, R., Cortesi, E., Ascierto, P. A., ... Marchetti, P. (2020). The Agnostic Role of Site of Metastasis in Predicting Outcomes in Cancer Patients Treated with Immunotherapy. Vaccines, 8(2), 203. https://doi.org/10.3390/vaccines8020203