Article

The Role of the Gut Microbiota and Uraemic Toxins in Vaccine Responsiveness Among People Receiving Maintenance Haemodialysis


1
Renal Medicine, Kidney Centre, Royal Prince Alfred Hospital, Camperdown, NSW 2050, Australia
2
Faculty of Medicine and Health, University of Sydney, Camperdown, NSW 2050, Australia
3
Central and Northern Adelaide Renal and Transplantation Service, Royal Adelaide Hospital, Adelaide, SA 5000, Australia
4
School of Medicine, University of Adelaide, Adelaide, SA 5000, Australia
*
Author to whom correspondence should be addressed.
Vaccines 2026, 14(4), 358; https://doi.org/10.3390/vaccines14040358
Submission received: 9 March 2026 / Revised: 7 April 2026 / Accepted: 11 April 2026 / Published: 17 April 2026
(This article belongs to the Section Vaccination Against Cancer and Chronic Diseases)

Abstract

Background: Patients with kidney failure requiring dialysis experience a high burden of vaccine-preventable diseases, and vaccine hypo-responsiveness is a key contributor. Uraemic toxins and gut dysbiosis are potential causes of hypo-responsiveness. Aim: This study aimed to determine whether uraemic toxin concentrations or gut dysbiosis are associated with vaccine response in haemodialysis patients. Methods: This was a single centre, observational cohort study of maintenance dialysis patients receiving a conventional 2-dose primary COVID-19 vaccination course. Demographic, clinical and vaccination data were collected from the eMR. Vaccine response (Elecsys Anti-SARS-CoV-2 immunoassay), serum uraemic toxin concentrations (indoxyl sulphate, p-cresyl sulphate, and trimethylamine N-oxide by liquid chromatography), and stool microbiome (16S rRNA gene sequencing) were measured 8 weeks after the second dose of vaccine. Results: Forty participants (43% female, mean age 66 years; 59% Caucasian) were included, 70% of whom were classified as a vaccine responder. Antibiotic exposure, prednisolone use and lymphopenia were significantly associated with hypo-responsiveness. Microbiome profiling identified differences in beta diversity between responders and non-responders, positively correlated with short-chain fatty acid producers (Parabacteriodes) and negatively with pathobionts (Escherichia/Shigella). Differential abundance analysis identified lower levels of Tyzzerella, Gemmiger, and Hungatella and higher levels of Turicibacter in vaccine responders. Total uraemic toxin burden and individual toxin concentrations did not differ between responders and hypo-responders (all p > 0.05). Stratification by low versus high/very high toxin burden groupings was not associated with response (p > 0.99). Conclusions: Differences in gut microbial composition were observed between vaccine responder groups, while uraemic toxin concentrations were not associated with vaccine responsiveness. These findings suggest gut microbiota composition may contribute to vaccine hypo-responsiveness in individuals receiving dialysis and warrant further investigation in larger mechanistic studies.

1. Introduction

Individuals with kidney failure receiving maintenance haemodialysis frequently exhibit an attenuated immune response to vaccination and remain at increased risk of vaccine-preventable infections [1,2,3]. Hypo-responsiveness to various vaccines has been documented, including hepatitis B (HBV) [4,5,6], influenza [7] and SARS-CoV-2 [8,9], and represents an area of unmet need among this vulnerable population. Traditional determinants, such as age, comorbidity, and malnutrition, contribute to impaired immunogenicity but do not fully explain the degree of hypo-responsiveness observed among dialysis patients [10,11].
Uraemia-induced immune dysregulation has been proposed as a possible mechanistic pathway. The chronic retention of protein-bound uremic toxins, in particular indoxyl sulphate (IS), p-cresyl sulphate (PCS), and trimethylamine N-oxide (TMAO), has been associated with impaired antigen presentation and inhibition of lymphocyte proliferation and is thought to promote systemic inflammation [11,12,13,14,15,16,17,18,19,20]. These toxins are poorly cleared by conventional dialysis, facilitating accumulation and downstream effects on immune function [21].
Dysbiosis of the gut microbiome is universal among the dialysis population. Whether this is a consequence of uraemia, dialysis dietary restrictions or other factors remains uncertain [22,23,24,25]. Haemodialysis patients exhibit reduced microbial diversity and enrichment of proteolytic taxa capable of generating uremic toxin precursors at the expense of relative depletion of bacteria capable of fermenting carbohydrate to generate short-chain fatty acids (SCFA) [26,27,28]. Such alterations may not only increase systemic toxin burden, but also disrupt mucosal barrier integrity and immune homeostasis through loss of SCFA-producing organisms and altered microbial signalling [29,30,31].
We hypothesised that dysbiosis-driven production of uraemic toxins represents a modifiable contributor to impaired vaccine responsiveness in haemodialysis. We conducted a cross-sectional association study within a longitudinally vaccinated cohort with the aim of investigating associations between uraemic toxin burden, gut microbial composition, and vaccine immunogenicity

2. Materials and Methods

2.1. Study Design and Population

Adult patients undergoing regular maintenance haemodialysis at a single facility were invited to participate in a cross-sectional cohort study to determine factors associated with their immune response to a standard 2-dose COVID-19 vaccine course. Inclusion criteria included agreement to receive 2 doses of a COVID-19 vaccine and willingness to provide samples of blood for vaccination response and uremic toxin measurement and stool for microbiota analysis. Patients with the following characteristics were excluded: prior COVID-19 infection, prior COVID-19 vaccination, vaccine allergy, hospitalisation within the month prior to study, active infection, or pregnancy. The study was approved by the University of Sydney ethics review board 2020/ETH01148, and all participants provided written informed consent.
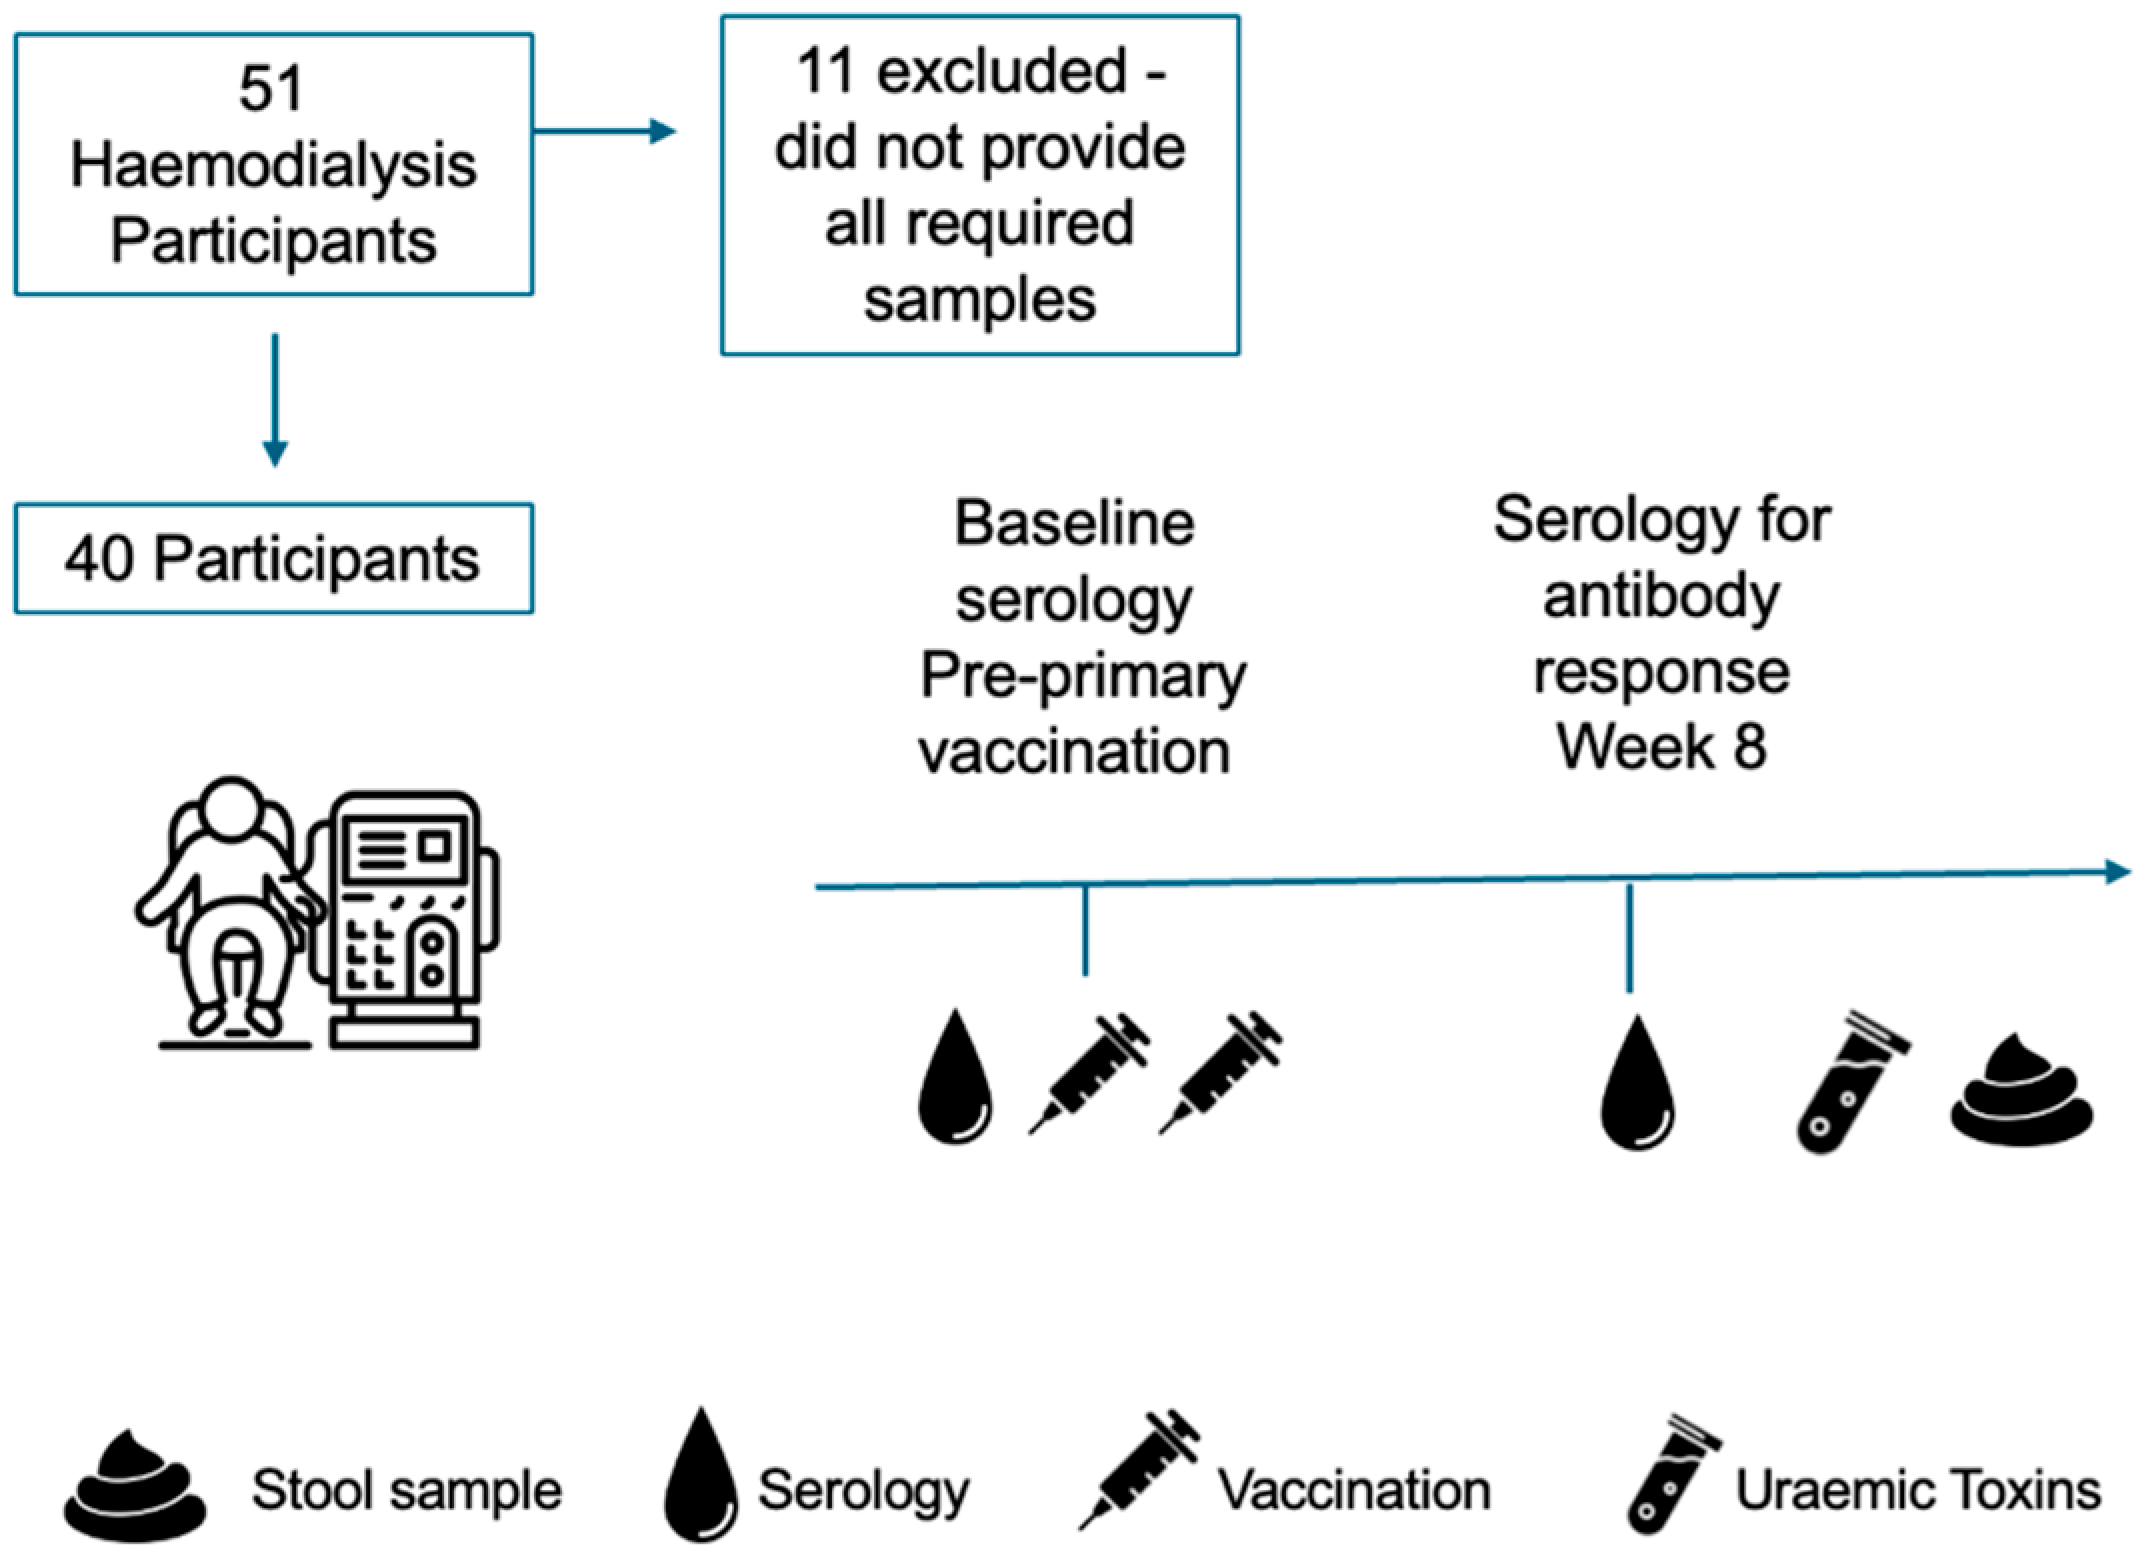
Blood samples for serological analysis were collected at baseline (immediately prior to the first dose) and 8 weeks after completion of a 2-dose vaccination schedule. Serum uraemic toxin concentrations and faecal samples were collected 8 weeks after completion of the vaccination schedule (Figure 1).
Relevant clinical and demographic data were obtained from the electronic medical record for the study period. Information collected included baseline demographics, cause of kidney failure, dialysis access, comorbidities, vaccination status, and prescribed medications. Clinical outcomes recorded were hospital admissions (COVID-19, other infection, access-related, cardiac, or other), kidney transplantation, and death.

2.2. Serological Assessment of Vaccine Response

Humoral response to COVID-19 vaccination was assessed by quantifying anti-SARS-CoV-2 receptor-binding domain (RBD) and nucleocapsid (NC) antibodies using the Elecsys ‘Anti-SARS-CoV 2 S’ and ‘Elecsys Anti-SARS-CoV-2′ immunoassays, respectively, on the Cobas system (Roche, Basel, Switzerland) in accordance with the manufacturer’s instructions. The quantifiable range for the RBD-specific assay is 0.8–250 U/mL, with 1 U/mL equivalent to 1 binding antibody unit (BAU)/mL.
Vaccine responsiveness was defined using a dichotomized anti-RBD antibody concentration > 100 U/mL and anti-NC antibody negativity 8 weeks following completion of a two-dose vaccination schedule, to account for the known delayed immune response to vaccination in haemodialysis recipients and to exclude those who had experienced infection with SARS-CoV-2. Participants were classified as hypo-responders (anti-RBD < 100) or responders (anti-RBD > 100) at this time point. This categorization was used to facilitate clinically interpretable group comparisons of uraemic toxin burden, vaccine response, and microbiome profiles.
To minimise confounding from prior SARS-CoV-2 infection, participants with detectable anti-NC antibodies were excluded from analyses of vaccine-induced humoral response, irrespective of anti-RBD levels. Given the absence of a universally established protective anti-RBD threshold, antibody levels were secondarily analysed as a continuous variable.

2.3. Quantification of Uraemic Toxins

Serum concentrations of the protein-bound uraemic toxins indoxyl sulphate (IS) and p-cresyl sulphate (PCS) were quantified as both total and free fractions using ultrahigh-performance liquid chromatography (UPLC) with fluorescence detection. System control and data acquisition was performed using Empower3 chromatography data software (Waters Corporation, Milford, MA, USA). This method was validated by Pretorius et al. [32] and offers high sensitivity, with detection limits down to 0.1 µmol/L.
Plasma TMAO concentrations were measured by liquid chromatography–tandem mass spectrometry (LC–MS/MS) using an Acquity UPLC system with a Xevo TQD mass spectrometer (Waters, Milford, MA, USA). Data were processed with MassLynx software (version 4.2).
For analysis, 50 µL of plasma was deproteinised with 500 µL of acetonitrile containing a deuterated internal standard, followed by centrifugation for 10 min. A 1 µL aliquot of the supernatant was injected onto a BEH Amide column (1.8 µm, 2.1 × 100 mm; Waters). Separation was achieved using mobile phase A (100 mM ammonium formate, pH 3.0) and mobile phase B (acetonitrile), delivered at 0.4 mL/min. The column was maintained at 45 °C with a linear gradient from 0 to 25% A over 2.5 min, returning to baseline by 4 min. Quantification employed external calibration and an isotopically labelled internal standard. The calibration range was 0.1–200 µmol/L, with recovery between 98 and 102% and inter-day imprecision below 7% across four quality control levels.

2.4. Gut Microbiota Analysis

Stool samples were self-collected by participants using a standardised collection and microbial DNA stabilisation kit (OMNIgene GUT OM-200, DNA Genotek, Stittsville, ON, Canada). Samples were aliquoted and stored at −80 °C until further processing. Microbial DNA was extracted using the QIAamp DNA Stool Mini Kit (Qiagen, Hilden, Germany) according to the manufacturer’s protocol. Bacterial community profiling was performed by sequencing the V4 hypervariable region (515F-806R) of the 16S rRNA gene using paired high-end sequencing (2 × 250 bp) on the Illumina MiSeq platform at the Ramaciotti Centre for Genomics (University of New South Wales, Sydney, Australia).
Sequence data were processed using the DADA2 pipeline [33] implemented in R (version 4.4.2) within RStudio (2024.12.1 + 563), which included quality filtering, read merging, chimaera removal, and the generation of amplicon sequence variants (ASVs). Taxonomic assignment was conducted using the Ribosomal Database Project (RDP) naïve Bayesian classifier with species-level classification (rdp_train_set_18) [34]. ASVs representing < 0.01% of total reads were excluded from further analysis. Alpha diversity was evaluated using the Shannon index and observed richness, and beta diversity was assessed using Principal Coordinate Analysis (PCoA) Bray–Curtis dissimilarity matrices. Permutational multivariate analysis of variance (PERMANOVA) tests using the adonis function with 9999 permutations were conducted to assess for between-group differences, as well as to identify intrinsic and extrinsic factors explaining inter-individual variation in gut microbial composition. Differential abundance testing was performed using analysis of composition of microbiomes with bias correction of 2 (ANCOM-BC2) [35]. Spearman correlation was used to evaluate associations between bacterial genera with uraemic toxin levels and clinical parameters.

2.5. Statistical Analysis

Statistical analyses were undertaken in STATA (Version 18 SE; StataCorp, College Station, TX, USA). Continuous variables were assessed for normality and presented as mean ± SD or median (interquartile range IQR, Q1–Q3) as appropriate. Between-group comparisons were performed using independent-samples t-tests for normally distributed variables and Mann–Whitney U tests for non-normally distributed variables. Categorical variables were compared using Fisher’s exact test. All statistical tests were two-sided, with p < 0.05 considered statistically significant. Where appropriate, p-values were adjusted for multiple comparisons using the Benjamini–Hochberg false discovery rate (FDR) method.
Multivariable linear regression was used to examine the association between uraemic toxin burden and anti-RBD antibody levels. Models were adjusted for a limited number of clinically relevant covariates (prednisone or antibiotic use, lymphocyte count, and vaccine type) to minimise over-fitting, given the modest sample size. Robust standard errors were applied to account for potential deviations from model assumptions.
Vaccine response was primarily analysed as a dichotomous outcome (anti-RBD > 100 vs. <100 U/mL) for group-based comparisons. In addition, anti-RBD antibody levels were analysed as a continuous variable. Multivariable linear regression models were fitted with robust standard errors to account for heteroskedasticity. Sensitivity analyses were performed using log-transformed antibody titres.
Participants were grouped according to their toxin profiles using unsupervised clustering. K-means clustering (k = 3) was applied to classify individuals into subgroups with distinct toxin burdens. For visualisation, hierarchical clustering and heatmaps were generated using the ComplexHeatmap package in R (version 4.3.1; R Core Team, Vienna, Austria). Clustering was performed on scaled data using Euclidean distance and Ward’s minimum variance method (Ward.D). Extreme values were Winsorized at the 5th and 95th percentiles per toxin prior to scaling, to reduce the influence of outliers while retaining all observations. Heatmaps were colour-coded from low (blue) to high (red) to depict relative toxin abundance across clusters.

3. Results

3.1. Vaccine Response

Of 132 patients receiving maintenance dialysis at the facility, 51 participants met entry criteria and consented to the study, of whom 40 received both doses of vaccine, provided all required samples to assess SARS-CoV-2 vaccine response, and completed the study (Figure 1). Participant demographics are detailed in Table 1. Following a two-dose schedule with BNT162b2 (75%) or ChAdOx1 (25%) COVID-19 vaccines, 67% and 70% of recipients were classified as responders, respectively. The median age was comparable between vaccine response groups.
There was no difference in age, sex, ethnicity, or smoking status between vaccine responders and non-responders (Table 1). Non-responders were more likely to have glomerulonephritis as a cause of kidney failure, recent antibiotics, or current prednisolone therapy (p < 0.05).

3.2. Uraemic Toxin Concentration and COVID Vaccine Response

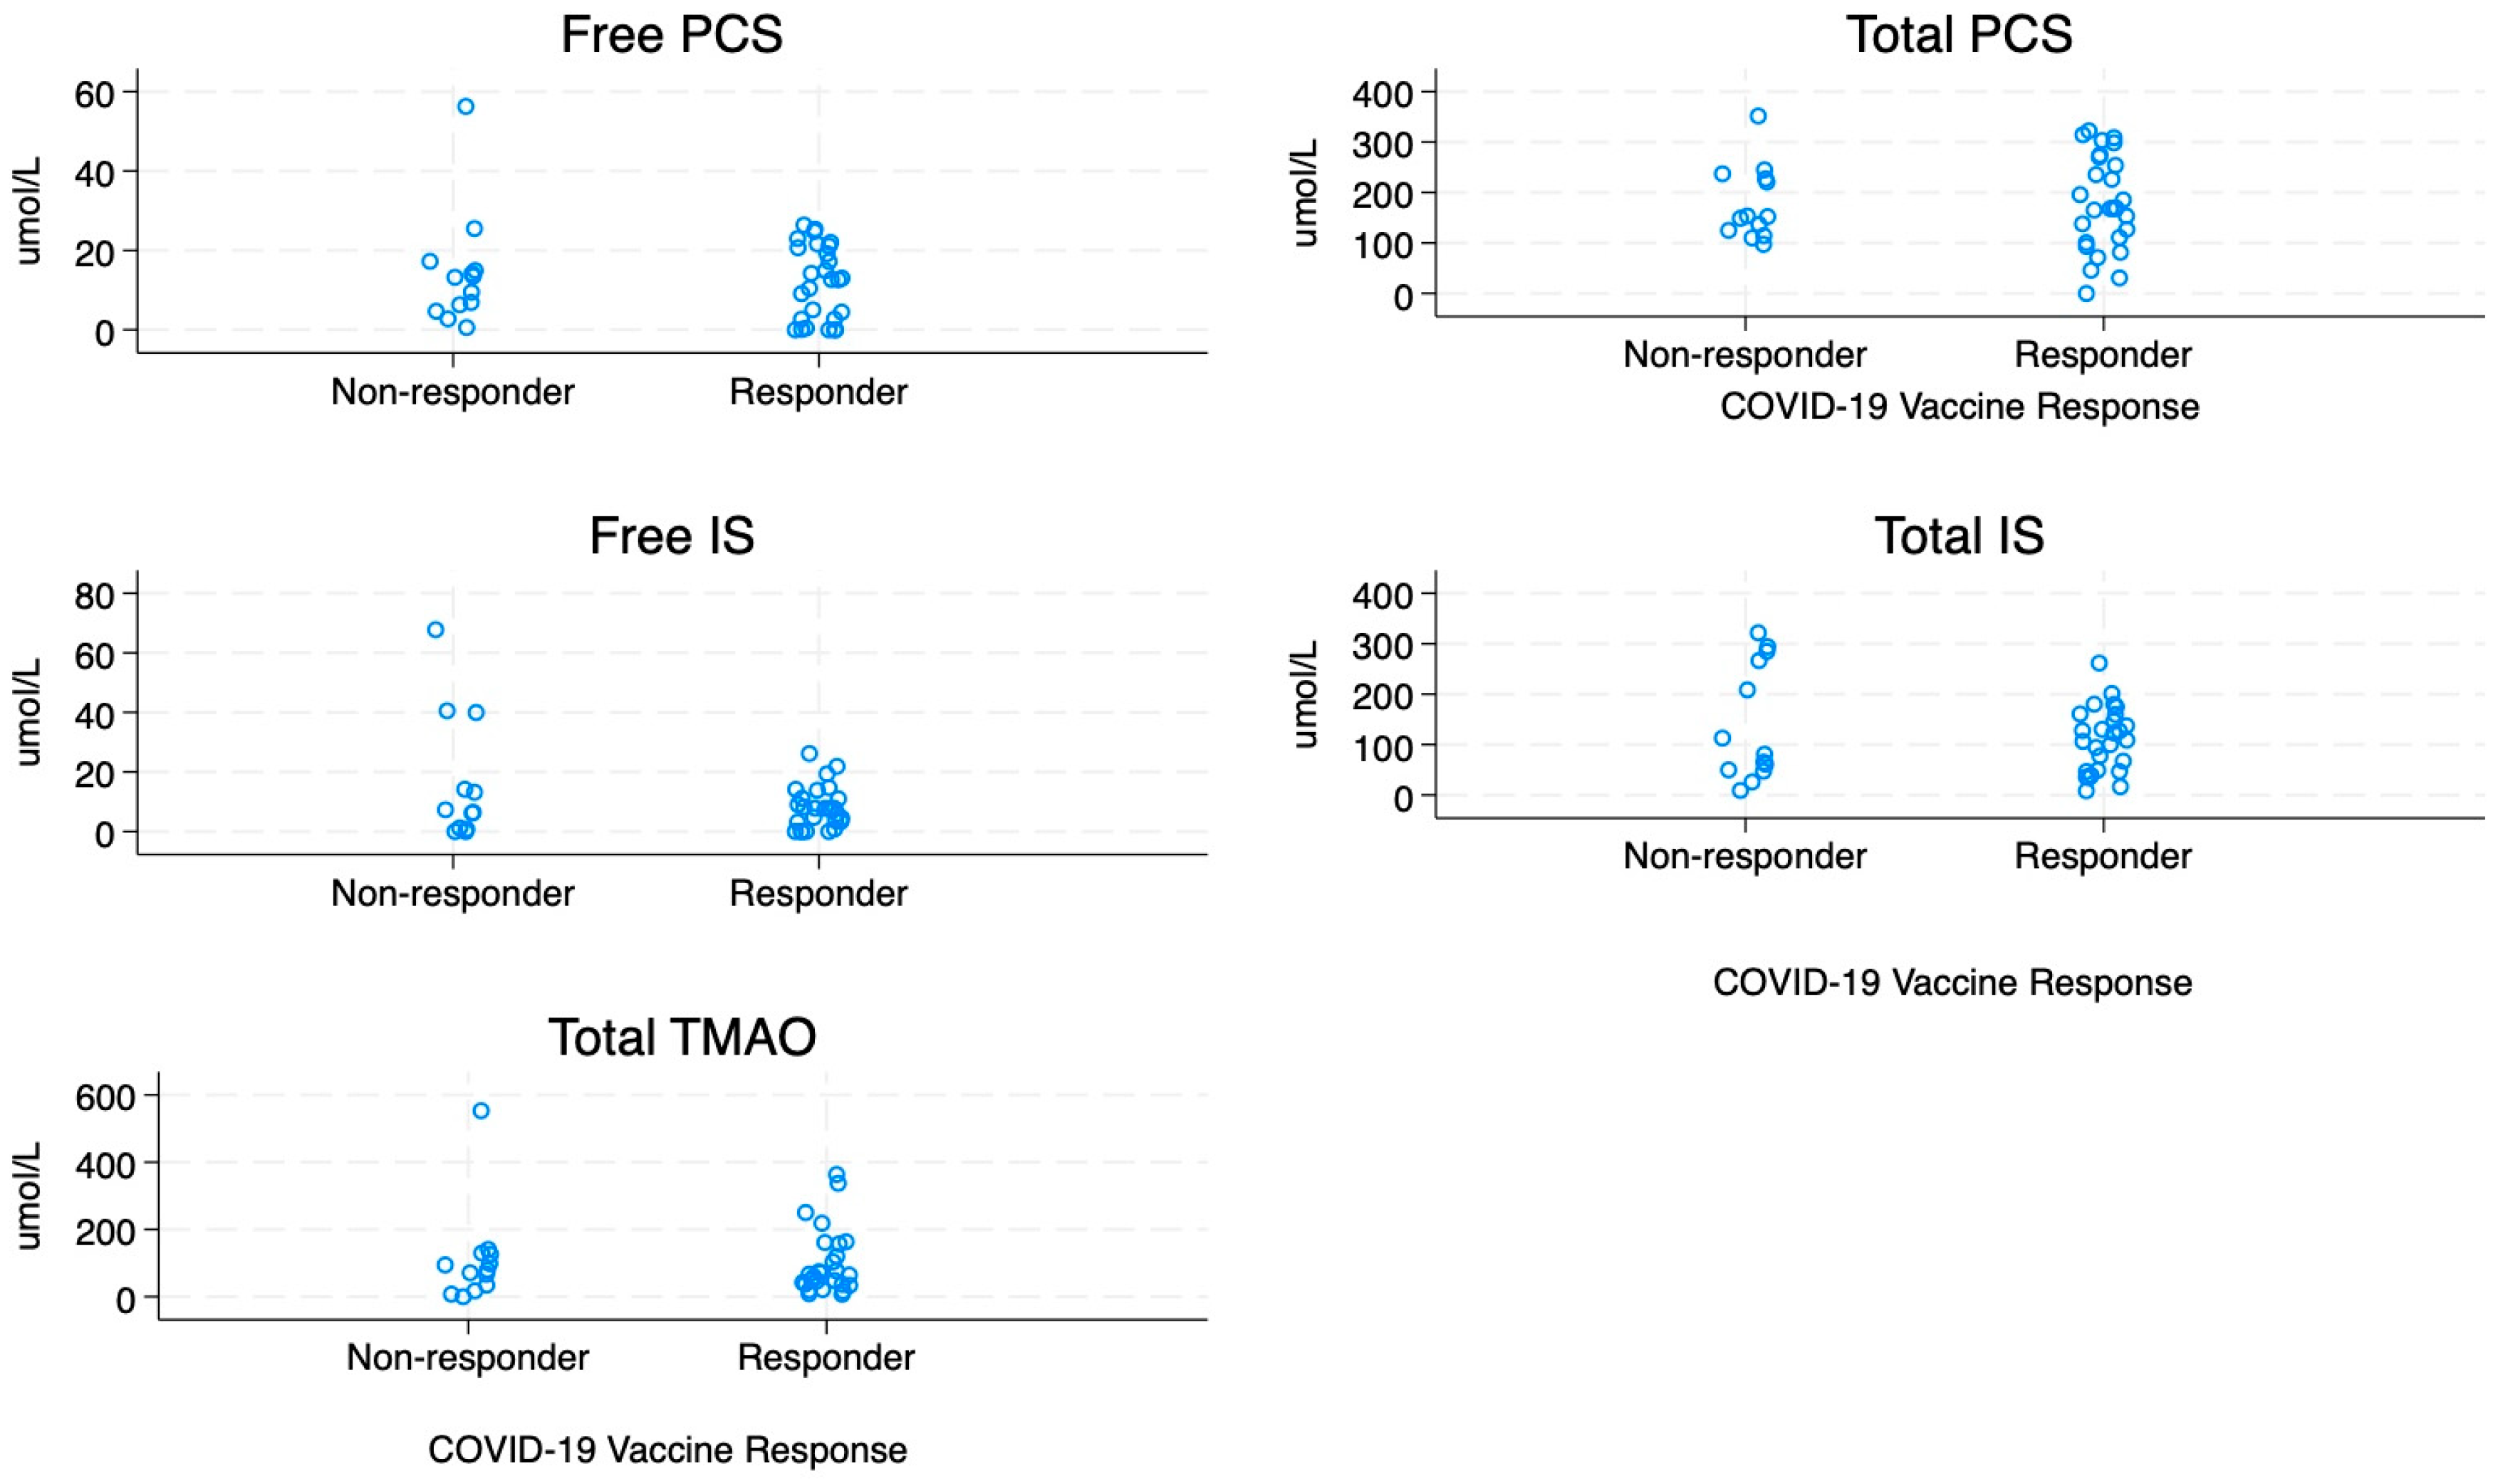
Uraemic toxin concentrations were measured and compared according to responder status (Figure 2). Free and bound fractions of IS, PCS, and TMAO were higher than reference values reported for healthy individuals but did not differ by vaccine-response category (Table 2). The median total toxin burden was also similar between responders (386 (228–468) µmol/L) and non-responders (360 (260–526) µmol/L) (p = 0.74).
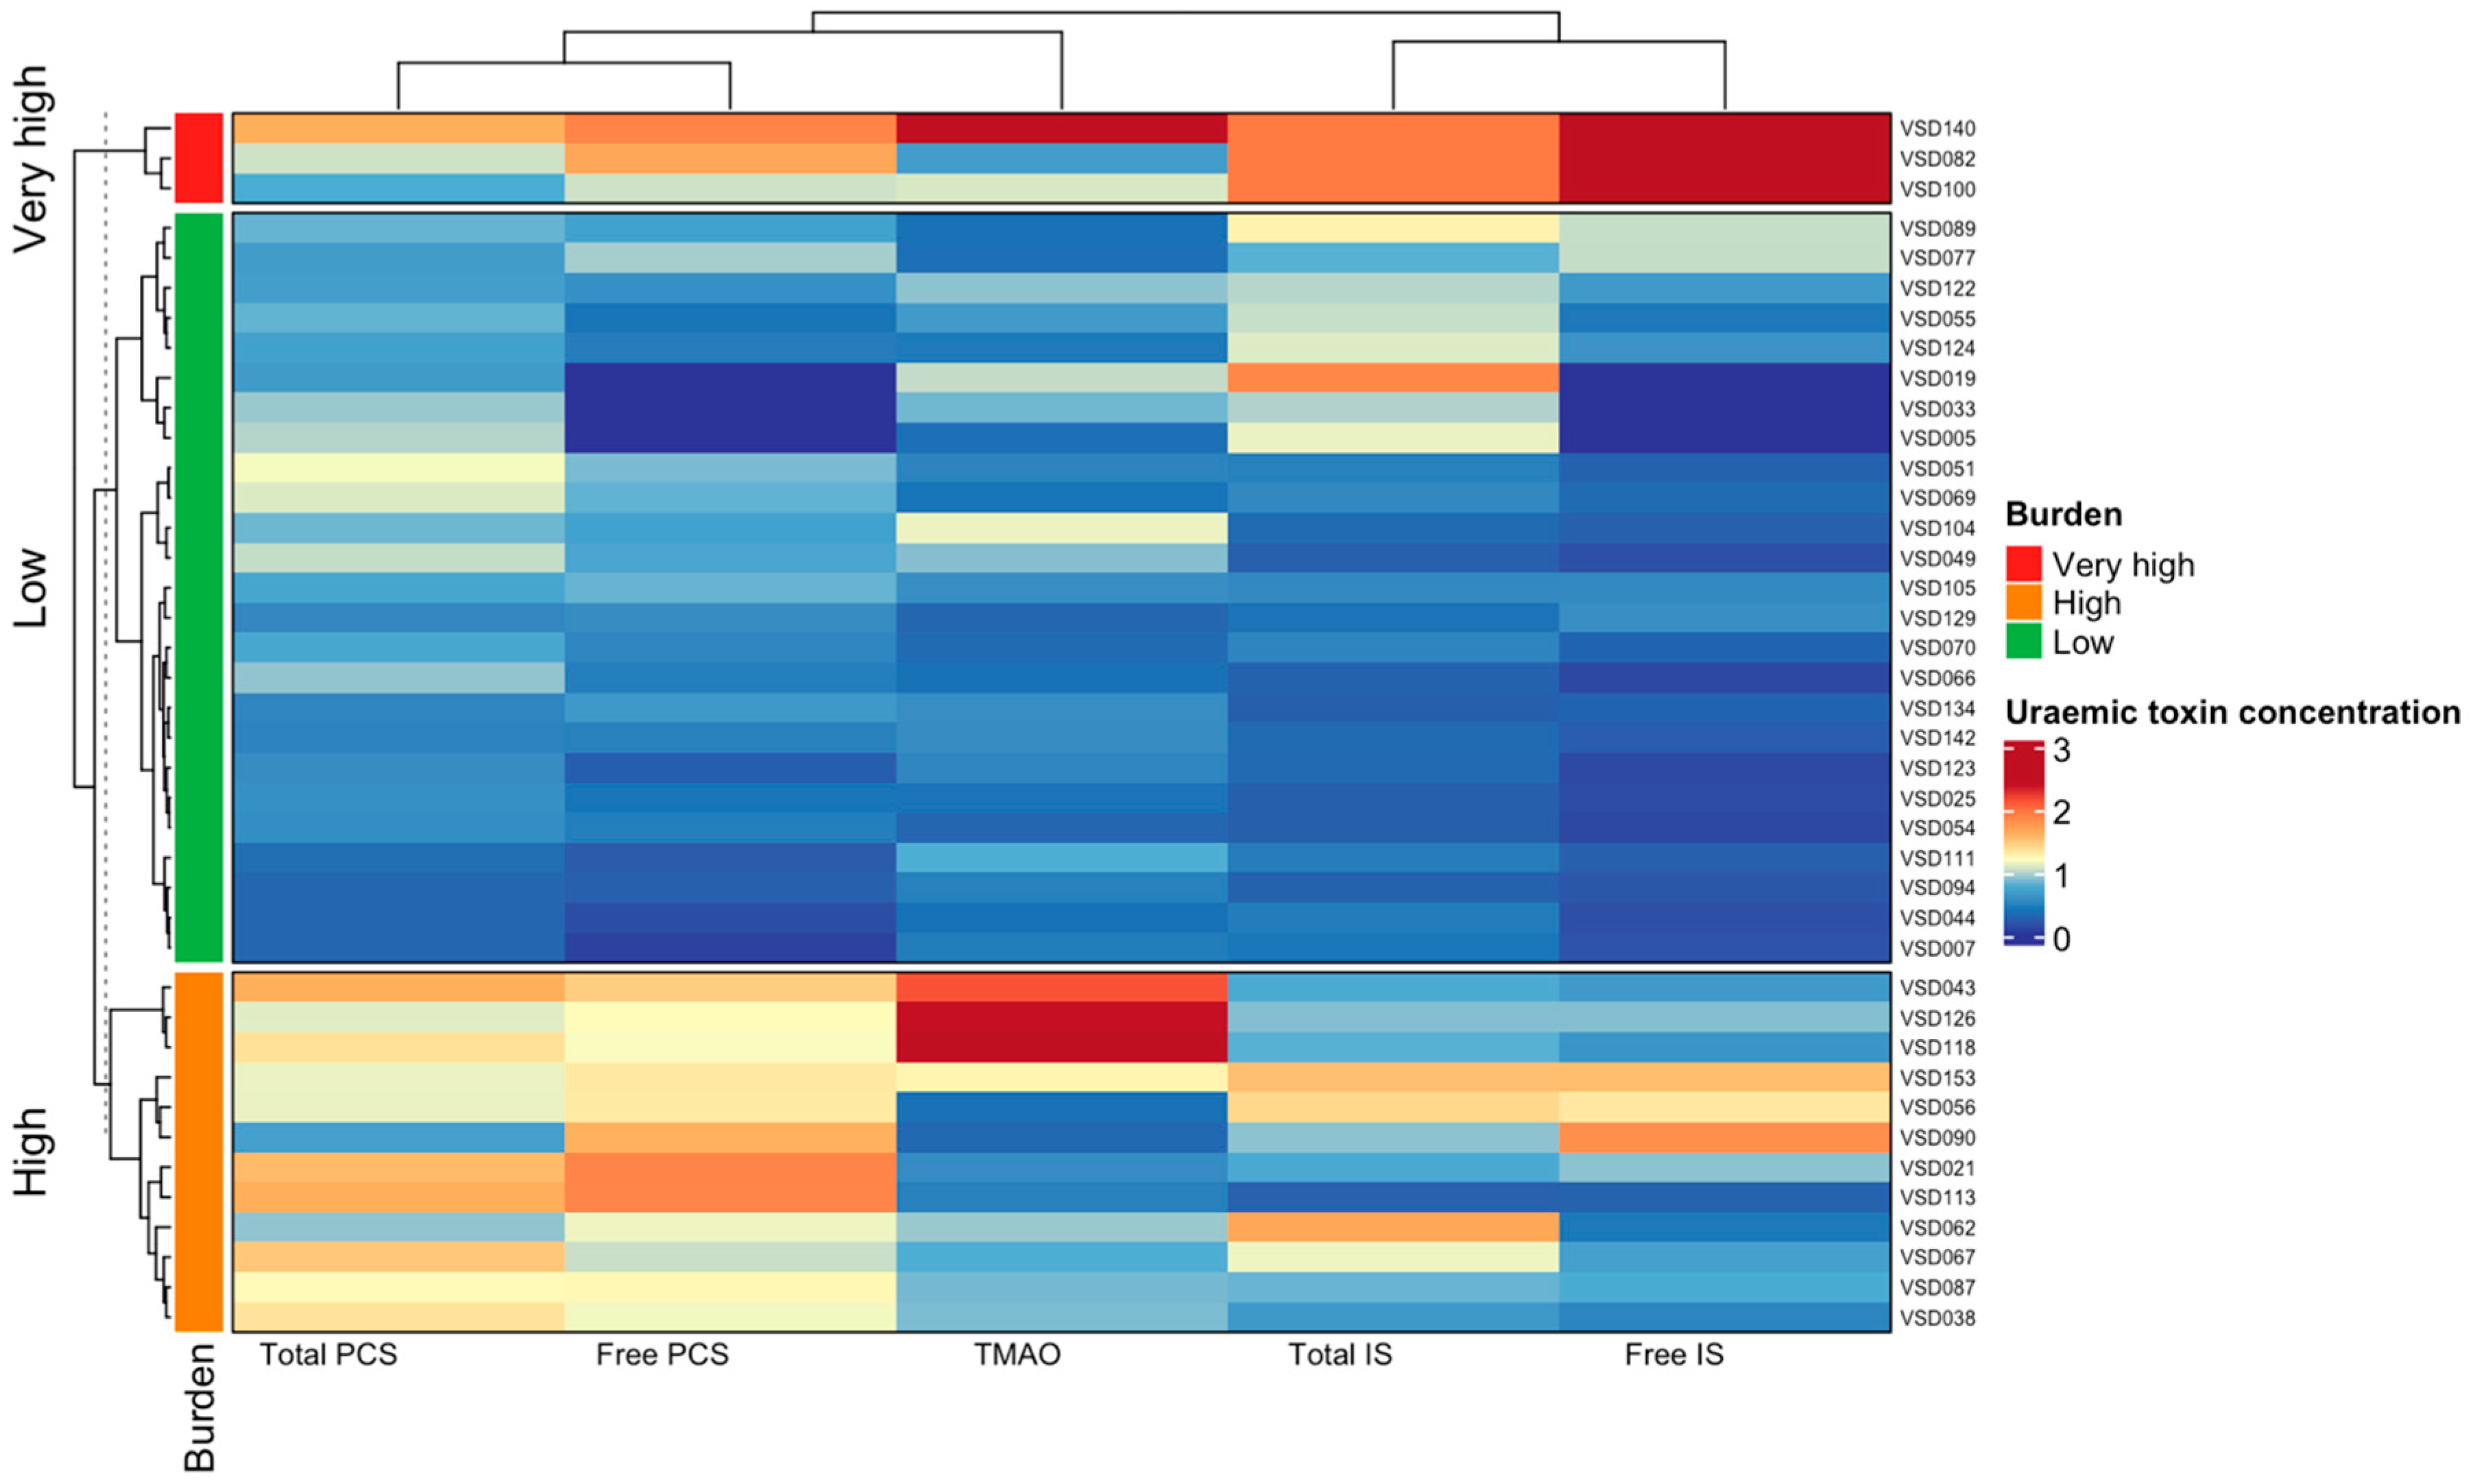
To further characterise toxin exposure, K-means clustering based on scaled uraemic toxin concentrations identified three distinct burden groups: very high (n = 3, 7.5%), high (n = 12, 30%), and low (n = 25, 62.5%) burden (Figure 3). While individual toxin medians varied across clusters, the very-high burden group demonstrated the greatest overall toxin load (Appendix A). Vaccine response rates were similar between the High/Very high toxin burden group and the low burden group, with no statistically significant association between toxin burden and vaccine responder status (p > 0.99).
In a secondary exploratory multivariable analysis, composite toxin burden was not significantly associated with anti-RBD titres after adjustment for clinical covariates (all p > 0.05), although an inverse association was observed in sensitivity analyses using log-transformed titres (p < 0.001).

3.3. Uraemic Toxin Burden and Clinical Outcomes

No statistically significant associations were observed between toxicity group and adverse clinical outcomes. COVID-19 infection not requiring hospital admission occurred in 67% of participants with high/very high toxin burden and 36% of those with low toxin burden (p = 0.10). Hospital admission rates were 40% in the high/very high group and 68% in the low group (p = 0.11). There was no significant difference in hospital admission for COVID-19 infection between high and low toxin burden groups (p = 0.38).

3.4. Biochemical and Clinical Associations with Vaccine Response Status

Baseline laboratory parameters were evaluated for associations with SARS-CoV-2 vaccine responsiveness. Responders (n = 27) had significantly higher mean lymphocyte counts compared with non-responders (1.54 × 10⁹/L (± 0.75) vs. 1.04 × 10⁹/L (± 0.48); p = 0.03). Mean albumin (34.8 g/L vs. 33.5 g/L) and haemoglobin levels (110 g/L vs. 105 g/L) were not different between responders and non-responders (p = 0.25 and p = 0.29, respectively). Pre-dialysis urea levels were similar between groups (21.2 mmol/L vs. 18.9 mmol/L; p = 0.20).
No significant differences in adverse outcomes were observed. Hospital admissions (77% vs. 48%; p = 0.10), rates of non-admission COVID-19 infection (54% vs. 44%; p = 0.74), other illnesses (46% vs. 37%; p = 0.73), and mortality (8% vs. 7%; p = 1.00) were comparable between responders and non-responders, respectively.
Among participants with confirmed COVID-19 infection (n = 24), six (25%) required hospitalisation—three non-responders (33%) and three responders (20%) (p = 0.64). COVID-19 severity did not differ significantly between groups (1.0 vs. 1.33, p = 0.06).

3.5. Gut Microbiota Composition and Vaccine Responses

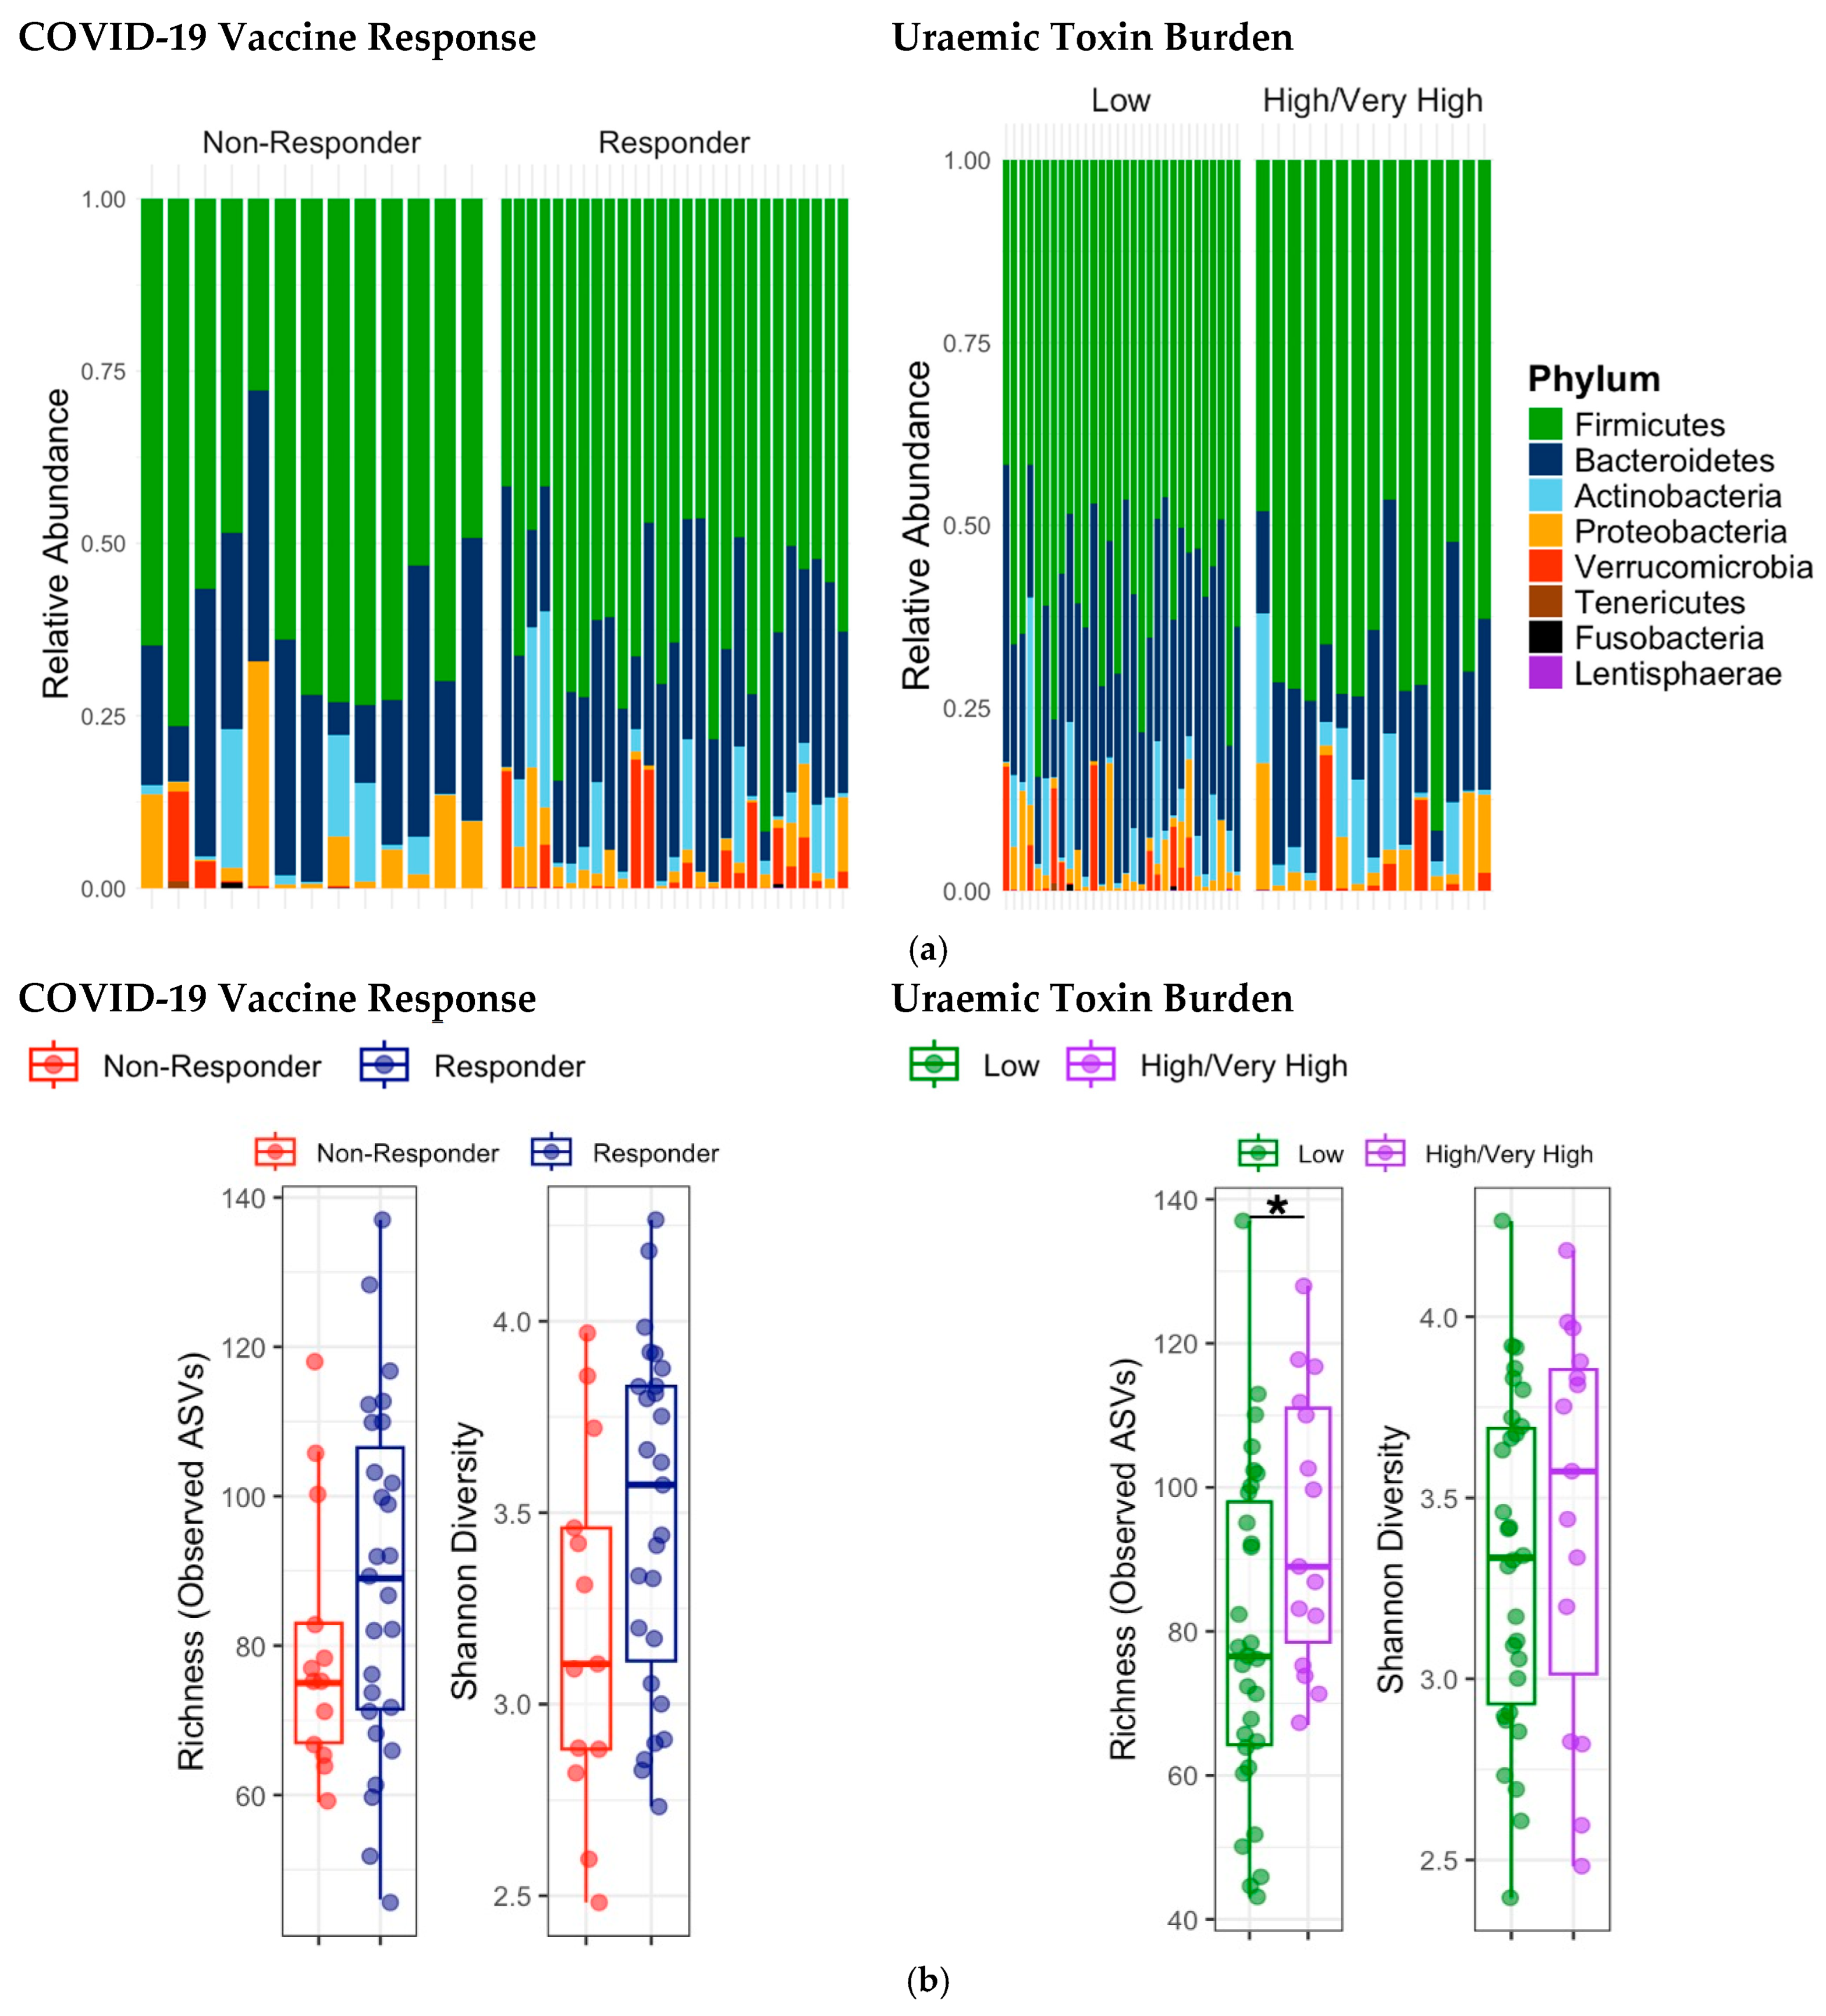
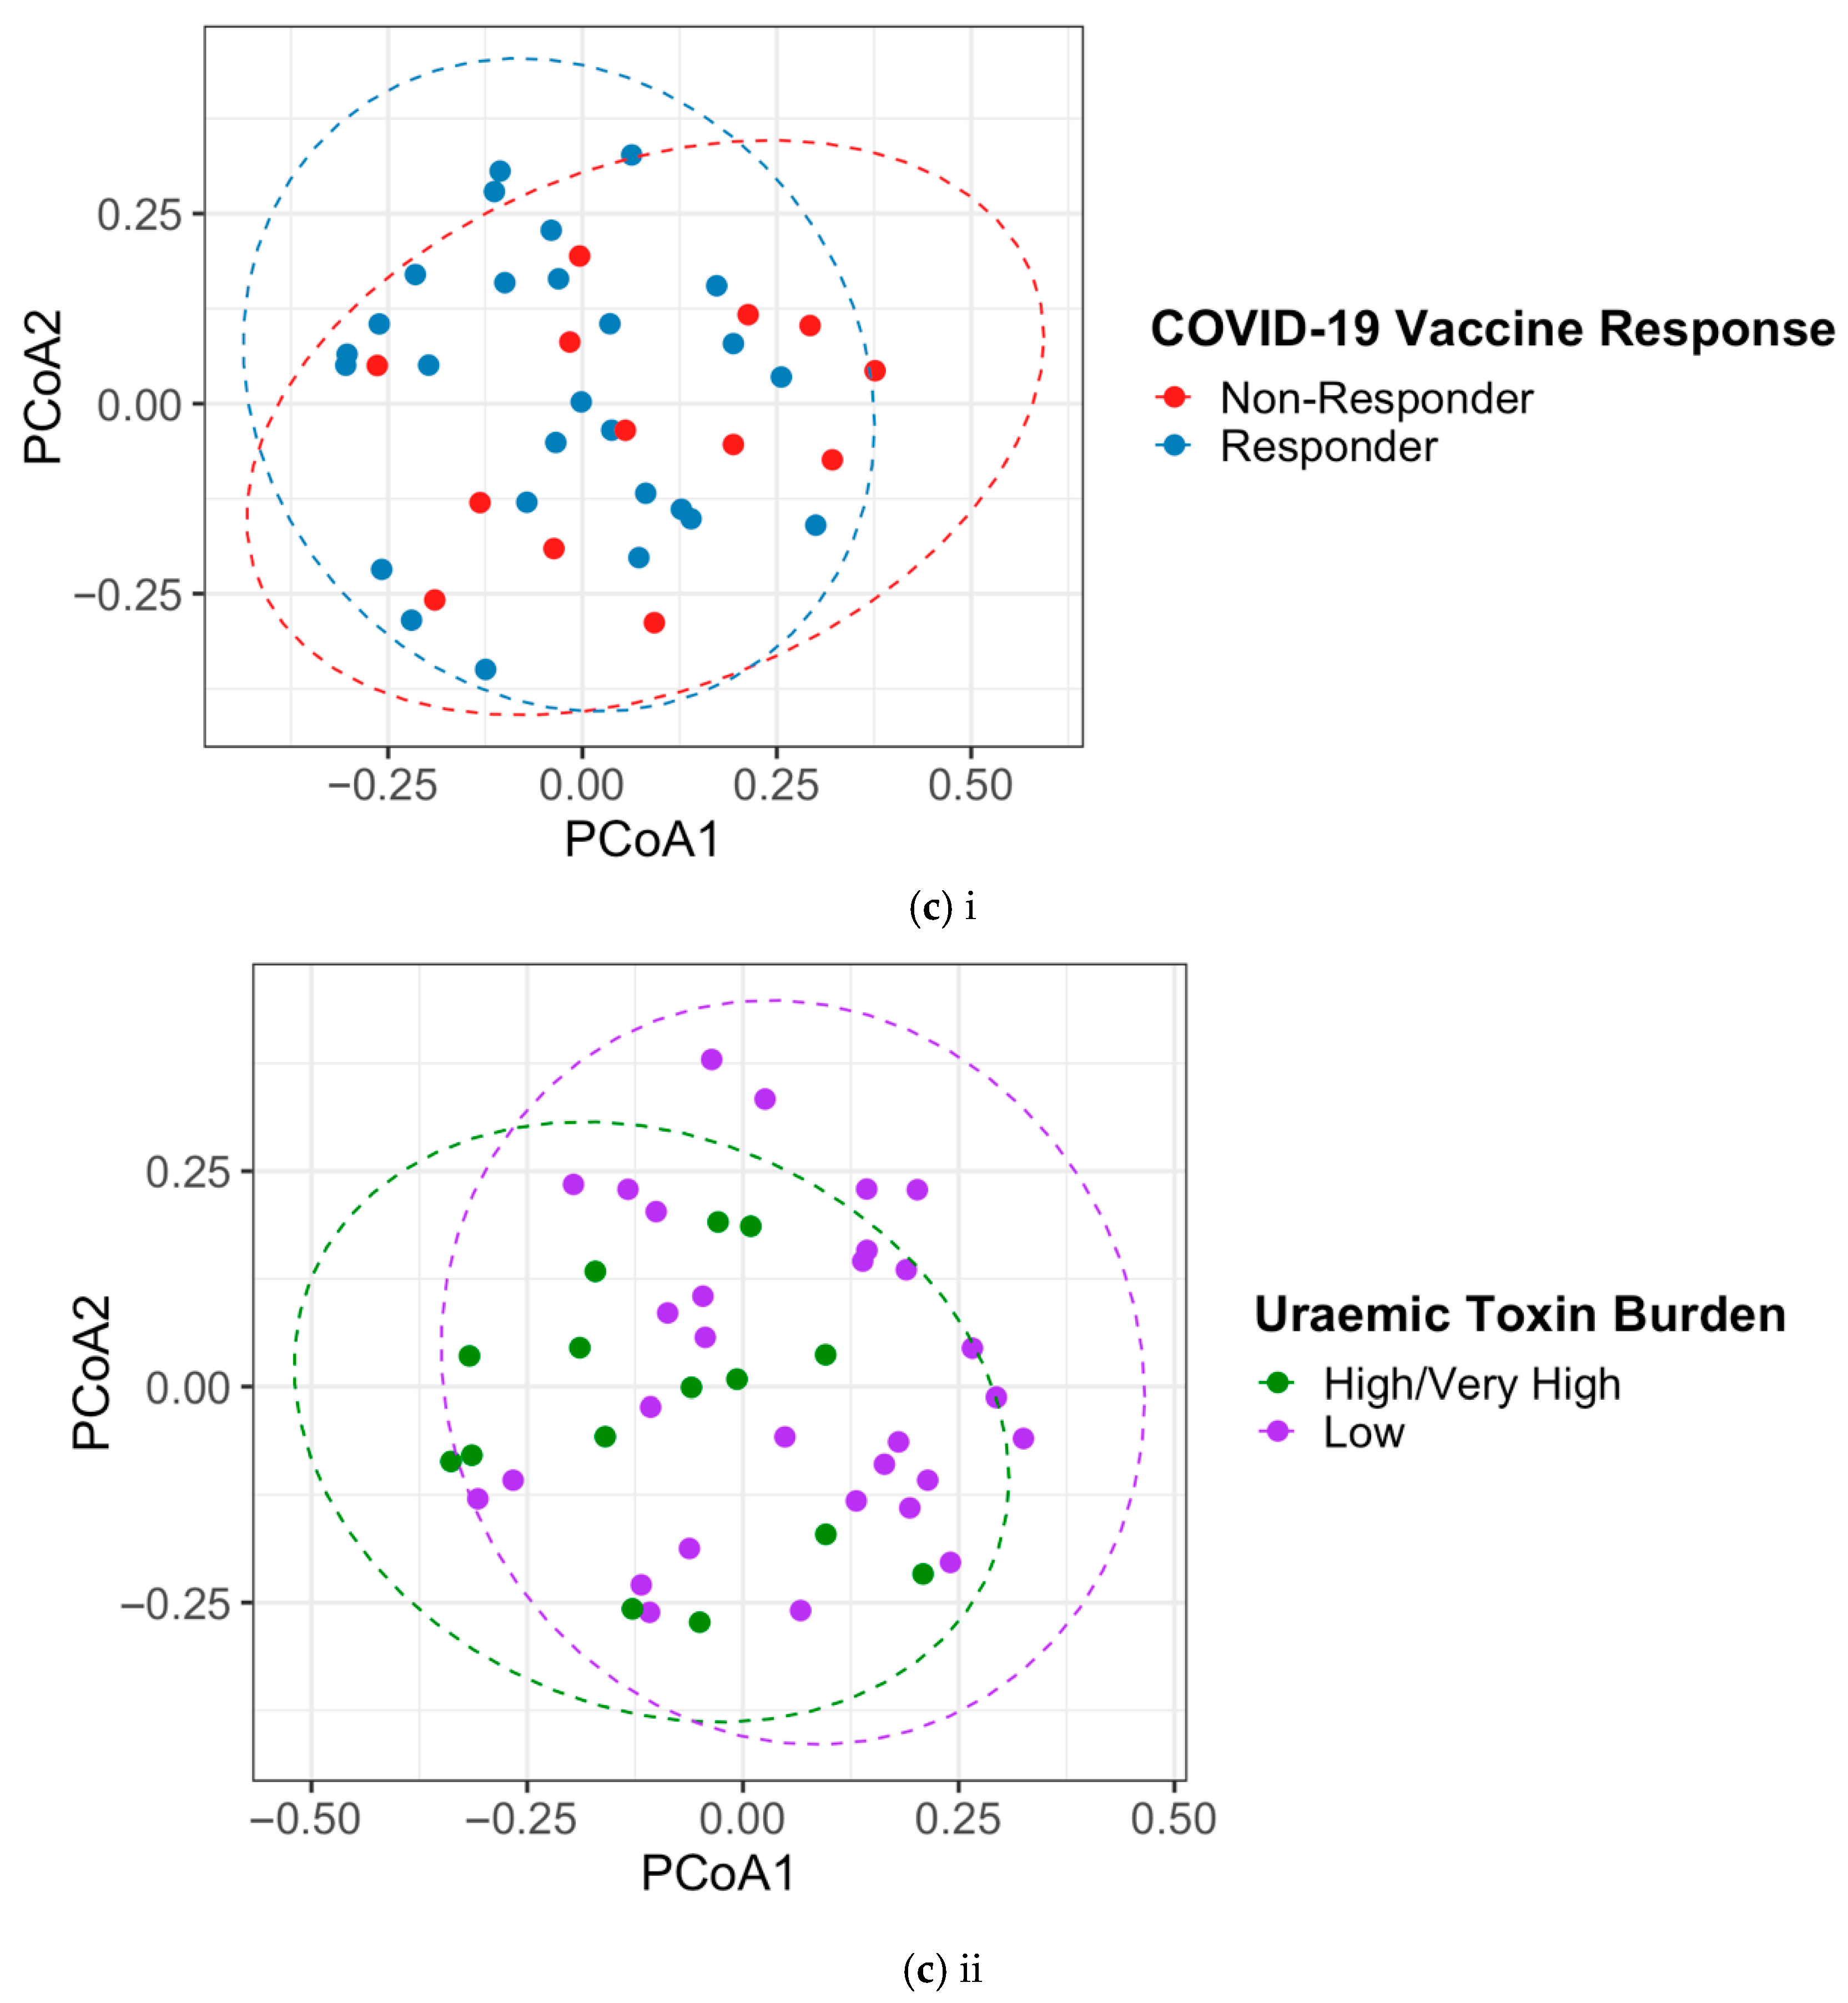
At the phylum level, no significant differences in relative abundance were observed between SARS-CoV-2 vaccine responder groups (Figure 4a). Alpha diversity did not differ significantly between SARS-CoV-2 vaccine responder groups (observed richness: p = 0.24; Shannon index: p = 0.09, Figure 4b). Beta diversity, assessed by Principal Coordinate Analysis (PCoA) of Bray–Curtis distances, demonstrated a significant difference in overall microbial community composition between vaccine responders and non-responders (R2 = 0.04, p = 0.03, PERMANOVA). PCoA plots were consistent with these findings, showing partial clustering by vaccine response (Figure 4c(i)).
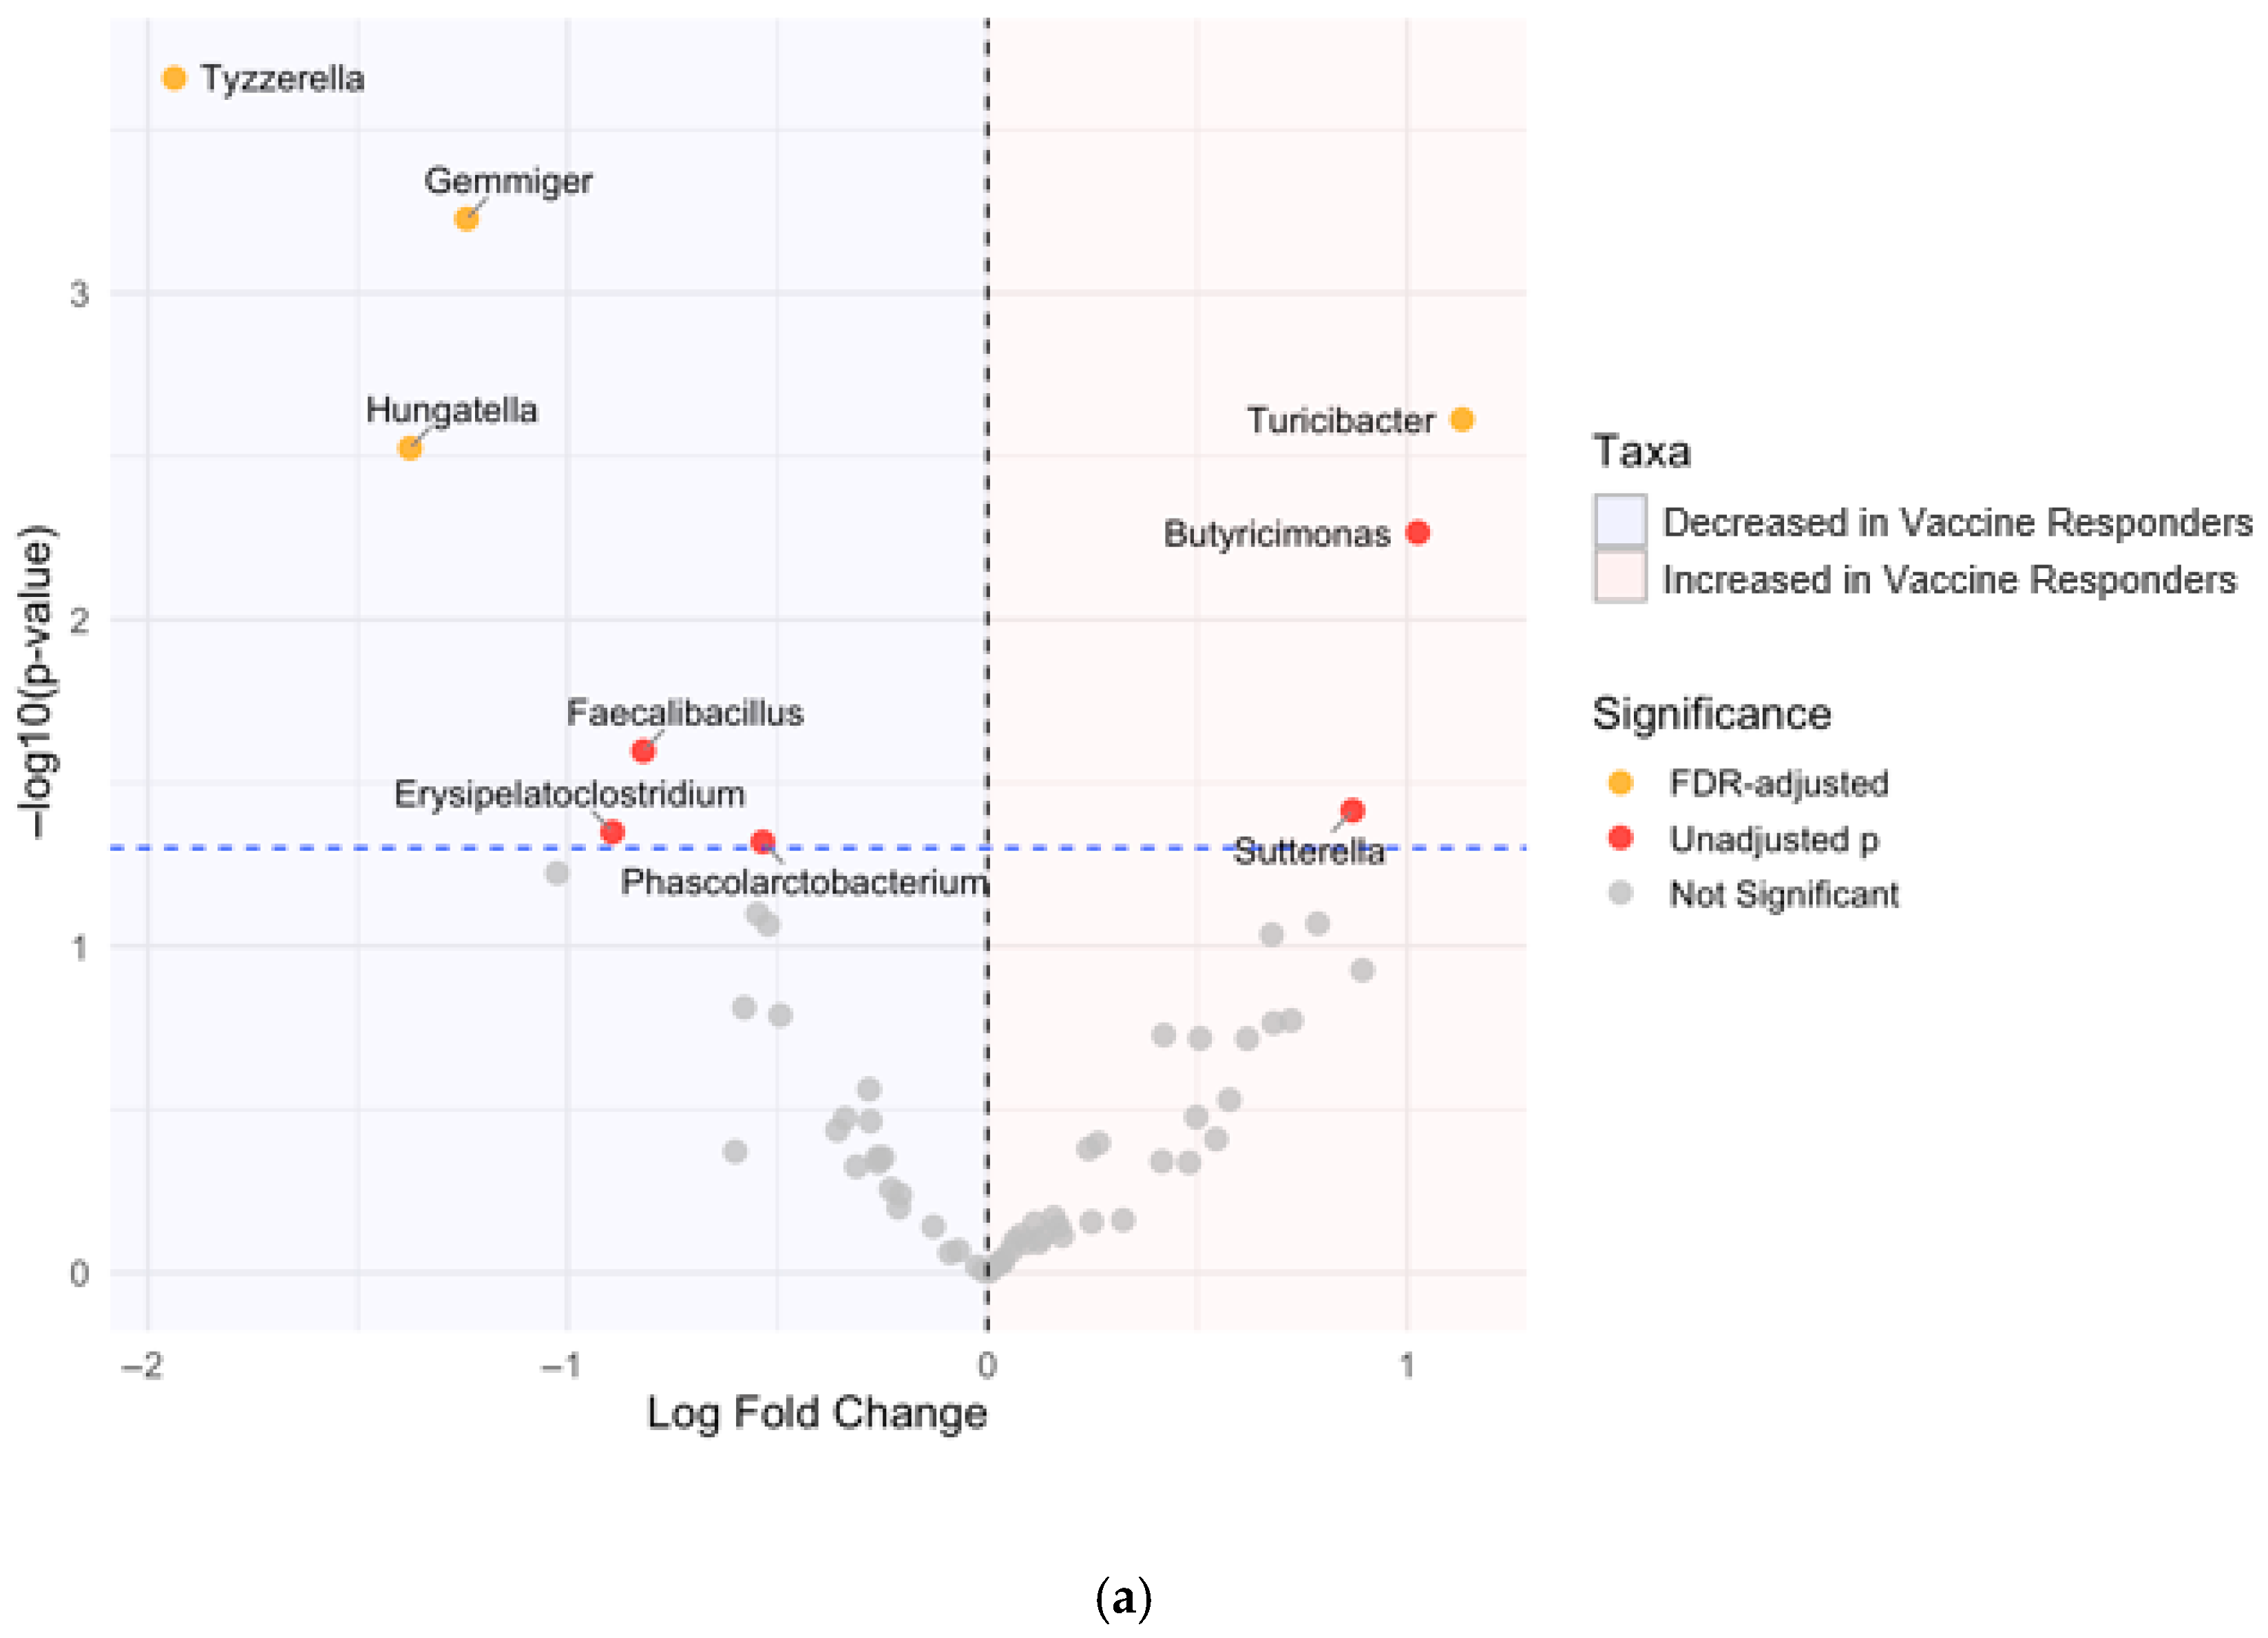
Differential abundance testing using ANCOM-BC2 identified several genera associated with vaccine response status (Figure 5). Vaccine responders exhibited a significantly lower relative abundance of Gemmiger, a taxon not previously associated with dysbiosis; Tyzzerella and Hungatella, which have been associated with dysbiosis; systemic inflammation; and uraemic toxin production. Conversely, responders showed an increased relative abundance of Turicibacter, a genus potentially implicated in immune activation, after false discovery rate (FDR) adjustment.

3.6. Gut Microbiota and Uraemic Toxin Concentrations

Increased abundance of Actinobacteria (log fold change 1.21, unadjusted p = 0.04) and Verrucomicrobia phyla (log fold change 1.12, unadjusted p = 0.05) were evident in participants with high uraemic toxin burden, compared to low burden (Figure 4a). Higher observed richness was found among patients with high toxin burden compared to those with low toxin burden (mean 94.4 vs. 79.2, p = 0.03), while Shannon diversity remained comparable (p = 0.36, Figure 4b).
Beta diversity demonstrated no significant separation between participants with low and high uraemic toxin burden (p = 0.24). PCoA plots were consistent with these findings, with substantial overlap between toxin burden groups (Figure 4c(ii)).
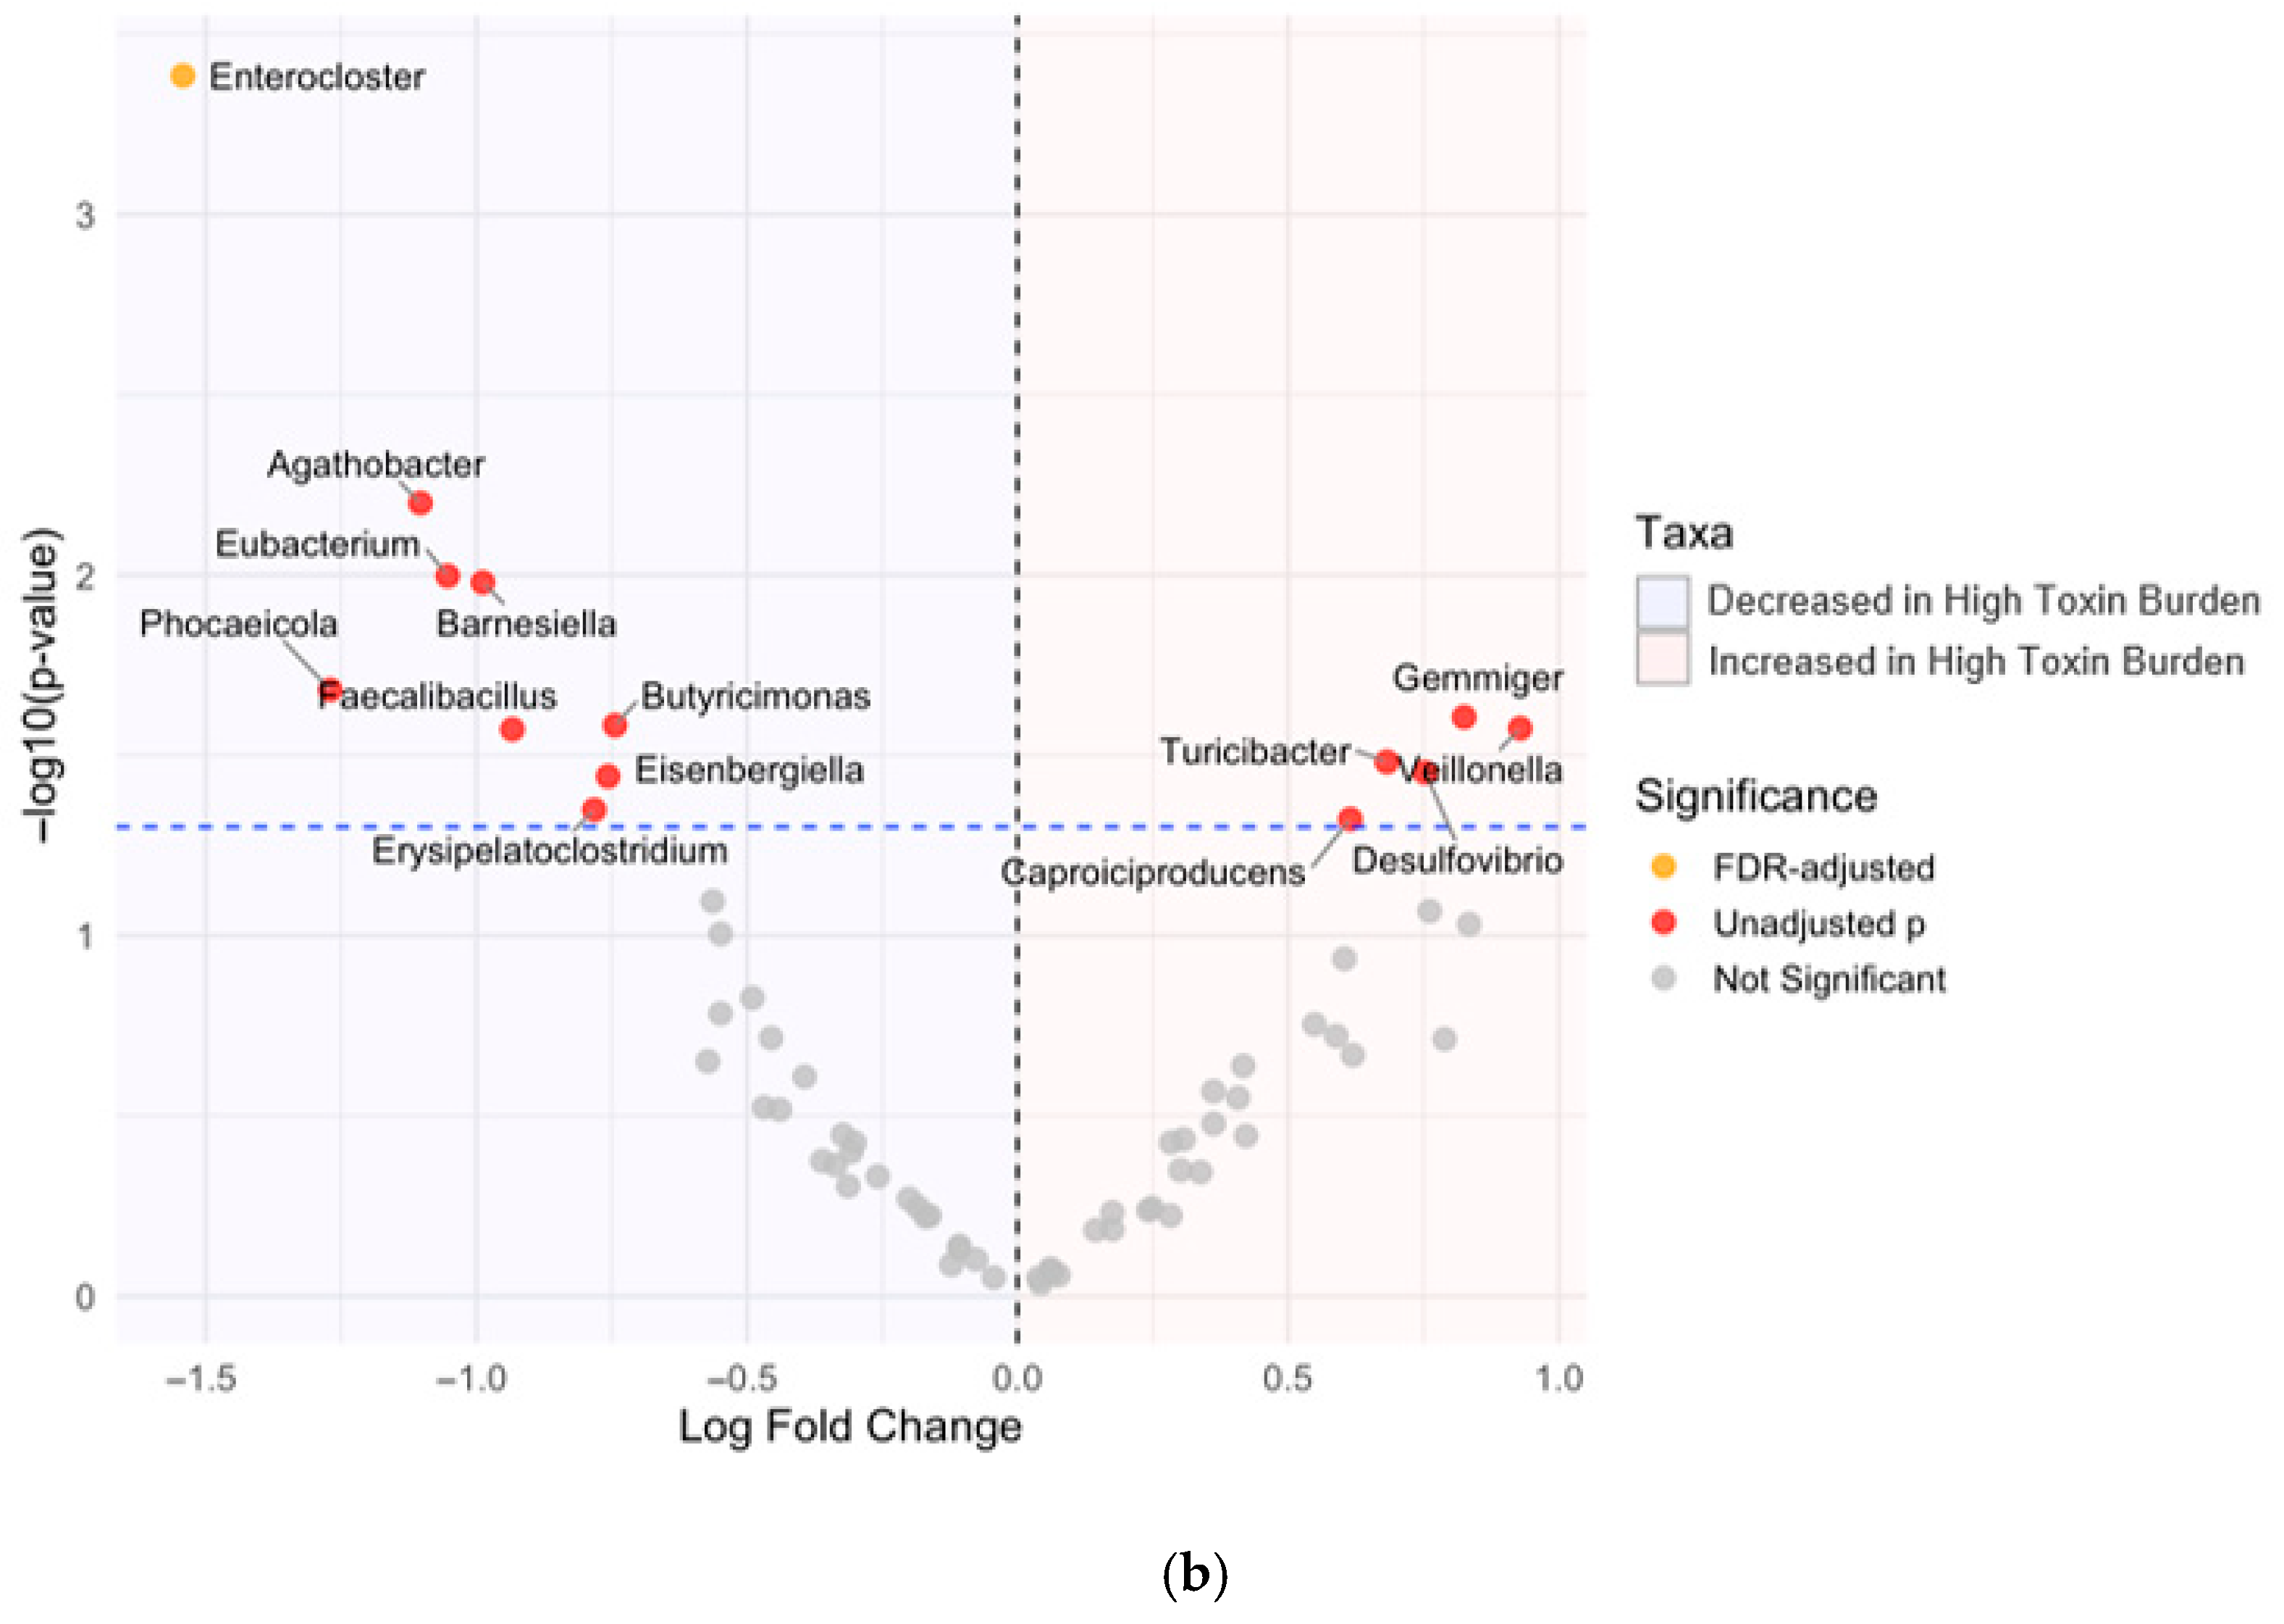
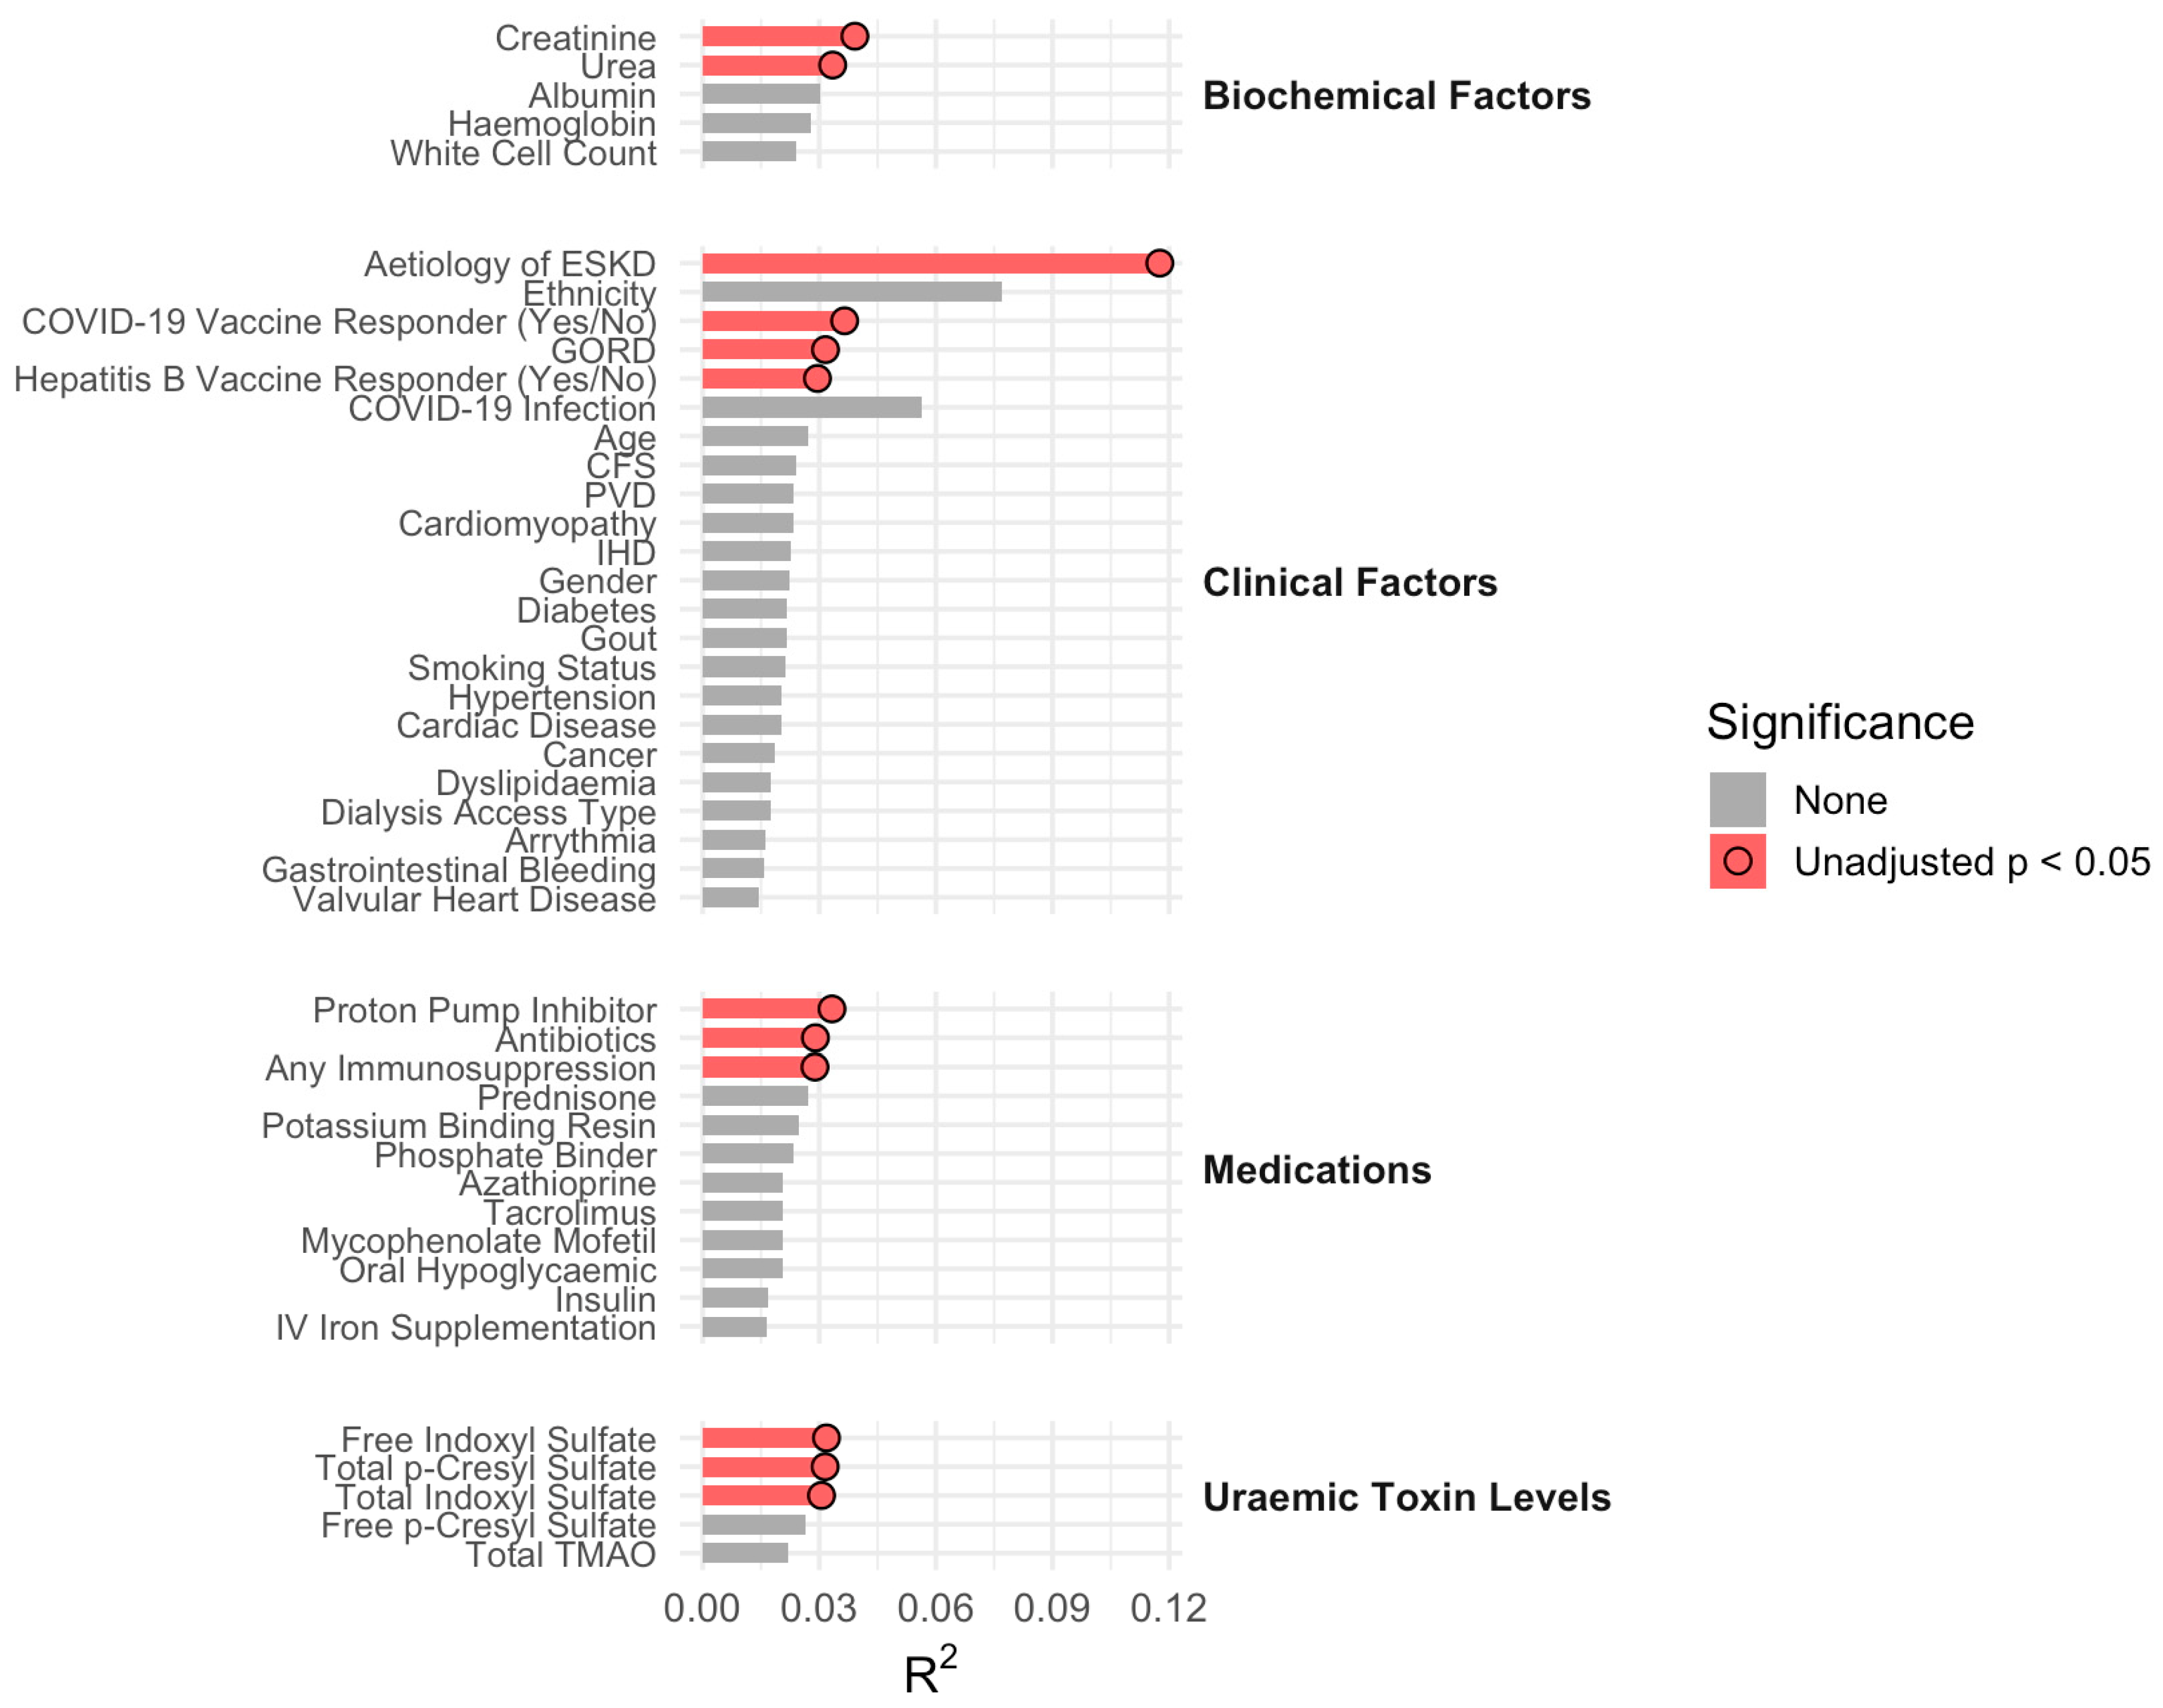
Differential abundance testing using ANCOM-BC2 was stratified by uraemic toxin burden. The high-toxin group showed a significant FDR-adjusted decrease in Enterocloster, while the unadjusted analyses indicated relative increases in Gemmiger, Turicibacter, Veillonella, Caproiciproducens, and Desulfovibrio (Figure 5). PERMANOVA models based on Bray–Curtis distances were performed to identify clinical and biochemical factors that were associated with the most explained variance (R2) in gut microbial composition between individuals. Among these, significant associations were observed with uraemic toxins: free indoxyl sulphate (R2 = 0.03, p = 0.03), total p-cresyl sulphate (R2 = 0.03, p = 0.03), and total indoxyl sulphate (R2 = 0.03, p = 0.04).
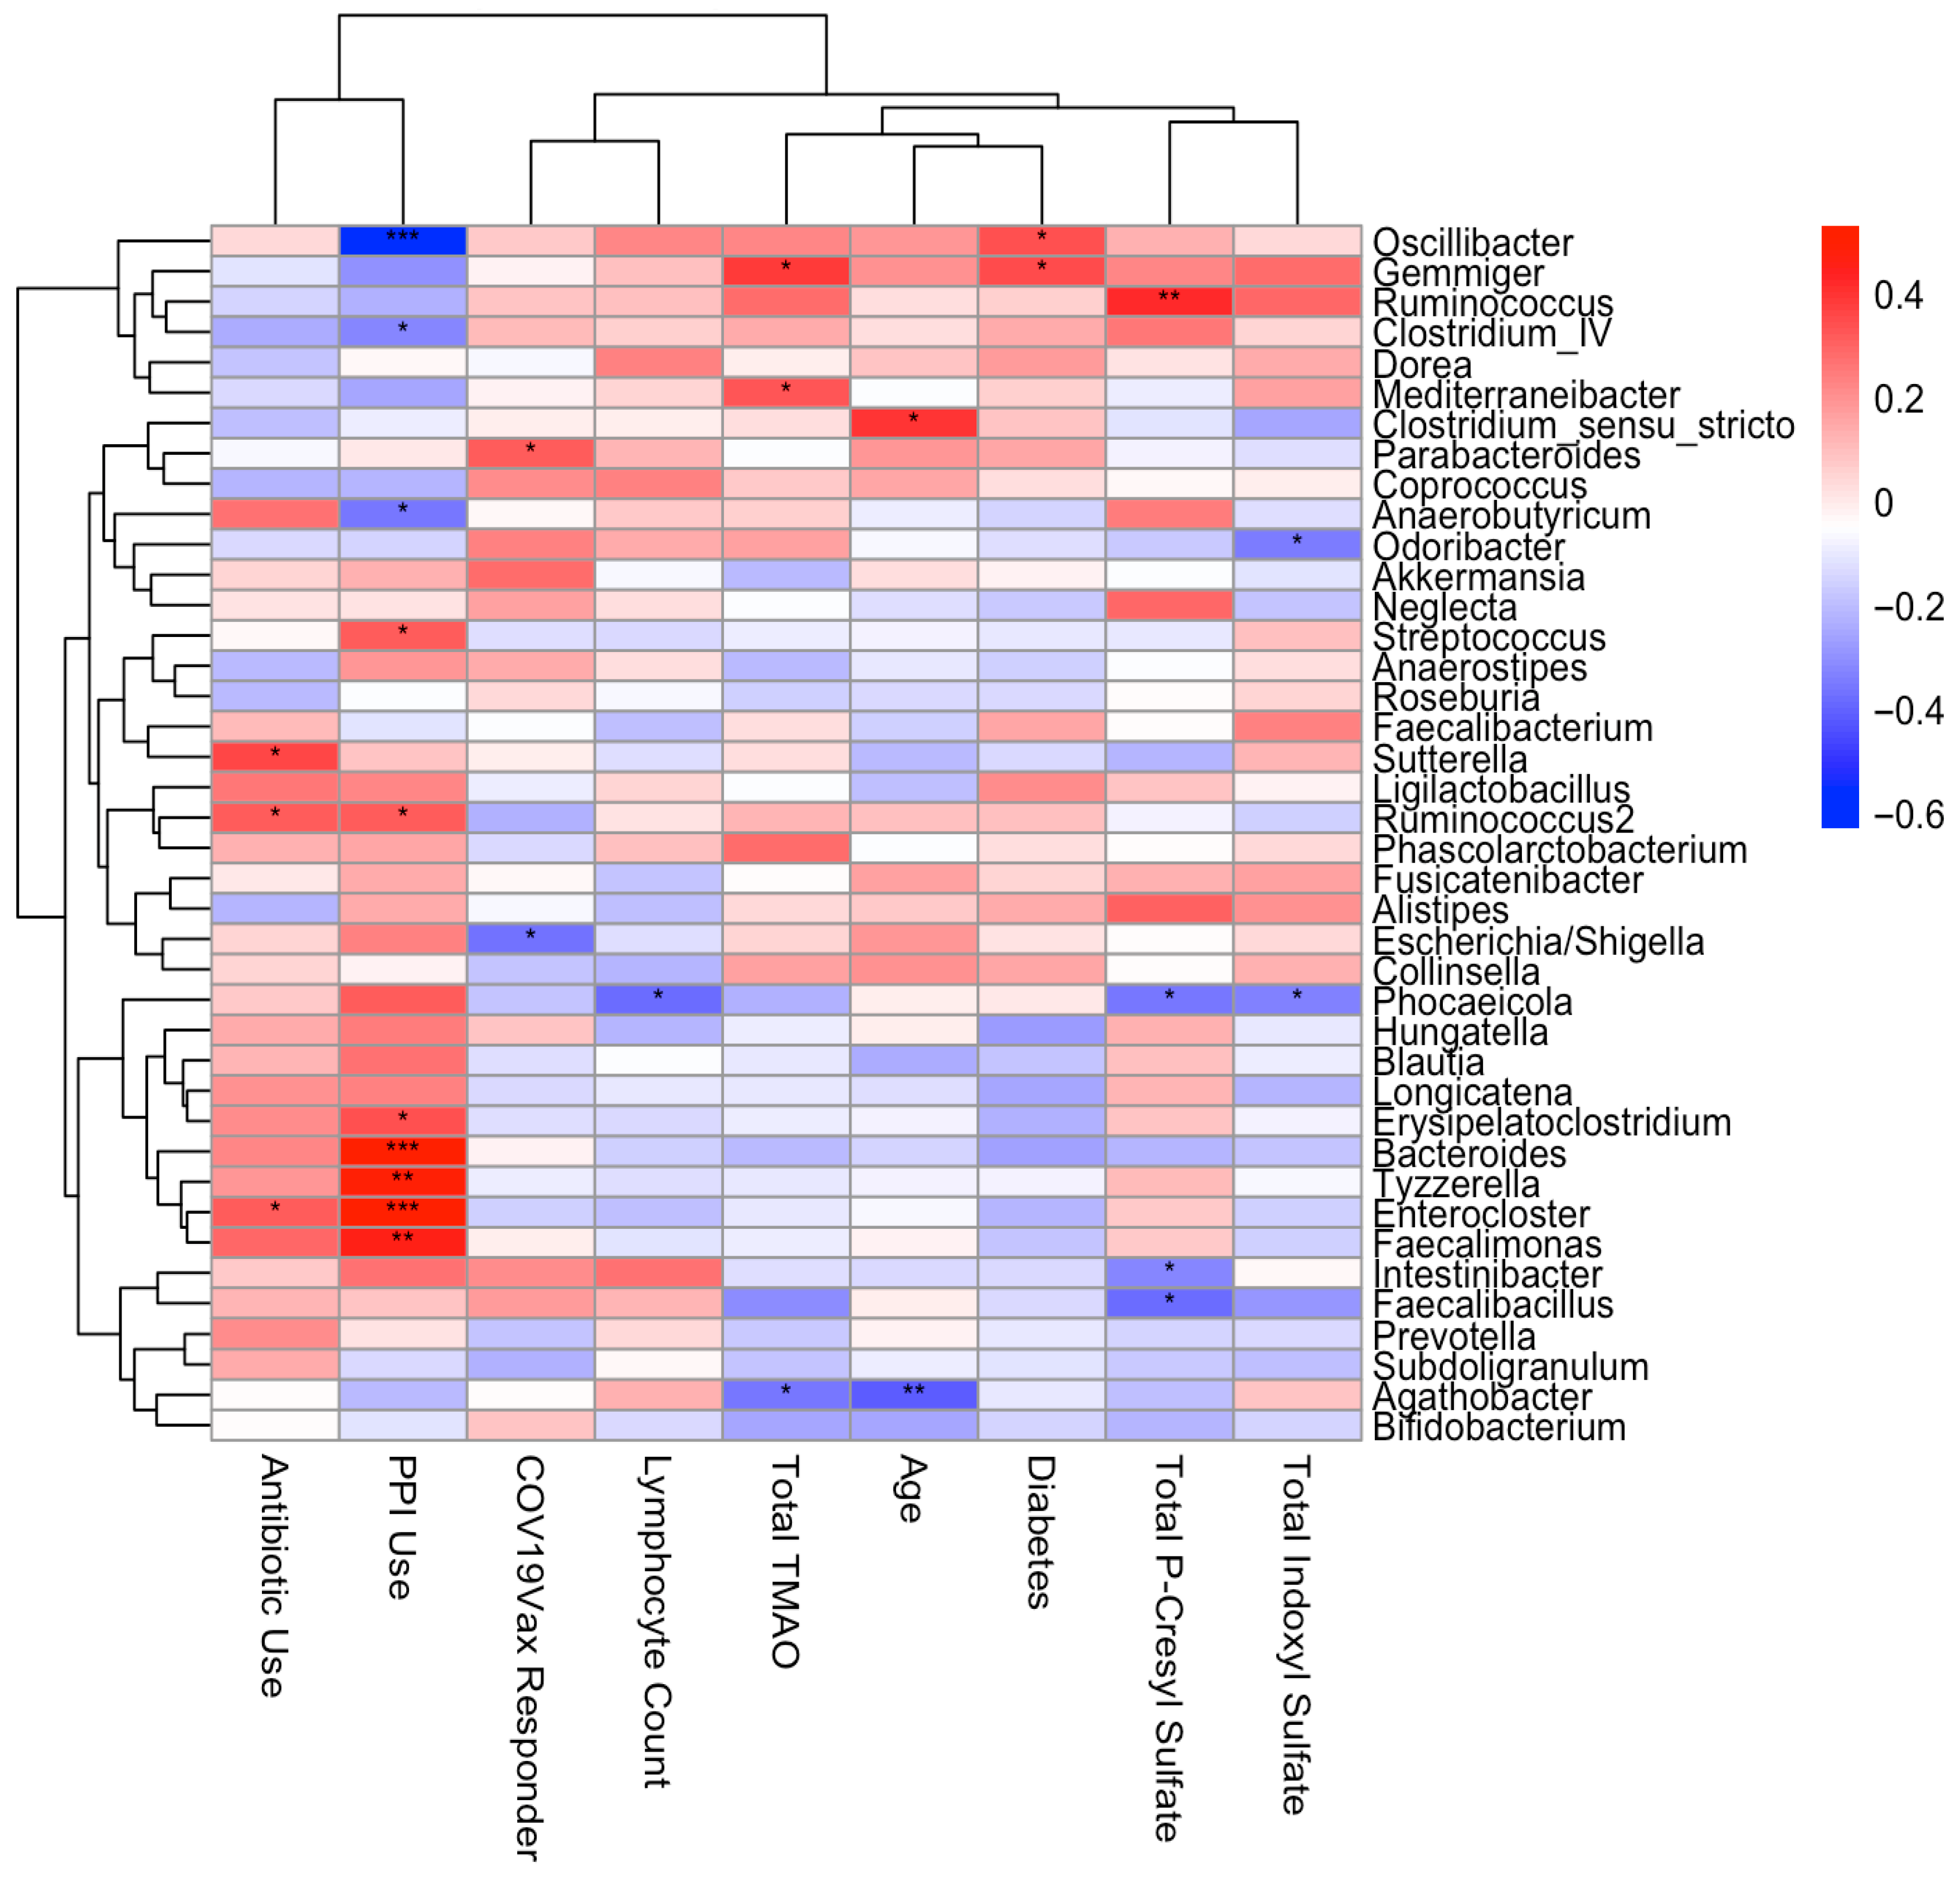
Spearman correlation analysis found significant associations between uraemic toxin concentrations and specific bacterial genera (Figure 6). Total TMAO concentrations correlated positively with Gemmiger and Mediterraneibacter, and negatively with Agathobacter. Total PCS concentration correlated negatively with Faecalibacillus, Intestinibacter, and Phocaeicola, but positively with Ruminococcus 2. Total IS concentrations were negatively correlated with Phocaeicola and Odoribacter (Figure 6).

3.7. Gut Microbiota and Clinical Associations

At the genus level, Spearman correlation analysis demonstrated that antibiotic exposure was associated with increased relative abundance of Enterocloster, Ruminococcus 2, and Sutterella, whereas lymphocyte count was inversely associated with Phocaeicola (Figure 6).
PERMANOVA based on Bray–Curtis dissimilarities identified several clinical and biochemical variables associated with inter-individual variation in gut microbial composition. The cause of kidney failure was the dominant contributor, explaining 12% of the total variance in microbial community structure (R2 = 0.12). Additional covariates contributing to microbial variation included serum creatinine, urea concentration, vaccine responder status, and exposure to proton pump inhibitors, immunosuppressive therapies, and antibiotics (Figure 7).

4. Discussion

To our knowledge, this is the first study to explore integrated relationships between gut microbiota composition, circulating uraemic toxin concentrations, and vaccine responsiveness in maintenance haemodialysis recipients. Uremic toxin accumulation has previously been implicated in immune dysfunction in dialysis recipients [17]. We found that circulating uraemic toxin concentrations were elevated, consistent with kidney failure, but did not differ between vaccine responders and non-responders when defined using a dichotomised antibody threshold. Circulating concentrations of IS, PCS, and TMAO did not distinguish responders from non-responders, nor were concentrations of uremic toxins associated with clinical events. Our primary findings therefore fail to support any relationship between uremic toxin burden and COVID-19 vaccine hypo-responsiveness. To explore the risk that arbitrary dichotomization based on toxin burden may obscure more subtle relationships, we conducted an exploratory analysis modelling toxin concentration as a continuous variable with adjustment for clinical determinants of vaccine response. No significant association with antibody response was observed; however, sensitivity analyses using log-transformed antibody titres suggested a potential association between higher burden and reduced responsiveness. Thus, whilst our primary data findings suggest that uremic toxins are unlikely to be important determinants of vaccine response in dialysis patients, we must wait for larger studies to confirm this hypothesis.

4.1. Vaccine Response and Gut Microbiome

The potential role of the gut microbiome in shaping vaccine responses has been increasingly recognised, although underlying mechanisms remain incompletely understood [37,38,39,40]. Prior studies in non-CKD cohorts have demonstrated associations between gut microbial composition and SARS-CoV-2 vaccine immunogenicity [41,42,43]. In the present study, differences in overall microbial composition were observed between responders and non-responders; however, the effect size was modest.
At the genus level, differences in relative abundance were observed between groups. However, these findings should be interpreted with caution. Our study utilised 16S rRNA sequencing, which provides genus-level resolution but does not allow direct inference of microbial function or metabolic activity. Furthermore, the modest sample size and potential sources of variability limit the ability to draw firm conclusions regarding specific taxa.
Several of the genera identified in this study have been associated with immune and metabolic processes in other contexts. For example, Parabacteriodes and Turicibacter have been linked to host–microbial signalling and epithelial barrier function [44,45], whereas Escherichia/Shigella, Tyzzerella, and Hungatella have been associated with inflammatory states and proteolytic metabolism [46,47,48]. Although functional interpretation is limited, as genus-level classification does not allow direct assessment of microbial function, these findings are biologically plausible and broadly consistent with patterns reported in the literature [48].
An important limitation is that in our study, microbiome and metabolite sampling occurred after vaccination. It remains unclear whether the observed microbial differences preceded vaccine responsiveness or were influenced by intervening factors such as medication exposure, illness, or the vaccine itself. Collectively, the limitations of sample timing and 16S sequencing methodology enable us to support the hypothesis that perturbations in the gut microbiome may influence vaccine responsiveness in dialysis, but do not provide proof of this concept.

4.2. Uraemic Toxins and Microbiota

Uraemic toxin production is closely linked to microbial function in CKD cohorts [49,50,51]. CKD is associated with depletion of carbohydrate-fermenting commensals and expansion of proteolytic taxa, a shift linked to circulating toxin accumulation [52,53], systemic inflammation [54,55], and adverse kidney outcomes [25,56]. These observations support the concept of a metabolically ‘toxic’ microbiome in advanced kidney disease. In keeping with this, higher toxin burden was associated with differences in microbial diversity, including increased alpha diversity. This finding may reflect the expansion of metabolically unfavourable taxa, rather than the restoration of a balanced microbial ecosystem, as has been observed in other dialysis cohorts [57]. Beta diversity analyses did not demonstrate clear separation by uraemic toxin burden, suggesting that uraemic toxin accumulation may relate more to functional or metabolic shifts within communities than to overall community composition.
Manipulation of the gut microbiota to decrease uraemic toxins remains an active area of investigation. Microbiome-targeted interventions and dietary modification have been shown to lower circulating uraemic toxins (PCS and IS) in CKD [58,59], highlighting the gut–kidney axis as a potentially modifiable pathway. In this context, our findings suggest that microbial community structure may represent more than a marker of uraemic toxin burden and instead form part of a broader framework linking dysbiosis, uraemic metabolism, and immune response.

4.3. Clinical Impacts

Variation in gut microbial composition was also associated with several clinical and demographic factors, highlighting the multifactorial influences shaping the gut microbiome in this population. Antibiotic exposure and prednisone use were associated with reduced vaccine responsiveness, consistent with their known effects on immune function and the gut microbiome [60,61,62,63]. Together, these associations raise the possibility that microbiome alterations may contribute to variability in vaccine response, although causality cannot be established from the current data.
Vaccine platform may also influence immune responses through differences in antigen delivery and immune activation. In this cohort, vaccine type was not independently associated with antibody response; however, given the modest sample size, we cannot exclude a potential influence of vaccine platform on microbiome composition or vaccine responsiveness.
The observed seroconversion rates following SARS-CoV-2 vaccination of ~70% in this study (Table A1) mirror those reported in comparable cohorts [64,65,66], and highlight impaired immunity compared with healthy cohorts in our previous studies, who consistently achieved seropositivity rates (anti-RBD Ig > 100 U/mL) of 100% following two SARS-CoV-2 vaccine doses [67,68]. We found that vaccine responders demonstrated higher lymphocyte counts, suggesting relative preservation of immune competence compared with non-responders. Despite this, rates of COVID-19 infection, hospitalisation, and mortality were similar between groups, indicating that serological response alone did not translate into detectable differences in short-term clinical outcomes. This aligns with evidence that vaccine protection in kidney failure reflects contributions from both humoral and cellular immunity, and that antibody titres alone incompletely capture protective immunity [3]. It is possible that cellular immune responses may remain relatively intact and continue to limit disease severity, even in the absence of robust serological responses, potentially accounting for the absence of observable differences in clinical outcomes.
Strengths of this study include its integrative design, combining microbiome sequencing, uraemic toxin profiling, and vaccine serology within a single, well-characterised cohort. The use of multiple complementary analytic approaches, including analyses of microbial diversity, clustering methods, and differential abundance testing, adds robustness to the interpretation. Limitations include the relatively small cohort size, single-centre design, and cross-sectional sampling, which preclude causal inference. The absence of dietary data and cellular immune profiling further limits interpretation. Accordingly, all findings should be considered exploratory and hypothesis-generating.
These findings suggest that vaccine hypo-responsiveness in dialysis is likely multifactorial. Uraemic toxin concentrations were not associated with vaccine response when analysed using dichotomized thresholds, although exploratory continuous analyses suggest a potential graded relationship with antibody concentrations. Differences in gut microbial composition were observed between responder groups, but these accounted for only a small proportion of overall variation, and functional interpretation remains limited. Overall, these findings support a potential role for the microbiome in contributing to variability in vaccine responsiveness. Further longitudinal studies incorporating pre-vaccination sampling and functional microbiome analyses are needed to clarify these relationships and inform strategies to improve vaccine response in this high-risk population.

Author Contributions

Conceptualization, E.V., H.W., and S.C.; methodology, B.S., G.B.P., and S.C.; validation, B.S.; formal analysis, E.V., A.G., B.S., and G.B.P.; investigation, E.V. and S.C.; resources, G.B.P.; data curation, E.V., A.G., B.S., G.B.P., and S.C.; writing—original draft preparation, E.V.; writing—review and editing, A.G., B.S., G.B.P., H.W., and S.C.; visualisation, S.C.; supervision, S.C.; project administration, S.C.; funding acquisition, S.C. All authors have read and agreed to the published version of the manuscript.

Funding

This research received no external funding.

Institutional Review Board Statement

This study was conducted in accordance with the Declaration of Helsinki and approved by the Human Research Ethics Committee of the University of Sydney (protocol code 2020/ETH01148, 16 July 2020).

Informed Consent Statement

Written informed consent was obtained from all participants involved in the study.

Data Availability Statement

The data presented in this study are not publicly available due to privacy and ethical restrictions related to the protection of participant confidentiality. Individual-level data cannot be shared as this would compromise participant privacy in accordance with the conditions of the ethics approval granted by the University of Sydney Human Research Ethics Committee. Aggregated data supporting the findings of this study may be made available from the corresponding author upon reasonable request and subject to approval by the relevant ethics committee.

Acknowledgments

The authors would like to acknowledge Brett McWhinney and the laboratory staff at Department of Chemical Pathology, Pathology Queensland, for their assistance with the assessment of uraemic toxins, as well as Anita Chitsaz for her assistance with gut microbiome sample processing. We also sincerely thank all study participants for providing samples and contributing to this research.

Conflicts of Interest

The authors declare no conflicts of interest.

Abbreviations

The following abbreviations are used in this manuscript:
ACEiAngiotensin-converting enzyme inhibitor
ANACOM-BC2Analysis of composition of microbiomes with bias correction of 2
BAUBinding antibody unit
CKDChronic kidney disease
HBVHepatitis B vaccine
ISIndoxyl sulphate
LC-MSLiquid chromatography–tandem mass spectrometry
NCNucleocapsid
PCoAPrincipal Coordinate Analysis
PCSP-Cresyl sulphate
PERMANOVAPermutational multivariate analysis of variance
RBDReceptor-Binding Domain
SFCAShort-chain fatty acids
TMAOTrimethylamine N-oxide

Appendix A

Table A1. Two-way frequency table of COVID-19 and hepatitis B responders.
SARS-CoV-2 ResponderSARS-CoV-2
Non-Responder
Totalp-Value
Hepatitis B Vaccine 0.25
Responder16 (76)5 (24)21
Non-responder6 (55)5 (45)11
Total221032
Table A2. Median uraemic toxin concentration by cluster.
Uraemic Toxin ClusterFree pCSTotal pCSFree ISTotal ISTotal TMAO
Low6.71363.96457
High18.4253.511.2121.5103
Very high2420941297130

References

  1. Kwiatkowska, E.; Safranow, K.; Wojciechowska-Koszko, I.; Roszkowska, P.; Dziedziejko, V.; Myślak, M.; Różański, J.; Ciechanowski, K.; Stompór, T.; Przybyciński, J.; et al. SARS-CoV-2 mRNA Vaccine-Induced Cellular and Humoral Immunity in Hemodialysis Patients. Biomedicines 2022, 10, 636. [Google Scholar] [CrossRef] [PubMed] [PubMed Central]
  2. Piotrowska, M.; Zieliński, M.; Tylicki, L.; Biedunkiewicz, B.; Kubanek, A.; Ślizień, Z.; Polewska, K.; Tylicki, P.; Muchlado, M.; Sakowska, J.; et al. Local and Systemic Immunity Are Impaired in End-Stage-Renal-Disease Patients Treated With Hemodialysis, Peritoneal Dialysis and Kidney Transplant Recipients Immunized With BNT162b2 Pfizer-BioNTech SARS-CoV-2 Vaccine. Front. Immunol. 2022, 13, 832924. [Google Scholar] [CrossRef] [PubMed] [PubMed Central]
  3. Babel, N.; Hugo, C.; Westhoff, T.H. Vaccination in patients with kidney failure: Lessons from COVID-19. Nat. Rev. Nephrol. 2022, 18, 708–723. [Google Scholar] [CrossRef] [PubMed] [PubMed Central]
  4. Edey, M.; Barraclough, K.; Johnson, D.W. Review article: Hepatitis B and dialysis. Nephrology 2010, 15, 137–145. [Google Scholar] [CrossRef] [PubMed]
  5. DaRoza, G.; Loewen, A.; Djurdjev, O.; Love, J.; Kempston, C.; Burnett, S.; Kiaii, M.; Taylor, P.A.; Levin, A. Stage of chronic kidney disease predicts seroconversion after hepatitis B immunization: Earlier is better. Am. J. Kidney Dis. Off. J. Natl. Kidney Found. 2003, 42, 1184–1192. [Google Scholar] [CrossRef] [PubMed]
  6. da Silva, E.N.; Baker, A.; Alshekaili, J.; Karpe, K.; Cook, M.C. A randomized trial of serological and cellular responses to hepatitis B vaccination in chronic kidney disease. PLoS ONE 2018, 13, e0204477. [Google Scholar] [CrossRef] [PubMed] [PubMed Central]
  7. Krueger, K.M.; Ison, M.G.; Ghossein, C. Practical Guide to Vaccination in All Stages of CKD, Including Patients Treated by Dialysis or Kidney Transplantation. Am. J. Kidney Dis. Off. J. Natl. Kidney Found. 2020, 75, 417–425. [Google Scholar] [CrossRef] [PubMed]
  8. Simon, B.; Rubey, H.; Treipl, A.; Gromann, M.; Hemedi, B.; Zehetmayer, S.; Kirsch, B. Haemodialysis patients show a highly diminished antibody response after COVID-19 mRNA vaccination compared with healthy controls. Nephrol. Dial. Transplant. Off. Publ. Eur. Dial. Transpl. Assoc.-Eur. Ren. Assoc. 2021, 36, 1709–1716. [Google Scholar] [CrossRef] [PubMed] [PubMed Central]
  9. Grupper, A.; Sharon, N.; Finn, T.; Cohen, R.; Israel, M.; Agbaria, A.; Rechavi, Y.; Schwartz, I.F.; Schwartz, D.; Lellouch, Y.; et al. Humoral Response to the Pfizer BNT162b2 Vaccine in Patients Undergoing Maintenance Hemodialysis. Clin. J. Am. Soc. Nephrol. CJASN 2021, 16, 1037–1042. [Google Scholar] [CrossRef] [PubMed] [PubMed Central]
  10. Udomkarnjananun, S.; Takkavatakarn, K.; Praditpornsilpa, K.; Nader, C.; Eiam-Ong, S.; Jaber, B.L.; Susantitaphong, P. Hepatitis B virus vaccine immune response and mortality in dialysis patients: A meta-analysis. J. Nephrol. 2020, 33, 343–354. [Google Scholar] [CrossRef]
  11. Betjes, M.G.H. Immune cell dysfunction and inflammation in end-stage renal disease. Nat. Rev. Nephrol. 2013, 9, 255–265. [Google Scholar] [CrossRef] [PubMed]
  12. Yu, M.; Kim, Y.J.; Kang, D.-H. Indoxyl sulfate-induced endothelial dysfunction in patients with chronic kidney disease via an induction of oxidative stress. Clin. J. Am. Soc. Nephrol. CJASN 2011, 6, 30–39. [Google Scholar] [CrossRef] [PubMed] [PubMed Central]
  13. Kim, H.Y.; Yoo, T.-H.; Hwang, Y.; Lee, G.H.; Kim, B.; Jang, J.; Yu, H.T.; Kim, M.C.; Cho, J.-Y.; Lee, C.J.; et al. Indoxyl sulfate (IS)-mediated immune dysfunction provokes endothelial damage in patients with end-stage renal disease (ESRD). Sci. Rep. 2017, 7, 3057. [Google Scholar] [CrossRef] [PubMed] [PubMed Central]
  14. Azevedo, M.L.V.; Bonan, N.B.; Dias, G.; Brehm, F.; Steiner, T.M.; Souza, W.M.; Stinghen, A.E.M.; Barreto, F.C.; Elifio-Esposito, S.; Pecoits-Filho, R.; et al. p-Cresyl sulfate affects the oxidative burst, phagocytosis process, and antigen presentation of monocyte-derived macrophages. Toxicol. Lett. 2016, 263, 1–5. [Google Scholar] [CrossRef] [PubMed]
  15. Schepers, E.; Meert, N.; Glorieux, G.; Goeman, J.; Van der Eycken, J.; Vanholder, R. P-cresylsulphate, the main in vivo metabolite of p-cresol, activates leucocyte free radical production. Nephrol. Dial. Transplant. Off. Publ. Eur. Dial. Transpl. Assoc.-Eur. Ren. Assoc. 2007, 22, 592–596. [Google Scholar] [CrossRef] [PubMed]
  16. Ghimire, S.; Matos, C.; Caioni, M.; Weber, D.; Peter, K.; Holler, E.; Kreutz, M.; Renner, K. Indoxyl 3-sulfate inhibits maturation and activation of human monocyte-derived dendritic cells. Immunobiology 2018, 223, 239–245. [Google Scholar] [CrossRef] [PubMed]
  17. Espi, M.; Koppe, L.; Fouque, D.; Thaunat, O. Chronic Kidney Disease-Associated Immune Dysfunctions: Impact of Protein-Bound Uremic Retention Solutes on Immune Cells. Toxins 2020, 12, 300. [Google Scholar] [CrossRef] [PubMed] [PubMed Central]
  18. Tourountzis, T.; Lioulios, G.; Van Laecke, S.; Ginikopoulou, E.; Nikolaidou, V.; Moysidou, E.; Stai, S.; Christodoulou, M.; Fylaktou, A.; Glorieux, G.; et al. Immunosenescence and Immune Exhaustion Are Associated with Levels of Protein-Bound Uremic Toxins in Patients on Hemodialysis. Biomedicines 2023, 11, 2504. [Google Scholar] [CrossRef] [PubMed] [PubMed Central]
  19. Shiba, T.; Makino, I.; Sasaki, T.; Fukuhara, Y.; Kawakami, K.; Kato, I.; Kobayashi, T. p-Cresyl sulfate decreases peripheral B cells in mice with adenine-induced renal dysfunction. Toxicol. Appl. Pharmacol. 2018, 342, 50–59. [Google Scholar] [CrossRef] [PubMed]
  20. Lim, W.H.; Kireta, S.; Leedham, E.; Russ, G.R.; Coates, P.T. Uremia impairs monocyte and monocyte-derived dendritic cell function in hemodialysis patients. Kidney Int. 2007, 72, 1138–1148. [Google Scholar] [CrossRef] [PubMed]
  21. Glorieux, G.; Burtey, S.; Evenepoel, P.; Jankowski, J.; Koppe, L.; Masereeuw, R.; Vanholder, R. A guide to uraemic toxicity. Nat. Rev. Nephrol. 2025, 22, 50–68. [Google Scholar] [CrossRef]
  22. Evenepoel, P.; Meijers, B.K.I.; Bammens, B.R.M.; Verbeke, K. Uremic toxins originating from colonic microbial metabolism. Kidney Int. 2009, 76, S12–S19. [Google Scholar] [CrossRef]
  23. Chaves, L.D.; McSkimming, D.I.; Bryniarski, M.A.; Honan, A.M.; Abyad, S.; Thomas, S.A.; Wells, S.; Buck, M.; Sun, Y.; Genco, R.J.; et al. Chronic kidney disease, uremic milieu, and its effects on gut bacterial microbiota dysbiosis. Am. J. Physiol. Ren. Physiol. 2018, 315, F487–F502. [Google Scholar] [CrossRef] [PubMed] [PubMed Central]
  24. Zheng, D.; Liwinski, T.; Elinav, E. Interaction between microbiota and immunity in health and disease. Cell Res. 2020, 30, 492–506. [Google Scholar] [CrossRef]
  25. Laiola, M.; Koppe, L.; Larabi, A.; Thirion, F.; Lange, C.; Quinquis, B.; David, A.; Le Chatelier, E.; Benoit, B.; Sequino, G.; et al. Toxic microbiome and progression of chronic kidney disease: Insights from a longitudinal CKD-Microbiome Study. Gut 2025, 74, 1624–1637. [Google Scholar] [CrossRef]
  26. Vaziri, N.D.; Wong, J.; Pahl, M.; Piceno, Y.M.; Yuan, J.; DeSantis, T.Z.; Ni, Z.; Nguyen, T.-H.; Andersen, G.L. Chronic kidney disease alters intestinal microbial flora. Kidney Int. 2013, 83, 308–315. [Google Scholar] [CrossRef] [PubMed]
  27. Cao, C.; Zhu, H.; Yao, Y.; Zeng, R. Gut Dysbiosis and Kidney Diseases. Front. Med. 2022, 9, 829349. [Google Scholar] [CrossRef] [PubMed] [PubMed Central]
  28. Yacoub, R.; Wyatt, C.M. Manipulating the gut microbiome to decrease uremic toxins. Kidney Int. 2017, 91, 521–523. [Google Scholar] [CrossRef] [PubMed]
  29. Glorieux, G.; Gryp, T.; Perna, A. Gut-Derived Metabolites and Their Role in Immune Dysfunction in Chronic Kidney Disease. Toxins 2020, 12, 245. [Google Scholar] [CrossRef] [PubMed] [PubMed Central]
  30. Anders, H.-J.; Andersen, K.; Stecher, B. The intestinal microbiota, a leaky gut, and abnormal immunity in kidney disease. Kidney Int. 2013, 83, 1010–1016. [Google Scholar] [CrossRef] [PubMed]
  31. Nigam, S.K.; Bush, K.T. Uraemic syndrome of chronic kidney disease: Altered remote sensing and signalling. Nat. Rev. Nephrol. 2019, 15, 301–316. [Google Scholar] [CrossRef] [PubMed] [PubMed Central]
  32. Pretorius, C.J.; McWhinney, B.C.; Sipinkoski, B.; Johnson, L.A.; Rossi, M.; Campbell, K.L.; Ungerer, J.P.J. Reference ranges and biological variation of free and total serum indoxyl- and p-cresyl sulphate measured with a rapid UPLC fluorescence detection method. Clin. Chim. Acta 2013, 419, 122–126. [Google Scholar] [CrossRef] [PubMed]
  33. Callahan, B.J.; McMurdie, P.J.; Rosen, M.J.; Han, A.W.; Johnson, A.J.A.; Holmes, S.P. DADA2: High-resolution sample inference from Illumina amplicon data. Nat. Methods 2016, 13, 581–583. [Google Scholar] [CrossRef] [PubMed] [PubMed Central]
  34. Callahan, B. RDP Taxonomic Training Data Formatted for DADA2 (RDP Trainset 18/Release 11.5) [Internet]. Zenodo. 2020. Available online: https://zenodo.org/records/4310151 (accessed on 10 November 2025).
  35. Lin, H.; Peddada, S.D. Multigroup analysis of compositions of microbiomes with covariate adjustments and repeated measures. Nat. Methods 2024, 21, 83–91. [Google Scholar] [CrossRef]
  36. Gessner, A.; di Giuseppe, R.; Koch, M.; Fromm, M.F.; Lieb, W.; Maas, R. Trimethylamine-N-oxide (TMAO) determined by LC-MS/MS: Distribution and correlates in the population-based PopGen cohort. Clin. Chem. Lab. Med. 2020, 58, 733–740. [Google Scholar] [CrossRef] [PubMed]
  37. Loddo, F.; Laganà, P.; Rizzo, C.E.; Calderone, S.M.; Romeo, B.; Venuto, R.; Maisano, D.; Fedele, F.; Squeri, R.; Nicita, A.; et al. Intestinal Microbiota and Vaccinations: A Systematic Review of the Literature. Vaccines 2025, 13, 306. [Google Scholar] [CrossRef] [PubMed] [PubMed Central]
  38. Norton, T.; Lynn, M.A.; Rossouw, C.; Abayasingam, A.; Perkins, G.; Hissaria, P.; Bull, R.A.; Lynn, D.J. B and T cell responses to the BNT162b2 COVID-19 mRNA vaccine are not impaired in germ-free or antibiotic-treated mice. Gut 2024, 73, 1222–1224. [Google Scholar] [CrossRef] [PubMed] [PubMed Central]
  39. Jordan, A.; Carding, S.R.; Hall, L.J. The early-life gut microbiome and vaccine efficacy. Lancet Microbe 2022, 3, e787–e794. [Google Scholar] [CrossRef]
  40. Hosomi, K.; Kunisawa, J. Impact of the intestinal environment on the immune responses to vaccination. Vaccine 2020, 38, 6959–6965. [Google Scholar] [CrossRef]
  41. Ng, S.C.; Peng, Y.; Zhang, L.; Mok, C.K.; Zhao, S.; Li, A.; Ching, J.Y.; Liu, Y.; Yan, S.; Chan, D.L.S.; et al. Gut microbiota composition is associated with SARS-CoV-2 vaccine immunogenicity and adverse events. Gut 2022, 71, 1106–1116. [Google Scholar] [CrossRef]
  42. Lunken, G.R.; Golding, L.; Schick, A.; Majdoubi, A.; Lavoie, P.M.; Vallance, B.A. Gut microbiome and dietary fibre intake strongly associate with IgG function and maturation following SARS-CoV-2 mRNA vaccination. Gut 2024, 73, 208–210. [Google Scholar] [CrossRef]
  43. Peng, Y.; Zhang, L.; Mok, C.K.P.; Ching, J.Y.L.; Zhao, S.; Wong, M.K.L.; Zhu, J.; Chen, C.; Wang, S.; Yan, S.; et al. Baseline gut microbiota and metabolome predict durable immunogenicity to SARS-CoV-2 vaccines. Signal Transduct. Target. Ther. 2023, 8, 373. [Google Scholar] [CrossRef]
  44. Liu, J.; Qiu, H.; Zhao, J.; Shao, N.; Chen, C.; He, Z.; Zhao, X.; Zhao, J.; Zhou, Y.; Xu, L. Parabacteroides as a promising target for disease intervention: Current stage and pending issues. npj Biofilms Microbiomes 2025, 11, 137. [Google Scholar] [CrossRef]
  45. Hamada, K.; Isobe, J.; Hattori, K.; Hosonuma, M.; Baba, Y.; Murayama, M.; Narikawa, Y.; Toyoda, H.; Funayama, E.; Tajima, K.; et al. Turicibacter and Acidaminococcus predict immune-related adverse events and efficacy of immune checkpoint inhibitor. Front. Immunol. 2023, 14, 1164724. [Google Scholar] [CrossRef] [PubMed] [PubMed Central]
  46. Olaisen, M.; Flatberg, A.; Granlund, A.v.B.; Røyset, E.S.; Martinsen, T.C.; Sandvik, A.K.; Fossmark, R. Bacterial Mucosa-associated Microbiome in Inflamed and Proximal Noninflamed Ileum of Patients With Crohn’s Disease. Inflamm. Bowel Dis. 2021, 27, 12–24. [Google Scholar] [CrossRef]
  47. Kelly, T.N.; Bazzano, L.A.; Ajami, N.J.; He, H.; Zhao, J.; Petrosino, J.F.; Correa, A.; He, J. Gut Microbiome Associates With Lifetime Cardiovascular Disease Risk Profile Among Bogalusa Heart Study Participants. Circ. Res. 2016, 119, 956–964. [Google Scholar] [CrossRef]
  48. Liu, Y.; Zhou, J.; Yang, Y.; Chen, X.; Chen, L.; Wu, Y. Intestinal Microbiota and Its Effect on Vaccine-Induced Immune Amplification and Tolerance. Vaccines 2024, 12, 868. [Google Scholar] [CrossRef]
  49. Poesen, R.; Windey, K.; Neven, E.; Kuypers, D.; De Preter, V.; Augustijns, P.; D’Haese, P.; Evenepoel, P.; Verbeke, K.; Meijers, B. The Influence of CKD on Colonic Microbial Metabolism. J. Am. Soc. Nephrol. 2016, 27, 1389–1399. [Google Scholar] [CrossRef] [PubMed] [PubMed Central]
  50. Graboski, A.L.; Redinbo, M.R. Gut-Derived Protein-Bound Uremic Toxins. Toxins 2020, 12, 590. [Google Scholar] [CrossRef] [PubMed] [PubMed Central]
  51. Xu, K.-Y.; Xia, G.-H.; Lu, J.-Q.; Chen, M.-X.; Zhen, X.; Wang, S.; You, C.; Nie, J.; Zhou, H.-W.; Yin, J. Impaired renal function and dysbiosis of gut microbiota contribute to increased trimethylamine-N-oxide in chronic kidney disease patients. Sci. Rep. 2017, 7, 1445. [Google Scholar] [CrossRef] [PubMed] [PubMed Central]
  52. Gryp, T.; Huys, G.R.B.; Joossens, M.; Van Biesen, W.; Glorieux, G.; Vaneechoutte, M. Isolation and Quantification of Uremic Toxin Precursor-Generating Gut Bacteria in Chronic Kidney Disease Patients. Int. J. Mol. Sci. 2020, 21, 1986. [Google Scholar] [CrossRef] [PubMed] [PubMed Central]
  53. Rysz, J.; Franczyk, B.; Ławiński, J.; Olszewski, R.; Ciałkowska-Rysz, A.; Gluba-Brzózka, A. The Impact of CKD on Uremic Toxins and Gut Microbiota. Toxins 2021, 13, 252. [Google Scholar] [CrossRef] [PubMed] [PubMed Central]
  54. Bhargava, S.; Merckelbach, E.; Noels, H.; Vohra, A.; Jankowski, J. Homeostasis in the Gut Microbiota in Chronic Kidney Disease. Toxins 2022, 14, 648. [Google Scholar] [CrossRef] [PubMed] [PubMed Central]
  55. Madella, A.M.; Van Bergenhenegouwen, J.; Garssen, J.; Masereeuw, R.; Overbeek, S.A. Microbial-Derived Tryptophan Catabolites, Kidney Disease and Gut Inflammation. Toxins 2022, 14, 645. [Google Scholar] [CrossRef] [PubMed] [PubMed Central]
  56. Szeto, C.C.; Ng, J.K.C. Toxic microbiome and progression of chronic kidney disease: Insights from a longitudinal CKD-microbiome study. Gut 2025, 75, 847–848. [Google Scholar] [CrossRef] [PubMed]
  57. James, P.; Stanford, J.; Dixit, O.V.A.; Nicdao, M.A.; McWhinney, B.; Sud, K.; Ryan, M.; Read, S.; Ahlenstiel, G.; Lambert, K.; et al. Associations Between Uraemic Toxins and Gut Microbiota in Adults Initiating Peritoneal Dialysis. Toxins 2025, 17, 334. [Google Scholar] [CrossRef]
  58. Cedillo-Flores, R.; Cuevas-Budhart, M.A.; Cavero-Redondo, I.; Kappes, M.; Ávila-Díaz, M.; Paniagua, R. Impact of Gut Microbiome Modulation on Uremic Toxin Reduction in Chronic Kidney Disease: A Systematic Review and Network Meta-Analysis. Nutrients 2025, 17, 1247. [Google Scholar] [CrossRef]
  59. Kemp, J.A.; Ribeiro, M.; Borges, N.A.; Cardozo, L.F.M.F.; Fouque, D.; Mafra, D. Dietary Intake and Gut Microbiome in CKD. Clin. J. Am. Soc. Nephrol. 2025, 20, 1003. [Google Scholar] [CrossRef]
  60. Elvers, K.T.; Wilson, V.J.; Hammond, A.; Duncan, L.; Huntley, A.L.; Hay, A.D.; Werf, E.T. van der Antibiotic-induced changes in the human gut microbiota for the most commonly prescribed antibiotics in primary care in the UK: A systematic review. BMJ Open 2020, 10, e035677. [Google Scholar] [CrossRef]
  61. Hagan, T.; Cortese, M.; Rouphael, N.; Boudreau, C.; Linde, C.; Maddur, M.S.; Das, J.; Wang, H.; Guthmiller, J.; Zheng, N.-Y.; et al. Antibiotics-Driven Gut Microbiome Perturbation Alters Immunity to Vaccines in Humans. Cell 2019, 178, 1313–1328.e13. [Google Scholar] [CrossRef]
  62. Ramirez, J.; Guarner, F.; Bustos Fernandez, L.; Maruy, A.; Sdepanian, V.L.; Cohen, H. Antibiotics as Major Disruptors of Gut Microbiota. Front. Cell. Infect. Microbiol. 2020, 10, 572912. [Google Scholar] [CrossRef]
  63. Wang, M.; Zhu, Z.; Lin, X.; Li, H.; Wen, C.; Bao, J.; He, Z. Gut microbiota mediated the therapeutic efficacies and the side effects of prednisone in the treatment of MRL/lpr mice. Arthritis Res. Ther. 2021, 23, 240. [Google Scholar] [CrossRef]
  64. Ikizler, T.A.; Coates, P.T.; Rovin, B.H.; Ronco, P. Immune response to SARS-CoV-2 infection and vaccination in patients receiving kidney replacement therapy. Kidney Int. 2021, 99, 1275–1279. [Google Scholar] [CrossRef] [PubMed] [PubMed Central]
  65. Hsu, C.M.; Weiner, D.E.; Manley, H.J.; Aweh, G.N.; Ladik, V.; Frament, J.; Miskulin, D.; Argyropoulos, C.; Abreo, K.; Chin, A.; et al. Seroresponse to SARS-CoV-2 Vaccines among Maintenance Dialysis Patients over 6 Months. Clin. J. Am. Soc. Nephrol. CJASN 2022, 17, 403–413. [Google Scholar] [CrossRef] [PubMed] [PubMed Central]
  66. Swai, J.; Gui, M.; Long, M.; Wei, Z.; Hu, Z.; Liu, S. Humoral and cellular immune response to severe acute respiratory syndrome coronavirus-2 vaccination in haemodialysis and kidney transplant patients. Nephrology 2022, 27, 7–24. [Google Scholar] [CrossRef] [PubMed] [PubMed Central]
  67. Perkins, G.B.; Tunbridge, M.; Salehi, T.; Chai, C.S.; Kireta, S.; Johnston, J.; Penko, D.; Nitschke, J.; Yeow, A.E.L.; Al-Delfi, Z.; et al. Concurrent vaccination of kidney transplant recipients and close household cohabitants against COVID-19. Kidney Int. 2022, 101, 1077–1080. [Google Scholar] [CrossRef] [PubMed] [PubMed Central]
  68. Perkins, G.B.; Tunbridge, M.J.; Chai, C.S.; Hope, C.M.; Yeow, A.E.L.; Salehi, T.; Singer, J.; Shi, B.; Masavuli, M.G.; Mekonnen, Z.A.; et al. Mechanistic Target of Rapamycin Inhibitors and Vaccine Response in Kidney Transplant Recipients. J. Am. Soc. Nephrol. JASN 2025, 36, 2213–2227. [Google Scholar] [CrossRef] [PubMed] [PubMed Central]
Figure 1. Study design.
Vaccines 14 00358 g001
Figure 2. Uraemic toxin concentrations according to vaccine response status. Uraemic toxin concentrations are shown for participants stratified by responder status. Differences between responders and non-responders are illustrated for each measured toxin. Values represent individual measurements with group-level distributions displayed.
Vaccines 14 00358 g002
Figure 3. Clustering of participants based on toxin profiles. Heatmap showing relative toxin abundance across participants following unsupervised clustering. Individuals were grouped into three clusters representing distinct toxin burden profiles. Colours indicate scaled toxin levels ranging from low (blue) to high (red). Rows represent individual participants and columns represent toxins.
Vaccines 14 00358 g003
Figure 4. (a) Relative abundance of gut microbial taxa according to responder status and circulating uraemic toxin concentrations. (b) Alpha diversity between vaccine responders and uraemic toxin burden, * p < 0.05. (c) Beta diversity by (i) vaccine responder status and (ii) uraemic toxin burden.
Vaccines 14 00358 g004aVaccines 14 00358 g004b
Figure 5. Differential abundance of gut microbial taxa between (a) vaccine responder status and (b) uraemic toxin burden. Labelled taxa above the horizontal dashed line achieved unadjusted p-values < 0.05, and taxa in yellow remained significant after false discovery rate correction (FDR-adjusted p-value < 0.05).
Vaccines 14 00358 g005aVaccines 14 00358 g005b
Figure 6. Spearman correlation heatmap of top 40 most abundant genera and associations with clinical and biochemical variables. The strength and direction of correlations varied across taxa, with significance thresholds denoted as p < 0.05 (*), p < 0.01 (**), and p < 0.001 (***).
Vaccines 14 00358 g006
Figure 7. PERMANOVA explained variance (Bray–Curtis distance). Biochemical, clinical, medication and uraemic toxin variables associated with inter-individual variation in gut microbial composition. Bars represent the proportion of variance (R2) explained by each variable, and red bars denote those significantly associated with beta diversity (p < 0.05).
Vaccines 14 00358 g007
Table 1. Baseline characteristics by SARS-CoV-2 vaccine response status.
Responder
N = 27
n (%)
Non-Responder
N = 13
n (%)
p Value
Age (median, IQR)65 (26–87)66 (48–81)0.94
Male15 (56)8 (62)0.72
Race/ethnicity 0.51
Aboriginal6 (22)1 (8)
Black1 (4)0
Caucasian/white13 (48)10 (77)
Asian3 (11)1 (8)
North African/Middle Eastern4 (15)1 (8)
Smoker3 (12)1 (8)0.65
Cause of kidney failure 0.04
Diabetes11 (41)5 (38)1.00
Hypertension/vascular5 (19)00.15
Polycystic kidney disease1 (4) 2 (15)0.24
Glomerulonephritis2 (7)5 (38)0.03
Other ^2 (7)1 (8)1.00
Unknown6 (22)00.08
Vascular access 0.31
AV fistula20 (74)8 (62)
AV graft01 (8)
Vascular catheter7 (26)4 (31)
Vaccine 0.85
Pfizer20 (74)10 (77)
AZ7 (26)3 (23)
Comorbidity
Diabetes13 (48)6 (46)0.91
Hypertension19 (70)8 (62)0.58
Peripheral Vascular Disease6 (22)2 (15)0.61
Cardiac disease14 (52)8 (62)0.56
Ischaemic heart disease9 (33)5 (38)0.75
Valvular heart disease0 0
Cardiomyopathy1 (4)1 (8)0.59
Cancer3 (11)1 (8)0.74
Gout2 (7)4 (31)0.05
Gastrointestinal bleeding3 (11)00.21
Gastrointestinal reflux disease3 (11)2 (15)0.70
Dyslipidaemia5 (19)6 (46)0.07
Medications
Antibiotics3 (11)5 (38)0.04
Phosphate binders17 (63)4 (31)0.06
Potassium-binding resin3 (11)3 (23)0.32
Iron (intravenous)18 (67)7 (54)0.43
Erythropoietin22 (81)12 (92)0.37
Proton pump inhibitor10 (37)5 (38)0.93
ARB/ACEi **6 (22)2 (15)0.61
Statin10 (37)8 (62)0.14
Calcitriol12 (44)4 (31)0.41
Caltrate10 (37)4 (31)0.70
Insulin4 (15)4 (31)0.24
Aspirin9 (33)8 (62)0.09
Cinacalcet4 (15)3 (23)0.52
Immunosuppression
Prednisone1 (4)5(38)0.004
Azathioprine01 (8)0.14
^ Other: Lithium toxicity, myeloma, scleroderma, multifactorial (calculi, hypertension); ** ARB, angiotensin receptor blocker, ACEi, angiotensin converting enzyme inhibitor.
Table 2. Uraemic toxin concentrations and total toxin burden by vaccine response.
ToxinReference Range (μmol/L) [32,36]Responders
(n = 27)
Non-Responders (n = 13)p-Value
Free PCS (µmol/L), median (IQR)0.14–2.4410.3 (3.9–17.6)10.6 (7.0–16.6)0.68
Total PCS (µmol/L) 1, mean (±SD)0.0–38.4175.7 ± 99.5182.8 ± 77.00.91
Free IS (µmol/L), median (IQR)0.0–0.197.4 (3.2–12.7)4.1 (2.1–25.1)0.77
Total IS (µmol/L), median (IQR)0.70–6.30109 (58–147)72 (48–262)0.78
Total TMAO (µmol/L), median (IQR)1.28–19.6767 (46–104)81 (45–111)0.85
Total toxin burden (µmol/L), median (IQR) 386 (228–468)360 (260–526)0.74
1 Normally distributed; data are presented as mean ± SD and compared using an independent-samples t-test. All other variables are presented as median (interquartile range, Q1–Q3) and compared using the Mann–Whitney U test.
Disclaimer/Publisher’s Note: The statements, opinions and data contained in all publications are solely those of the individual author(s) and contributor(s) and not of MDPI and/or the editor(s). MDPI and/or the editor(s) disclaim responsibility for any injury to people or property resulting from any ideas, methods, instructions or products referred to in the content.