
Article

COVID-19 Vaccine Effectiveness Against Mortality in the Omicron Period: Evidence from Linked Mortality and Vaccination Records

1
Pritzker School of Law, Northwestern University, Chicago, IL 60611, USA
2
Center for Biomedical Informatics, Regenstrief Institute, Indianapolis, IN 46202, USA
3
Department of Health Policy and Management, Milken Institute School of Public Health, George Washington University, Washington, DC 20053, USA
4
Department of Medicine, Medical College of Wisconsin, Milwaukee, WI 53226, USA
5
Department of Emergency Medicine, Medical College of Wisconsin, Milwaukee, WI 53226, USA
6
Levin College of Law, University of Florida, Gainesville, FL 32611, USA
7
Raymond A. Mason School of Business, William & Mary, Williamsburg, VA 23185, USA
*
Author to whom correspondence should be addressed.
Vaccines 2025, 13(12), 1235; https://doi.org/10.3390/vaccines13121235
Submission received: 5 November 2025 / Revised: 5 December 2025 / Accepted: 9 December 2025 / Published: 11 December 2025

Abstract

Objective: This study aimed to assess COVID-19 vaccine effectiveness against death (VE), controlling for healthy vaccinee bias. Methods: We link all adult deaths through year-end 2022 in the State of Indiana, U.S.A., to vaccination records and identify which deceased received primary vaccination (measured as either one or two initial doses) and which received one or two booster doses. We measure COVID-19 mortality with the COVID Excess Mortality Percentage (CEMP). CEMP is calculated, for a group defined by various characteristics (age, sex, time period), as COVID-19 deaths divided by non-COVID natural deaths. The CEMP outcome measure accounts for healthy vaccinee bias by using non-COVID natural mortality to control for differences in population health. Results: We find a large healthy vaccinee bias. Controlling for this bias, we find substantial VE for primary vaccination and the first booster dose during the first five vaccine-available calendar quarters, from 1Q2021 through 1Q2022 (end of Omicron infection wave). However, over 2Q–4Q2022, we find no evidence for primary-vaccination VE, and find moderate but statistically insignificant booster VE, which largely wanes by 4Q2022. Conclusions: It is known that by 2Q2022, most people had natural immunity from prior COVID-19 infection. Thus, our results for 2Q–4Q2022 largely reflect comparing hybrid (infection plus vaccination) immunity to infection-only immunity. In this period, we find negligible mortality benefit from primary vaccination, and moderate but waning benefit from a booster dose. Policy Implications: Controlling for healthy vaccinee bias is crucial when estimating VE. We found limited VE against COVID-19 mortality over 2Q–4Q2022, but lacked data for more recent periods.

1. Introduction

COVID-19 vaccination has markedly reduced COVID-19 mortality and prevented millions of deaths worldwide [1,2,3]. However, after the Omicron variant infection wave in the first quarter (1Q) of 2022, many people, especially unvaccinated persons, have been infected, often multiple times. Prior infection can produce a durable immune response against severe outcomes (hospitalization or death) [4,5]. This raises the question—how effective are primary vaccination (which we measure as either one or two initial doses) and booster doses against mortality in the post-Omicron-wave environment? We address this question using linked vaccination and mortality data from Indiana during the calendar years 2021 and 2022.
Numerous studies have examined COVID-19 vaccine effectiveness (VE) [6,7]. However, most vaccinated persons chose to be vaccinated, so these estimates are subject to selection bias. A key concern that is either not addressed at all or not well-addressed in most studies is healthy vaccinee bias (HVB)—the tendency for healthier individuals to be more likely to be vaccinated [8,9,10,11]. If HVB is not addressed, VE against serious disease and death will be overestimated because better outcomes among vaccinees will partly reflect their better underlying health [9,12].
Among prior studies of VE against mortality, many include only limited adjustment for individual characteristics, often only age and sex [13,14,15,16], or cover relatively short time periods [13,17,18,19]. Most U.S.-based analyses do not have access to population-level data [15,20,21,22,23], and studies with population data often have limited information on underlying health [16,24]. Many studies rely on a test-negative design [17,21,22]. However, the test-negative design relies on strong assumptions and can be vulnerable to selection bias when these assumptions are not satisfied [25,26].
In this study, we focus on VE against mortality. We use a novel method for evaluating VE against mortality that controls for HVB. This approach was used and validated in our prior work [27,28,29]. We use non-COVID natural mortality rates for groups defined by age and vaccination status to proxy for the underlying health of those groups. We use as an outcome measure, the COVID-19 Excess Mortality Percentage (CEMP), defined as COVID-19 deaths divided by non-COVID natural deaths, converted to a percentage. The idea behind this measure is that the CEMP denominator controls for health differences between two groups, such as vaccinated versus unvaccinated. We study primary vaccination (one or two doses) and the first and second booster doses.
We provide evidence on HVB, measure its magnitude, and validate the CEMP measure as a means of controlling for this bias. We then use CEMP as an outcome and measure the relative mortality risk of vaccinated versus unvaccinated persons (RMR) for Indiana over January 2021 through December 2022.

2. Data, Methods, and Sources of Potential Bias

2.1. Data and Basic Assumptions

We used vaccination data from the Indiana Health Information Exchange (IHIE) for all Indiana residents aged 15 years and older (N = 5,460,000), of whom 3,826,000 (70.1%) received at least one COVID-19 vaccine dose. The vaccination data were linked to death certificate data, which contain information on age at death, the decedent’s five-digit home ZIP code, manner of death, both ICD-10 codes and text fields for underlying cause of death and contributing conditions, sex, race/ethnicity, education, income, and marital and veteran status. Further sample details are in Supplementary Figure S1.
We categorized race/ethnicity into four groups: non-Hispanic White (“White”), Black, non-Black Hispanic (“Hispanic”), and Other (including Asian, Native American, and mixed-race people). Area socioeconomic status (“SES”) was measured using the Graham Social Deprivation Index [30,31]. We used U.S. Census population estimates for Indiana as of 1 July 2020 to obtain counts of vaccinated persons in groups defined by age, sex, race/ethnicity, and SES. For each group, we estimated the number of unvaccinated persons as the Census population estimate minus the number of vaccinated persons. COVID-19 deaths were identified using the text fields for cause of death; counts were very similar when using ICD-10 codes derived from these text fields (Supplementary Table S1).
In estimating VE, we moved vaccination dates forward by 30 days. So, if a person received a first vaccine dose on day t, we treated this person as vaccinated beginning on day t + 30, and the same applied to additional doses. This 30-day lag was used to allow time (roughly 1–2 weeks) for a vaccine dose to become fully effective, plus a typical 2–3 week lag between infection and death; the 30-day lag also controls for the tendency for very sick people and people near the end of life to not become vaccinated (Supplementary Figure S13). We counted persons vaccinated with a given number of doses as of the 1st of each month, allowing for this lag. Our results are not sensitive to the lag period. See Supplementary Part VIII. We excluded immunocompromised decedents.

2.2. Variables and Regression Methods

We define CEMP for persons with x doses (CEMPx), the relative mortality risk of vaccinees versus unvaccinated persons (“RMR”), and vaccine effectiveness (VE) as
C E M P x = 100   * C O V I D   d e a t h s x n o n C O V I D   n a t u r a l   d e a t h s x
R M R x , u n v a x C E M P = C E M P x   C E M P u n v a x V E x , u n v a x C E M P = 1 R M R x , u n v a x C E M P
RMR of 0 implies perfect vaccine protection; RMR of 1.0 implies no protection. RMR greater than one would imply that vaccination causes harm (i.e., higher mortality among the vaccinated than among the unvaccinated).” R M R x , u n v a x C E M P can be obtained by comparing CEMP ratios for two groups, or equivalently, as an odds ratio from logistic regression for a sample of decedents containing both groups. Note that these measures rely on absolute counts of deaths from COVID-19 versus other natural causes, within population groups defined by vaccination status. They do not depend on the accuracy of population estimates and thus do not depend on the precision of estimated mortality rates.
It is also useful to define a measure of healthy vaccinee bias. Let NCNMRx denote the non-COVID natural mortality rate for the group with x vaccine doses:
N C N M R x = n o n C O V I D   n a t u r a l   d e a t h s x P o p x
Then, define a healthy vaccinee bias correction factor (“HVBCF”) such that if healthier people are more likely to be vaccinated, 0 ≤ HVBCF < 1. Conversely, if less healthy people are more likely to be vaccinated, then HVBCF > 1. A value for the correction factor of 1 indicates no bias in either direction. Lower values of HVBCF, approaching zero, indicate progressively greater degrees of bias. If vaccinated people are healthier than unvaccinated people, they will have lower NCNMR rates:
H V B C F x , u n v a x = N C N M R x N C N M R u n v a x
This measure is valid under the assumption that COVID-19 vaccination does not substantially change non-COVID natural mortality.
One can also define an RMRraw measure, based on raw COVID-19 mortality rates (COVIDMR), which is not adjusted for healthy vaccinee bias.
R M R x , u n v a x r a w = C O V I D M R x C O V I D M R u n v a x
RMRCEMP, RMRraw, and HVBCF are related; see Supplementary Material for derivation:
R M R x , u n v a x C E M P = R M R x , u n v a x r a w H V B C F x , u n v a x

2.3. Confidence Intervals for RMR and Multivariate Logistic Regression

In a sample of persons who died of natural causes, CEMP equals the odds that the cause of death is COVID-19 versus another natural cause. R M R x , u n v a x C E M P compares vaccinated to unvaccinated persons by taking the ratio of their CEMPs. It is thus an odds ratio. RMR can be obtained algebraically as above and can also be obtained by logistic regression applied to a sample of decedents. We obtained 95% confidence intervals (CIs) for RMRCEMP using logistic regression, on groups of decedents defined by age and vaccination status. See Supplementary Material for computation of CIs for HVBCF.
We also conducted a multivariate logistic estimation of R M R x , u n v a x C E M P , in which we adjusted for other predictors of mortality risk, available from death certificates: age, age2, sex, race/ethnicity, education level, marital status, and area-SES. See Supplementary Part IX for details.

2.4. Validating the CEMP Approach

CEMP uses NCNMR as a proxy for the underlying health of a group and, hence, for its baseline mortality risk if unvaccinated. We assessed the validity of this approach by measuring the correlation of natural mortality in April–December 2019 (pre-COVID) and COVID-19 mortality during the same months in 2020—during the COVID-19 period, but before COVID-19 vaccines were available in the United States. We compared COVID-19 mortality in the 2020 period to natural mortality in the pre-COVID 2019 period for population groups defined by age, sex, race/ethnicity, and socioeconomic status.

2.5. Counting Vaccine Doses

IHIE matches vaccinees across different numbers of doses and matches vaccinees to death records. We do not have access to their matching algorithm. We see some evidence in the data that, for about 1–2% of reported vaccinees, IHIE treats two vaccinated people as a single “person.” In Supplementary Part III, we develop rules to estimate the number of doses received by an actual person.

2.6. Possible Sources of Bias

National studies indicate that deaths directly or indirectly due to COVID-19 are somewhat under-recorded in death records [32,33]. In Indiana, we also see indications of undercounting (Supplementary Figure S5). Undercounting of COVID-19 deaths will lead CEMP values to be understated. However, RMRCEMP estimates will be biased only if the degree of undercounting differs between vaccinated and unvaccinated people. We cannot test this possibility with our data, but we have no reason to expect differential undercounting.
Second, bias will arise if IHIE undercounts vaccinee deaths by not fully matching them to mortality records. We observed apparent undercounting over August–October 2021 (Supplementary Part IV). If IHIE undercounts vaccinee deaths, it must overcount deaths of unvaccinated persons. If vaccination reduces COVID-19 mortality, then the overcounted deaths of unvaccinated persons will disproportionately involve non-COVID causes. This will cause us to underestimate CEMPunvax and therefore overestimate R M R v a x , u n v a x C E M P = C E M P v a x   C E M P u n v a x .
We address this issue as follows. To estimate monthly death counts for August through October 2021, we interpolated death counts for vaccinated decedents between July and November 2021. We assume, as seems plausible, that the percentage undercount was similar for COVID-19 and other natural deaths; if so, the undercounting will not affect CEMPvax. We also know CEMP for the full population (vaccinated and unvaccinated), from mortality records; overall, CEMP is a mortality-weighted average of CEMPvax and CEMPunvax. This is sufficient to let us algebraically compute CEMPunvax and thus R M R v a x , u n v a x C E M P . See Supplementary Material for details. The adjustments are small but visible in graphs for 3Q2021, and nearly invisible for 4Q2021. Our reported results use adjusted RMRCEMP for these two quarters; Supplementary Figure S7 shows both raw and adjusted values.

3. Results

3.1. Validating the CEMP Measure

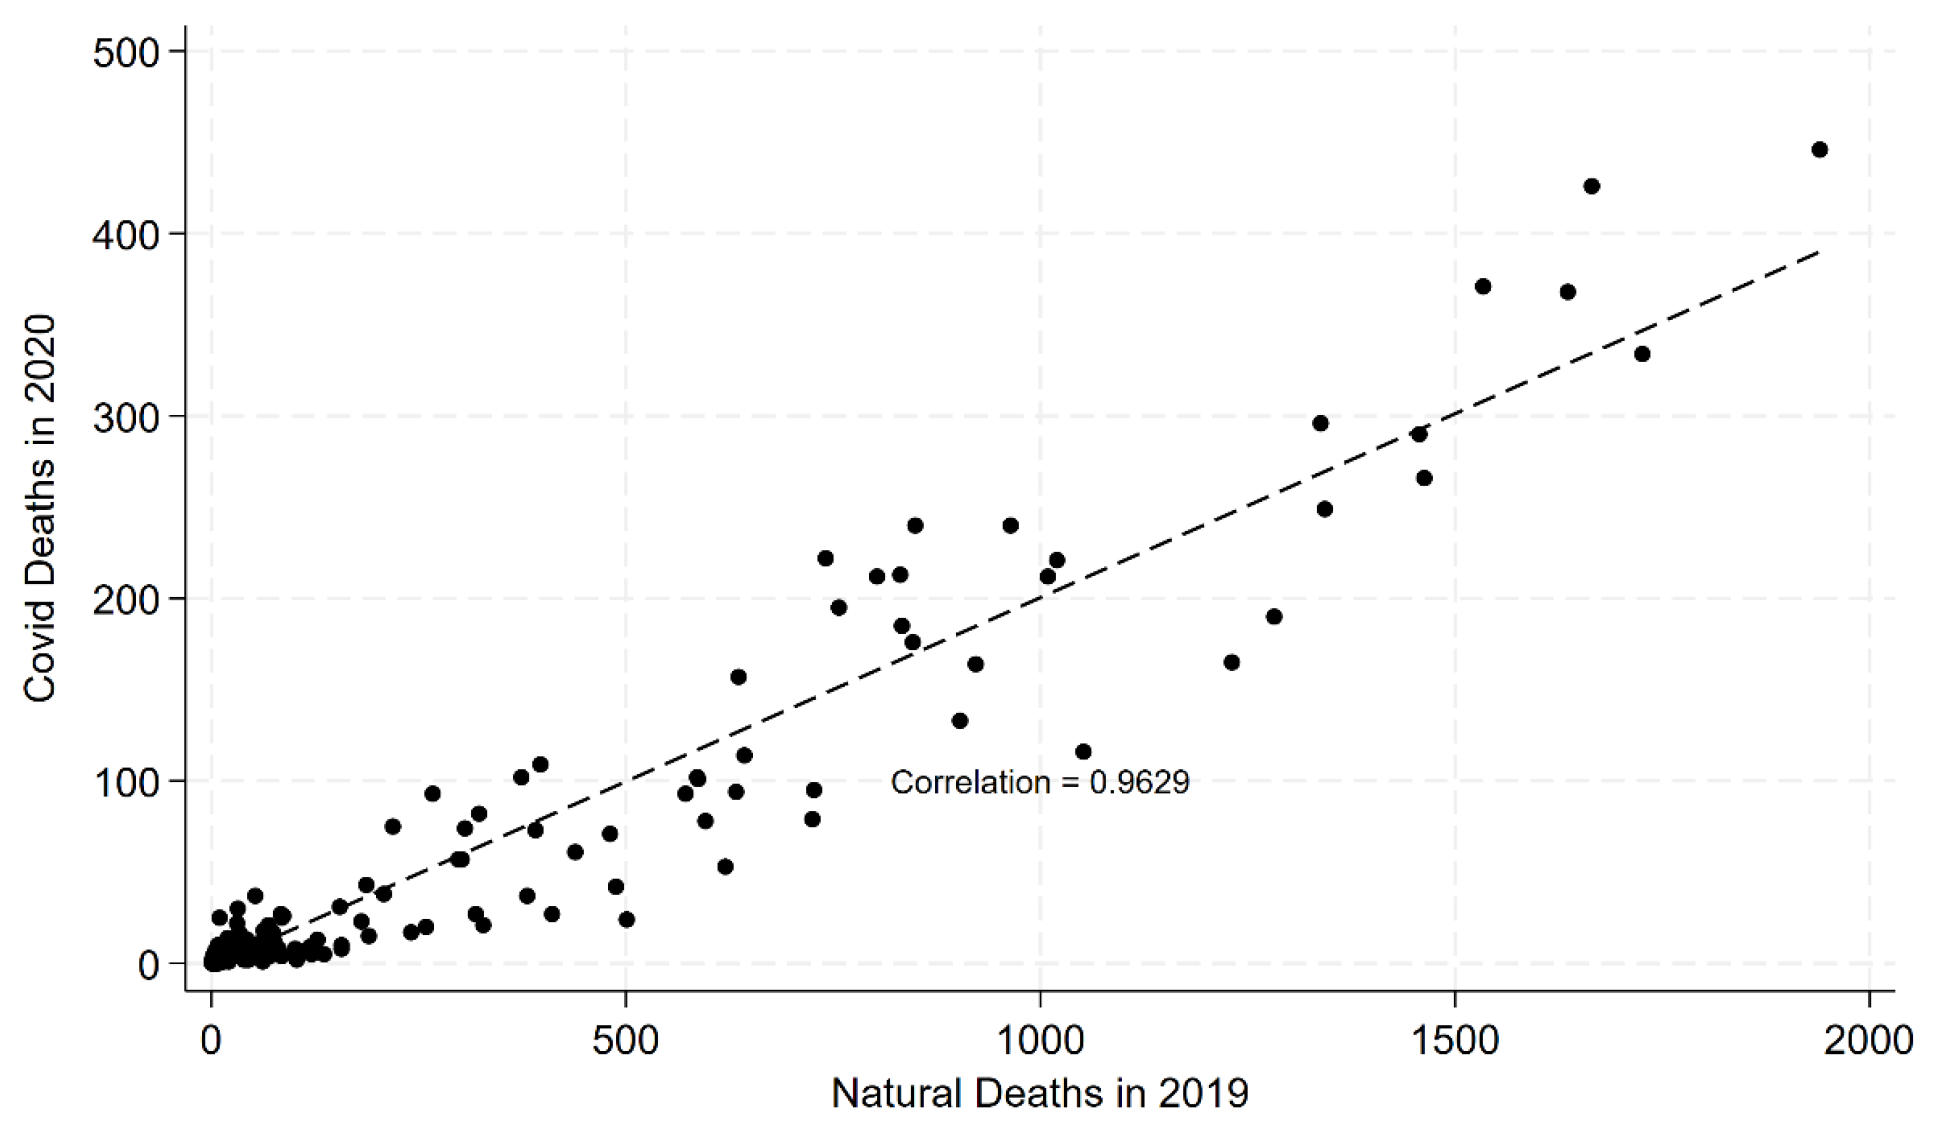
The CEMP measure uses group NCNMR as a proxy for underlying group health and, therefore, for group risk of COVID-19 death. This proxy requires empirical validation. Figure 1 plots, for Indiana, the number of natural deaths over April–December 2019 (pre-COVID) (x-axis) against COVID-19 mortality counts over the same months in April–December 2020 (COVID period, pre-vaccine) (y-axis), for groups defined by age (15–39, 40–49, 50–59, 60–69, 70–79, 80–89, 90+), sex, race/ethnicity, and area-SES quintile. The Pearson correlation coefficient is 0.963, indicating that non-COVID-19 natural mortality is a strong predictor of COVID-19 mortality among unvaccinated persons. Supplementary Figure S2 shows a similar correlation between natural mortality rates (instead of counts) over April–December 2019 and COVID-19 mortality rates over April–December 2020. In Supplementary Figure S3, we confirm that all-cause natural mortality in Indiana in 2019 is highly correlated with NCNMR in 2020 (r = 0.999).
Additional validation is provided by the multivariate logistic regression analysis discussed below. Within groups defined by age and time period, RMRCEMP estimates are very similar to the corresponding multivariate estimates. This similarity suggests that the simple CEMP measure adjusts effectively for underlying differences in population health.

3.2. Summary Statistics

Table 1 provides summary statistics by period over 2021–2022. Starting in 2Q 2022, COVID-19 deaths, and hence CEMP, declined sharply, whereas R M R v a x , u n v a x C E M P rose.
Supplementary Figure S4 plots vaccination rates over time. Overall, by year-end 2022, around 70% of Indiana residents aged 15+ received at least one dose (Supplementary Table S3), with higher rates for older persons. By year-end 2022, over 90% of people age 60+ were vaccinated, with most receiving a booster (Table 1).

3.3. Evidence for Healthy Vaccinee Bias

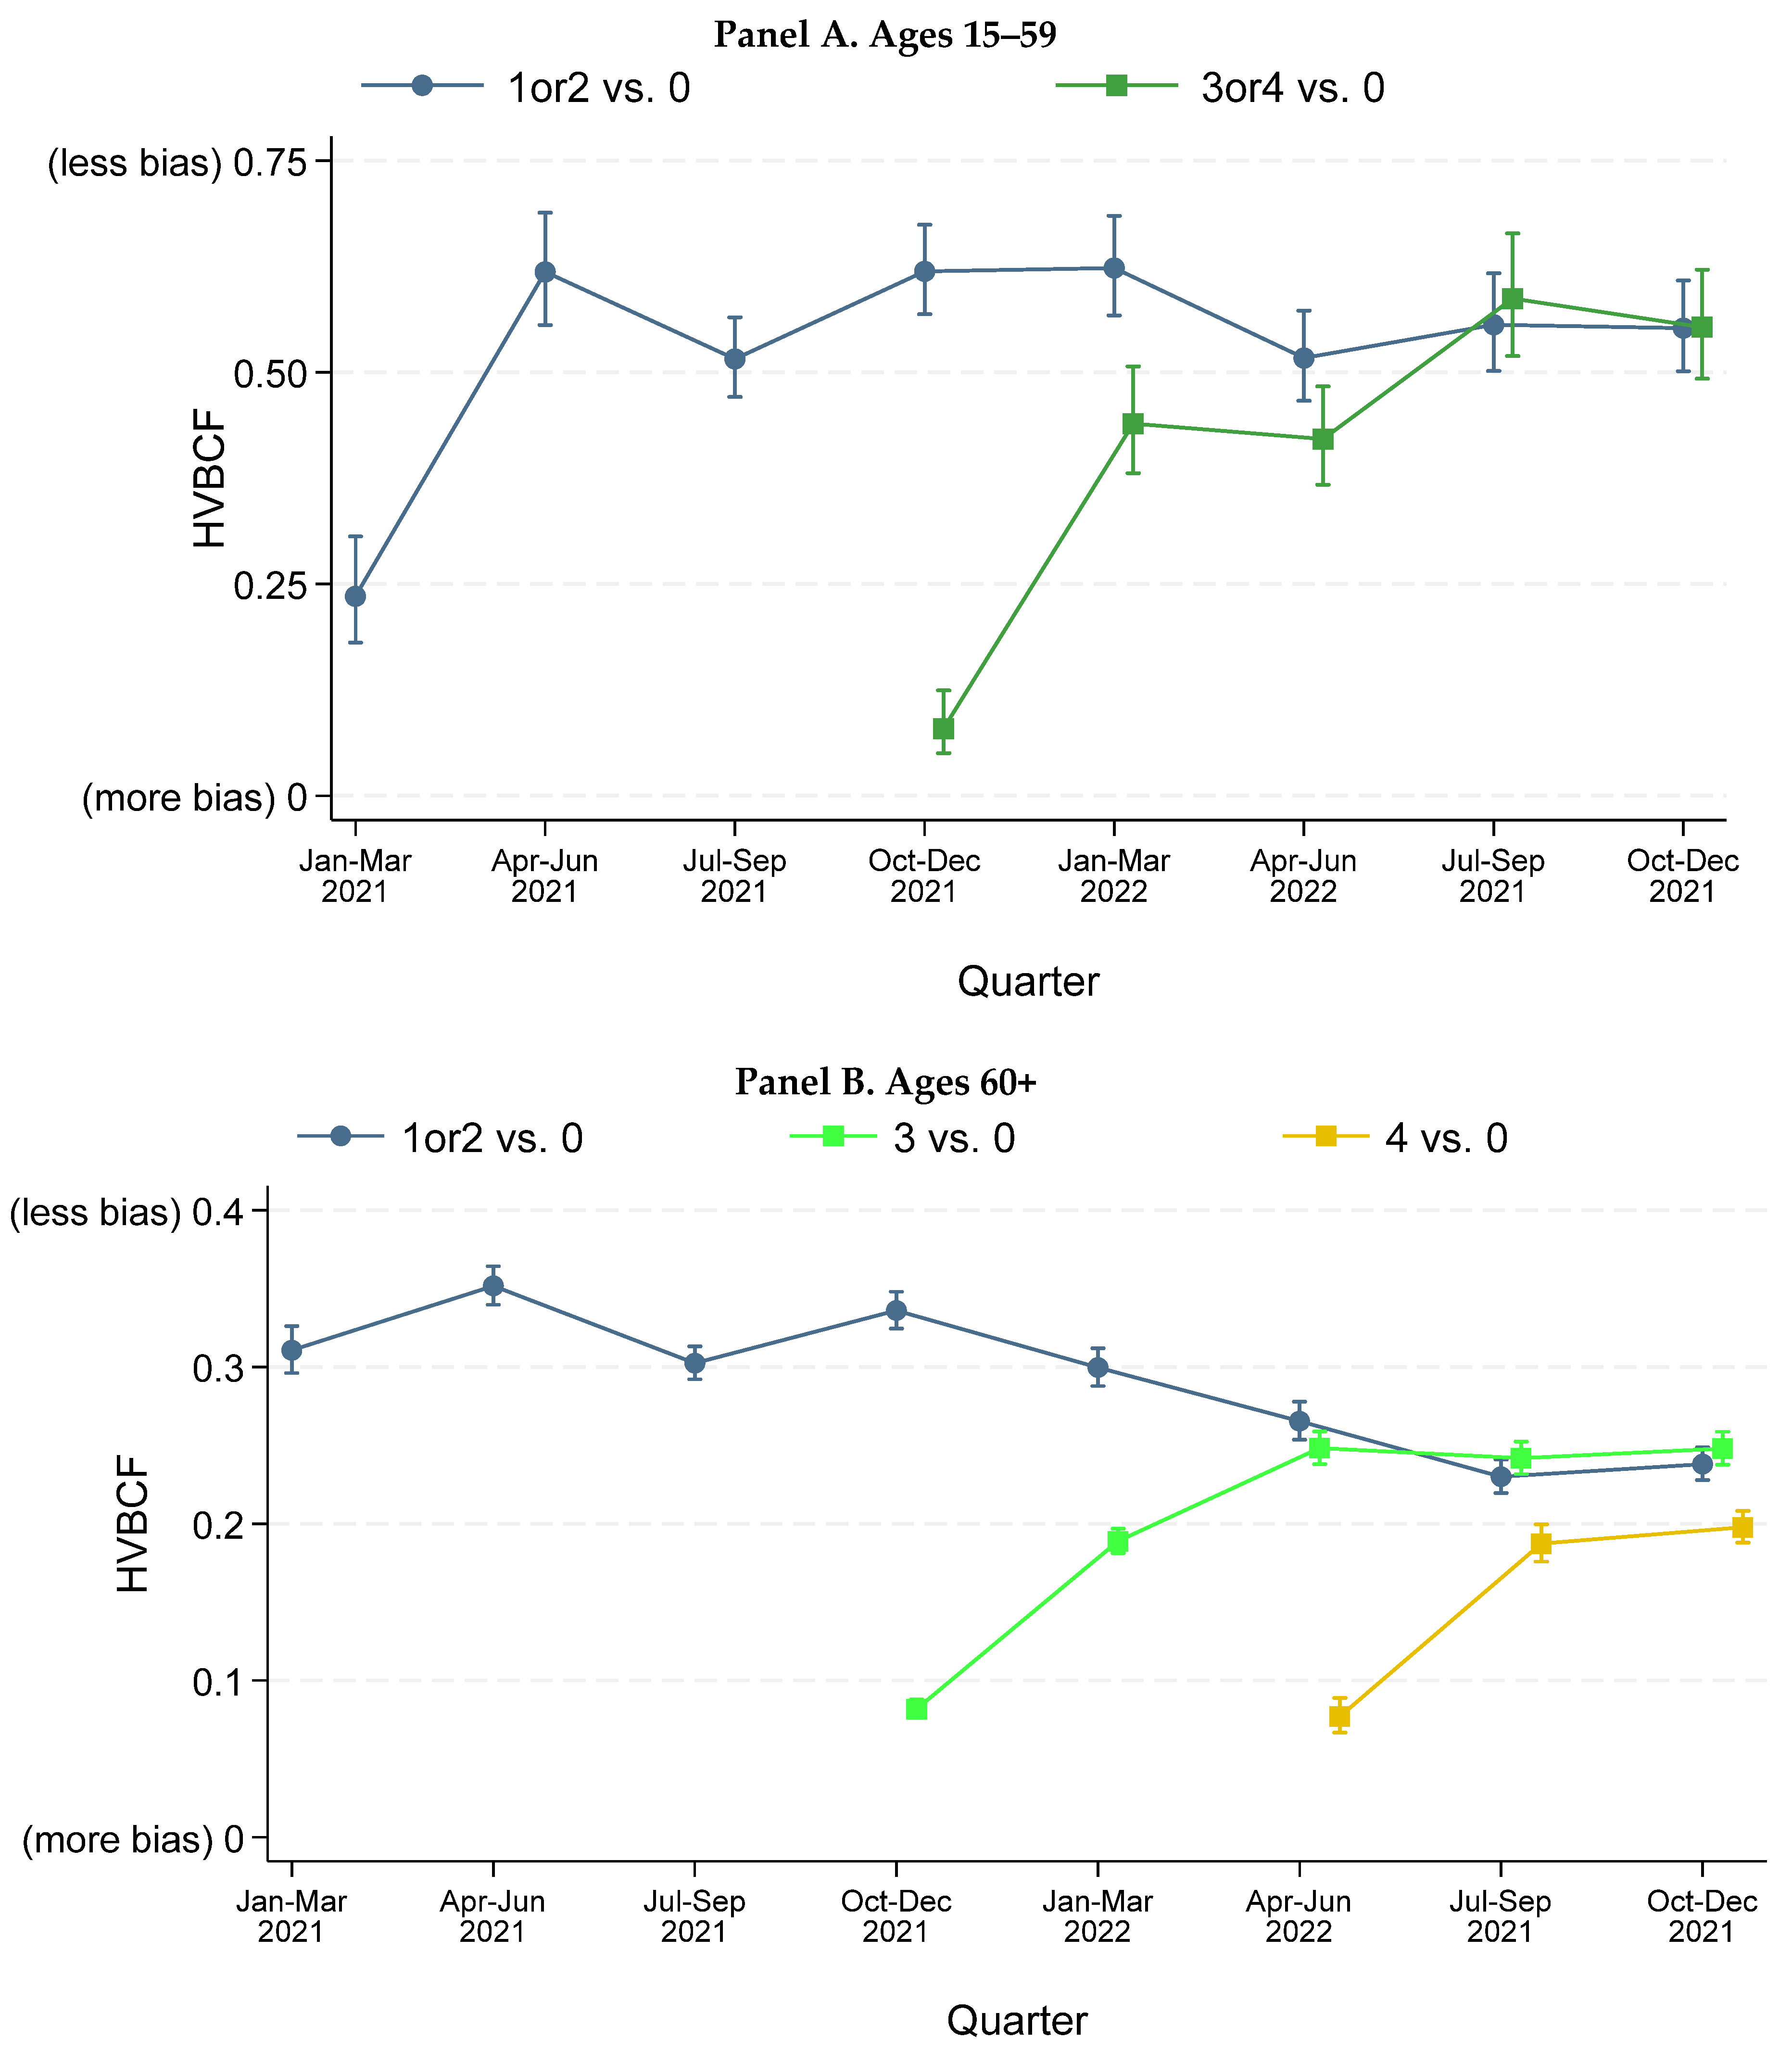
Figure 2 provides H V B C F x , u n v a x values for ages 15–59 and 60+. See Supplementary Figure S8 for finer age groups. Healthy vaccinee bias was substantial at all ages, with tight CIs for HVBCF. For ages 15–59, the HVB correction factor for primary vaccination versus unvaccinated ( H V B C F x , u n v a x ) was around 0.6 through 1Q2022, and declined slightly after that. These levels indicate that vaccinees had much better background health (lower risk of non-COVID natural mortality) than the unvaccinated. Healthy vaccinee bias is higher (HCBCF is lower) in the quarter when vaccination first becomes available, for both primary vaccination and booster doses.
Healthy vaccinee bias was more pronounced (HVBCF was lower) among adults aged 60+, who account for most COVID-19 deaths. H V B C F x , u n v a x for primary vaccination was around 0.3 for 1Q2021–1Q2022 and declined slightly thereafter. This decline is driven by ages 80+ (Supplementary Table S4). For ages 60+, the additional tendency for healthier people to get vaccinated in the first quarter when a vaccine dose becomes available is seen for booster doses, but not for primary vaccination. The magnitude of healthy vaccinee bias for persons receiving only primary vaccination versus those also receiving booster doses tends to converge over time.
Given healthy vaccinee bias at these levels, RMRraw will be well below RMRCEMP. RMRraw levels will suggest that vaccination is more effective against mortality than it actually is. This is especially true for booster doses, soon after they become available. Indeed, relying on RMRraw can imply that vaccination is effective against mortality, even if it is not. We observe this pattern of apparent but not actual effectiveness for primary vaccination for 2Q2022–4Q2022 (see Supplementary Figure S12).

3.4. RMRCEMP for Primary Vaccination

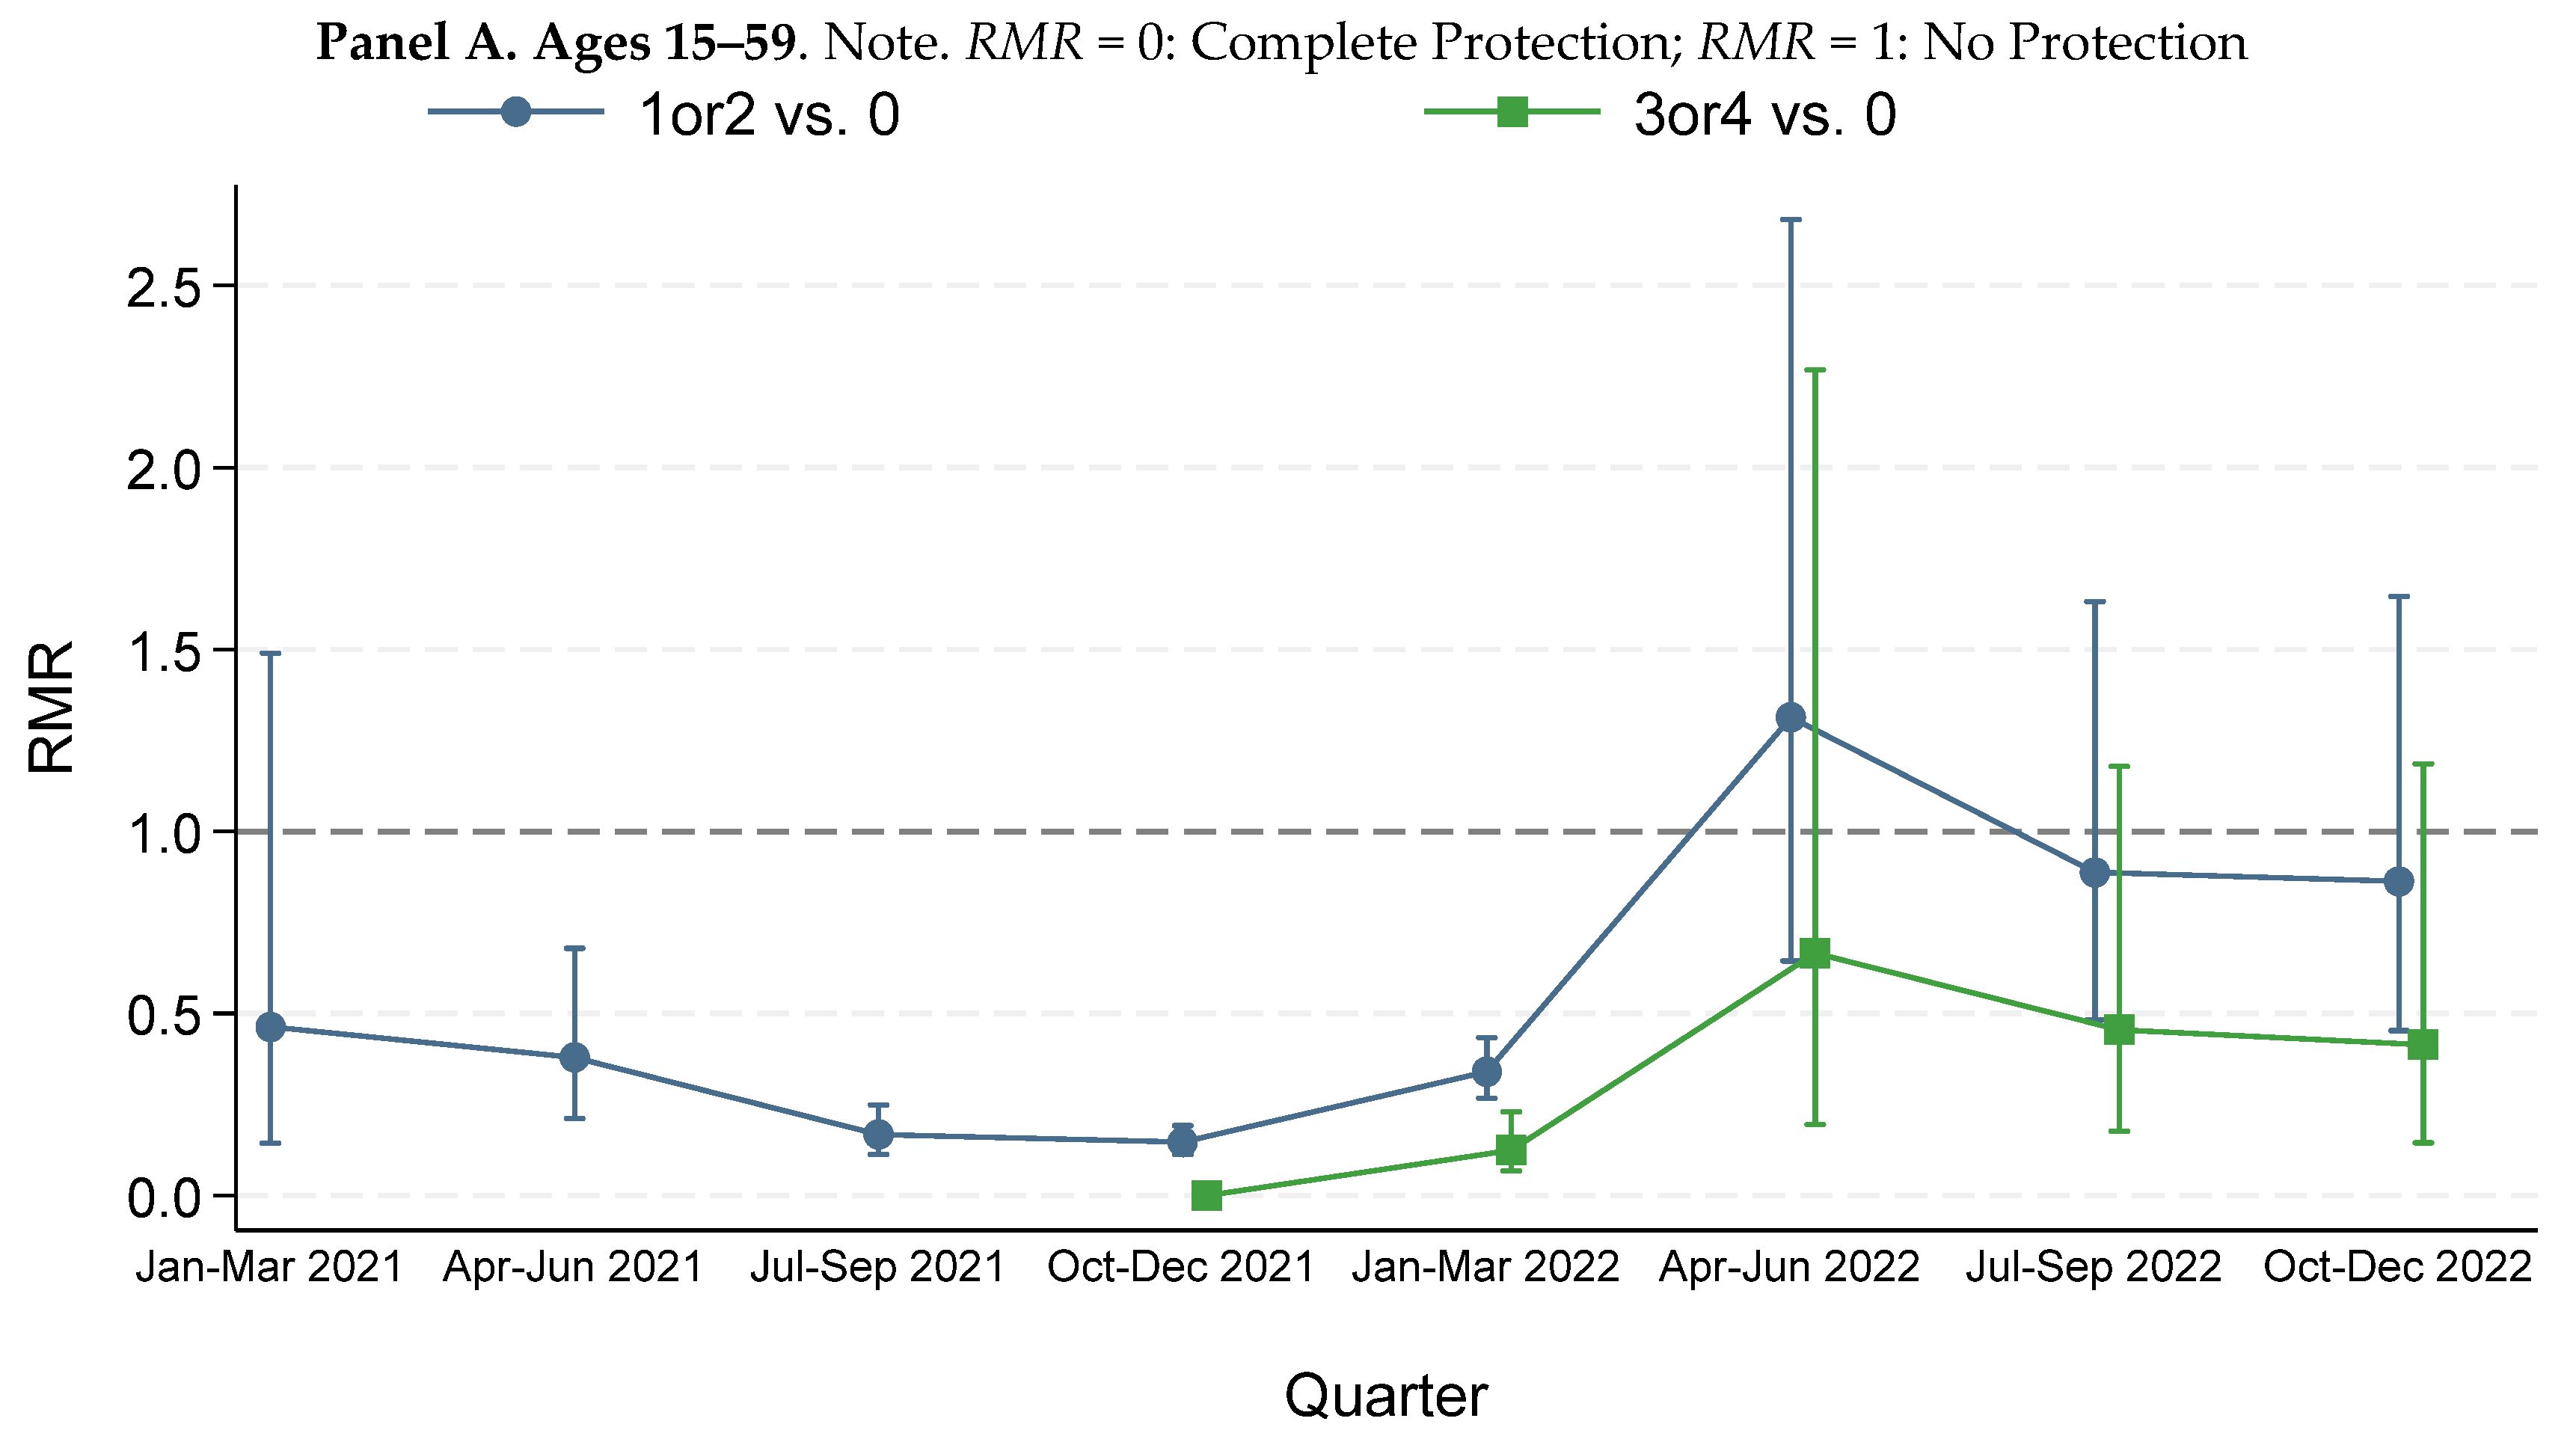
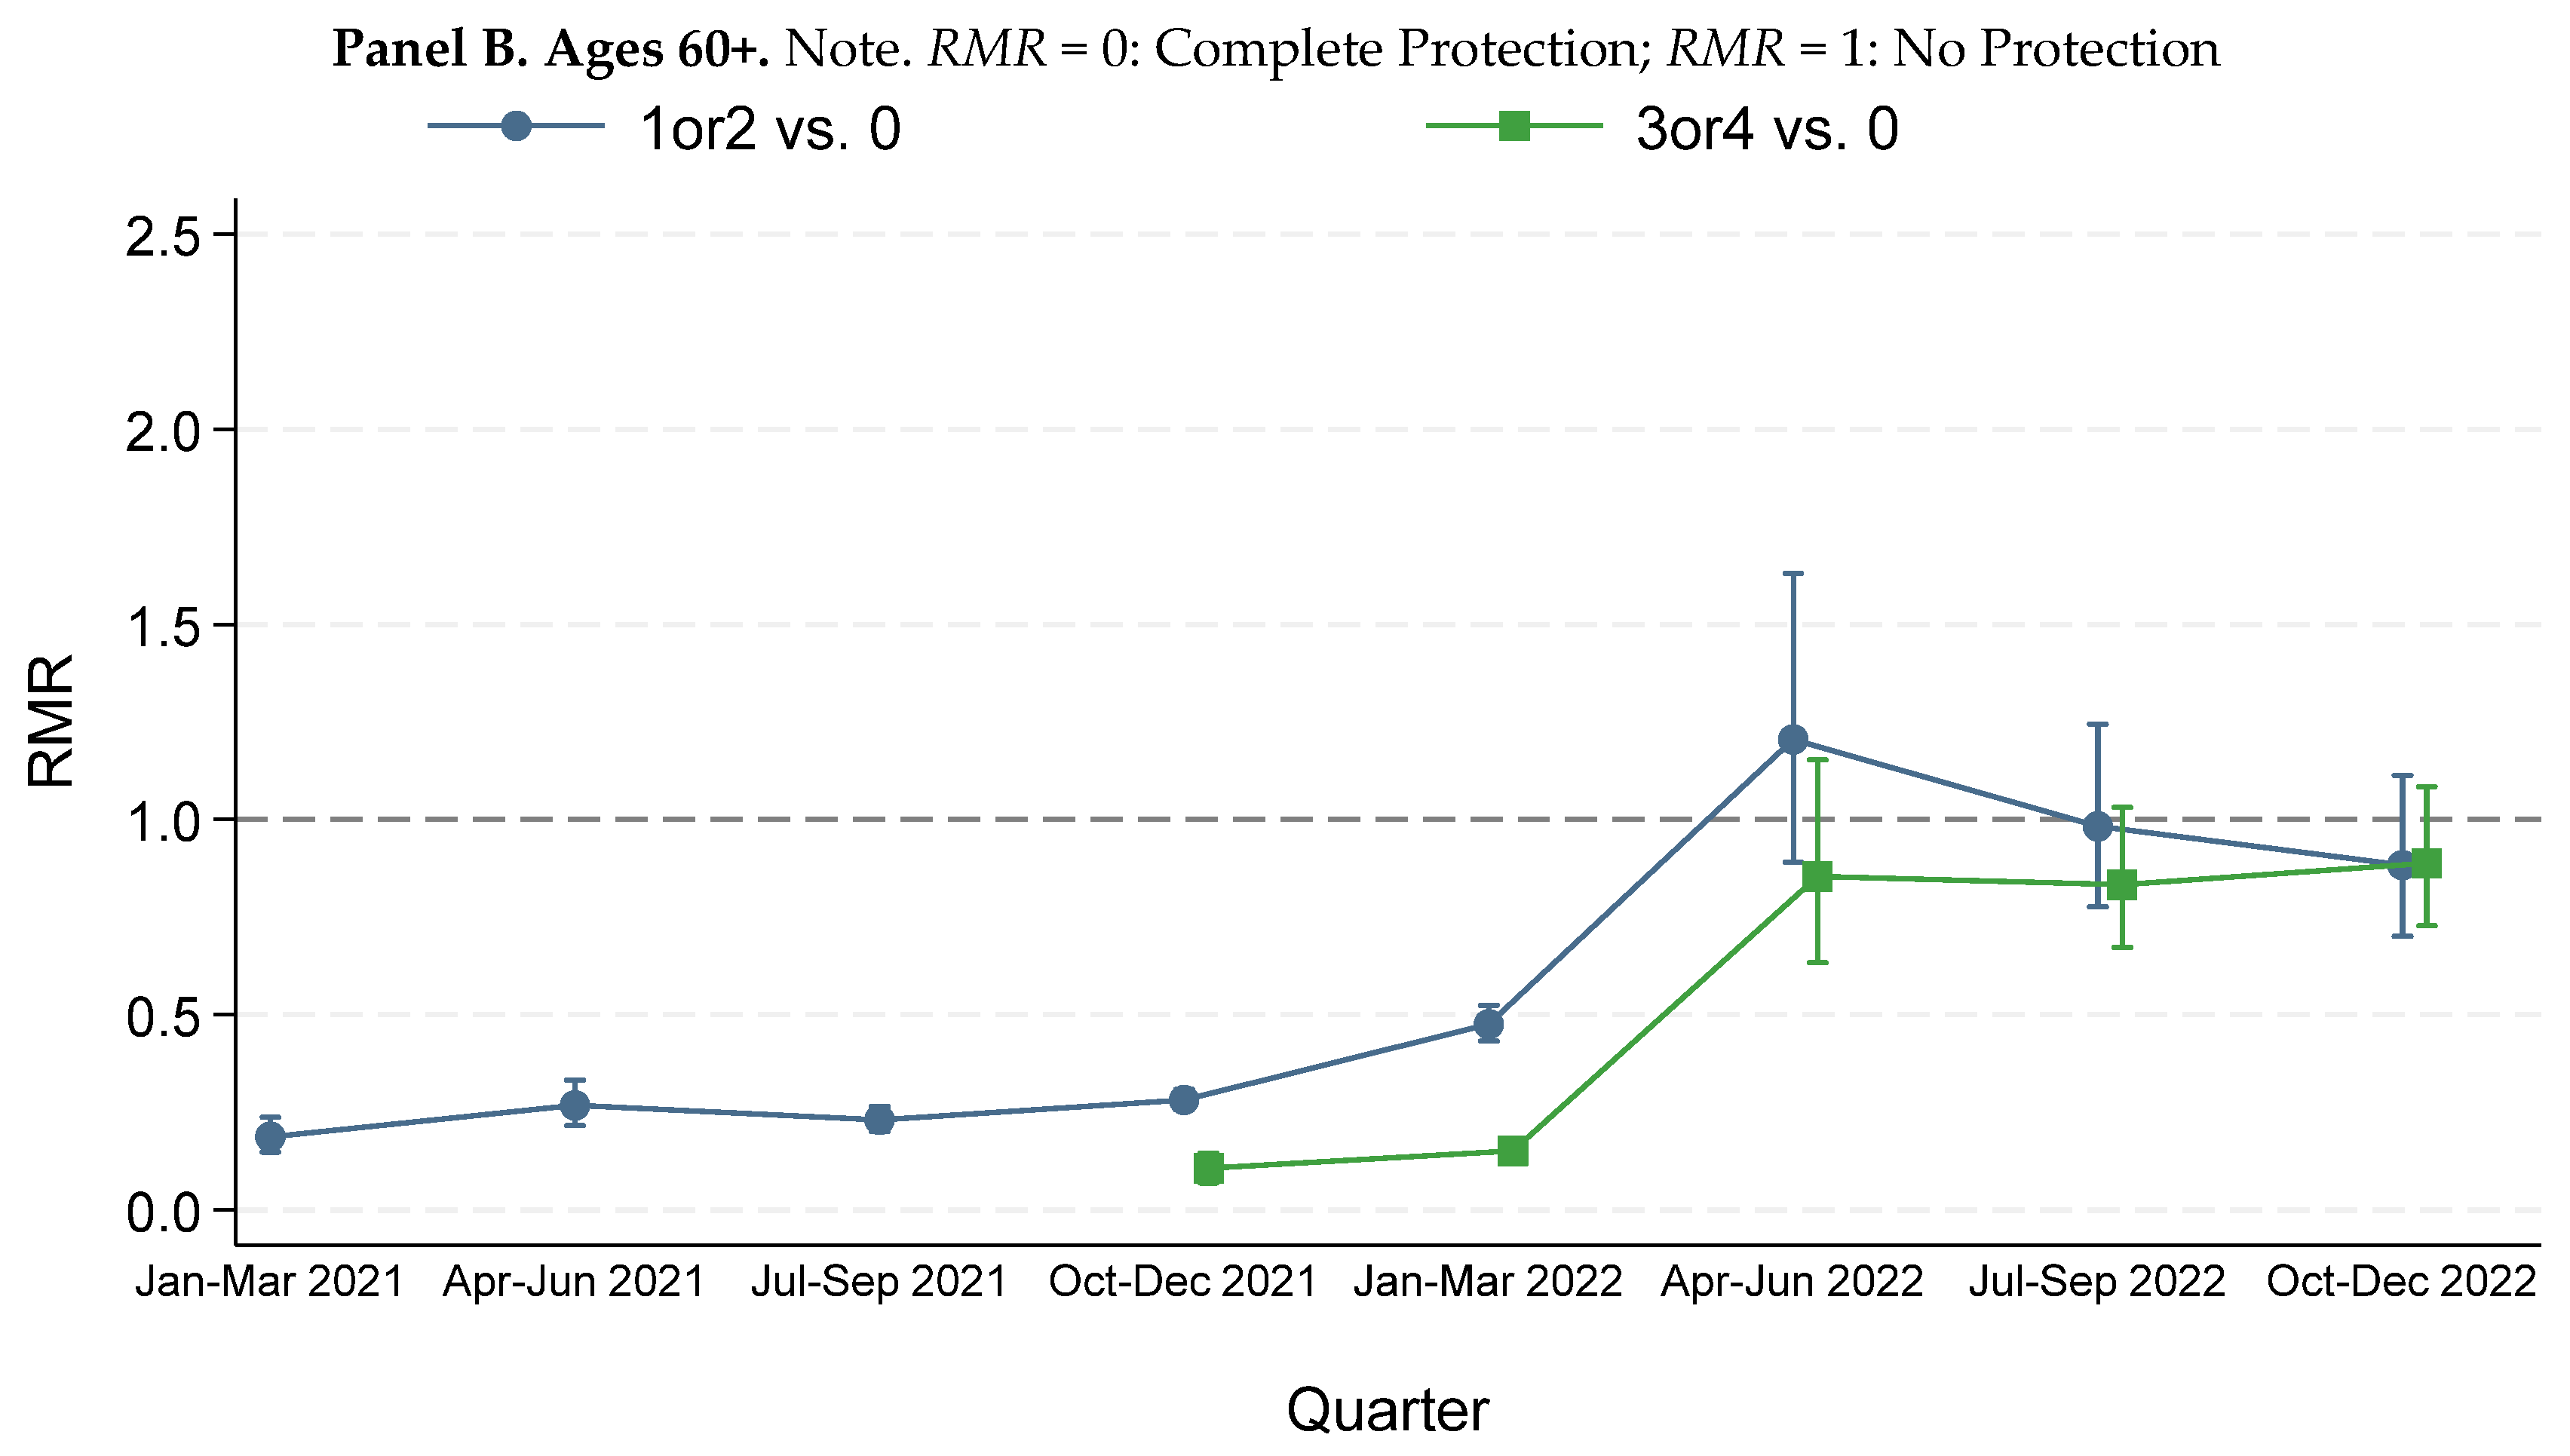
Figure 3 reports quarterly R M R v a x , u n v a x C E M P for persons with different numbers of vaccine doses for ages 15–59 and 60+. See Supplementary Figure S9 for results for finer age groups.
The time patterns in Figure 3 reflect several important factors. One is the evolution of virus variants. The Alpha variant was dominant in 2Q2021, Delta in 3Q–4Q2021, and Omicron beginning in 1Q2022. Higher RMR in 1Q2022 could reflect the shift to Omicron dominance.
A second is the number of already infected people, which grew rapidly in 1Q2022 with the huge Omicron infection wave. By the end of 1Q2022, roughly half of vaccinated persons had been infected, and thus benefited from hybrid immunity, as had a large percentage of unvaccinated persons [34]. Thus, R M R v a x , u n v a x C E M P increasingly measured a blended average of the benefit of hybrid immunity (for many vaccinees) or vaccination alone (for some vaccinees) versus infection-based immunity (for most unvaccinated persons).
The third was waning VE for the mRNA vaccines, beginning roughly 5–6 months after primary vaccination. Evidence of waning led to booster dose approval in late September 2021, initially for older and other high-risk persons.
Against that background, consider first RMRCEMP for primary vaccination. Primary vaccination has a substantial protective effect through 1Q2022. Protection weakens in 1Q2022 and essentially disappears after that for both age groups. Point estimates are close to 1.0 (no protective effect), and indeed above 1.0 in 2Q2022, although not significantly so. CIs are wide, especially for younger persons, reflecting low COVID-19 mortality rates. However, the lower end of the CIs for 2Q2022 is well above estimates for earlier periods.

3.5. Booster Dose RMRCEMP

There is strong evidence for both age groups that a booster dose offered additional protection through 1Q2022. After that, RMRCEMP point estimates for the booster dose are generally below those for primary vaccination, but CIs overlap, so booster benefit must be viewed as suggestive but not definitive. By 4Q2022, RMRCEMP estimates for primary vaccination versus booster converged for ages 60+.
In Supplementary Figure S9, we provide separate estimates for ages 60–79 and 80+, and for first and second booster doses. There is limited evidence for additional protection from a second booster dose.

3.6. Multivariate Estimates

Supplementary Table S7 reports estimates of R M R vax ,   unvax C E M P from a multivariate logistic model for vaccinees receiving different numbers of doses. Adding additional predictors has no practical effect on RMRCEMP estimates. All multivariate point estimates are within the univariate CIs and vice versa.

3.7. Additional Analyses

In Supplementary Table S8 and Figure S10, we report RMRCEMP separately for men and women. Levels are similar for both groups, and CIs overlap.
We report RMRraw values in Supplementary Table S6 and compare RMRCEMP and RMRraw in Supplementary Figure S11. RMRraw is substantially lower than RMRCEMP, consistent with substantial HVB.
In Supplementary Figure S12, we compare our Indiana results to those for Milwaukee County, Wisconsin [27]. Estimates are similar, with overlapping CIs.
In Supplementary Figure S13, we report all-cause natural mortality based on days since vaccination (without the 30-day lag). These graphs confirm the intuition that very ill people are less likely to become vaccinated. Thus, HVBCF would be lower (larger bias) without the 30-day lag. In unreported results, we found slightly higher RMRCEMP values using a 14-day lag.

4. Discussion

4.1. HVB and Need for a Credible Counterfactual

VE and RMR estimates depend on having a credible counterfactual: what COVID-19 mortality among vaccinees would have been without vaccination. Our results show large differences in background health, proxied by non-COVID-19 natural mortality: vaccinated people are substantially healthier than unvaccinated people. We provide evidence that healthy vaccinee bias is large, especially for older people. Healthy vaccinee bias is especially strong soon after vaccine doses become available for initial vaccination for ages 15–59, and for booster doses for all ages. This is evidence that healthier individuals tend to be the first to be vaccinated. Unless this selection is controlled for (using our CEMP measure or other methods), estimates of VE and RMR will be heavily biased.
CEMP has several advantages as a measure of COVID-19 mortality when studying vaccine effectiveness. It relies solely on death certificates, which are available for all decedents; it does not require population estimates; and it can address healthy vaccinee bias by using NCNMR as a proxy for underlying population health. An alternative approach, controlling for health history, including hospitalizations and comorbidities, would require population-level health history data, which are not available in U.S. datasets. Moreover, a study in Qatar, where complete health records are available, suggests that adjusting for health history is insufficient to address healthy vaccinee bias [11], as does an Israeli study of non-COVID-19 mortality [12].
The large magnitudes of healthy vaccinee bias that we found are consistent with evidence of similar levels of healthy vaccinee bias in Czechia [9]. They are also consistent with U.S. evidence showing much lower non-COVID mortality among vaccine recipients across seven integrated health systems over December 2020–July 2021 [35], which persisted after controlling for individual health [36]. HVB can also explain differences in healthcare spending for vaccinated versus unvaccinated persons [37].
Higher HVB when a vaccine dose is first available places stress on both controlling for HVB and measuring RMR over a period long enough so that HVB has stabilized. This problem was especially acute for COVID-19 because of intense public interest in obtaining evidence on VE, both for initial vaccination and booster doses. This led to a race to publish based on data for short time periods. Use of short time periods inadvertently magnified the effect of healthy vaccinee bias. Note too that a decline in healthy vaccinee bias over time and waning VE will both tend to produce rising apparent RMR. Thus, one cannot assess the extent of VE waning without also addressing HVB.
NCNMR predicts COVID-19 mortality well in the pre-vaccine period (Figure 1). This suggests that CEMP effectively controls for HVB and that RMRCEMP provides a good estimate of VE relative to the counterfactual mortality of the same people had they remained unvaccinated. We note that a study in Czechia used a similar approach to measure healthy vaccinee bias and found similar magnitudes of bias [9].

4.2. Reduced VE in 2022

We find substantially higher R M R v a x , u n v a x C E M P in 2022. From 2Q2022 on, primary vaccination no longer provided meaningful protection for an average vaccinee. Point estimates for boosters were clinically significant but not statistically significant, and for ages 60+, they shrank over 2Q–4Q2022. Reduced protection likely reflects both vaccine waning and the changing nature of the comparison between vaccinated and unvaccinated. Immune imprinting from primary vaccination could also play a role [38,39,40,41].
RMRCEMP values above 1.0 for primary vaccination in 2Q2022 could reflect already frail people dying of COVID-19 during the 1Q2022 Omicron wave, with a stronger pull-forward effect for the unvaccinated.
Our results reflect a blended average across vaccinees, including some who were already infected and others not, as well as individuals vaccinated some time ago and others more recently. Our results do not rule out some benefit for the never-infected, nor some benefit from new vaccination, for the period before waning takes place.

4.3. Comparison to Other COVID-19 Vaccine Effectiveness Studies

We summarize selected studies here.

4.3.1. Vaccine Effectiveness in 2021 and 1Q2022

Even in 2021, we find RMR for vaccinees to be substantially higher (lower VE) than most other studies, both here and in prior work [27]. By comparison, two systematic reviews find two-dose RMRs during 2021 in the range of 6–17% [6,7]. Our higher RMRs reflect the use of CEMP as an outcome in order to address HVB. Two studies that control for health report RMRs closer to those reported here [21,34].
Other studies, although not controlling for healthy vaccinee bias, also report rising RMRs over time. A Norwegian study estimated two-dose RMR against death in the second half of 2021 at 6.6% after 10–17 weeks, rising to 31.4% after 33+ weeks [24]. A Hungarian study with follow-up through February 2022 found that two-dose RMR increased with age, reaching 43% among individuals aged 85 and older [16].

4.3.2. Vaccine Effectiveness over 2Q–4Q2022

We discuss here studies that cover periods through at least 2Q2022 and include at least 4 months after vaccination, to allow for waning. Johnson et al. (2023) report a large drop in an age-standardized relative risk ratio (roughly, 1/RMR) for vaccinated versus unvaccinated from 16.2 in the Delta period to 5.3–5.4 after the Omicron wave [42]. This fall in relative risk is directionally consistent with the rise in RMRCEMP that we find after 1Q2022. Atkeson and Kissler (2024) also report a large rise in RMRraw in 2Q2022 [43].
Lin et al. (2022) report booster versus primary vaccination in North Carolina through 3 June 2022 [4]. They report incremental VE around 50% and dropping, as booster effectiveness waned. Their and our results are consistent, given both studies’ CIs.
Cai et al. (2025) studied U.S. veterans who received a booster in late 2024 [23]. They address HVB by comparing combined flu-COVID vaccine recipients with flu-vaccine-only recipients among veterans who received COVID vaccination in 2023. They use Veterans Administration data to control for patient health and demographics. They report a 64% reduction in all-cause mortality within 30 days of COVID-19 infection. This outcome includes deaths from causes unrelated to COVID-19, and is thus vulnerable to residual healthy vaccinee bias, not captured by their control group. In any case, our booster point estimates are within their CIs.

5. Limitations

We had data only for one state, Indiana, only through 2022, and studied only mortality. Indiana would not be seen in the U.S. as an outlier among states. Moreover, there is evidence, discussed above, that healthy vaccinee bias exists more broadly in the U.S. and in other countries.
Low COVID-19 mortality rates in 2022 cause limited statistical power.
We studied VE only against mortality, not against infection or hospitalization. The CEMP approach to controlling for healthy vaccinee bias may not apply to less severe outcomes such as hospitalization.
We do not observe prior COVID-19 infection in our data.
By 2Q2022, many people already had COVID [44,45]. Thus, VE during this period largely reflects the added protection from hybrid immunity (prior infection plus vaccination) relative to natural immunity alone.
We did not observe individual health, except through the limited lens of death certificates. CEMP may be an imperfect proxy for background health and may not fully capture behavioral differences between vaccinated and unvaccinated [27].
Since CEMP is measured at the population level, applying our RMR estimates to individuals is possibly an ecological fallacy (i.e., what applies to the group is not necessarily applicable to individuals). However, controlling for non-COVID mortality risk at the individual level is infeasible; it would require a randomized trial on a huge population, whereas the CEMP method is suitable for population-based observational studies using mortality datasets linked to vaccination records.
Some underreporting of COVID-19 deaths is likely, but this will bias RMRCEMP estimates only if the degree of underreporting differs between vaccinated and unvaccinated people.
We assumed that vaccination does not materially change non-COVID mortality [46,47,48,49,50] and that COVID-19 infection itself does not alter non-COVID mortality. Higher near-term mortality from other causes [51,52] will bias CEMP downward, but will not affect RMRCEMP as long as this bias is similar for vaccinated and unvaccinated groups.

6. Conclusions

We used a novel outcome measure, CEMP, to study how vaccination affects COVID-19 mortality risk over 2021–2022. We found substantial healthy vaccinee bias. Using the CEMP measure to control for this bias, we found substantial vaccine protection through 1Q2022, but no significant protection from primary vaccination after that. We found suggestive evidence of additional protection from a booster dose, but by 4Q2022, RMRCEMP point estimates for ages 60+ were close to 1.0 (no protection). These findings suggest that protection from COVID-19 booster doses against mortality may be limited, and perhaps short-lived, in the post-Omicron environment in which most people have been infected, sometimes several times. There is a need for similar studies that control for healthy vaccinee bias and cover more recent periods.

Supplementary Materials

The following supporting information can be downloaded at: https://www.mdpi.com/article/10.3390/vaccines13121235/s1. Refs. [53,54,55,56,57,58,59,60,61] are cited in Supplementary Material.

Author Contributions

Conceptualization, S.F., B.B., V.A., Q.L., J.W., K.M., B.W.W., A.Y.Y. and A.M., methodology, S.F., B.B., V.A., K.S.A., Q.L., J.W., A.Y.Y. and A.M.; software, S.F., F.M.R., K.S.A. and Q.L.; validation, S.F., B.B., V.A., K.S.A., F.M.R., Q.L. and A.Y.Y.; formal analysis, S.F., B.B., V.A., Q.L., J.W., A.Y.Y. and A.M.; investigation, B.B., K.S.A. and S.F.; resources, B.B., K.S.A. and K.M.; data curation, S.F., F.M.R. and Q.L.; writing—original draft preparation, B.B., V.A. and S.F.; writing—review and editing, all authors; visualization, S.F., F.M.R., B.B. and V.A.; supervision, B.B.; project administration, B.B., K.M. and S.F.; funding acquisition, B.B. All authors have read and agreed to the published version of the manuscript.

Funding

This project received financial support from the National Center for Advancing Translational Sciences, Award UL1TR001436. The authors are solely responsible for the content, which does not represent the official views of the NIH.

Institutional Review Board Statement

This project was approved by the MCW Human Research Review Board, as protocol 39262 (12 March 2021).

Informed Consent Statement

This study relied on de-identified data. Informed consent was waived by the MCW Human Research Review Board.

Data Availability Statement

The data for this study was provided by the Wisconsin Department of Health Services and the Regenstrief Institute at Indiana University, is subject to data use agreements, and cannot be publicly shared.

Acknowledgments

We are grateful for comments from Tomas Furst and Jaroslav Janosek.

Conflicts of Interest

The authors declare that they do not have any conflicts of interest.

References

  1. Watson, O.J.; Barnsley, G.; Toor, J.; Hogan, A.B.; Winskill, P.; Ghani, A.C. Global impact of the first year of COVID-19 vaccination: A mathematical modelling study. Lancet Infect. Dis. 2022, 22, 1293–1302. [Google Scholar] [CrossRef] [Scilit] [PubMed]
  2. Tenforde, M.W.; Self, W.H.; Gaglani, M.; Ginde, A.A.; Douin, D.J.; Talbot, H.K.; Casey, J.D.; Mohr, N.M.; Zepeski, A.; Gong, M.N.; et al. Effectiveness of mRNA vaccination in preventing COVID-19–associated invasive mechanical ventilation and death—United States, March 2021–January 2022. Morb. Mortal. Wkly. Rep. 2022, 71, 459–465. [Google Scholar] [CrossRef] [Scilit] [PubMed]
  3. Scobie, H.M.; Johnson, A.G.; Suthar, A.B.; Severson, R.; Alden, N.B.; Balter, S.; Bertolino, D.; Blythe, D.; Brady, S.; Cadwell, B.; et al. Monitoring incidence of COVID-19 cases, hospitalizations, and deaths, by vaccination status—13 US jurisdictions, April 4–July 17, 2021. Morb. Mortal. Wkly. Rep. 2021, 70, 1284–1290. [Google Scholar] [CrossRef] [Scilit]
  4. Lin, D.-Y.; Gu, Y.; Xu, Y.; Wheeler, B.; Young, H.; Sunny, S.K.; Moore, Z.; Zeng, D. Association of Primary and Booster Vaccination and Prior Infection With SARS-CoV-2 Infection and Severe COVID-19 Outcomes. J. Am. Med. Assoc. 2022, 328, 1415–1426. [Google Scholar] [CrossRef] [Scilit] [PubMed]
  5. Janošek, J.; Komárek, A. Post-infection immunity provides excellent protection from COVID-19 ICU hospitalization during Delta and Omicron waves. Infect. Dis. 2023, 55, 74–77. [Google Scholar] [CrossRef] [Scilit]
  6. Feikin, D.R.; Higdon, M.M.; Abu-Raddad, L.J.; Andrews, N.; Araos, R.; Goldberg, Y.; Groome, M.J.; Huppert, A.; O’Brien, K.L.; Smith, P.G.; et al. Duration of effectiveness of vaccines against SARS-CoV-2 infection and COVID-19 disease: Results of a systematic review and meta-regression. Lancet 2022, 399, 924–944. [Google Scholar] [CrossRef] [Scilit]
  7. Black, B.; Thaw, D. Vaccinating against a Novel Pathogen: A Critical Review of COVID-19 Vaccine Effectiveness Evidence. Microorganisms 2024, 12, 89. [Google Scholar] [CrossRef] [Scilit]
  8. Shrank, W.H.; Patrick, A.R.; Brookhart, M.A. Healthy User and Related Biases in Observational Studies of Preventive Interventions: A Primer for Physicians. J. Gen. Intern. Med. 2011, 26, 546–550. [Google Scholar] [CrossRef] [Scilit]
  9. Furst, T.; Straka, R.; Janosek, J. Healthy Vaccinee Effect: A Bias not to be Forgotten in Observational Studies on COVID-19 Vaccine Effectiveness. Pol. Arch. Intern. Med. 2024, 134, 16634. [Google Scholar] [CrossRef] [Scilit]
  10. Hoeg, T.B.; Durisetti, R.; Prasad, V. Potential “Healthy Vaccinee Bias” in a Study of BNT162b2 Vaccine Against COVID-19. N. Engl. J. Med. 2023, 389, 284–285. [Google Scholar]
  11. Chemaitelly, H.; Ayoub, H.H.; Coyle, P.; Tang, P.; Hasan, M.R.; Yassine, H.M.; A Al Thani, A.; Al-Kanaani, Z.; Al-Kuwari, E.; Jeremijenko, A.; et al. Assessing healthy vaccinee effect in COVID-19 vaccine effectiveness studies: A national cohort study in Qatar. eLife 2025, 14, e103690. [Google Scholar] [CrossRef] [Scilit]
  12. Benbassat, J.; Paul Froom, P.; Shimoni, Z. COVID-19 vaccination is associated with reduced non-COVID in-hospital mortality. Prev. Med. 2022, 164, 107326. [Google Scholar] [CrossRef] [Scilit]
  13. Nyberg, T.; Ferguson, N.M.; Nash, S.G.; Webster, H.H.; Flaxman, S.; Andrews, N.; Hinsley, W.; Bernal, J.L.; Kall, M.; Bhatt, S.; et al. Comparative Analysis of the Risks of Hospitalisation and Death Associated with SARS-CoV-2 Omicron (B.1.1.529) and Delta (B.1.617.2) Variants in England: A Cohort Study. Lancet 2022, 399, 1303–1312. [Google Scholar] [CrossRef] [Scilit]
  14. Bar-On, Y.M.; Goldberg, Y.; Mandel, M.; Bodenheimer, O.; Freedman, L.; Kalkstein, N.; Mizrahi, B.; Alroy-Preis, S.; Ash, N.; Milo, R.; et al. Protection of BNT162b2 vaccine booster against COVID-19 in Israel. N. Engl. J. Med. 2021, 385, 1393–1400. [Google Scholar] [CrossRef] [Scilit] [PubMed]
  15. Lin, D.Y.; Gu, Y.; Wheeler, B.; Young, H.; Holloway, S.; Sunny, S.K.; Moore, Z.; Zeng, D. Effectiveness of Covid-19 Vaccines over a 9-Month Period in North Carolina. N. Engl. J. Med. 2022, 386, 933–941. [Google Scholar] [CrossRef] [Scilit] [PubMed] [PubMed Central]
  16. Kiss, Z.; Wittmann, I.; Polivka, L.; Surján, G.; Surján, O.; Barcza, Z.; Molnár, G.A.; Nagy, D.; Müller, V.; Bogos, K.; et al. Nationwide Effectiveness of First and Second SARS-CoV2 Booster Vaccines during the Delta and Omicron Pandemic Waves in Hungary (HUN-VE 2 Study). Front. Immunol. 2022, 13, 3087. [Google Scholar] [CrossRef] [Scilit] [PubMed]
  17. Andrews, N.; Stowe, J.; Kirsebom, F.; Toffa, S.; Sachdeva, R.; Gower, C.; Ramsay, M.; Bernal, J.L. Effectiveness of COVID-19 booster vaccines against COVID-19-related symptoms, hospitalization and death in England. Nat. Med. 2022, 28, 831–837. [Google Scholar] [CrossRef]
  18. Arbel, R.; Hammerman, A.; Sergienko, R.; Friger, M.; Peretz, A.; Netzer, D.; Yaron, S. BNT162b2 vaccine booster and mortality due to Covid-19. N. Engl. J. Med. 2021, 385, 2413–2420. [Google Scholar] [CrossRef] [Scilit]
  19. Barda, N.; Dagan, N.; Cohen, C.; Hernán, M.A.; Lipsitch, M.; Kohane, I.S.; Reis, B.Y.; Balicer, R.D. Effectiveness of a third dose of the BNT162b2 mRNA COVID-19 vaccine for preventing severe outcomes in Israel: An observational study. Lancet 2021, 398, 2093–2100. [Google Scholar] [CrossRef] [Scilit]
  20. Islam, N.; Sheils, N.E.; Jarvis, M.S.; Cohen, K. Comparative effectiveness over time of the mRNA-1273 (Moderna) vaccine and the BNT162b2 (Pfizer-BioNTech) vaccine. Nat. Commun. 2022, 13, 2377. [Google Scholar] [CrossRef] [Scilit]
  21. Cohn, B.A.; Cirillo, P.M.; Murphy, C.C.; Krigbaum, N.Y.; Wallace, A.W. SARS-CoV-2 vaccine protection and deaths among US veterans during 2021. Science 2022, 375, 331–336. [Google Scholar] [CrossRef] [Scilit] [PubMed]
  22. Mayr, F.B.; Talisa, V.B.; Shaikh, O.S.; Omer, S.B.; Butt, A.A.; Yende, S. Comparative COVID-19 Vaccine Effectiveness Over Time in Veterans. In Open Forum Infectious Diseases; Oxford University Press: Oxford, UK, 2022; Volume 9. [Google Scholar] [CrossRef] [Scilit]
  23. Cai, M.; Xie, Y.; Al-Aly, Z. Association of 2024–2025 Covid-19 Vaccine with COVID-19 Outcomes in U.S. Veterans. N. Engl. J. Med. 2025, 393, 1612–1623. [Google Scholar] [CrossRef] [Scilit] [PubMed]
  24. Starrfelt, J.; Danielsen, A.S.; Buanes, E.A.; Juvet, L.K.; Lyngstad, T.M.; Rø, G.Ø.I.; Veneti, L.; Watle, S.V.; Meijerink, H. Age and product dependent vaccine effectiveness against SARS-CoV-2 infection and hospitalisation among adults in Norway: A national cohort study, July–November 2021. BMC Med. 2022, 20, 278. [Google Scholar] [CrossRef] [Scilit]
  25. Patel, M.M.; Jackson, M.L.; Ferdinands, J. Postlicensure Evaluation of COVID-19 Vaccines. JAMA 2020, 324, 1939–1940. [Google Scholar] [CrossRef] [Scilit]
  26. Dean, N.; Amin, A.B. Test-Negative Study Designs for Evaluating Vaccine Effectiveness. J. Am. Med. Assoc. 2024, 332, 163–164. [Google Scholar] [CrossRef] [Scilit] [PubMed]
  27. Atanasov, V.; Barreto, N.; Whittle, J.; Meurer, J.; Weston, B.W.; Luo, Q.; Franchi, L.; Yuan, A.Y.; Zhang, R.; Black, B. Understanding COVID-19 Vaccine Effectiveness Against Death Using a Novel Measure: COVID Excess Mortality Percentage. Vaccines 2023, 11, 379. Available online: https://www.mdpi.com/2076-393X/11/2/379 (accessed on 1 December 2025). [CrossRef] [Scilit]
  28. Atanasov, V.; Barreto, N.; Whittle, J.; Meurer, J.; Weston, B.W.; Luo, Q.; Yuan, A.Y.; Franchi, L.; Zhang, R.; Black, B. Selection Effects and COVID-19 Mortality Risk After Pfizer vs. Moderna Vaccination: Evidence from Linked Mortality and Vaccination Records. Vaccines 2023, 11, 971. [Google Scholar] [CrossRef] [Scilit]
  29. Black, B.; Atanasov, V.; Glatman-Freedman, A.; Keinan-Boker, L.; Reichman, A.; Franchi, L.; Meurer, J.; Luo, Q.; Thaw, D.B.; Moghtaderi, A. COVID-19 Boosters: If the US Had Matched Israel’s Speed And Take-Up, An Estimated 29,000 US Lives Would Have Been Saved. Health Aff. 2023, 42, 1747–1757. [Google Scholar] [CrossRef] [Scilit]
  30. Butler, D.C.; Petterson, S.; Phillips, R.L.; Bazemore, A.W. Measures of social deprivation that predict health care access and need within a rational area of primary care service delivery. Health Serv. Res. 2013, 48, 539–559. [Google Scholar] [CrossRef] [Scilit]
  31. Rossi, F.M.; Franchi, L.; Chorniy, A.B.N.; Weston, B.W.; Meurer, J.R.; Whittle, J.; Ackermann, R.T.; Black, B. Comparing Predictive Power of Area-Level Socio-Economic Status Indices Across Health Outcomes and Geographic Level. Med. Care 2025. Available online: http://ssrn.com/abstract=4547382 (accessed on 1 December 2025).
  32. Woolf, S.H.; Chapman, D.A.; Sabo, R.T.; Zimmerman, E.B. Excess Deaths From COVID-19 and Other Causes in the US, March 1, 2020, to January 2, 2021. JAMA 2021, 325, 1786. [Google Scholar] [CrossRef] [Scilit] [PubMed]
  33. Paglino, E.; Lundberg, D.J.; Zhou, Z.; Wasserman, J.A.; Raquib, R.; Hempstead, K.; Preston, S.H.; Elo, I.T.; Stokes, A.C. Excess natural-cause mortality in US counties and its Association with Reported COVID-19 Deaths. Proc. Natl. Acad. Sci. USA 2024, 121, e2313661121. [Google Scholar] [CrossRef] [Scilit] [PubMed]
  34. Franchi, L.; Atanasov, V.; Stake, M.; Bates, G.; Osinski, K.; Meurer, J.R.; Black, B. The Disappearing COVID-naïve population: Evidence from Antibody Seroprevalence in Milwaukee County, Wisconsin. Sci. Rep. 2024, 14, 27850. [Google Scholar] [CrossRef] [Scilit] [PubMed]
  35. Xu, S.; Huang, R.; Sy, L.S.; Glenn, S.C.; Ryan, D.S.; Morrissette, K.; Shay, D.K.; Vazquez-Benitez, G.; Glanz, J.M.; Klein, N.P.; et al. COVID-19 Vaccination and Non–COVID-19 Mortality Risk—Seven Integrated Health Care Organizations, United States, December 14, 2020–July 31, 2021. Mortal. Morb. Wkly. Rep. 2021, 70, 1520–1524. [Google Scholar] [CrossRef] [Scilit]
  36. Xu, S.; Huang, R.; Sy, L.S.; Hong, V.; Glenn, S.C.; Ryan, D.S.; Morrissette, K.; Shay, D.K.; Vazquez-Benitez, G.; Glanz, J.M.; et al. A safety study evaluating non-COVID-19 mortality risk following COVID-19 vaccination. Vaccine 2023, 41, 844–854. [Google Scholar] [CrossRef] [Scilit]
  37. Pike, J.; Kompaniyets, L.; Hurley, L.P.; Everhart, R.M.; Miller, G.F.; Saydah, S.; Breslin, K.; Lindley, M.C. Comparing COVID-19 Acute and Postacute Medical Spending by Vaccination Status for Child and Adult Medicaid Enrollees. Health Aff. 2025, 44, 1218–1225. [Google Scholar] [CrossRef] [Scilit]
  38. Xu, Y.; Li, H.; Kirui, B.; Santosa, A.; Gisslén, M.; Leach, S.; Wettermark, B.; Vanfleteren, L.E.G.W.; Nyberg, F. Effectiveness of COVID-19 Vaccines over 13 Months Covering the Period of the Emergence of the Omicron Variant in the Swedish Population. Vaccines 2022, 10, 2074. [Google Scholar] [CrossRef] [Scilit]
  39. Barouch, D.H. COVID-19 Vaccines—Immunity, Variants, Boosters. N. Engl. J. Med. 2022, 387, 1011–1020. [Google Scholar] [CrossRef] [Scilit]
  40. Tercatin, R. COVID: Booster opened to all, jabbed with 3rd dose exempt from isolation. Jerusalem Post, 30 August 2021.
  41. Krause, P.R.; Fleming, T.R.; Peto, R.; Longini, I.M.; Figueroa, J.P.; Sterne, J.A.C.; Cravioto, A.; Rees, H.; Higgins, J.P.T.; Boutron, I.; et al. Considerations in boosting COVID-19 vaccine immune responses. Lancet 2021, 398, 1377–1380. [Google Scholar] [CrossRef] [Scilit]
  42. Johnson, A.G.; Lauren, L.; Akilah, R.A.; Allison, D.; Minchan, S.; Carolyn, A.; Brandy, A.; Brett, A.; Madison, A.; Steven, A.; et al. COVID-19 Incidence and Mortality Among Unvaccinated and Vaccinated Persons Aged ≥ 12 Years by Receipt of Bivalent Booster Doses and Time Since Vaccination—24 U.S. Jurisdictions, October 3, 2021–December 24, 2022. Mortal. Morb. Wkly. Rep. 2023, 72, 145–152. [Google Scholar] [CrossRef] [Scilit] [PubMed]
  43. Atkeson, A.; Kissler, S. The impact of vaccines and behavior on US cumulative deaths from COVID-19. In Brookings Papers on Economic Activity; Spring: Berlin/Heidelberg, Germany, 2024; pp. 67–112. [Google Scholar]
  44. Clarke, K.E.; Jones, J.M.; Deng, Y.; Nycz, E.; Lee, A.; Iachan, R.; Gundlapalli, A.V.; Hall, A.J.; MacNeil, A. Seroprevalence of Infection-Induced SARS-CoV-2 Antibodies—United States, September 2021–February 2022. Mortal. Morb. Wkly. Rep. 2022, 71, 606–608. [Google Scholar] [CrossRef] [Scilit] [PubMed]
  45. Wiegand, R.E.; Deng, Y.; Deng, X.; Lee, A.; Meyer, W.A.; Letovsky, S., 3rd; Charles, M.D.; Gundlapalli, A.V.; MacNeil, A.; Hall, A.J.; et al. Estimated SARS-CoV-2 antibody seroprevalence trends and relationship to reported case prevalence from a repeated, cross-sectional study in the 50 states and the District of Columbia, United States-October 25, 2020-February 26, 2022. Lancet Reg. health. Am. 2023, 18, 100403. [Google Scholar] [CrossRef] [Scilit] [PubMed]
  46. Barda, N.; Dagan, N.; Ben-Shlomo, Y.; Kepten, E.; Waxman, J.; Ohana, R.; Hernán, M.A.; Lipsitch, M.; Kohane, I.; Netzer, D.; et al. Safety of the BNT162b2 mRNA Covid-19 Vaccine in a Nationwide Setting. N. Engl. J. Med. 2021, 385, 1078–1090. [Google Scholar] [CrossRef] [Scilit]
  47. Jabagi, M.J.; Botton, J.; Bertrand, M.; Weill, A.; Farrington, P.; Zureik, M.; Dray-Spira, R. Myocardial Infarction, Stroke, and Pulmonary Embolism after BNT162b2 mRNA COVID-19 Vaccine in People Aged 75 Years or Older. J. Am. Med. Assoc. 2022, 327, 80. [Google Scholar] [CrossRef] [Scilit]
  48. Blumenthal, K.G.; Robinson, L.B.; Camargo, C.A.; Shenoy, E.S.; Banerji, A.; Landman, A.B.; Wickner, P. Acute Allergic Reactions to mRNA COVID-19 Vaccines. J. Am. Med. Assoc. 2021, 325, 1562–1565. [Google Scholar] [CrossRef] [Scilit]
  49. Desai, A.P.; Desai, A.P.; Loomis, G.J. Relationship Between Pre-Existing Allergies and Anaphylactic Reactions post mRNA COVID-19 Vaccine Administration. Vaccine 2021, 39, 4407–4409. [Google Scholar] [CrossRef] [Scilit]
  50. Xu, S.; Sy, L.S.; Hong, V.; Farrington, P.; Glenn, S.C.; Ryan, D.S.; Shirley, A.M.; Lewin, B.J.; Tseng, H.F.; Vazquez-Benitez, G.; et al. Mortality risk after COVID-19 vaccination: A self-controlled case series study. Vaccine 2024, 42, 1731–1737. [Google Scholar] [CrossRef] [Scilit]
  51. Xie, Y.; Xu, E.; Bowe, B.; Al-Aly, Z. Long-term cardiovascular outcomes of COVID-19. Nat. Med. 2022, 28, 583–590. [Google Scholar] [CrossRef] [Scilit]
  52. Kobo, O.; Abramov, D.; Fudim, M.; Sharma, G.; Bang, V.; Deshpande, A.; Wadhera, R.K.; Mamas, M.A. Has the first year of the COVID-19 pandemic reversed the trends in CV mortality between 1999 and 2019 in the United States? Eur. Heart J. Qual. Care Clin. Outcomes 2022, 9, 367–376. [Google Scholar] [CrossRef] [Scilit]
  53. Fu, Y.; Wu, K.; Wang, Z.; Yang, H.; Chen, Y.; Wu, L.; Yanagihara, R.; Hedges, J.R.; Wang, H.; Deng, Y.; et al. Effectiveness of various COVID-19 vaccine regimens among 10.4 million patients from the National COVID Cohort Collaborative during Pre-Delta to Omicron periods—United States, 11 December 2020 to 30 June 2022. Vaccine 2023, 41, 6339–6349. [Google Scholar] [CrossRef] [Scilit]
  54. Griffin, J.B.; Haddix, M.; Danza, P.; Fisher, R.; Koo, T.H.; Traub, E.; Gounder, P.; Jarashow, C.; Balter, S. SARS-CoV-2 Infections and Hospitalizations Among Persons Aged ≥16 Years, by Vaccination Status—Los Angeles County, California, May 1–July 25, 2021. Morb. Mortal. Wkly. Rep. 2021, 70, 1170–1176. [Google Scholar] [CrossRef] [Scilit]
  55. Kirkwood, B.R.; Sterne, J.A.C. Essential Medical Statistics; John Wiley & Sons: Hoboken, NJ, USA, 2010. [Google Scholar]
  56. Mandavilli, A.C.D.C. Endorses Covid Vaccine Booster Shots for Al Adults. New York Times, 19 November 2021.
  57. Marschner, I.C. Estimating age-specific COVID-19 fatality risk and time to death by comparing population diagnosis and death patterns: Australian data. BMC Med. Res. Methodol. 2021, 1, 126. [Google Scholar] [CrossRef] [Scilit]
  58. Piernas, C.; Patone, M.; Astbury, N.M.; Gao, M.; Sheikh, A.; Khunti, K.; Shankar-Hari, M.; Dixon, S.; Coupland, C.; Aveyard, P.; et al. Associations of BMI with COVID-19 vaccine uptake, vaccine effectiveness, and risk of severe COVID-19 outcomes after vaccination in England: A population-based cohort study. Lancet Diabetes Endocrinol. 2022, 10, 271–280. [Google Scholar] [CrossRef] [Scilit]
  59. Rezel-Potts, E.; Douiri, A.; Sun, X.; Chowienczyk, P.J.; Shah, A.M.; Gulliford, M.C. Cardiometabolic outcomes up to 12 months after COVID-19 infection. A matched cohort study in the UK. PLoS Med. 2022, 19, e1004052. [Google Scholar] [CrossRef] [Scilit]
  60. Rossi, F.; Franchi, L.; Atanasov, V.; Barreto, N.; Nardone, B.; Whittle, J.; Meurer, J.; Luo, Q.; Yuan, Y.; Black, B. Life-Expectancy Loss During the COVID-19 Pandemic: Decomposition Using Individual-Level Mortality Data (Working Paper 2025). Available online: https://papers.ssrn.com/sol3/papers.cfm?abstract_id=4891811 (accessed on 8 December 2025).
  61. Yang, X.; Yu, Y.; Xu, J.; Shu, H.; Xia, J.; Liu, H.; Wu, Y.; Zhang, L.; Yu, Z.; Fang, M.; et al. Clinical course and outcomes of Critically Ill patients with SARS-CoV-2 pneumonia in Wuhan, China: A single-centered, retrospective, observational study. Lancet Respir. Med. 2020, 8, 475–481. [Google Scholar] [CrossRef] [Scilit]
Figure 1. Correlation between Natural Mortality in 2019 and COVID-19 Mortality in 2020. Figure shows scatterplot of natural mortality in Indiana over April–December 2019 (x-axis) against COVID-19 mortality over April–December 2020 (y-axis), for groups defined by age (15–39, 40–49, 50–59, 60–69, 70–79, 80–89, 90+), sex, race/ethnicity, and area SES quintile. The figure also shows a best-fit regression line and a Pearson correlation coefficient.
Vaccines 13 01235 g001
Figure 2. Healthy vaccinee bias correction factor by age range and number of doses. The figure shows the healthy vaccinee bias correction factor (HVBCF) by calendar quarter over 1Q2021–4Q2022, for vaccinees aged 15+ with the indicated number of vaccine doses. “1 or 2” means primary vaccination; “3” doses means 1 booster dose; “4” doses means 2 booster doses (A). Ages 15–59. The results for 3 and 4 doses (1 or 2 booster doses) are combined because very few people in this age range received a fourth dose during the study period (A,B). HVBCF is the ratio of non-COVID NMR with indicated numbers of vaccine doses for vaccinated to non-COVID NMR for unvaccinated. Estimates for 3Q–4Q2021 are adjusted for the IHIE undercount of vaccinated decedents during August–October 2021. See Supplementary Table S4 for underlying data. The sample excludes immunocompromised persons. Short vertical lines show 95% confidence intervals. Higher HVBCF indicates less bias. Note that Panels A and B use different y-axis scales.
Vaccines 13 01235 g002
Figure 3. Relative mortality risk by age range and number of doses. The figure shows relative mortality risk (RMR), based on CEMP, by calendar quarter for vaccinees aged 15+ with the indicated number of vaccine doses, for 1Q2021–4Q2022. “1 or 2” means primary vaccination. “3 or 4” means 1 or 2 booster doses. (A). Ages 15–59. The results for 3 and 4 doses (1 or 2 booster doses) are combined because very few people in this age range received a fourth dose during the study period. (B). Age 60+. Both panels. Estimates for 3Q–4Q2021 are adjusted for the IHIE undercount of vaccinated decedents during August–October 2021. Vertical lines show 95% confidence intervals.
Vaccines 13 01235 g003aVaccines 13 01235 g003b
Table 1. Summary statistics. The table provides selected summary statistics for Indiana vaccinees and unvaccinated persons, age 15+, as of the indicated dates or periods. Counts of vaccinated persons are as of the end of the indicated period; deaths and ratios are averages for the period. See Supplementary Table S4 for additional breakdown by age group, time period, and number of vaccine doses. For 4Q2021–4Q2022, the total population slightly exceeds the number unvaccinated or with 1–2 or 3+ doses due to a small number of persons with unusual vaccination patterns.
1Q 20212Q 20213Q 20214Q 20211Q 20222Q 20223Q 20224Q 2022
Ages 15–59
Unvaccinated3,174,3692,182,3491,814,0611,616,8071,526,8511,508,9341,495,4441,487,532
1 or 2 doses740,0301,732,0502,077,8631,671,3881,534,2161,523,8171,518,5071,503,048
3+ doses0012,328613,971839,397868,300886,482908,820
Total population3,914,3993,914,3993,914,3993,914,3993,914,3993,914,3993,914,3993,914,399
COVID-19 deaths236133474741540355347
Non-COVID natural deaths21061936209322272054186018952165
COVID-MR0.006%0.003%0.012%0.019%0.014%0.001%0.001%0.001%
Non-COVID NMR0.054%0.049%0.053%0.057%0.052%0.048%0.048%0.055%
CEMP11.21%6.87%22.65%33.27%26.29%1.88%2.80%2.17%
R M R v a x , u n v a x C E M P 0.4630.3790.1680.1430.2861.1020.7220.693
HVBCFvax,unvax0.2360.6190.5150.5420.5660.4840.5660.551
Ages 60+
Unvaccinated468,891301,865234,663172,633159,946154,055149,899146,076
1 or 2 doses1,076,1891,243,2151,223,629583,884507,223496,990489,429473,820
3+ doses0058,314755,604837,028860,397871,663890,326
Total population1,545,0801,545,0801,545,0801,545,0801,545,0801,545,0801,545,0801,545,080
COVID-19 deaths2424488135526242578262475532
Non-COVID natural deaths13,16212,56013,07014,07413,75112,37712,77914,252
COVID-MR0.157%0.032%0.088%0.170%0.167%0.017%0.031%0.034%
Non-COVID NMR0.852%0.813%0.846%0.911%0.890%0.801%0.827%0.922%
CEMP18.42%3.89%10.37%18.64%18.75%2.12%3.72%3.73%
R M R v a x , u n v a x C E M P 0.1880.2690.2310.2630.3210.9970.8830.885
HVBCFvax,unvax0.3110.3520.2970.2550.2290.2380.2240.228
Disclaimer/Publisher’s Note: The statements, opinions and data contained in all publications are solely those of the individual author(s) and contributor(s) and not of MDPI and/or the editor(s). MDPI and/or the editor(s) disclaim responsibility for any injury to people or property resulting from any ideas, methods, instructions or products referred to in the content.