
Determinants of Influenza Vaccine Uptake Among Rural Populations in a Southeastern U.S. State
 ,
,  , and
, and
Abstract
1. Introduction
2. Materials and Methods
2.1. Study Design, Sample and Setting
2.2. Data Collection and Measures
2.3. Statistical Analysis
3. Results
3.1. Characteristics of the Study Participants
3.2. Influenza Vaccine Uptake
3.3. Associations Between Participant Characteristics and Influenza Vaccine Uptake in 2023–2024 Influenza Season
3.4. A Binary Logistic Regression Analysis of Participants’ Trust in Medical Doctors, Pharmacists, and Public Health Authorities on Influenza Vaccine Uptake
3.5. A Multivariable Logistic Regression of Factors Associated with Flu Vaccine Uptake
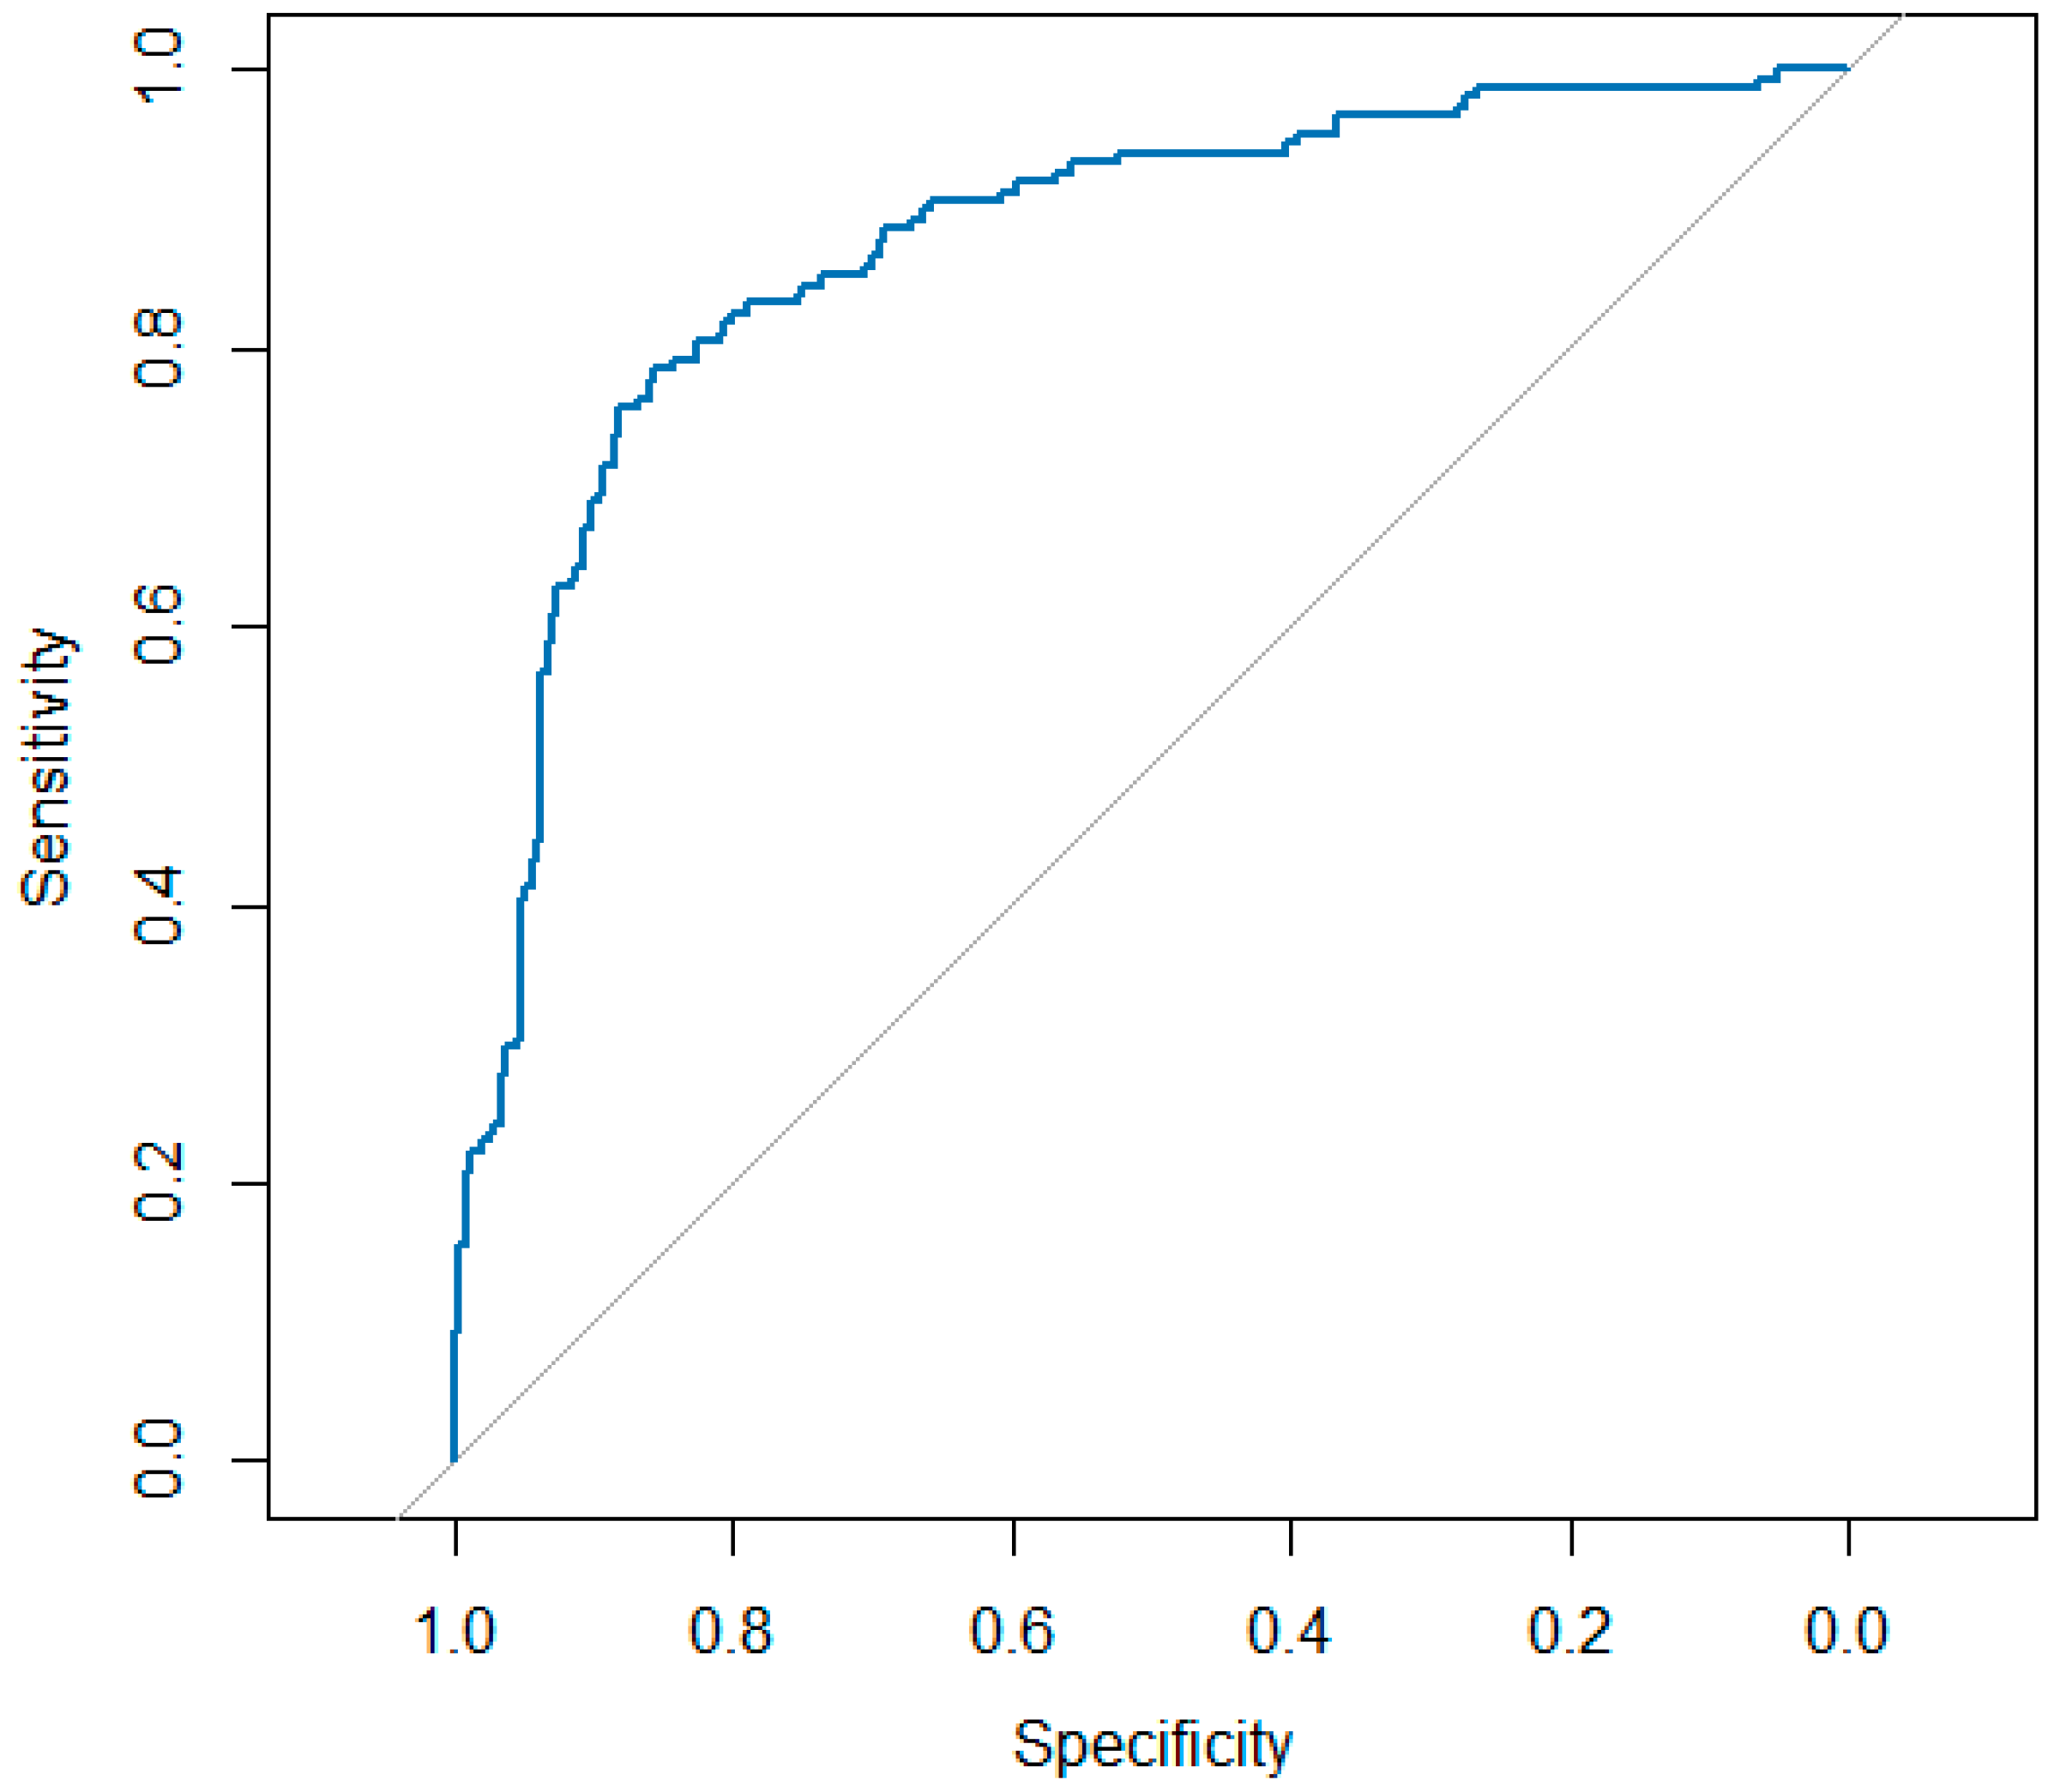
3.6. Model Diagnostics
4. Discussion
Limitations
5. Conclusions
Supplementary Materials
Author Contributions
Funding
Institutional Review Board Statement
Informed Consent Statement
Data Availability Statement
Conflicts of Interest
Abbreviations
| USA | United States of America |
| US | United States |
| COVID-19 | Coronavirus Disease 2019 |
| RUCA | Rural–urban Commuting Area |
| (T-DiG) | Trust in Doctors in General |
| (TRUST-Ph) | Trust in Community Pharmacists |
| (TiPHA) | Trust in Public Health Authorities |
Appendix A

| Trust Scale | Components | Number of Items | Means (±SD) | Cronbach’s Alpha |
|---|---|---|---|---|
| Trust in public health authorities a | Beneficence | 8 | 2.55 (0.55) | 0.813 |
| Competence | 6 | 2.55 (0.60) | 0.797 | |
| Trust in doctors in general b | Communication competency | 5 | 3.57 (0.74) | 0.857 |
| Fidelity | 5 | 2.93 (0.84) | 0.859 | |
| Systems trust | 3 | 3.29 (0.95) | 0.885 | |
| Confidentiality | 3 | 3.71 (0.83) | 0.831 | |
| Fairness | 7 | 3.40 (0.83) | 0.925 | |
| Stigma-based discrimination | 3 | 3.17 (0.84) | 0.759 | |
| Global trust | 3 | 3.52 (0.92) | 0.949 | |
| Trust in community pharmacists (Trust-Ph) b | Benevolence | 12 | 3.32 (0.70) | 0.926 |
| Technical competence | 10 | 3.46 (0.63) | 0.874 | |
| Communication | 8 | 3.77 (0.68) | 0.918 |
| Variable | Population Count | Population Proportion (a) | Sample Count (Unweighted) | Sample Proportion (b) (Unweighted) | Assigned Weight (a/b) |
|---|---|---|---|---|---|
| White male | 826,519 | 0.38 | 86 | 0.20 | 1.9 |
| Black and other male | 248,156 | 0.11 | 25 | 0.06 | 1.83 |
| White female | 848,935 | 0.39 | 241 | 0.57 | 0.68 |
| Black and other female | 269,076 | 0.12 | 69 | 0.16 | 0.75 |
| Total | 2,192,686 | 421 |
| Variable | n | Minimum | Maximum | Mean | Std. Deviation |
|---|---|---|---|---|---|
| Weight | 426 | 0.68 | 1.90 | 1.282 | 0.594 |
| Variable | Population n = 2,192,686 n (%) | Unweighted Sample n = 421 n (%) | Weighted Sample n = 426 n (%) | ASMD (Population vs. Unweighted Sample) | ASMD (Population vs. Weighted Sample) | ASMD (Unweighted vs. Weighted Sample) |
|---|---|---|---|---|---|---|
| Sex | ||||||
| Female | 1,118,011 (51.0) | 310 (73.6) | 217 (50.9) | 0.48 | 0.002 | 0.482 |
| Male | 1,074,675 (49.0) | 111 (26.4) | 209 (49.1) | 0.48 | 0.002 | 0.482 |
| Race | ||||||
| White | 1,675,454 (76.4) | 327 (77.7) | 328 (77.1) | 0.031 | 0.017 | 0.014 |
| Non-white * | 517,232 (23.6) | 94 (22.3) | 98 (22.9) | 0.031 | 0.017 | 0.014 |
| Variable | Tolerance | Variance Inflation Factor (VIF) |
|---|---|---|
| Sex | 0.891 | 1.122 |
| Age | 0.555 | 1.801 |
| Political affiliation | 0.871 | 1.148 |
| Education | 0.810 | 1.235 |
| Household income | 0.907 | 1.103 |
| Employment | 0.728 | 1.374 |
| Presence of chronic conditions | 0.885 | 1.130 |
| Previously received a COVID-19 vaccine in the past | 0.658 | 1.521 |
| Trust in Public Health | ||
| Beneficence | 0.279 | 3.583 |
| Competence | 0.279 | 3.590 |
| Trust in doctors in general | ||
| Communication competency | 0.407 | 2.454 |
| Fidelity | 0.585 | 1.708 |
| Systems trust | 0.488 | 2.049 |
| Confidentiality | 0.478 | 2.093 |
| Fairness | 0.403 | 2.482 |
| Stigma-based discrimination | 0.724 | 1.380 |
| Global trust | 0.400 | 2.500 |
| Trust in Community Pharmacists | ||
| Benevolence | 0.282 | 3.546 |
| Technical competence | 0.301 | 3.324 |
| Communication | 0.360 | 2.779 |

| Factor and Their Interactions | Estimate | Standard Error | p Value |
|---|---|---|---|
| Trust in Public Health Authorities | |||
| Beneficence | −7.784 | 2.994 | 0.009 |
| Beneficence × log (Beneficence) | 4.087 | 1.578 | 0.010 |
| Competence | 4.476 | 3.117 | 0.151 |
| Competence × log (Competence) | −2.018 | 1.630 | 0.216 |
| Trust in doctors in general | |||
| Communication competency | 2.108 | 3.448 | 0.541 |
| Communication competency × log (Communication competency) | −0.481 | 1.528 | 0.753 |
| Fidelity | 2.163 | 1.984 | 0.276 |
| Fidelity × log (Fidelity) | −1.019 | 0.940 | 0.278 |
| Systems trust | 1.452 | 1.729 | 0.401 |
| Systems trust × log (Systems trust) | −0.698 | 0.808 | 0.388 |
| Confidentiality | 1.265 | 2.553 | 0.620 |
| Confidentiality × log (Confidentiality) | −0.676 | 1.119 | 0.546 |
| Fairness | 1.870 | 2.455 | 0.446 |
| Fairness × log (Fairness) | −1.044 | 1.118 | 0.351 |
| Stigma-based discrimination | −1.840 | 1.933 | 0.341 |
| Stigma-based discrimination × log (Stigma-based discrimination) | 1.049 | 0.921 | 0.255 |
| Global trust | 0.139 | 1.899 | 0.941 |
| Global trust × log (Global trust) | 0.095 | 0.876 | 0.916 |
| Trust in Community Pharmacists | |||
| Benevolence | 5.265 | 3.158 | 0.096 |
| Benevolence × log (Benevolence) | −2.392 | 1.457 | 0.101 |
| Technical competence | −3.173 | 3.729 | 0.395 |
| Technical competence × log (Technical competence) | 1.223 | 1.702 | 0.472 |
| Communication | −5.208 | 3.151 | 0.098 |
| Communication × log (Communication) | 2.253 | 1.401 | 0.108 |
| Contrast | Estimate | Standard Error | Odds Ratio | Lower 95% CI | Upper 95% CI | p-Value |
|---|---|---|---|---|---|---|
| Republican—Democrat | −0.918 | 0.460 | 0.399 | 0.119 | 1.343 | 0.275 |
| Republican—Independent | −0.762 | 0.397 | 0.467 | 0.164 | 1.330 | 0.330 |
| Republican—Other | 0.369 | 0.517 | 1.446 | 0.369 | 5.660 | 1.000 |
| Democrat—Independent | 0.156 | 0.473 | 1.169 | 0.336 | 4.068 | 1.000 |
| Democrat—Other | 1.287 | 0.586 | 3.621 | 0.772 | 16.978 | 0.168 |
| Independent—Other | 1.131 | 0.542 | 3.098 | 0.742 | 12.938 | 0.222 |
References
- Borchering, R.K.; Biggerstaff, M.; Brammer, L.; Budd, A.; Garg, S.; Fry, A.M.; Iuliano, A.D.; Reed, C. Responding to the return of influenza in the united states by applying centers for disease control and prevention surveillance, analysis, and modeling to inform understanding of seasonal influenza. JMIR Public Health Surveill. 2024, 10, e54340. [Google Scholar] [CrossRef]
- Iuliano, A.D.; Roguski, K.M.; Chang, H.H.; Muscatello, D.J.; Palekar, R.; Tempia, S.; Cohen, C.; Gran, J.M.; Schanzer, D.; Cowling, B.J. Estimates of global seasonal influenza-associated respiratory mortality: A modelling study. Lancet 2018, 391, 1285–1300. [Google Scholar] [CrossRef]
- Grohskopf, L.A. Prevention and control of seasonal influenza with vaccines: Recommendations of the Advisory Committee on Immunization Practices—United States, 2023–2024 influenza season. MMWR Recomm. Rep. 2023, 72, 1–25. [Google Scholar] [CrossRef]
- Melchinger, H.; Belgaumi, S.M.; Ahmed, N.; Omer, S.B.; Malik, A.A. Change in influenza vaccine uptake among adults in the United States from May 2020 to October 2024. PLoS Global Public Health 2025, 5, e0004756. [Google Scholar] [CrossRef]
- The Centers for Disease Control and Prevention. Flu Vaccination Coverage, United States, 2023–2024 Influenza Season. Available online: https://www.cdc.gov/fluvaxview/coverage-by-season/2023-2024.html (accessed on 13 September 2025).
- Rankings, A.s.H. Explore Flu Vaccination in Alabama. Available online: https://www.americashealthrankings.org/explore/measures/flu_vaccine/AL (accessed on 13 September 2025).
- Brewer, L.I.; Ommerborn, M.J.; Nguyen, A.L.; Clark, C.R. Structural inequities in seasonal influenza vaccination rates. BMC Public Health 2021, 21, 1166. [Google Scholar] [CrossRef]
- Parekh, T.; Javed, Z.; Khan, S.U.; Xue, H.; Nasir, K. Disparities in influenza vaccination coverage and associated factors among adults with cardiovascular disease, United States, 2011–2020. Prev. Chronic Dis. 2022, 19, E67. [Google Scholar] [CrossRef]
- Black, C.L. Vital signs: Influenza hospitalizations and vaccination coverage by race and ethnicity—United States, 2009–2010 through 2021–2022 influenza seasons. MMWR Morb. Mortal. Wkly. Rep. 2022, 71, 1366–1373. [Google Scholar] [CrossRef]
- Matthews, K.A. Health-related behaviors by urban-rural county classification—United States, 2013. MMWR Surveill. Summ. 2017, 66, 1–8. [Google Scholar] [CrossRef]
- Larson, H.J.; Jarrett, C.; Schulz, W.S.; Chaudhuri, M.; Zhou, Y.; Dube, E.; Schuster, M.; MacDonald, N.E.; Wilson, R. Measuring vaccine hesitancy: The development of a survey tool. Vaccine 2015, 33, 4165–4175. [Google Scholar] [CrossRef]
- Soveri, A.; Karlsson, L.C.; Antfolk, J.; Mäki, O.; Karlsson, L.; Karlsson, H.; Nolvi, S.; Karukivi, M.; Lindfelt, M.; Lewandowsky, S. Spillover effects of the COVID-19 pandemic on attitudes to influenza and childhood vaccines. BMC Public Health 2023, 23, 764. [Google Scholar] [CrossRef]
- Moore, R.; Rojo, M.O.; Purvis, R.S.; Marin, L.P.; Yáñez, J.; Reece, S.; Wells, C.; Vaughn, B.; McElfish, P.A. Overcoming barriers and enhancing facilitators to COVID-19 vaccination in the Hispanic community. BMC Public Health 2022, 22, 2393. [Google Scholar] [CrossRef]
- Syed, S.T.; Gerber, B.S.; Sharp, L.K. Traveling towards disease: Transportation barriers to health care access. J. Community Health 2013, 38, 976–993. [Google Scholar] [CrossRef]
- Wolfe, M.K.; McDonald, N.C.; Holmes, G.M. Transportation barriers to health care in the United States: Findings from the national health interview survey, 1997–2017. Am. J. Public Health 2020, 110, 815–822. [Google Scholar] [CrossRef]
- National Rural Health Association. Rural Workforce Recruitment and Retention Factors. Policy Brief. 2025. Available online: https://www.ruralhealth.us/nationalruralhealth/media/documents/advocacy/nrha-policy-brief-workforce-retention-factors-final-3-7-25.pdf (accessed on 4 October 2025).
- Nofzinger, T.B.; Huang, T.T.; Lingat, C.E.R.; Amonkar, G.M.; Edwards, E.E.; Yu, A.; Smith, A.D.; Gayed, N.; Gaddey, H.L. Vaccine fatigue and influenza vaccination trends across Pre-, Peri-, and Post-COVID-19 periods in the United States using epic’s cosmos database. PLoS ONE 2025, 20, e0326098. [Google Scholar] [CrossRef]
- Singleton, B.A.; Al-Dahir, S.; Gillard, C.; Earls, M.; Bommarito, J.; Duhe, M.; Phi, K. Perceived role, identity and experiences of pharmacists and the potential impact on COVID-19 vaccine uptake per Louisiana region: A prospective cohort study. Int. J. Environ. Res. Public Health 2023, 20, 6459. [Google Scholar] [CrossRef] [PubMed]
- Zhang, S. An optimal vaccine allocation model considering vaccine hesitancy and efficacy rates among populations. IEEE Access 2023, 11, 27693–27701. [Google Scholar] [CrossRef]
- Henning-Smith, C.E.; Hernandez, A.M.; Hardeman, R.R.; Ramirez, M.R.; Kozhimannil, K.B. Rural counties with majority black or indigenous populations suffer the highest rates of premature death in the US. Health Aff. 2019, 38, 2019–2026. [Google Scholar] [CrossRef]
- Yue, Z.; McCormick, N.P.; Ezeala, O.M.; Durham, S.H.; Westrick, S.C. EMSIG: Uncovering Factors Influencing COVID-19 Vaccination Across Different Subgroups Characterized by Embedding-Based Spatial Information Gain. Vaccines 2024, 12, 1253. [Google Scholar] [CrossRef]
- Alabama Department of Public Health. Estimated Population by Agegroup, Race and Sex Alabama. 2023. Available online: https://www.alabamapublichealth.gov/healthstats/assets/estimated-population-2023.pdf (accessed on 4 October 2025).
- Yang, D.; Dalton, J.E. A unified approach to measuring the effect size between two groups using SAS. In SAS Global Forum; SAS: Cary, NC, USA, 2025; pp. 1–6. [Google Scholar]
- Austin, P.C. Balance diagnostics for comparing the distribution of baseline covariates between treatment groups in propensity-score matched samples. Stat. Med. 2009, 28, 3083–3107. [Google Scholar] [CrossRef]
- Kim, J.H. Multicollinearity and misleading statistical results. Korean J. Anesthesiol. 2019, 72, 558–569. [Google Scholar] [CrossRef]
- Jain, B.; Paguio, J.A.; Yao, J.S.; Jain, U.; Dee, E.C.; Celi, L.A.; Ojikutu, B. Rural–urban differences in influenza vaccination among adults in the United States, 2018–2019. Am. J. Public Health 2022, 112, 304–307. [Google Scholar] [CrossRef]
- Meit, M.; Knudson, A.; Gilbert, T.; Yu, A.T.-C.; Tanenbaum, E.; Ormson, E.; Popat, S. The 2014 Update of the Rural-Urban Chartbook; Rural Health Reform Policy Research Center: Bethesda, MD, USA, 2014; Volume 10. [Google Scholar]
- Schmid, P.; Rauber, D.; Betsch, C.; Lidolt, G.; Denker, M.-L. Barriers of influenza vaccination intention and behavior–a systematic review of influenza vaccine hesitancy, 2005–2016. PLoS ONE 2017, 12, e0170550. [Google Scholar] [CrossRef]
- Zhang, X.; Li, L.; Zhang, Q.; Le, L.H.; Wu, Y. Physician empathy in doctor-patient communication: A systematic review. Health Commun. 2024, 39, 1027–1037. [Google Scholar] [CrossRef]
- Liu, X.; Zeng, J.; Li, L.; Wang, Q.; Chen, J.; Ding, L. The influence of Doctor-Patient communication on patients’ trust: The role of Patient-Physician consistency and perceived threat of disease. Psychol. Res. Behav. Manag. 2024, 17, 2727–2737. [Google Scholar] [CrossRef]
- Freimuth, V.S.; Jamison, A.M.; An, J.; Hancock, G.R.; Quinn, S.C. Determinants of trust in the flu vaccine for African Americans and Whites. Soc. Sci. Med. 2017, 193, 70–79. [Google Scholar] [CrossRef]
- Viskupič, F.; Wiltse, D.L.; Meyer, B.A. Trust in physicians and trust in government predict COVID-19 vaccine uptake. Social Science Quarterly 2022, 103, 509–520. [Google Scholar] [CrossRef]
- Kaoiean, S.; Kittikraisak, W.; Suntarattiwong, P.; Ditsungnoen, D.; Phadungkiatwatana, P.; Srisantiroj, N.; Asavapiriyanont, S.; Chotpitayasunondh, T.; Dawood, F.S.; Lindblade, K.A. Predictors for influenza vaccination among Thai pregnant woman: The role of physicians in increasing vaccine uptake. Influenza Other Respi. Viruses 2019, 13, 582–592. [Google Scholar] [CrossRef]
- Santibanez, T.A.; Mootrey, G.T.; Euler, G.L.; Janssen, A.P. Behavior and beliefs about influenza vaccine among adults aged 5064 years. Am. J. Health Behav. 2010, 34, 77–89. [Google Scholar] [CrossRef]
- Murthy, B.P. Disparities in COVID-19 vaccination coverage between urban and rural counties—United States, December 14, 2020–April 10, 2021. MMWR Morb. Mortal. Wkly. Rep. 2021, 70, 759–764. [Google Scholar] [CrossRef]
- Martinelli, M.; Veltri, G.A. Shared understandings of vaccine hesitancy: How perceived risk and trust in vaccination frame individuals’ vaccine acceptance. PLoS ONE 2022, 17, e0276519. [Google Scholar] [CrossRef]
- Janssen, C.; Mosnier, A.; Gavazzi, G.; Combadière, B.; Crepey, P.; Gaillat, J.; Launay, O.; Botelho-Nevers, E. Coadministration of seasonal influenza and COVID-19 vaccines: A systematic review of clinical studies. Hum. Vaccin. Immunother. 2022, 18, 2131166. [Google Scholar] [CrossRef]
- Sandlin, E.W. The politicization of influenza: Partisan changes in flu vaccination before and after COVID-19. J. Public Health 2025, 47, 317–325. [Google Scholar] [CrossRef]
- Bolsen, T.; Palm, R. Politicization and COVID-19 vaccine resistance in the US. Prog. Mol. Biol. Transl. Sci. 2022, 188, 81–100. [Google Scholar] [PubMed]
- Gaskin, C.M.; Woods, D.R.; Ghosh, S.; Watson, S.; Huber, L.R. The Effect of Income Disparities on Influenza Vaccination Coverage in the United States. Public Health Rep. 2023, 138, 85–90. [Google Scholar] [CrossRef] [PubMed]
- Fox, J.B.; Shaw, F.E. Relationship of income and health care coverage to receipt of recommended clinical preventive services by adults—United States, 2011–2012. MMWR Morb. Mortal. Wkly. Rep. 2014, 63, 666–670. [Google Scholar] [PubMed]
- Lau, J.S.; Adams, S.H.; Irwin, C.E.; Ozer, E.M. Receipt of Preventive Health Services in Young Adults. J. Adolesc. Health 2013, 52, 42–49. [Google Scholar] [CrossRef]
- U.S. Department of Health and Human Services, Office of Disease Prevention and Health Promotion. Healthy People 2020: Increase the Proportion of People Who Get the Flu Vaccine Every Year (IID-90). Available online: https://health.gov/healthypeople/objectives-and-data/browse-objectives/vaccination/increase-proportion-people-who-get-flu-vaccine-every-year-iid-09 (accessed on 13 September 2025).


| Variable | n (%) |
|---|---|
| Sex | |
| Female | 217 (50.9) |
| Male | 209 (49.1) |
| Race | |
| White | 328 (77.1) |
| Non-white * | 98 (22.9) |
| Ethnicity | |
| Not Hispanic or Latino | 403 (94.6) |
| Hispanic or Latino | 23 (5.4) |
| Age | |
| 18–24 | 38 (8.9) |
| 25–34 | 68 (15.9) |
| 35–44 | 87 (20.3) |
| 45–54 | 84 (19.7) |
| 55–64 | 65 (15.3) |
| 65+ | 85 (19.9) |
| Political affiliation | |
| Republican | 185 (43.5) |
| Independent | 116 (27.3) |
| Democrat | 58 (13.5) |
| Other | 67 (15.7) |
| Education | |
| Less than high school | 30 (7.1) |
| High school diploma or graduate equivalency degree | 231 (54.2) |
| Associate degree or vocational certificate | 107 (25.0) |
| 4-year bachelor’s or higher | 59 (13.7) |
| Household income | |
| $0–$30,000 | 165 (38.8) |
| $30,001–$60,000 | 129 (30.3) |
| $60,001–$90,000 | 71 (16.6) |
| $90,001–$120,000 | 25 (5.8) |
| $120,000+ | 19 (4.4) |
| I choose not to say | 18 (4.1) |
| Employment status | |
| Employed | 182 (42.8) |
| Retired | 97 (22.7) |
| Disabled | 59 (13.9) |
| Not employed | 88 (20.6) |
| Presence of chronic conditions | |
| Yes | 289 (67.8) |
| No | 137 (32.2) |
| Previously received a COVID-19 vaccine in the past | |
| Yes | 206 (48.4) |
| No | 220 (51.6) |
| Confidence in understanding health information | |
| High | 232 (54.5) |
| Moderate | 140 (32.8) |
| Low | 54 (12.8) |
| Factor a | Flu Vaccine Uptake a | p-Value | |
|---|---|---|---|
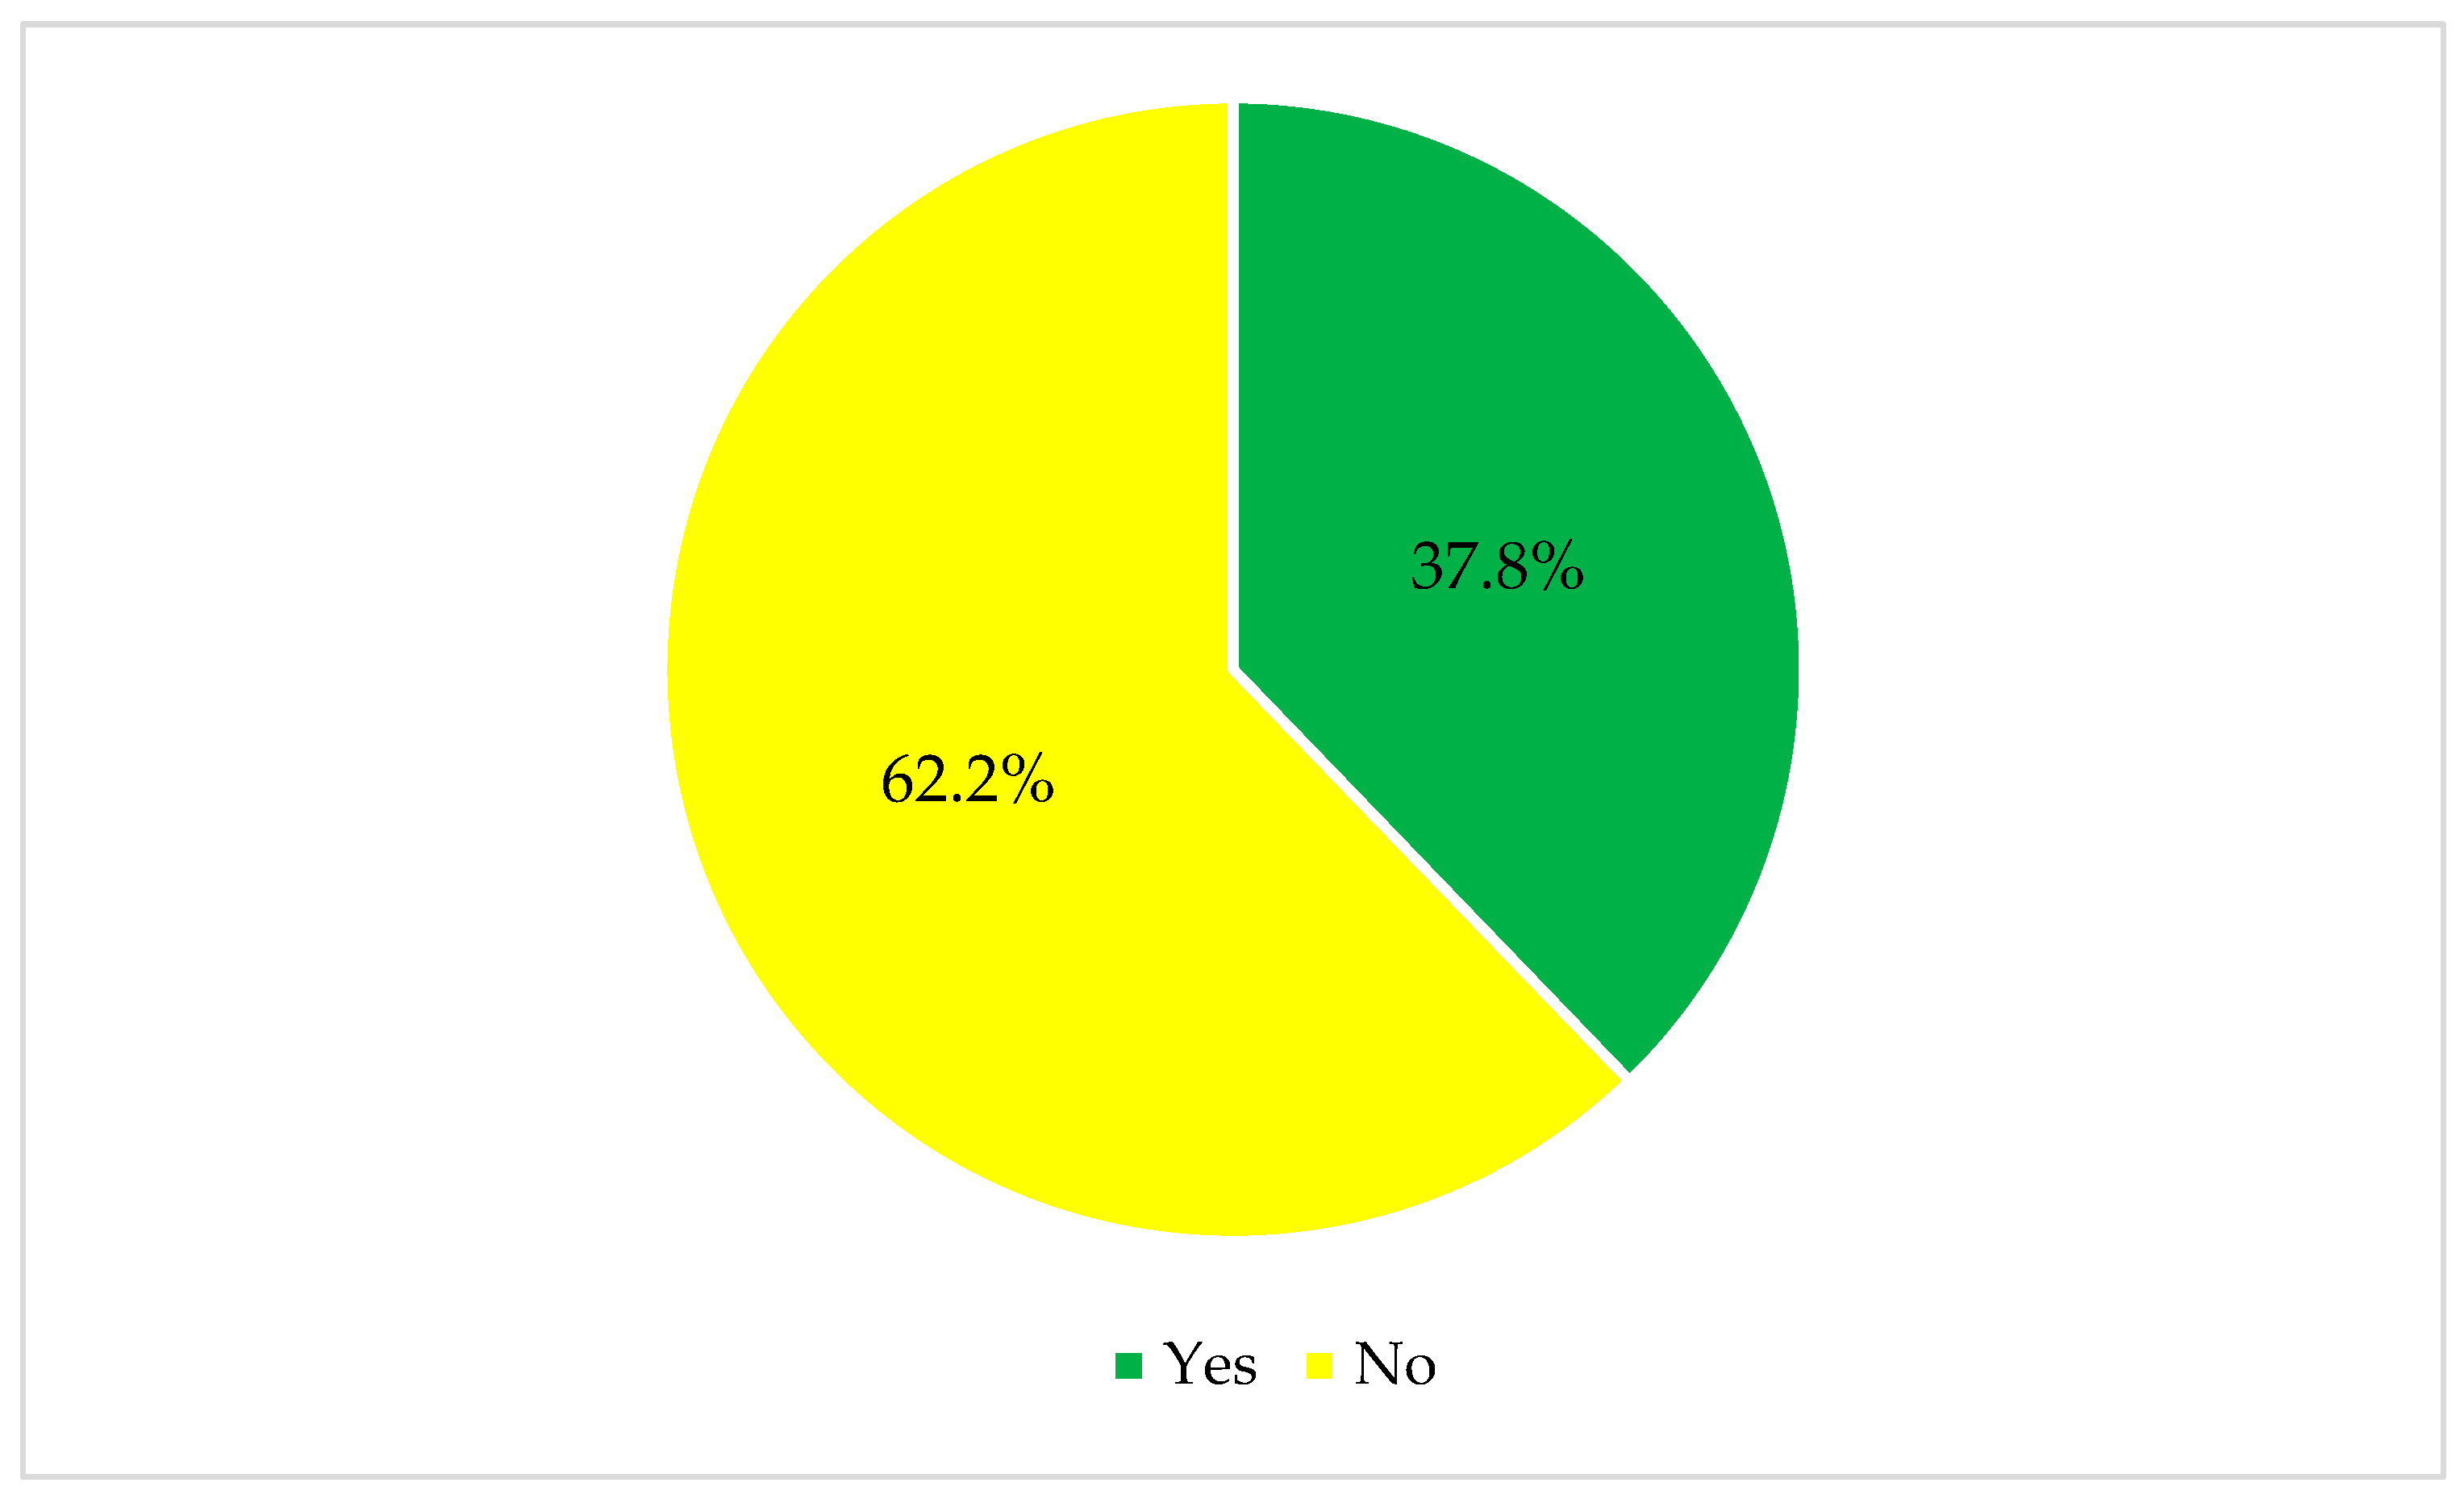
| Yes n = 161 (37.8%) n (%) | No n = 265 (62.2%) n (%) | ||
| Sex | 0.020 | ||
| Female | 70 (43.5) | 146 (55.1) | |
| Male | 91 (56.5) | 119 (44.9) | |
| Race | 0.554 | ||
| White | 121 (75.6) | 207 (78.1) | |
| Non-white b | 39 (24.4) | 58 (21.9) | |
| Ethnicity | 0.880 | ||
| Not Hispanic or Latino | 151 (94.4) | 251 (94.7) | |
| Hispanic or Latino | 9 (5.6) | 14 (5.3) | |
| Age | <0.001 | ||
| 18–24 | 13 (8.1) | 25 (9.4) | |
| 25–34 | 19 (11.8) | 49 (18.4) | |
| 35–44 | 15 (9.3) | 72 (27.1) | |
| 45–54 | 23 (14.3) | 61 (22.9) | |
| 55–64 | 31 (19.3) | 35 (13.2) | |
| 65+ | 60 (37.3) | 24 (9.0) | |
| Political affiliation | <0.001 | ||
| Republican | 67 (41.6) | 118 (44.5) | |
| Independent | 49 (30.4) | 67 (25.3) | |
| Democrat | 33(20.5) | 25 (9.4) | |
| Other | 12 (7.5) | 55 (20.8) | |
| Education | <0.001 | ||
| Less than high school | 5 (3.1) | 25 (9.4) | |
| High school diploma or graduate equivalency degree | 64 (39.8) | 167 (62.8) | |
| Associate degree or vocational certificate | 60 (37.3) | 47 (17.7) | |
| 4-year bachelor’s or higher | 32 (19.9) | 27 (10.2) | |
| Household income | 0.006 | ||
| $0–$30,000 | 47 (29.2) | 119 (44.7) | |
| $30,001–$60,000 | 53 (32.9) | 76 (28.6) | |
| $60,001–$90,000 | 31 (19.3) | 39 (14.7) | |
| $90,001–$120,000 | 13 (8.1) | 12 (4.5) | |
| $120,000+ | 12 (7.5) | 7 (2.6) | |
| I choose not to say | 5 (3.1) | 13 (4.9) | |
| Employment status a | <0.001 | ||
| Employed | 60 (37.3) | 122 (46.0) | |
| Retired | 63 (39.1) | 34 (12.8) | |
| Disabled | 24 (14.9) | 35 (13.2) | |
| Not employed | 14 (8.7) | 74 (27.9) | |
| Presence of chronic conditions | 0.002 | ||
| Yes | 124 (77.0) | 165 (62.3) | |
| No | 37 (23.0) | 100 (37.7) | |
| Previously received a COVID-19 vaccine in the past a | <0.001 | ||
| Yes | 137 (85.1) | 69 (26.0) | |
| No | 24 (14.9) | 196 (74.0) | |
| Confidence in understanding health information | 0.973 | ||
| High | 88 (54.7) | 144 (54.3) | |
| Moderate | 52 (32.3) | 88 (33.2) | |
| Low | 21 (13.0) | 33 (12.5) | |
| Trust Scale | Odds Ratio a | 95% Confidence Interval | p Value | |
|---|---|---|---|---|
| Lower | Upper | |||
| Trust in Public Health | ||||
| Beneficence | 2.291 | 1.553 | 3.378 | <0.001 |
| Competence | 2.200 | 1.544 | 3.133 | <0.001 |
| Trust in doctors in general | ||||
| Communication competency | 2.444 | 1.781 | 3.352 | <0.001 |
| Fidelity | 1.599 | 1.255 | 2.037 | <0.001 |
| Systems trust | 1.414 | 1.140 | 1.753 | 0.002 |
| Confidentiality | 1.336 | 1.047 | 1.705 | 0.020 |
| Fairness | 1.381 | 1.083 | 1.761 | 0.009 |
| Stigma-based discrimination | 1.434 | 1.129 | 1.821 | 0.003 |
| Global trust | 1.841 | 1.442 | 2.351 | <0.001 |
| Trust in Community Pharmacists | ||||
| Benevolence | 1.634 | 1.213 | 2.200 | 0.001 |
| Technical competence | 1.403 | 1.016 | 1.937 | 0.039 |
| Communication | 1.369 | 1.015 | 1.846 | 0.040 |
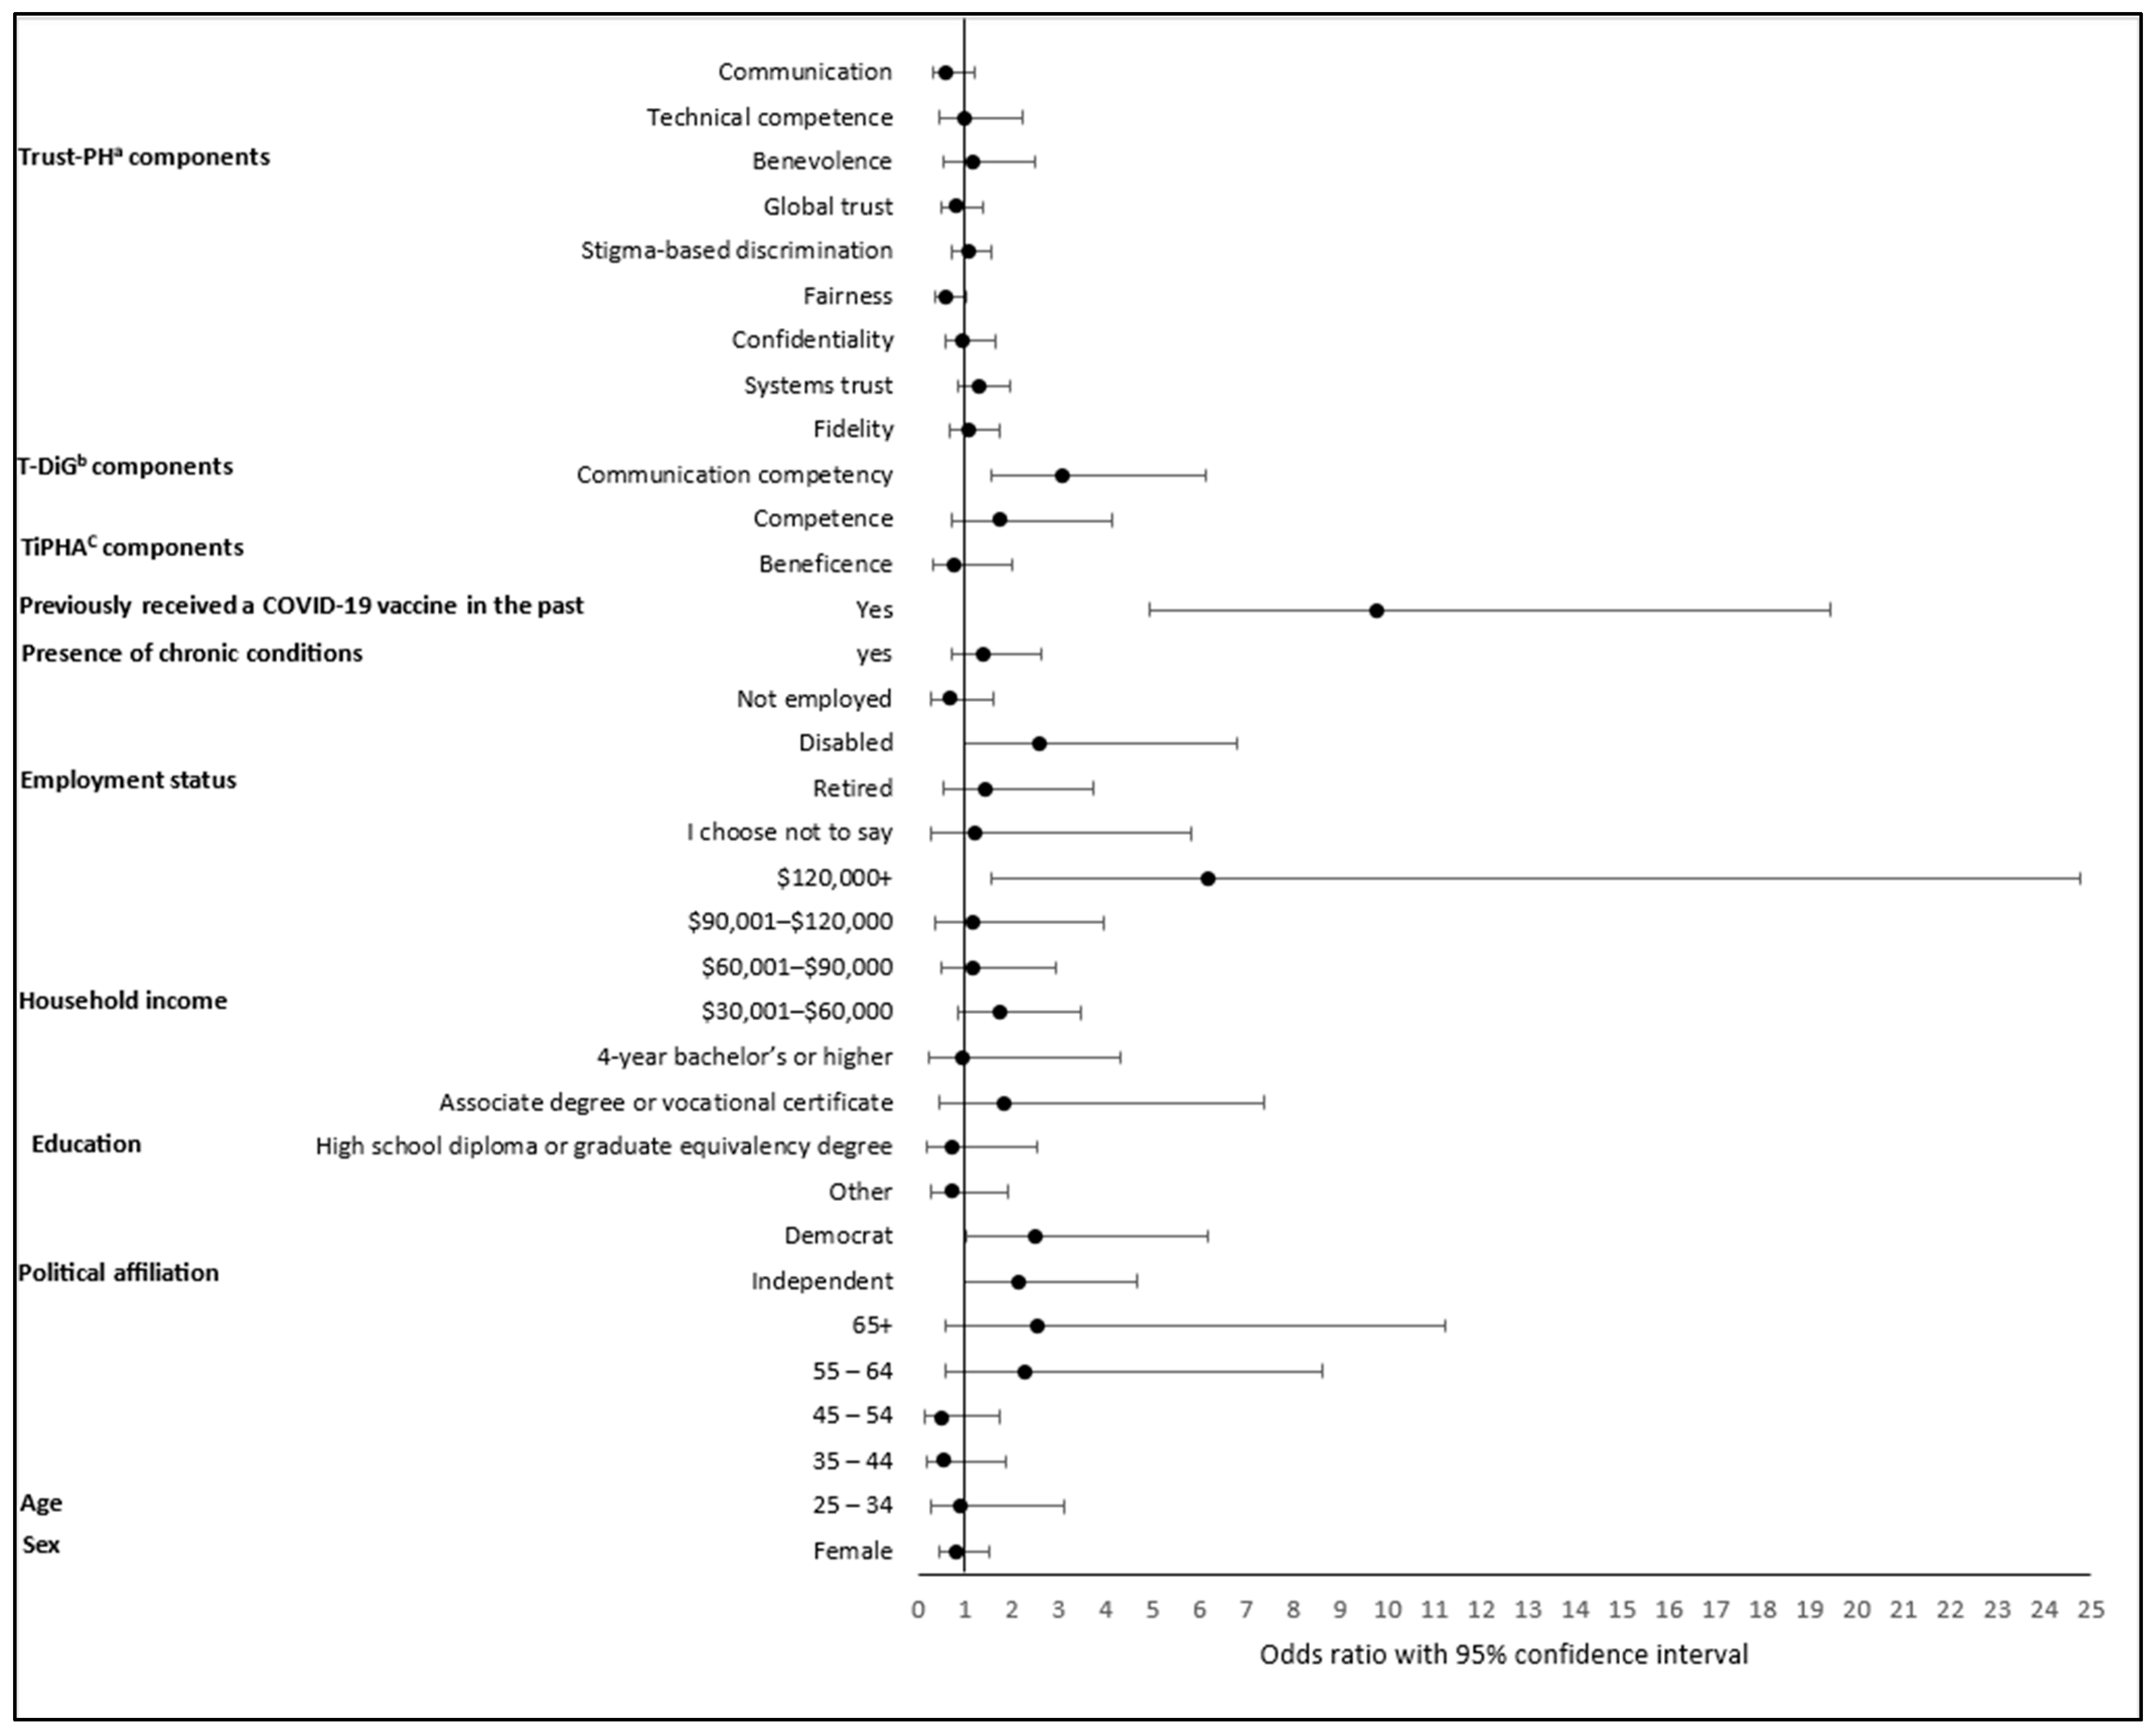
| Factor | Adjusted Odds Ratio a | 95% Confidence Interval | p Value | |
|---|---|---|---|---|
| Lower | Upper | |||
| Sex (Ref = male) | ||||
| Female | 0.809 | 0.438 | 1.493 | 0.498 |
| Age (Ref = 18–24) | ||||
| 25–34 | 0.901 | 0.260 | 3.124 | 0.869 |
| 35–44 | 0.551 | 0.161 | 1.883 | 0.342 |
| 45–54 | 0.525 | 0.158 | 1.751 | 0.295 |
| 55–64 | 2.258 | 0.593 | 8.596 | 0.233 |
| 65+ | 2.531 | 0.569 | 11.257 | 0.223 |
| Political affiliation (Ref = republican) | ||||
| Independent | 2.142 | 0.984 | 4.664 | 0.055 |
| Democrat | 2.504 | 1.017 | 6.164 | 0.046 |
| Other | 0.692 | 0.251 | 1.906 | 0.476 |
| Education (Ref = less than high school) | ||||
| High school diploma or graduate equivalency degree | 0.705 | 0.196 | 2.544 | 0.594 |
| Associate degree or vocational certificate | 1.837 | 0.458 | 7.370 | 0.391 |
| 4-year bachelor’s or higher | 0.973 | 0.220 | 4.303 | 0.971 |
| Income (Ref = $0–$30,000) | ||||
| $30,001–$60,000 | 1.723 | 0.854 | 3.474 | 0.128 |
| $60,001–$90,000 | 1.194 | 0.489 | 2.916 | 0.697 |
| $90,001–$120,000 | 1.164 | 0.342 | 3.964 | 0.809 |
| $120,000+ | 6.172 | 1.538 | 24.769 | 0.010 |
| I choose not to say | 1.220 | 0.255 | 5.840 | 0.804 |
| Employment (Ref = employed) | ||||
| Retired | 1.429 | 0.548 | 3.727 | 0.466 |
| Disabled | 2.571 | 0.974 | 6.785 | 0.057 |
| Not employed | 0.672 | 0.285 | 1.582 | 0.362 |
| Presence of chronic conditions (Ref = yes) | ||||
| no | 1.370 | 0.711 | 2.643 | 0.347 |
| Previously received a COVID-19 vaccine in the past (Ref = no) | ||||
| Yes | 9.790 | 4.923 | 19.467 | <0.001 |
| Trust in Public Health | ||||
| Beneficence | 0.782 | 0.303 | 2.019 | 0.611 |
| Competence | 1.722 | 0.714 | 4.154 | 0.226 |
| Trust in doctors in general | ||||
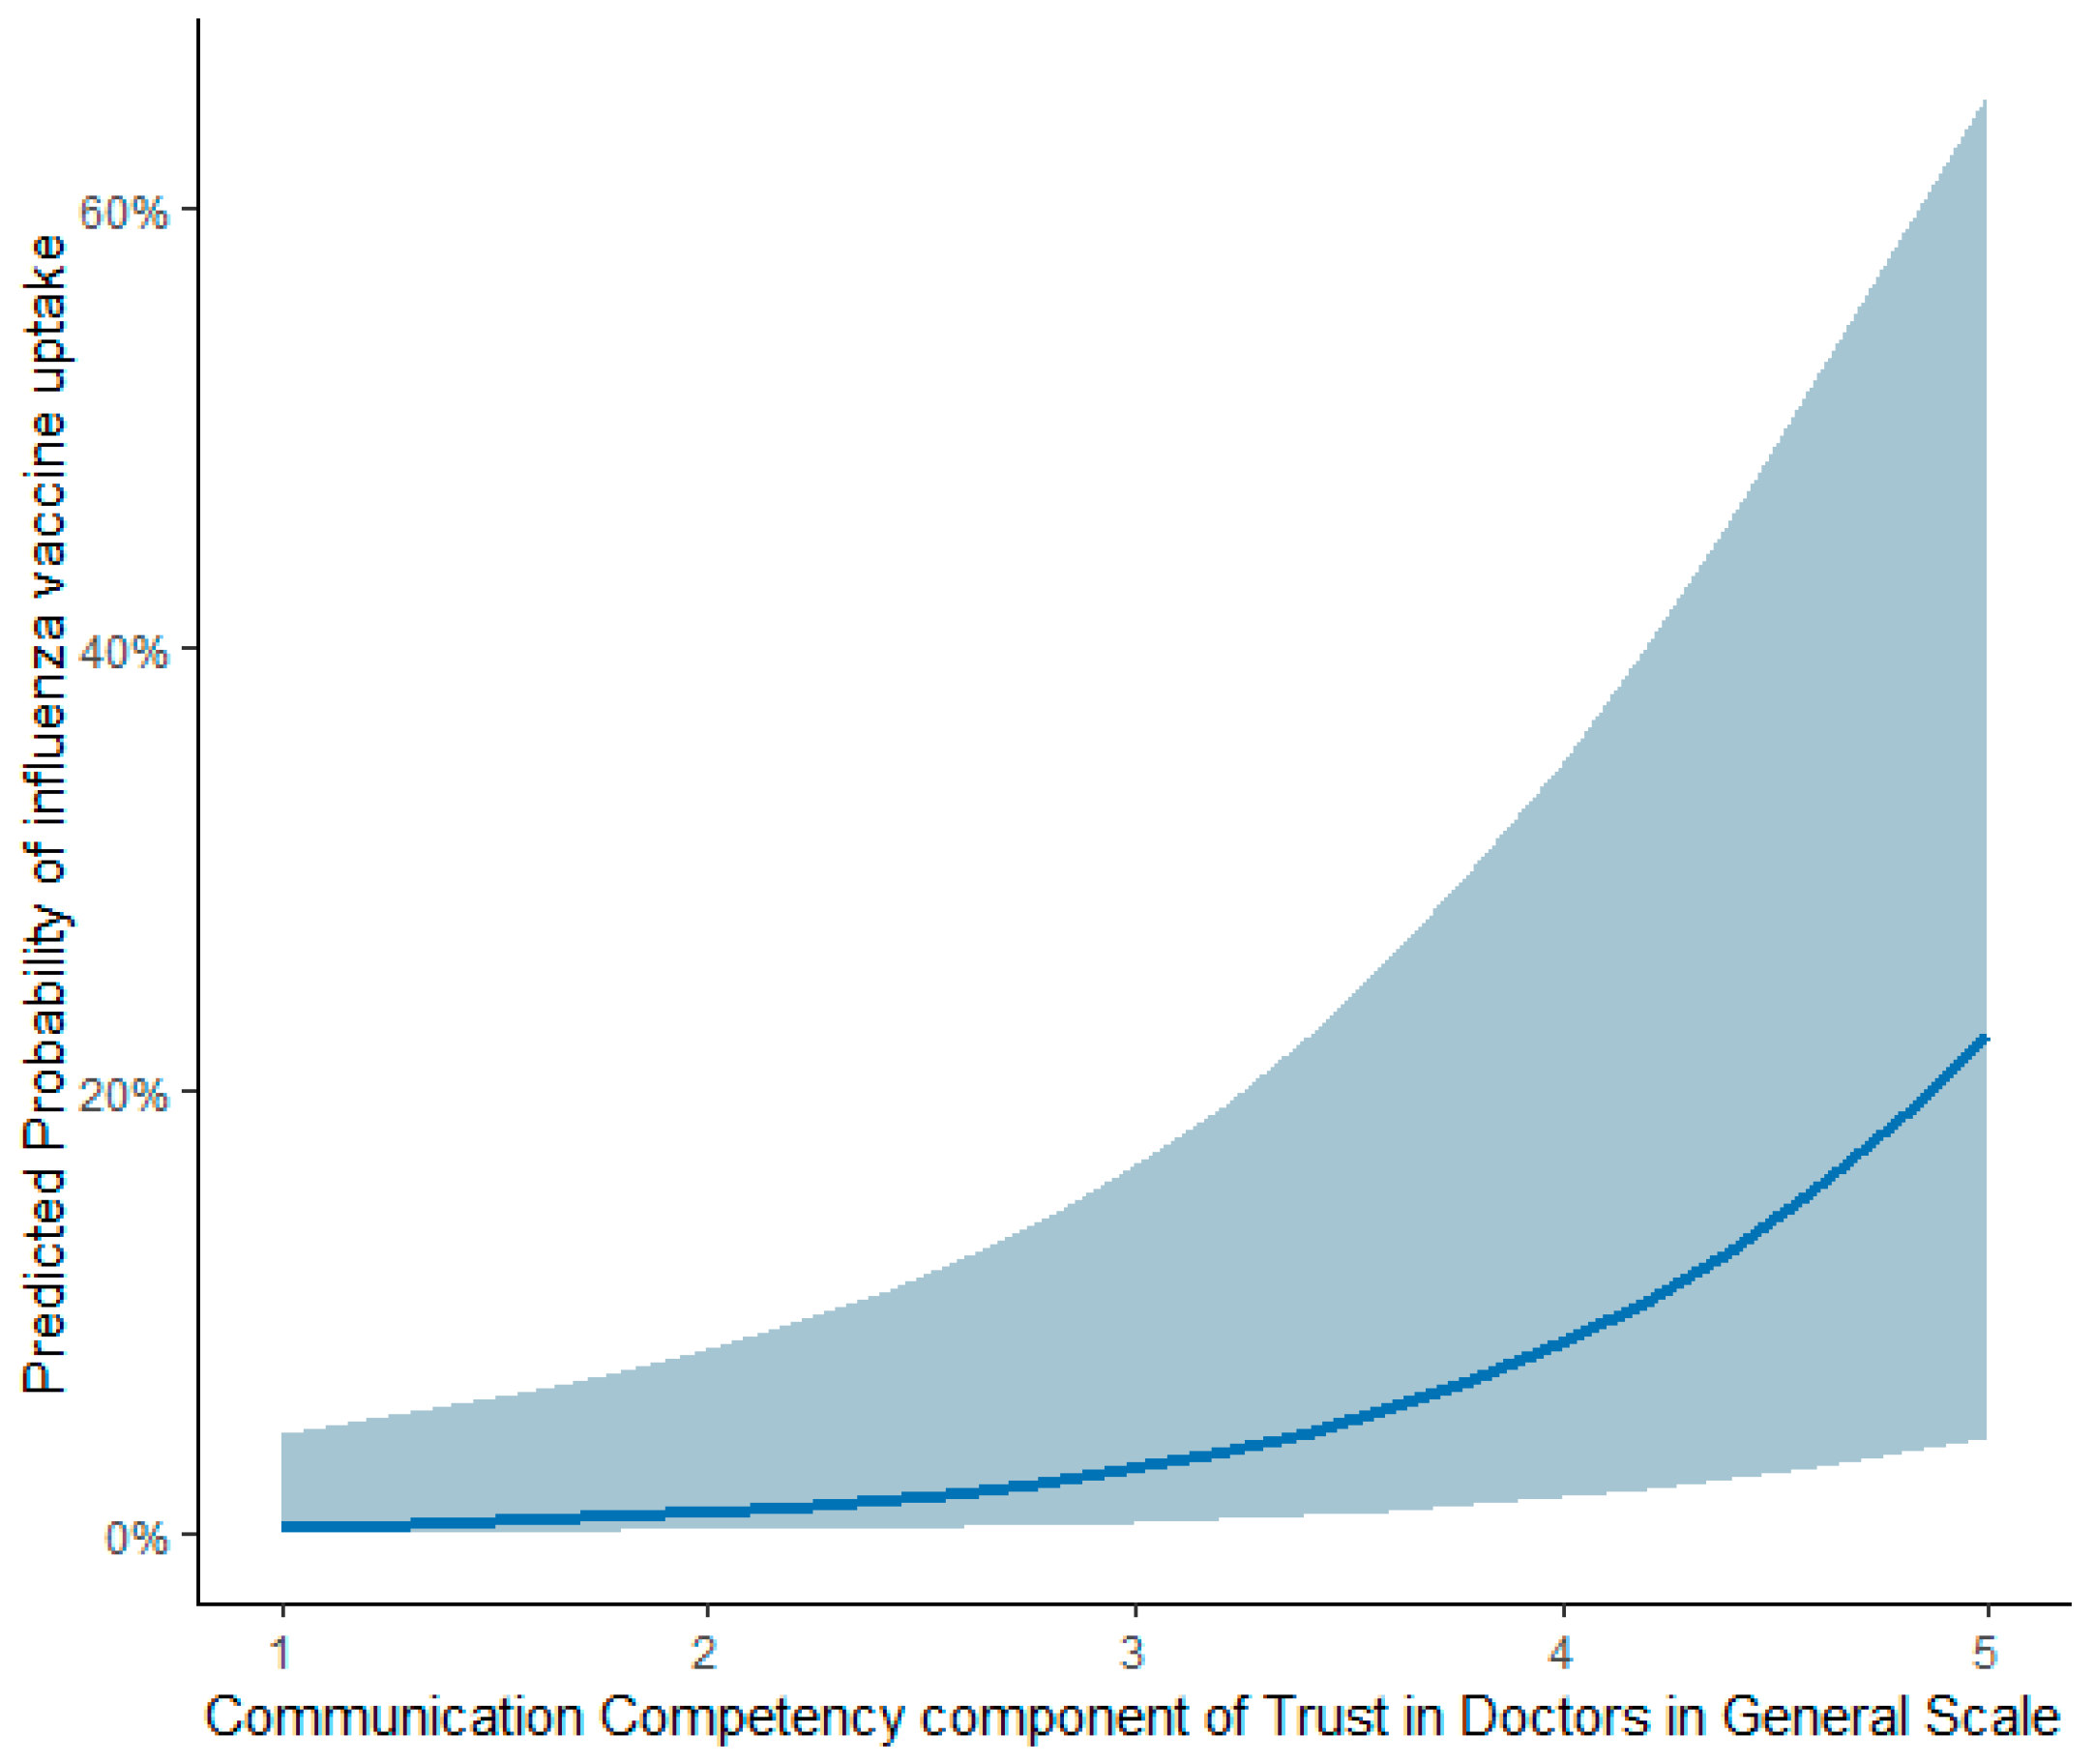
| Communication competency | 3.090 | 1.560 | 6.118 | 0.001 |
| Fidelity | 1.088 | 0.688 | 1.718 | 0.719 |
| Systems trust | 1.295 | 0.852 | 1.967 | 0.227 |
| Confidentiality | 0.973 | 0.578 | 1.638 | 0.919 |
| Fairness | 0.589 | 0.344 | 1.010 | 0.055 |
| Stigma-based discrimination | 1.046 | 0.701 | 1.561 | 0.824 |
| Global trust | 0.812 | 0.479 | 1.375 | 0.438 |
| Trust in Community Pharmacists | ||||
| Benevolence | 1.152 | 0.530 | 2.504 | 0.721 |
| Technical competence | 0.983 | 0.438 | 2.205 | 0.966 |
| Communication | 0.601 | 0.300 | 1.204 | 0.151 |
Disclaimer/Publisher’s Note: The statements, opinions and data contained in all publications are solely those of the individual author(s) and contributor(s) and not of MDPI and/or the editor(s). MDPI and/or the editor(s) disclaim responsibility for any injury to people or property resulting from any ideas, methods, instructions or products referred to in the content. |
© 2025 by the authors. Licensee MDPI, Basel, Switzerland. This article is an open access article distributed under the terms and conditions of the Creative Commons Attribution (CC BY) license (https://creativecommons.org/licenses/by/4.0/).
Share and Cite
Hamzat, H.; Ezeala, O.M.; Durham, S.H.; Qian, J.; Westrick, S.C. Determinants of Influenza Vaccine Uptake Among Rural Populations in a Southeastern U.S. State. Vaccines 2025, 13, 1208. https://doi.org/10.3390/vaccines13121208
Hamzat H, Ezeala OM, Durham SH, Qian J, Westrick SC. Determinants of Influenza Vaccine Uptake Among Rural Populations in a Southeastern U.S. State. Vaccines. 2025; 13(12):1208. https://doi.org/10.3390/vaccines13121208
Chicago/Turabian StyleHamzat, Hanifat, Oluchukwu M. Ezeala, Spencer H. Durham, Jingjing Qian, and Salisa C. Westrick. 2025. "Determinants of Influenza Vaccine Uptake Among Rural Populations in a Southeastern U.S. State" Vaccines 13, no. 12: 1208. https://doi.org/10.3390/vaccines13121208
APA StyleHamzat, H., Ezeala, O. M., Durham, S. H., Qian, J., & Westrick, S. C. (2025). Determinants of Influenza Vaccine Uptake Among Rural Populations in a Southeastern U.S. State. Vaccines, 13(12), 1208. https://doi.org/10.3390/vaccines13121208