Influenza Vaccine Uptake in Italy—The 2022–2023 Seasonal Influenza Vaccination Campaign in Italy: An Update from the OBVIOUS Project

 ,
,  , ,
, ,  ,
,  , ,
, ,  , , ,
, , , 
 and
and
Abstract
1. Introduction
2. Materials and Methods
Statistical Analysis
3. Results
3.1. Sample’s Sociodemographic Characteristics
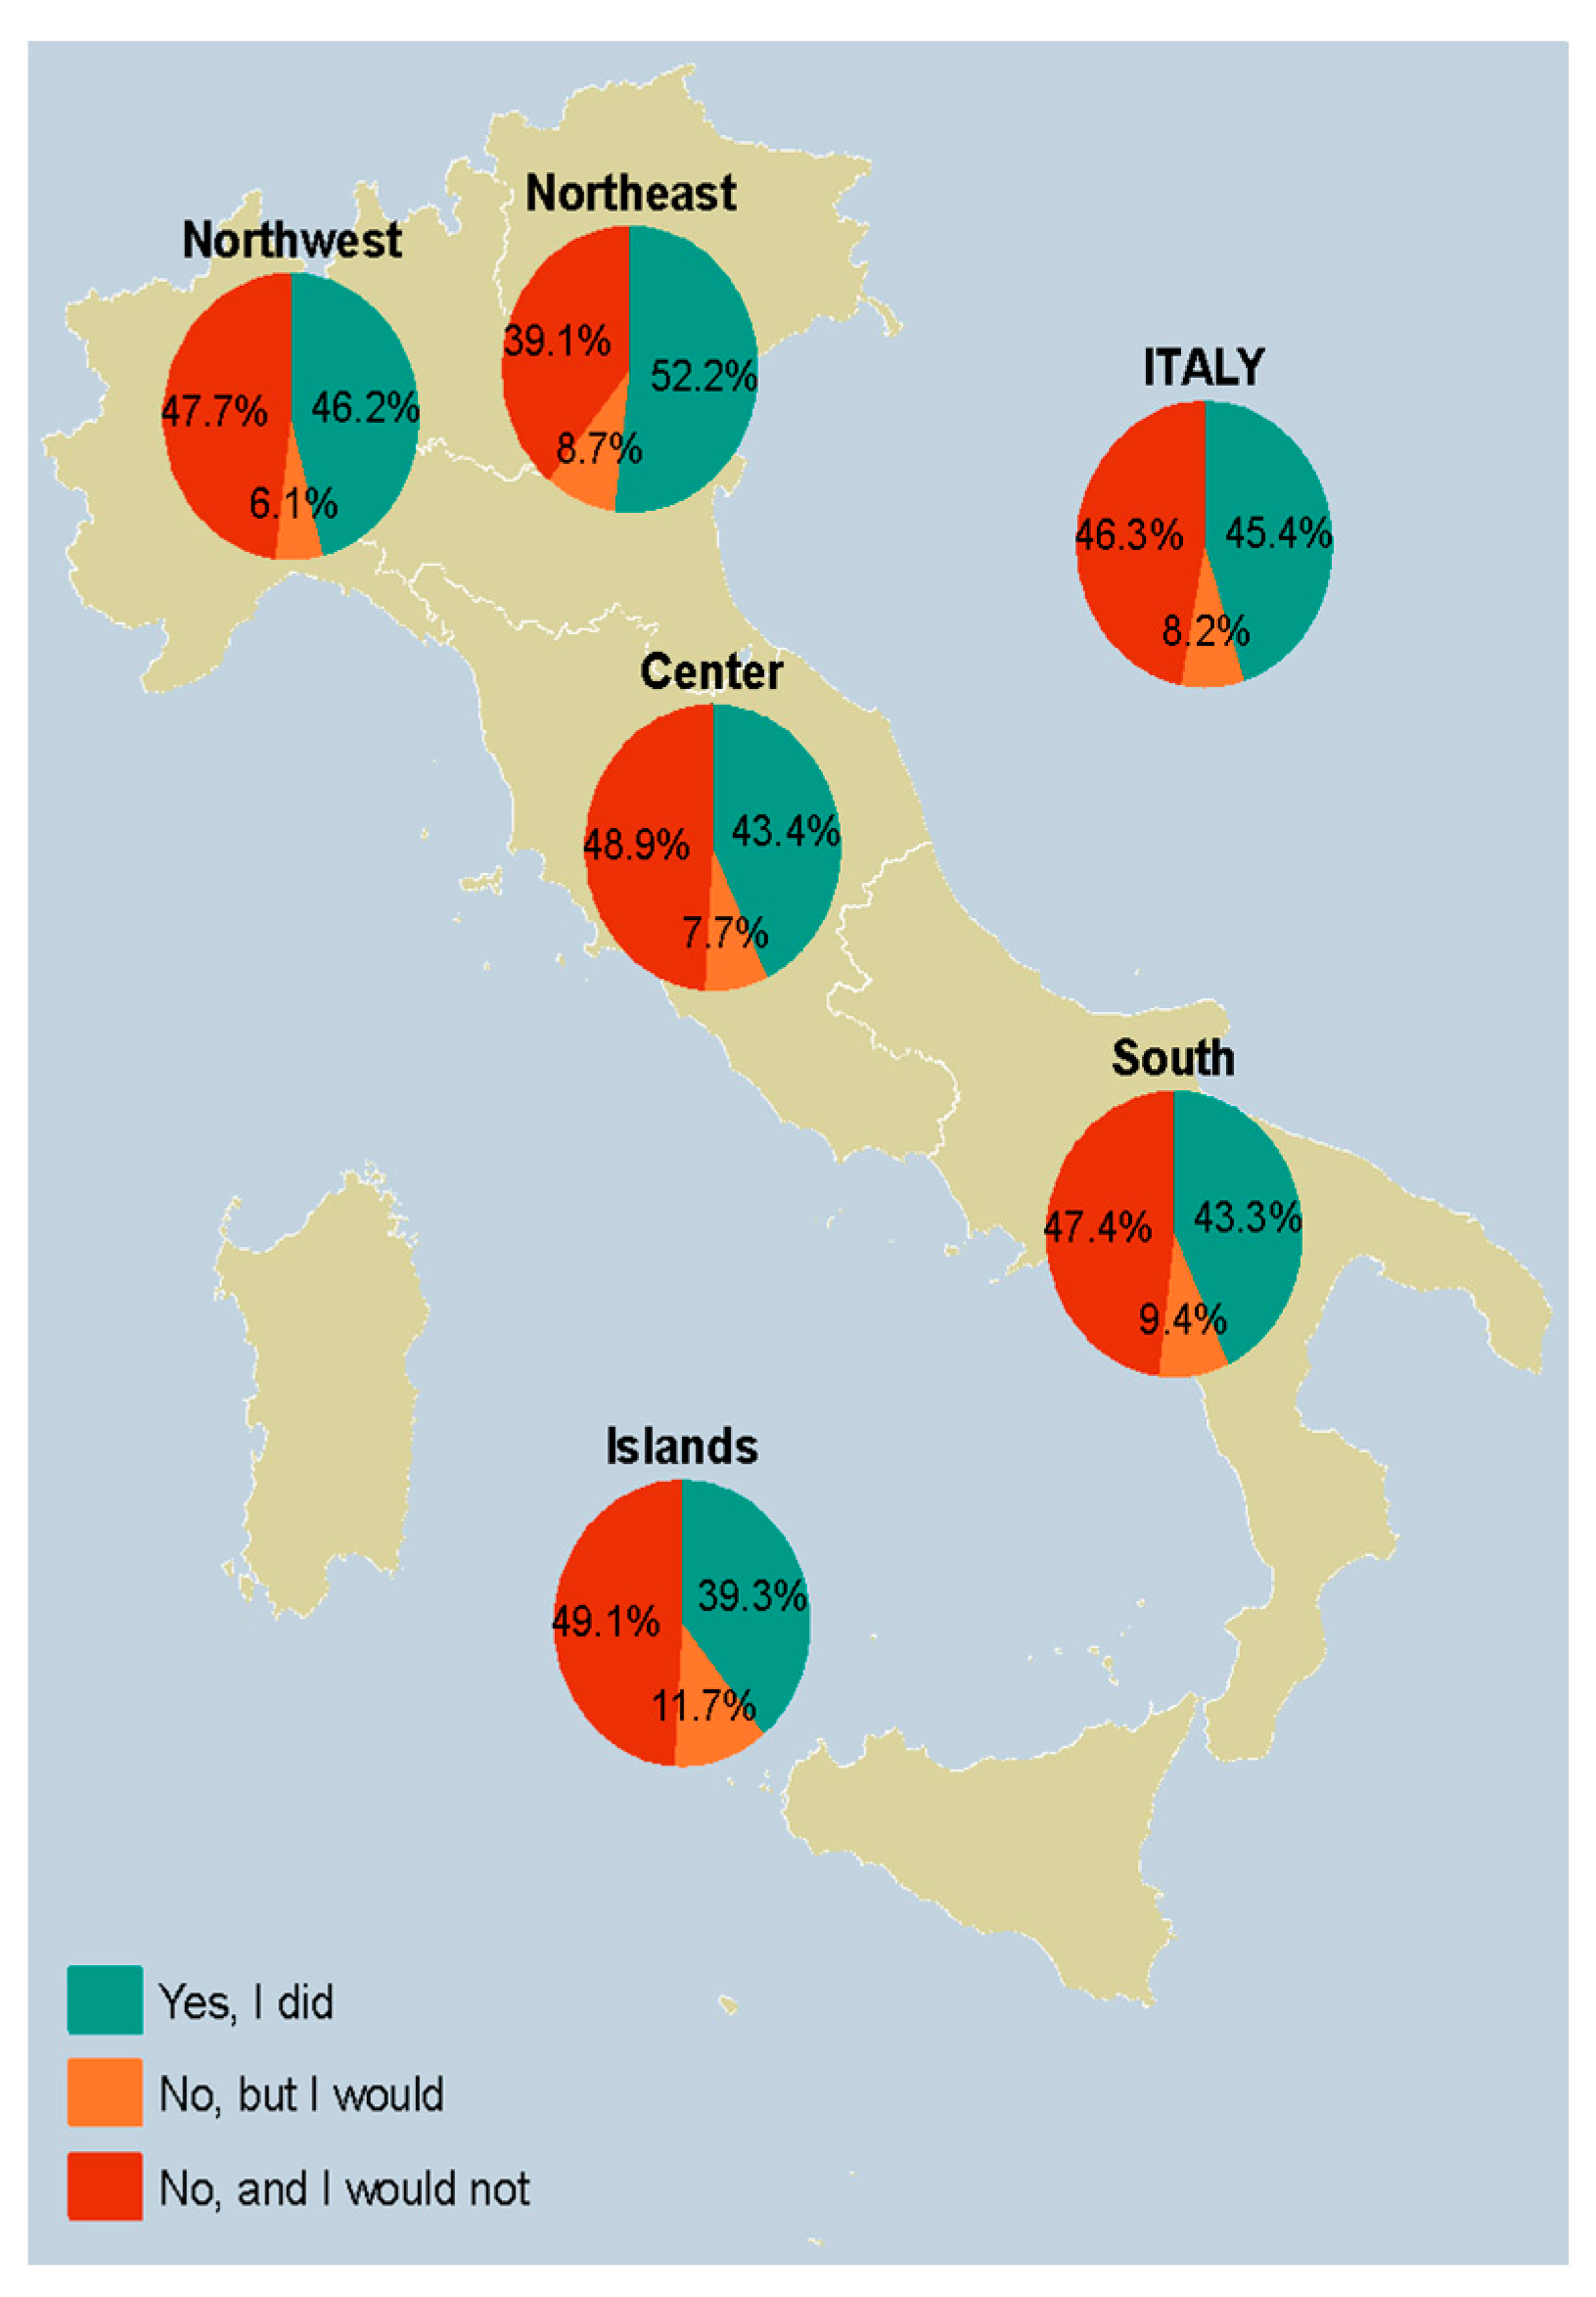
3.2. Seasonal Influenza Vaccination Status
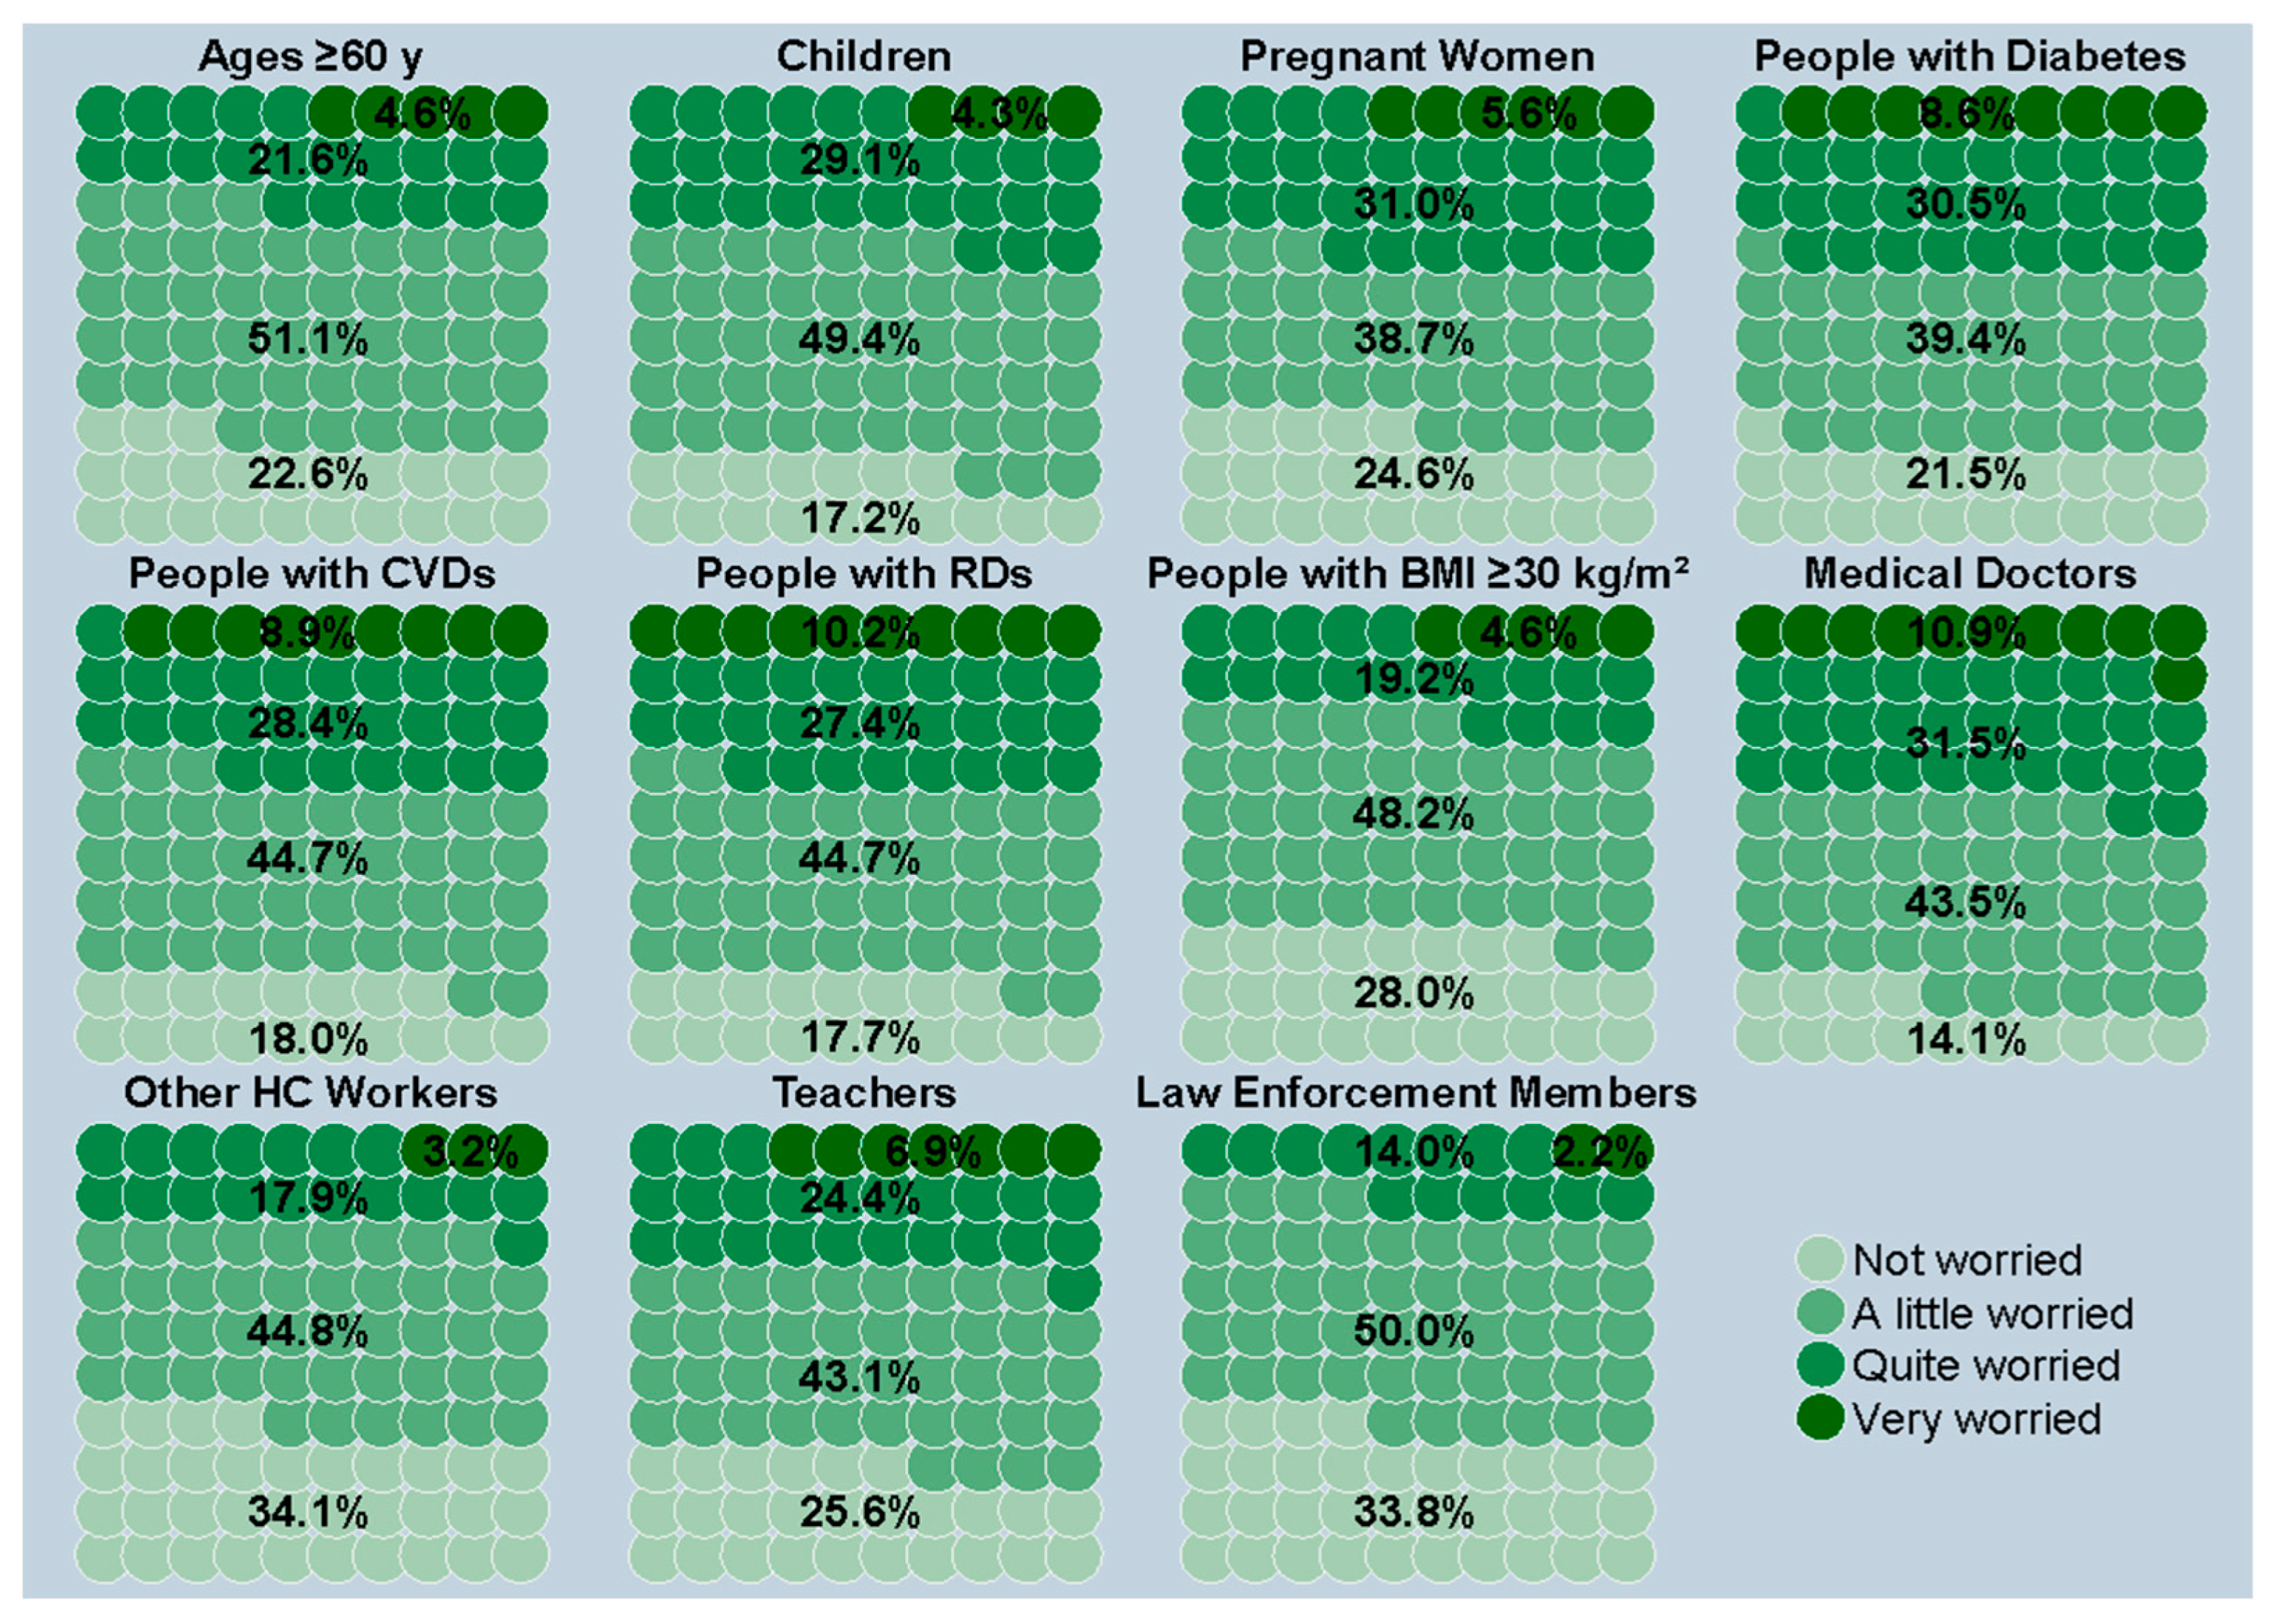
3.3. Perceptions about Influenza and Its Vaccines
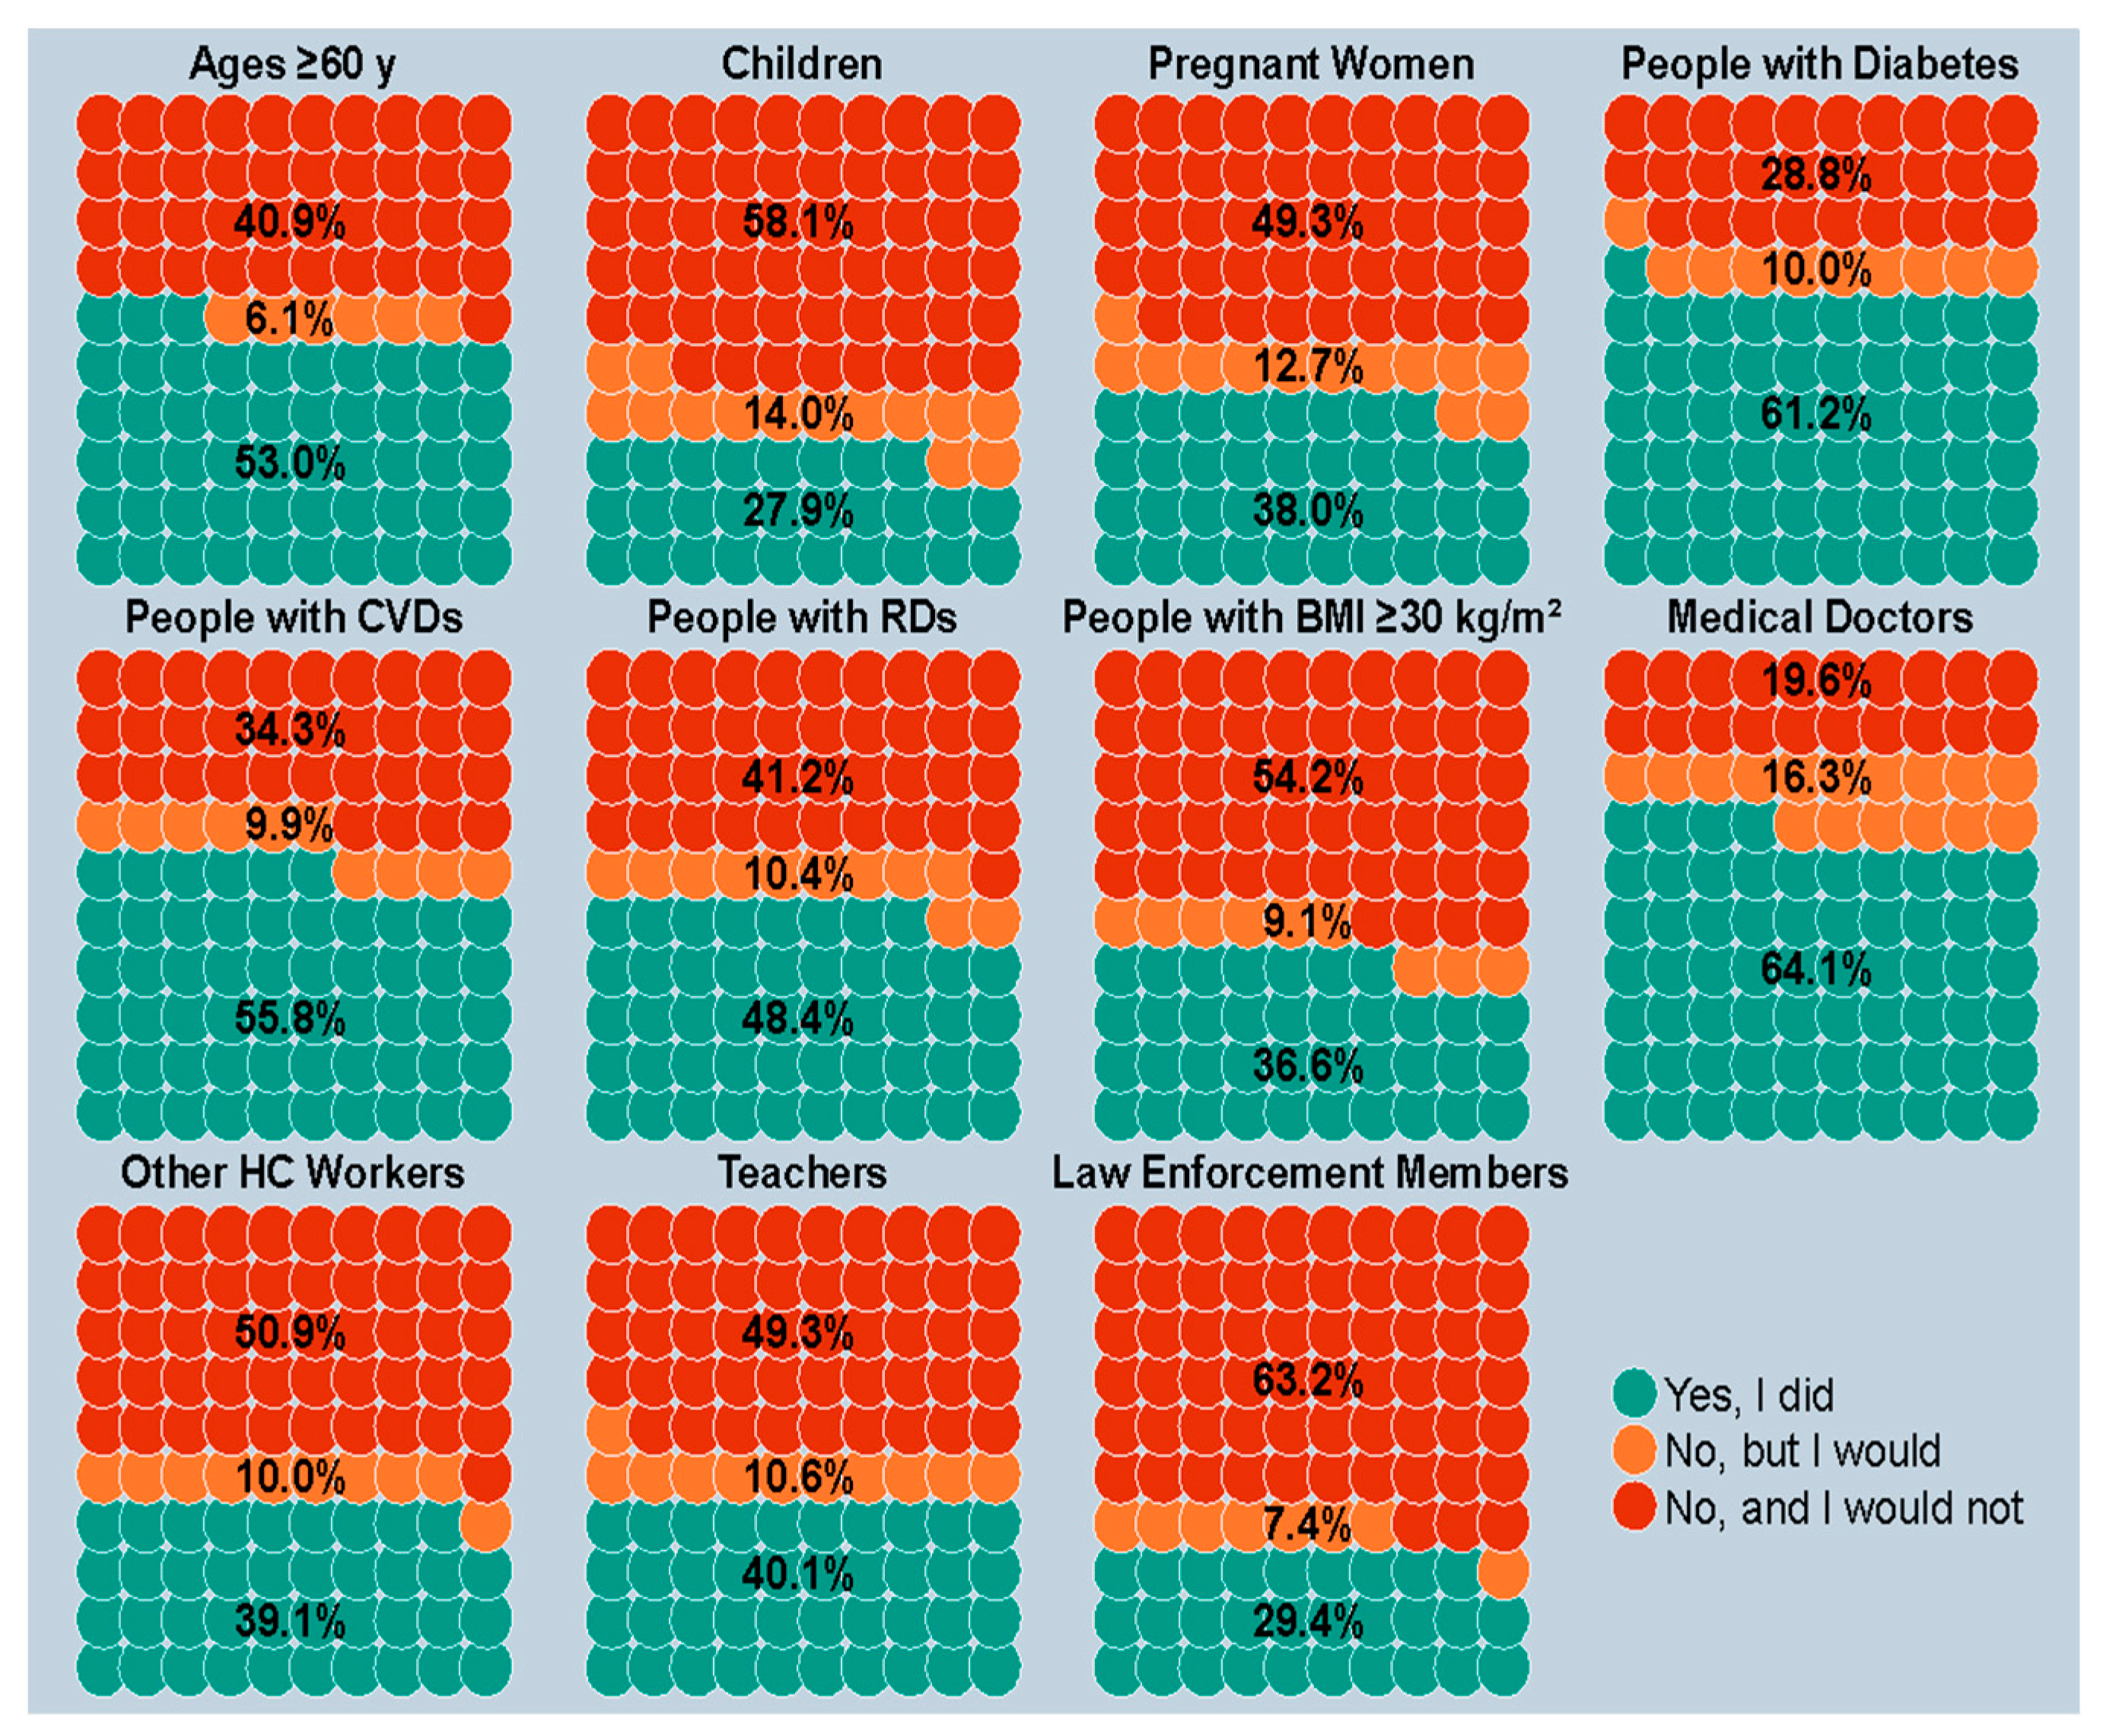
3.4. Knowledge of Being in a Priority Group, Information Attitudes, and Preferences
3.5. Multivariable Regression Analysis
4. Discussion
Strengths and Limitations
Supplementary Materials
Author Contributions
Funding
Institutional Review Board Statement
Informed Consent Statement
Data Availability Statement
Acknowledgments
Conflicts of Interest
References
- Ministry of Health of Italy. Influenza Prevention and Control, Online Document. Available online: https://www.salute.gov.it/imgs/C_17_pubblicazioni_501_ulterioriallegati_ulterioreallegato_0_alleg.pdf (accessed on 4 March 2024).
- Rosano, A.; Bella, A.; Gesualdo, F.; Acampora, A.; Pezzotti, P.; Marchetti, S.; Ricciardi, W.; Rizzo, C. Investigating the impact of influenza on excess mortality in all ages in Italy during recent seasons (2013/14–2016/17 seasons). Int. J. Infect. Dis. 2019, 88, 127–134. [Google Scholar] [CrossRef] [PubMed]
- European Centre for Disease Prevention and Control. Seasonal Influenza Factsheet, Online Document. Available online: https://www.ecdc.europa.eu/en/seasonal-influenza/facts/factsheet (accessed on 4 March 2024).
- Capodici, A.; Montalti, M.; Soldà, G.; Salussolia, A.; La Fauci, G.; Di Valerio, Z.; Scognamiglio, F.; Fantini, M.P.; Odone, A.; Costantino, C.; et al. Influenza vaccination landscape in Italy: A comprehensive study through the OBVIOUS project lens. Hum. Vaccines Immunother. 2023, 19, 2252250. [Google Scholar] [CrossRef] [PubMed]
- Gori, D.; Capodici, A.; La Fauci, G.; Montalti, M.; Salussolia, A.; Soldà, G.; Di Valerio, Z.; Scognamiglio, F.; Fantini, M.P.; Leask, J.; et al. COVID-19 Vaccine Refusal and Delay among Adults in Italy: Evidence from the OBVIOUS Project, a National Survey in Italy. Vaccines 2023, 11, 839. [Google Scholar] [CrossRef] [PubMed]
- Ministry of Health of Italy. Piano Nazionale Prevenzione Vaccinale. PNPV 2023–2025, Online Document. Available online: https://www.salute.gov.it/portale/vaccinazioni/dettaglioContenutiVaccinazioni.jsp?lingua=italiano&id=4828&area=vaccinazioni&menu=vuoto (accessed on 4 March 2024).
- World Health Organization. Seasonal Influenza Vaccines: An Overview for Decision-Makers; World Health Organization: Geneva, Switzerland, 2020. [Google Scholar]
- World Health Organization. Agenda, Policy & Strategy, Immunization, Vaccines and Biologicals, Strategic Advisory Group of Experts on Immunization; Understanding the Behavioural and Social Drivers of Vaccine Uptake WHO Position Paper; World Health Organization: Geneva, Switzerland, 2022. [Google Scholar]
- Karnaki, P.; Baka, A.; Petralias, A.; Veloudaki, A.; Zota, D.; Linos, A. Immunization related behaviour among healthcare workers in Europe: Results of the HProImmune survey. Cent. Eur. J. Public Health 2019, 27, 204–211. [Google Scholar] [CrossRef] [PubMed]
- Roller-Wirnsberger, R.; Lindner, S.; Kolosovski, L.; Platzer, E.; Dovjak, P.; Flick, H.; Tziraki, C.; Illario, M. The role of health determinants in the influenza vaccination uptake among older adults (65+): A scope review. Aging Clin. Exp. Res. 2021, 33, 2123–2132. [Google Scholar] [CrossRef] [PubMed]
- World Health Organization. Ten Threats to Global Health in 2019; World Health Organization: Geneva, Switzerland, 2019. [Google Scholar]
- Rossi, D.; Croci, R.; Affanni, P.; Odone, A.; Signorelli, C. Influenza vaccination coverage in Lombardy Region: A twenty-year trend analysis (1999–2019). Acta Bio Medica Atenei Parm. 2020, 91, 141–145. [Google Scholar] [CrossRef]
- Stefanati, A.; Lupi, S.; Campo, G.; Cocchio, S.; Furlan, P.; Baldo, V.; Gabutti, G. Influenza coverage rates in subjects with chronic heart diseases: Results obtained in four consecutive immunisation seasons in the Local Health Unit of Ferrara (North Italy)”. Arch. Public Health 2020, 78, 103. [Google Scholar] [CrossRef] [PubMed]
- Tang, S.; Ji, L.; Bishwajit, G.; Guo, S. Uptake of COVID-19 and influenza vaccines in relation to preexisting chronic conditions in the European countries. BMC Geriatr. 2024, 24, 56. [Google Scholar] [CrossRef] [PubMed]
- Achterbergh, R.C.A.; McGovern, I.; Haag, M. Co-Administration of Influenza and COVID-19 Vaccines: Policy Review and Vaccination Coverage Trends in the European Union, UK, US, and Canada between 2019 and 2023. Vaccines 2024, 12, 216. [Google Scholar] [CrossRef] [PubMed]
- de Waure, C.; Gärtner, B.C.; Lopalco, P.L.; Puig-Barbera, J.; Nguyen-Van-Tam, J.S. Real world evidence for public health decision-making on vaccination policies: Perspectives from an expert roundtable. Expert Rev. Vaccines 2024, 23, 27–38. [Google Scholar] [CrossRef] [PubMed]
- StataCorp. Stata Statistical Software: Release 18; StataCorp LLC: College Station, TX, USA, 2023. [Google Scholar]
- Srivastav, A.; Lu, P.J.; Amaya, A.; Dever, J.A.; Stanley, M.; Franks, J.L.; Scanlon, P.J.; Fisher, A.M.; Greby, S.M.; Nguyen, K.H.; et al. Prevalence of influenza-specific vaccination hesitancy among adults in the United States, 2018. Vaccine 2023, 41, 2572–2581. [Google Scholar] [CrossRef] [PubMed]
- Ng, Q.X.; Lee, D.Y.X.; Ng, C.X.; Yau, C.E.; Lim, Y.L.; Liew, T.M. Examining the Negative Sentiments Related to Influenza Vaccination from 2017 to 2022: An Unsupervised Deep Learning Analysis of 261,613 Twitter Posts. Vaccines 2023, 11, 1018. [Google Scholar] [CrossRef] [PubMed]
- Lee, D.; Rundle-Thiele, S.; Wut, T.M.; Li, G. Increasing Seasonal Influenza Vaccination among University Students: A Systematic Review of Programs Using a Social Marketing Perspective. Int. J. Environ. Res. Public Health 2022, 19, 7138. [Google Scholar] [CrossRef]
- Jones Cooper, S.N.; Walton-Moss, B. Using reminder/recall systems to improve influenza immunization rates in children with asthma. J. Pediatr. Health Care 2013, 27, 327–333. [Google Scholar] [CrossRef]
- Szilagyi, P.G.; Albertin, C.; Casillas, A.; Valderrama, R.; Duru, O.K.; Ong, M.K.; Vangala, S.; Tseng, C.-H.; Rand, C.M.; Humiston, S.G.; et al. Effect of Patient Portal Reminders Sent by a Health Care System on Influenza Vaccination Rates: A Randomized Clinical Trial. JAMA Intern. Med. 2020, 180, 962–970. [Google Scholar] [CrossRef]
- Benis, A.; Khodos, A.; Ran, S.; Levner, E.; Ashkenazi, S. Social Media Engagement and Influenza Vaccination During the COVID-19 Pandemic: Cross-sectional Survey Study. J. Med. Internet Res. 2021, 23, e25977. [Google Scholar] [CrossRef] [PubMed]
- Mohammed, H.; McMillan, M.; Andraweera, P.H.; Elliott, S.R.; Marshall, H.S. A rapid global review of strategies to improve influenza vaccination uptake in Australia. Hum. Vaccin Immunother. 2021, 17, 5487–5499. [Google Scholar] [CrossRef] [PubMed]
- Chan, P.S.; Fang, Y.; Kawuki, J.; Chen, S.; Liang, X.; Mo, P.K.; Wang, Z. Parental Acceptance, Parental Hesitancy, and Uptake of Seasonal Influenza Vaccination among Children Aged 6–59 Months: A Systematic Review and Meta-Analysis. Vaccines 2023, 11, 1360. [Google Scholar] [CrossRef] [PubMed]
- Chantler, T.; Pace, D.; Wright, A.; Pollard, A.J.; Yu, L.M.; Nguyen-Van-Tam, J.S.; MacDonald, N. Uptake and acceptability of influenza vaccination in day nursery children. Community Pract. 2007, 80, 32–36. [Google Scholar] [PubMed]
- Lau, J.T.F.; Wu, A.M.S.; Ma, Y.L.; Lau, M.M.C. Associated Factors of Behavioral Intention Regarding Childhood Influenza Vaccination Among Parents of Ever-Vaccinated and Never-Vaccinated 24- to 59-Month-Old Children in Hong Kong. Asia Pac. J. Public Health 2021, 33, 262–272. [Google Scholar] [CrossRef] [PubMed]


| Characteristic | Italy | Northwestern Italy | Northeastern Italy | Central Italy | Southern Italy | Insular Italy |
|---|---|---|---|---|---|---|
| (n = 5217) | (n = 1517) | (n = 998) | (n = 1011) | (n = 1151) | (n = 540) | |
| Gender | ||||||
| Male | 2557 (49.0%) | 690 (45.5%) | 572 (57.3%) | 465 (46.0%) | 588 (51.1%) | 242 (44.8%) |
| Female | 2653 (50.9%) | 825 (54.4%) | 425 (42.6%) | 545 (53.9%) | 560 (48.7%) | 298 (55.2%) |
| Non-binary | 7 (0.1%) | 2 (0.1%) | 1 (0.1%) | 1 (0.1%) | 3 (0.3%) | 0 (0.0%) |
| Age, y | ||||||
| Mean ± SD | 54.8 ± 15.9 | 58.3 ± 14.7 | 52.0 ± 18.4 | 55.3 ± 15.1 | 52.9 ± 15.5 | 53.4 ± 15.1 |
| Age group, y | ||||||
| 18–24 | 270 (5.2%) | 52 (3.4%) | 145 (14.5%) | 24 (2.4%) | 36 (3.1%) | 13 (2.4%) |
| 25–34 | 487 (9.3%) | 88 (5.8%) | 92 (9.2%) | 100 (9.9%) | 146 (12.7%) | 61 (11.3%) |
| 35–44 | 682 (13.1%) | 147 (9.7%) | 111 (11.1%) | 145 (14.3%) | 198 (17.2%) | 81 (15.0%) |
| 45–54 | 603 (11.6%) | 142 (9.4%) | 92 (9.2%) | 113 (11.2%) | 161 (14.0%) | 95 (17.6%) |
| 55–64 | 1149 (22.0%) | 367 (24.2%) | 176 (17.6%) | 262 (25.9%) | 227 (19.7%) | 117 (21.7%) |
| ≥65 | 2026 (38.8%) | 721 (47.5%) | 382 (38.3%) | 367 (36.3%) | 383 (33.3%) | 173 (32.0%) |
| Place of residence degree of urbanization | ||||||
| City (densely populated area) | 2270 (43.5%) | 641 (42.3%) | 439 (44.0%) | 427 (42.2%) | 570 (49.5%) | 193 (35.7%) |
| Town or suburb (intermediate-density area) | 2250 (43.1%) | 694 (45.7%) | 418 (41.9%) | 426 (42.1%) | 414 (36.0%) | 298 (55.2%) |
| Rural area (thinly populated area) | 697 (13.4%) | 182 (12.0%) | 141 (14.1%) | 158 (15.6%) | 167 (14.5%) | 49 (9.1%) |
| Educational attainment | ||||||
| Less than high school diploma | 784 (15.0%) | 282 (18.6%) | 144 (14.4%) | 124 (12.3%) | 137 (11.9%) | 97 (18.0%) |
| High school diploma | 2848 (54.6%) | 872 (57.5%) | 502 (50.3%) | 559 (55.3%) | 605 (52.6%) | 310 (57.4%) |
| Academic degree | 957 (18.3%) | 227 (15.0%) | 145 (14.5%) | 224 (22.2%) | 270 (23.5%) | 91 (16.9%) |
| Post-graduate/doctorate degree | 628 (12.0%) | 136 (9.0%) | 207 (20.7%) | 104 (10.3%) | 139 (12.1%) | 42 (7.8%) |
| Occupation | ||||||
| Teacher | 434 (8.3%) | 111 (7.3%) | 60 (6.0%) | 83 (8.2%) | 124 (10.8%) | 56 (10.4%) |
| Healthcare worker (excl. medical doctor) | 279 (5.3%) | 75 (4.9%) | 38 (3.8%) | 60 (5.9%) | 65 (5.6%) | 41 (7.6%) |
| Law-enforcement member | 136 (2.6%) | 21 (1.4%) | 31 (3.1%) | 25 (2.5%) | 38 (3.3%) | 21 (3.9%) |
| Student | 110 (2.1%) | 30 (2.0%) | 14 (1.4%) | 17 (1.7%) | 33 (2.9%) | 16 (3.0%) |
| Medical doctor | 92 (1.8%) | 22 (1.5%) | 15 (1.5%) | 17 (1.7%) | 28 (2.4%) | 10 (1.9%) |
| Other occupation | 1654 (31.7%) | 424 (27.9%) | 391 (39.2%) | 354 (35.0%) | 345 (30.0%) | 140 (25.9%) |
| Unemployed | 617 (11.8%) | 154 (10.2%) | 58 (5.8%) | 116 (11.5%) | 182 (15.8%) | 107 (19.8%) |
| Retired | 1895 (36.3%) | 680 (44.8%) | 391 (39.2%) | 339 (33.5%) | 336 (29.2%) | 149 (27.6%) |
| Household composition | ||||||
| Alone | 849 (16.3%) | 302 (19.9%) | 184 (18.4%) | 169 (16.7%) | 124 (10.8%) | 70 (13.0%) |
| Couple | 3383 (64.8%) | 984 (64.9%) | 677 (67.8%) | 623 (61.6%) | 774 (67.2%) | 325 (60.2%) |
| Family of origin | 689 (13.2%) | 159 (10.5%) | 94 (9.4%) | 137 (13.6%) | 195 (16.9%) | 104 (19.3%) |
| Other | 296 (5.7%) | 72 (4.7%) | 43 (4.3%) | 82 (8.1%) | 58 (5.0%) | 41 (7.6%) |
| Able to pay for things needed in life | ||||||
| With great difficulty | 666 (12.8%) | 157 (10.3%) | 90 (9.0%) | 139 (13.7%) | 181 (15.7%) | 99 (18.3%) |
| With some difficulty | 2200 (42.2%) | 628 (41.4%) | 381 (38.2%) | 445 (44.0%) | 478 (41.5%) | 268 (49.6%) |
| Quite easily | 1913 (36.7%) | 592 (39.0%) | 405 (40.6%) | 362 (35.8%) | 406 (35.3%) | 148 (27.4%) |
| Easily | 438 (8.4%) | 140 (9.2%) | 122 (12.2%) | 65 (6.4%) | 86 (7.5%) | 25 (4.6%) |
| All | Yes, I Did | No, but I Would | No, and I Would | |
|---|---|---|---|---|
| Not | ||||
| Males and females | ||||
| Italy | 5217 | 2371 (45.4%) | 429 (8.2%) | 2417 (46.3%) |
| Northwestern Italy | 1517 | 701 (46.2%) | 93 (6.1%) | 723 (47.7%) |
| Northeastern Italy | 998 | 521 (52.2%) | 87 (8.7%) | 390 (39.1%) |
| Central Italy | 1011 | 439 (43.4%) | 78 (7.7%) | 494 (48.9%) |
| Southern Italy | 1151 | 498 (43.3%) | 108 (9.4%) | 545 (47.4%) |
| Insular Italy | 540 | 212 (39.3%) | 63 (11.7%) | 265 (49.1%) |
| Males | ||||
| Italy | 2557 | 1251 (48.9%) | 223 (8.7%) | 1083 (42.4%) |
| Northwestern Italy | 690 | 348 (50.4%) | 46 (6.7%) | 296 (42.9%) |
| Northeastern Italy | 572 | 334 (58.4%) | 60 (10.5%) | 178 (31.1%) |
| Central Italy | 465 | 214 (46.0%) | 29 (6.2%) | 222 (47.7%) |
| Southern Italy | 588 | 260 (44.2%) | 60 (10.2%) | 268 (45.6%) |
| Insular Italy | 242 | 95 (39.3%) | 28 (11.6%) | 119 (49.2%) |
| Females | ||||
| Italy | 2660 | 1120 (42.1%) | 206 (7.7%) | 1334 (50.2%) |
| Northwestern Italy | 827 | 353 (42.7%) | 47 (5.7%) | 427 (51.6%) |
| Northeastern Italy | 426 | 187 (43.9%) | 27 (6.3%) | 212 (49.8%) |
| Central Italy | 546 | 225 (41.2%) | 49 (9.0%) | 272 (49.8%) |
| Southern Italy | 563 | 238 (42.3%) | 48 (8.5%) | 277 (49.2%) |
| Insular Italy | 298 | 117 (39.3%) | 35 (11.7%) | 146 (49.0%) |
| LHA | Family Doctor | Occupational Doctor | Gynecologist/ Obstetrician | Other Specialists | No One | |
|---|---|---|---|---|---|---|
| Ages ≥ 60 y | 103 (3.6%) | 1660 (58.5%) | 158 (5.6%) | 0 (0.0%) | 85 (3.0%) | 833 (29.3%) |
| Children | 35 (8.0%) | 179 (41.0%) | 34 (7.8%) | 0 (0.0%) | 4 (0.9%) | 185 (42.3%) |
| Pregnant women | 29 (10.2%) | 95 (33.5%) | 47 (16.5%) | 26 (9.2%) | 9 (3.2%) | 78 (27.5%) |
| People with diabetes | 116 (12.2%) | 542 (57.0%) | 132 (13.9%) | 7 (0.7%) | 24 (2.5%) | 130 (13.7%) |
| People with CVDs | 51 (8.0%) | 356 (55.8%) | 68 (10.7%) | 5 (0.8%) | 25 (3.9%) | 133 (20.8%) |
| People with RDs | 53 (9.9%) | 274 (51.0%) | 73 (13.6%) | 7 (1.3%) | 18 (3.4%) | 112 (20.9%) |
| People with BMI ≥ 30 kg/m2 | 64 (5.5%) | 578 (49.4%) | 112 (9.6%) | 4 (0.3%) | 35 (3.0%) | 378 (32.3%) |
| Medical doctors | 18 (19.6%) | 28 (30.4%) | 20 (21.7%) | 2 (2.2%) | 8 (8.7%) | 16 (17.4%) |
| Other HC workers | 24 (8.6%) | 111 (39.8%) | 67 (24.0%) | 2 (0.7%) | 16 (5.7%) | 59 (21.1%) |
| Teachers | 36 (8.3%) | 230 (53.0%) | 57 (13.1%) | 1 (0.2%) | 14 (3.2%) | 96 (22.1%) |
| Law-enforcement members | 7 (5.1%) | 50 (36.8%) | 47 (34.6%) | 0 (0.0%) | 8 (5.9%) | 24 (17.6%) |
| Characteristic | Italy | Northwestern Italy | Northeastern Italy | Central Italy | Southern Italy | Insular Italy |
|---|---|---|---|---|---|---|
| (n = 5217) | (n = 1517) | (n = 998) | (n = 1011) | (n = 1151) | (n = 540) | |
| Place where you prevalently receive vaccines | ||||||
| Vaccine hub | 3459 (66.3%) | 1064 (70.1%) | 634 (63.5%) | 625 (61.8%) | 776 (67.4%) | 360 (66.7%) |
| Hospital | 713 (13.7%) | 218 (14.4%) | 148 (14.8%) | 152 (15.0%) | 126 (10.9%) | 69 (12.8%) |
| Family doctor | 711 (13.6%) | 147 (9.7%) | 128 (12.8%) | 173 (17.1%) | 176 (15.3%) | 87 (16.1%) |
| Workplace | 129 (2.5%) | 31 (2.0%) | 41 (4.1%) | 19 (1.9%) | 29 (2.5%) | 9 (1.7%) |
| Pharmacy | 144 (2.8%) | 44 (2.9%) | 30 (3.0%) | 33 (3.3%) | 28 (2.4%) | 9 (1.7%) |
| Home | 61 (1.2%) | 13 (0.9%) | 17 (1.7%) | 9 (0.9%) | 16 (1.4%) | 6 (1.1%) |
| Favorite place to receive vaccines | ||||||
| Vaccine hub | 2118 (40.6%) | 669 (44.1%) | 395 (39.6%) | 393 (38.9%) | 468 (40.7%) | 193 (35.7%) |
| Family doctor | 1496 (28.7%) | 331 (21.8%) | 298 (29.9%) | 334 (33.0%) | 352 (30.6%) | 181 (33.5%) |
| Hospital | 726 (13.9%) | 219 (14.4%) | 143 (14.3%) | 141 (13.9%) | 144 (12.5%) | 79 (14.6%) |
| Pharmacy | 442 (8.5%) | 190 (12.5%) | 61 (6.1%) | 76 (7.5%) | 83 (7.2%) | 32 (5.9%) |
| Home | 288 (5.5%) | 68 (4.5%) | 55 (5.5%) | 49 (4.8%) | 75 (6.5%) | 41 (7.6%) |
| Workplace | 147 (2.8%) | 40 (2.6%) | 46 (4.6%) | 18 (1.8%) | 29 (2.5%) | 14 (2.6%) |
| Favorite time slot to receive vaccines | ||||||
| 6:00–9:00 a.m. | 681 (13.1%) | 171 (11.3%) | 139 (13.9%) | 129 (12.8%) | 181 (15.7%) | 61 (11.3%) |
| 9:00–12:00 a.m. | 2346 (45.0%) | 684 (45.1%) | 402 (40.3%) | 462 (45.7%) | 536 (46.6%) | 262 (48.5%) |
| 12:00–3:00 p.m. | 680 (13.0%) | 199 (13.1%) | 196 (19.6%) | 104 (10.3%) | 115 (10.0%) | 66 (12.2%) |
| 3:00–6:00 p.m. | 963 (18.5%) | 295 (19.4%) | 172 (17.2%) | 216 (21.4%) | 193 (16.8%) | 87 (16.1%) |
| 6:00–9:00 p.m. | 547 (10.5%) | 168 (11.1%) | 89 (8.9%) | 100 (9.9%) | 126 (10.9%) | 64 (11.9%) |
| Favorite day of the week to receive vaccines | ||||||
| Monday | 1535 (29.4%) | 420 (27.7%) | 285 (28.6%) | 324 (32.0%) | 347 (30.1%) | 159 (29.4%) |
| Tuesday | 769 (14.7%) | 259 (17.1%) | 142 (14.2%) | 141 (13.9%) | 148 (12.9%) | 79 (14.6%) |
| Wednesday | 824 (15.8%) | 268 (17.7%) | 201 (20.1%) | 128 (12.7%) | 156 (13.6%) | 71 (13.1%) |
| Thursday | 496 (9.5%) | 143 (9.4%) | 128 (12.8%) | 77 (7.6%) | 104 (9.0%) | 44 (8.1%) |
| Friday | 622 (11.9%) | 188 (12.4%) | 106 (10.6%) | 126 (12.5%) | 137 (11.9%) | 65 (12.0%) |
| Saturday | 754 (14.5%) | 181 (11.9%) | 105 (10.5%) | 164 (16.2%) | 210 (18.2%) | 94 (17.4%) |
| Sunday | 217 (4.2%) | 58 (3.8%) | 31 (3.1%) | 51 (5.0%) | 49 (4.3%) | 28 (5.2%) |
| Friends and family’s views on vaccination | ||||||
| Very unfavorable | 264 (5.1%) | 79 (5.2%) | 43 (4.3%) | 50 (4.9%) | 59 (5.1%) | 33 (6.1%) |
| Unfavorable | 188 (3.6%) | 51 (3.4%) | 33 (3.3%) | 28 (2.8%) | 55 (4.8%) | 21 (3.9%) |
| Quite unfavorable | 532 (10.2%) | 151 (10.0%) | 99 (9.9%) | 101 (10.0%) | 122 (10.6%) | 59 (10.9%) |
| Quite favorable | 1632 (31.3%) | 430 (28.3%) | 320 (32.1%) | 311 (30.8%) | 393 (34.1%) | 178 (33.0%) |
| Favorable | 1430 (27.4%) | 428 (28.2%) | 271 (27.2%) | 291 (28.8%) | 298 (25.9%) | 142 (26.3%) |
| Very favorable | 1171 (22.4%) | 378 (24.9%) | 232 (23.2%) | 230 (22.7%) | 224 (19.5%) | 107 (19.8%) |
| Primary source of information to know recommended vaccines | ||||||
| Family doctor | 3386 (64.9%) | 1014 (66.8%) | 617 (61.8%) | 702 (69.4%) | 719 (62.5%) | 334 (61.9%) |
| TV | 542 (10.4%) | 136 (9.0%) | 105 (10.5%) | 88 (8.7%) | 158 (13.7%) | 55 (10.2%) |
| Internet | 524 (10.0%) | 148 (9.8%) | 102 (10.2%) | 89 (8.8%) | 116 (10.1%) | 69 (12.8%) |
| Healthcare workers (excl. family doctors) | 350 (6.7%) | 115 (7.6%) | 54 (5.4%) | 70 (6.9%) | 66 (5.7%) | 45 (8.3%) |
| Friends/relatives | 214 (4.1%) | 46 (3.0%) | 57 (5.7%) | 33 (3.3%) | 58 (5.0%) | 20 (3.7%) |
| Journals | 201 (3.9%) | 58 (3.8%) | 63 (6.3%) | 29 (2.9%) | 34 (3.0%) | 17 (3.1%) |
| Characteristic | Did Receive the Vaccine | Would Receive the Vaccine | Would Not Receive the Vaccine | ||||||
|---|---|---|---|---|---|---|---|---|---|
| Predicted | Discrete Difference (Δ) | Predicted | Discrete Difference (Δ) | Predicted | Discrete Difference (Δ) | ||||
| Probability | Estimate | 95% CI | Probability | Estimate | 95% CI | Probability | Estimate | 95% CI | |
| Gender | |||||||||
| Male | 45.5% | Ref. | 8.8% | Ref. | 45.7% | Ref. | |||
| Female † | 45.4% | 0.0 | −2.1, 2.1 | 7.7% | −1.1 | −2.6, 0.4 | 46.9% | 1.2 | −0.8, 3.1 |
| Age group, y | |||||||||
| 18–34 | 42.1% | Ref. | 14.0% | Ref. | 43.9% | Ref. | |||
| 35–44 | 39.8% | −2.3 | −6.5, 1.9 | 8.6% | −5.4 * | −8.6, −2.2 | 51.6% | 7.7 * | 4.0, 11.4 |
| 45–54 | 39.4% | −2.6 | −7.2, 1.9 | 10.0% | −4.0 * | −7.5, −0.4 | 50.5% | 6.6 * | 2.7, 10.6 |
| 55–64 | 43.4% | 1.4 | −2.6, 5.3 | 8.2% | −5.8 * | −8.9, −2.6 | 48.3% | 4.4 * | 1.0, 7.9 |
| ≥65 | 51.1% | 9.0 * | 5.2, 12.9 | 5.5% | −8.5 * | −11.5, −5.5 | 43.4% | −0.5 | −3.9, 2.9 |
| NUTS statistical region | |||||||||
| Northwestern Italy | 46.3% | Ref. | 6.9% | Ref. | 46.8% | Ref. | |||
| Northeastern Italy | 48.8% | 2.5 | −0.6, 5.5 | 7.6% | 0.7 | −1.4, 2.8 | 43.7% | −3.1 * | −5.9, −0.3 |
| Central Italy | 45.3% | −1.1 | −4.1, 2.0 | 8.5% | 1.6 | −0.6, 3.8 | 46.2% | −0.5 | −3.3, 2.2 |
| Southern Italy | 43.7% | −2.6 | −5.5, 0.3 | 8.8% | 1.9 | −0.2, 3.9 | 47.5% | 0.7 | −2.0, 3.4 |
| Insular Italy | 41.2% | −5.1 * | −8.8, −1.4 | 11.3% | 4.4 * | 1.6, 7.3 | 47.5% | 0.7 | −2.7, 4.1 |
| Degree of urbanization | |||||||||
| City | 47.2% | Ref. | 7.8% | Ref. | 45.0% | Ref. | |||
| Town or suburb | 44.2% | −2.9 * | −5.1, −0.7 | 8.4% | 0.6 | −1.0, 2.2 | 47.3% | 2.3 * | 0.3, 4.4 |
| Rural area | 43.3% | −3.9 * | −7.2, −0.6 | 9.2% | 1.4 | −1.0, 3.8 | 47.5% | 2.5 | −0.5, 5.5 |
| Educational attainment | |||||||||
| Post-graduate/doctorate degree | 47.9% | Ref. | 8.7% | Ref. | 43.4% | Ref. | |||
| Academic degree | 48.6% | 0.6 | −3.2, 4.4 | 6.9% | −1.8 | −4.3, 0.8 | 44.5% | 1.1 | −2.5, 4.8 |
| High school diploma | 44.6% | −3.3 | −6.9, 0.2 | 8.0% | −0.7 | −3.1, 1.8 | 47.4% | 4.0 * | 0.6, 7.4 |
| Less than high school diploma | 42.4% | −5.6 * | −9.9, −1.2 | 10.7% | 2.0 | −1.3, 5.3 | 46.9% | 3.5 | −0.5, 7.6 |
| Occupation | |||||||||
| Teacher | 45.2% | Ref. | 9.2% | Ref. | 45.6% | Ref. | |||
| Healthcare worker (incl. MD) | 48.3% | 0.0 | −4.0, 3.9 | 8.9% | 1.1 | −1.8, 3.9 | 42.7% | −1.0 | −4.7, 2.6 |
| Law-enforcement member | 42.6% | 3.0 | −1.0, 7.1 | 6.4% | 0.8 | −2.0, 3.7 | 51.0% | −3.9 * | −7.6, −0.2 |
| Other | 45.3% | −2.7 | −9.3, 3.9 | 8.1% | −1.7 | −5.7, 2.2 | 46.6% | 4.4 | −1.7, 10.5 |
| Pneumopathy | |||||||||
| Yes | 46.3% | 1.0 | −2.4, 4.3 | 8.3% | 0.0 | −2.2, 2.3 | 45.4% | −1.0 | −4.2, 2.2 |
| Cardiopathy | |||||||||
| Yes | 49.0% | 4.0 * | 0.9, 7.2 | 8.8% | 0.7 | −1.6, 2.9 | 42.2% | −4.7 * | −7.7, −1.7 |
| Diabetes | |||||||||
| Yes | 52.3% | 8.3 * | 5.4, 11.2 | 8.3% | 0.0 | −2.0, 2.0 | 39.4% | −8.3 * | −11.0, −5.5 |
| Worry about seasonal influenza | |||||||||
| Very/quite worried | 53.9% | Ref. | 14.5% | Ref. | 31.6% | Ref. | |||
| A little worried | 44.1% | −9.8 * | −12.4, −7.2 | 7.0% | −7.5 * | −9.7, −5.4 | 48.9% | 17.4 * | 14.8, 19.9 |
| Not worried | 39.1% | −14.8 * | −18.1, −11.6 | 4.2% | −10.4 * | −12.7, −8.1 | 56.8% | 25.2 * | 22.0, 28.5 |
| Perception of vaccine safety | |||||||||
| Very safe | 53.4% | Ref. | 7.9% | Ref. | 38.7% | Ref. | |||
| Quite safe | 45.0% | −8.4 * | −11.3, −5.5 | 9.1% | 1.2 | −0.7, 3.2 | 45.9% | 7.2 * | 4.4, 9.9 |
| Quite/very unsafe | 34.5% | −18.9 * | −23.7, −14.2 | 7.2% | −0.7 | −3.6, 2.3 | 58.4% | 19.6 * | 15.1, 24.1 |
| Dear ones’ views on vaccination in general | |||||||||
| Very favorable | 48.9% | Ref. | 8.5% | Ref. | 42.6% | Ref. | |||
| Favorable | 44.1% | −4.8 * | −7.7, −1.9 | 8.2% | −0.3 | −2.4, 1.8 | 47.8% | 5.1 * | 2.3, 7.9 |
| Quite favorable | 44.2% | −4.7 * | −7.7, −1.6 | 8.5% | 0.0 | −2.2, 2.1 | 47.3% | 4.7 * | 1.8, 7.6 |
| Quite unfavorable | 44.1% | −4.8 * | −9.3, −0.3 | 7.9% | −0.6 | −3.8, 2.5 | 48.0% | 5.4 * | 1.3, 9.5 |
| Unfavorable/very unfavorable | 48.1% | −0.7 | −6.2, 4.7 | 7.2% | −1.3 | −5.2, 2.6 | 44.6% | 2.0 | −2.7, 6.7 |
| Awareness of having priority for vaccination | |||||||||
| Yes | 52.1% | Ref. | 8.1% | Ref. | 39.8% | Ref. | |||
| No | 26.0% | −26.1 * | −29.5, −22.7 | 9.0% | 0.9 | −1.3, 3.1 | 65.0% | 25.2 * | 21.9, 28.5 |
| Do not know | 33.7% | −18.4 * | −22.2, −14.6 | 11.7% | 3.6 * | 0.8, 6.5 | 54.5% | 14.7 * | 11.4, 18.1 |
| Advice to friends/relatives invited for vaccination | |||||||||
| Receive it | 52.1% | Ref. | 9.6% | Ref. | 38.3% | Ref. | |||
| Do not receive it | 33.2% | −18.8 * | −23.9, −13.8 | 7.0% | −2.6 | −5.4, 0.2 | 59.8% | 21.4 * | 16.5, 26.4 |
| Do not know | 24.3% | −27.8 * | −31.4, −24.2 | 6.1% | −3.5 * | −5.8, −1.3 | 69.6% | 31.3 * | 27.8, 34.8 |
| Who invited for vaccination | |||||||||
| No one | 30.0% | Ref. | 9.7% | Ref. | 60.4% | Ref. | |||
| Local Healthcare Authority | 48.0% | 18.1 * | 13.3, 22.9 | 5.9% | −3.7 * | −6.7, −0.8 | 46.0% | −14.3 * | −18.9, −9.8 |
| Family doctor | 50.2% | 20.2 * | 17.2, 23.2 | 8.0% | −1.7 | −3.9, 0.6 | 41.8% | −18.6 * | −21.4, −15.7 |
| Other medical doctors | 48.3% | 18.3 * | 14.4, 22.3 | 10.5% | 0.8 | −2.1, 3.7 | 41.2% | −19.1 * | −22.8, −15.5 |
Disclaimer/Publisher’s Note: The statements, opinions and data contained in all publications are solely those of the individual author(s) and contributor(s) and not of MDPI and/or the editor(s). MDPI and/or the editor(s) disclaim responsibility for any injury to people or property resulting from any ideas, methods, instructions or products referred to in the content. |
© 2024 by the authors. Licensee MDPI, Basel, Switzerland. This article is an open access article distributed under the terms and conditions of the Creative Commons Attribution (CC BY) license (https://creativecommons.org/licenses/by/4.0/).
Share and Cite
Capodici, A.; Salussolia, A.; La Fauci, G.; Di Valerio, Z.; Montalti, M.; Odone, A.; Costantino, C.; Larson, H.J.; Leask, J.; Lenzi, J.; et al. Influenza Vaccine Uptake in Italy—The 2022–2023 Seasonal Influenza Vaccination Campaign in Italy: An Update from the OBVIOUS Project. Vaccines 2024, 12, 297. https://doi.org/10.3390/vaccines12030297
Capodici A, Salussolia A, La Fauci G, Di Valerio Z, Montalti M, Odone A, Costantino C, Larson HJ, Leask J, Lenzi J, et al. Influenza Vaccine Uptake in Italy—The 2022–2023 Seasonal Influenza Vaccination Campaign in Italy: An Update from the OBVIOUS Project. Vaccines. 2024; 12(3):297. https://doi.org/10.3390/vaccines12030297
Chicago/Turabian StyleCapodici, Angelo, Aurelia Salussolia, Giusy La Fauci, Zeno Di Valerio, Marco Montalti, Anna Odone, Claudio Costantino, Heidi J. Larson, Julie Leask, Jacopo Lenzi, and et al. 2024. "Influenza Vaccine Uptake in Italy—The 2022–2023 Seasonal Influenza Vaccination Campaign in Italy: An Update from the OBVIOUS Project" Vaccines 12, no. 3: 297. https://doi.org/10.3390/vaccines12030297
APA StyleCapodici, A., Salussolia, A., La Fauci, G., Di Valerio, Z., Montalti, M., Odone, A., Costantino, C., Larson, H. J., Leask, J., Lenzi, J., Manzoli, L., Gori, D., & on behalf of the OBVIOUS Board. (2024). Influenza Vaccine Uptake in Italy—The 2022–2023 Seasonal Influenza Vaccination Campaign in Italy: An Update from the OBVIOUS Project. Vaccines, 12(3), 297. https://doi.org/10.3390/vaccines12030297