Article

Leveraging Data from a Provincial Electronic Immunization Registry to Analyze Immunization Coverage, Timeliness, and Defaulters Among 8.8 Million Children from the 2018 to 2023 Birth Cohorts in Sindh Province, Pakistan

by
Fatima Miraj
1,
Sundus Iftikhar
1,
Muhammad Siddique
1,
Vijay Kumar Dharma
1,
Mubarak Taighoon Shah
2,
Danya Arif Siddiqi
2,3,* and
Subhash Chandir
2,4
1
Maternal & Child Health, IRD Pakistan, Karachi 75190, Pakistan
2
IRD Global, 16 Raffles Quay, Singapore 049145, Singapore
3
Department of Infectious Disease Epidemiology and Dynamics, London School of Hygiene & Tropical Medicine, Keppel St., London WC1E 7HT, UK
4
Johns Hopkins Bloomberg School of Public Health, Baltimore, MD 21205, USA
*
Author to whom correspondence should be addressed.
Vaccines 2024, 12(12), 1327; https://doi.org/10.3390/vaccines12121327
Submission received: 22 October 2024 / Revised: 20 November 2024 / Accepted: 22 November 2024 / Published: 26 November 2024
(This article belongs to the Section Human Vaccines and Public Health)

Abstract

:
Background/Objectives: Full immunization coverage in Pakistan remains suboptimal at 66%. An in-depth assessment is needed to understand the long-term trends in immunization and identify the extent of defaulters and associated risk factors of them being left uncovered by the immunization system. Methods: We conducted a 5-year analysis using the Government’s Provincial Electronic Immunization Registry data for the 2018–2023 birth cohorts in Sindh province. We analyzed 8,792,392 child-level immunization records from 1 January 2018 to 31 May 2024 to examine trends in immunization coverage, timeliness, defaulter rates, and associated risk factors; Results: Our findings indicate gradual improvements in immunization coverage, with full immunization rates increasing by 23.2% (from 47.5% to 70.7%) from 2018 to 2022. While timeliness declined from 2018 to 2021, it recovered in 2022 and 2023. Over the 5-year study period, >90% of children defaulted on vaccinations, with 34.8% fully covered and 9.1% uncovered. Children from urban areas (OR = 1.54; 95% CI = 1.52, 1.56; p-value < 0.001) and those enrolled through fixed immunization sites (OR = 2.11; 95% CI = 2.08, 2.15; p-value < 0.001) and mobile immunization vans (OR = 1.13; 95% CI = 1.13, 1.77; p-value = 0.003) were at higher risk of being uncovered defaulters. Conclusions: This study demonstrates improvements in immunization coverage in Sindh while highlighting the challenge of low timeliness and high default rates. Our findings provide insights to strengthen immunization access and timeliness, particularly in high-default areas, and can guide policies in similar low-income settings for more equitable and comprehensive immunization coverage.

1. Introduction

Routine immunization saves up to 4 million lives annually and averts 230 disability-adjusted life years (DALYs) for every 1000 under-five children vaccinated [1]. Since the launch of the Expanded Programme on Immunization (EPI) in 1974, coverage for three doses of the diphtheria, tetanus, and pertussis vaccine (DTP3) has increased from under 5% to 84% in 2023 [2,3]. Despite concerted efforts, progress to achieve universal and equitable coverage has been uneven, and immunization levels have plateaued in recent years [4]. Inequities in access to basic vaccines persist, with more than half of under- and never-immunized children residing in just ten low- and middle-income countries (LMICs) [4]. Initiatives like the Immunization Agenda 2030 and the Gavi 5.0 strategy have, therefore, been set forth with the aim of reaching 90% coverage of essential vaccines, reducing the number of under- and never-immunized children, and ensuring equitable vaccination access for all [5,6]. However, global instability and disruptions, including the COVID-19 pandemic, have severely impacted routine immunization efforts, widening the vaccination divide and complicating progress toward achieving global targets [7,8]. Amid these rapidly changing global dynamics, tracking trends in immunization coverage, timeliness, and related indicators is critical for identifying vulnerable populations and guiding policy interventions that can close coverage gaps and ensure equitable access to vaccines.
Pakistan is among the ten LMICs where over 60% of the world’s 21 million under- and never-immunized children reside [9]. Since the launch of the EPI in 1978, vaccination services have been provided free of cost in Pakistan, leading to an increase in full immunization coverage rates from nearly 40% to 66% [10,11]. However, despite these gains, the overall burden of VPDs is still high, and routine immunization coverage remains well below the national target of 90%. Pakistan also remains one of the only two polio-endemic countries, with 20 cases of wild poliovirus 1 reported in 2022 and six in 2023 [12,13]. Significant regional disparities result in inconsistent vaccination coverage, with vaccination rates varying across provinces, from 29% in Balochistan to 80% in Punjab [14]. A major challenge contributing to low immunization rates across the country is the high number of defaulters—children not adhering to the vaccination schedule. While 88% of children start their vaccination schedule, only 73% have been reported to complete it [14]. Recent external shocks and health emergencies, such as the COVID-19 pandemic and the 2022 floods, have further disrupted vaccination efforts, increasing the number of defaulters and leaving thousands of children at risk of dying because of vaccine-preventable causes [15].
While the issue of vaccination coverage in Pakistan is well-documented, most of the research is outdated; relies on secondary survey data; often focuses on national aggregates, which can obscure regional disparities; and fails to capture comprehensive child-level analyses, particularly over a multi-year period [16,17,18,19]. Some studies examine the impact of recent events such as COVID-19 and natural disasters on routine immunization [15,20], but they lack comprehensive, long-term analyses of how these disruptions have affected vaccination rates and whether coverage has recovered. Most of the literature also has only examined coverage and timeliness in isolation, without exploring deeper issues, such as defaulter rates, recovery of defaulters, and the specific risk factors contributing to defaulters remaining uncovered. As immunization remains a high priority for the EPI and the government, there is a need for an updated assessment to understand how the immunization landscape has evolved over the years, identifying children who have been consistently left behind and examining the impact of disruptions like the COVID-19 pandemic and the 2022 flooding. Our study addresses these gaps and provides a timely, comprehensive analysis of vaccination trends and defaulter rates. Such an assessment will be crucial for developing targeted, evidence-based strategies to improve vaccine delivery and system resilience, ensuring that all children receive the necessary vaccinations and that immunization programs are responsive to evolving needs and challenges.
We leveraged the Government of Sindh’s Provincial Electronic Immunization Registry data to conduct a comprehensive 5-year analysis of child-level longitudinal immunization records, focusing on birth cohorts from 2018 to 2023 in Sindh province, Pakistan. We examined trends in immunization coverage and timeliness for children born in the last five years to understand the progress in immunizations, and we conducted an in-depth analysis of defaulter children to delineate their socio-demographic characteristics, coverage rates in the context of external shocks, and risk factors associated with missed vaccinations.

2. Materials and Methods

2.1. Population

Sindh, the second most populous province located in Southern Pakistan, has a population of 55.7 million people and contributes nearly 30% to the country’s GDP [21,22]. Administratively, the province is divided into six divisions, which are further subdivided into 30 districts and 1123 union councils (UCs), which are the smallest administrative units [23]. The literacy rate in Sindh stands at 58%, and nearly half of the province’s population live in rural areas, of which 37% live below the poverty line (earning less than USD 2.15 per day) [24,25]. The under-five mortality rate in Sindh is 46 per 1000 live births, while the infant mortality rate is 39 per 1000 live births [26]. Sindh has an annual birth cohort of 1.8 million, with an immunization coverage rate well below the national average, at only 44% [26]. Vaccinations are primarily administered through three methods, namely fixed immunization sites, which are permanent healthcare facilities; routine outreach, where healthcare teams travel to communities within a day’s reach of the immunization center; and enhanced outreach activities (EOAs), which are a series of intensive immunization sessions targeting geographic areas beyond the routine outreach radius, particularly those with low coverage [27].

2.2. External Natural Shocks Impacting Immunization in Sindh

Over the past five years, several external shocks have affected routine immunization services in the Sindh province, Pakistan. The first confirmed case of COVID-19 in Pakistan was reported in Karachi, Sindh’s largest city, on 26 February 2020, followed by the first recorded death in the province on 20 March 2020 [28]. The pandemic led to various lockdown measures, beginning with a nationwide lockdown in March 2020 and eventually transitioning to a “smart lockdown” strategy targeting hotspot areas [29]. The pandemic was officially declared no longer a public health emergency as of 5 May 2023 [30].
In July 2022, Sindh was again severely affected by catastrophic floods caused by unprecedented monsoon rains, which displaced millions, destroyed infrastructure, and caused significant agricultural losses [31]. Both the COVID-19 pandemic and intense flooding disrupted health activities, particularly immunization efforts, and contributed to the outbreak of other VPDs, such as measles, polio, and diarrhea [15].

2.3. Data Source

We used immunization records from the Government of Sindh’s Electronic Immunization Registry (SEIR aka Zindagi Mehfooz (Safe Life) Electronic Immunization Registry (ZM-EIR)). The ZM-EIR utilizes Android technology to manage immunization procedures, enabling vaccinators to use smartphones to enroll children aged 0–23 months at their first vaccination through the registry and to follow up and track subsequent immunization events. The ZM-EIR collects comprehensive data, including children’s demographics, immunization details, the health facility, vaccinator information, and the geolocation of vaccinations. It tracks each child’s record using a unique identifier and monitors vaccinators’ performances and system usage compliance. Initially piloted in 2012, the ZM-EIR was scaled up across Sindh province in October 2017 as the Sindh Electronic Immunization Registry. As of May 2024, the ZM-EIR is being used by 4040 vaccinators (including 14.2% females) working at 2022 immunization centers and has enrolled over 10.6 million children and 4.3 million women, recording over 132 million individual-level immunization events.

2.4. Vaccination Schedule

Pakistan’s routine EPI immunization schedule includes six visits and covers 12 VPDs [10]. The vaccination schedule is as follows. The BCG (Bacille Calmette-Guérin) and oral polio vaccine (OPV-0) are administered at birth. At 6 weeks of age, the first doses of the pentavalent vaccine (DPT, HepB, and Hib), the pneumococcal conjugate vaccine (PCV-1), and the oral polio vaccine (OPV-1) are given. This is followed by the second doses of these vaccines at 10 weeks (Penta-2, PCV2, and OPV-2), and the third doses at 14 weeks (Penta3, PCV3, OPV-3), along with the first dose of inactivated polio vaccine (IPV-1) at 14 weeks. Additionally, the schedule includes two doses of rotavirus vaccine at 6 and 10 weeks (Rota-1 and Rota-2). The second dose of inactivated polio vaccine (IPV-2) is administered at 9 months, alongside the first dose of the measles–rubella vaccine (Measles-1). At 15 months, the second doses of the measles–rubella vaccine (Measles-2) and the typhoid conjugate vaccine (TCV) are given. The typhoid conjugate vaccine (TCV) was introduced into the routine immunization schedule on 1 January 2020, while the second dose of IPV was added on 3 May 2021.

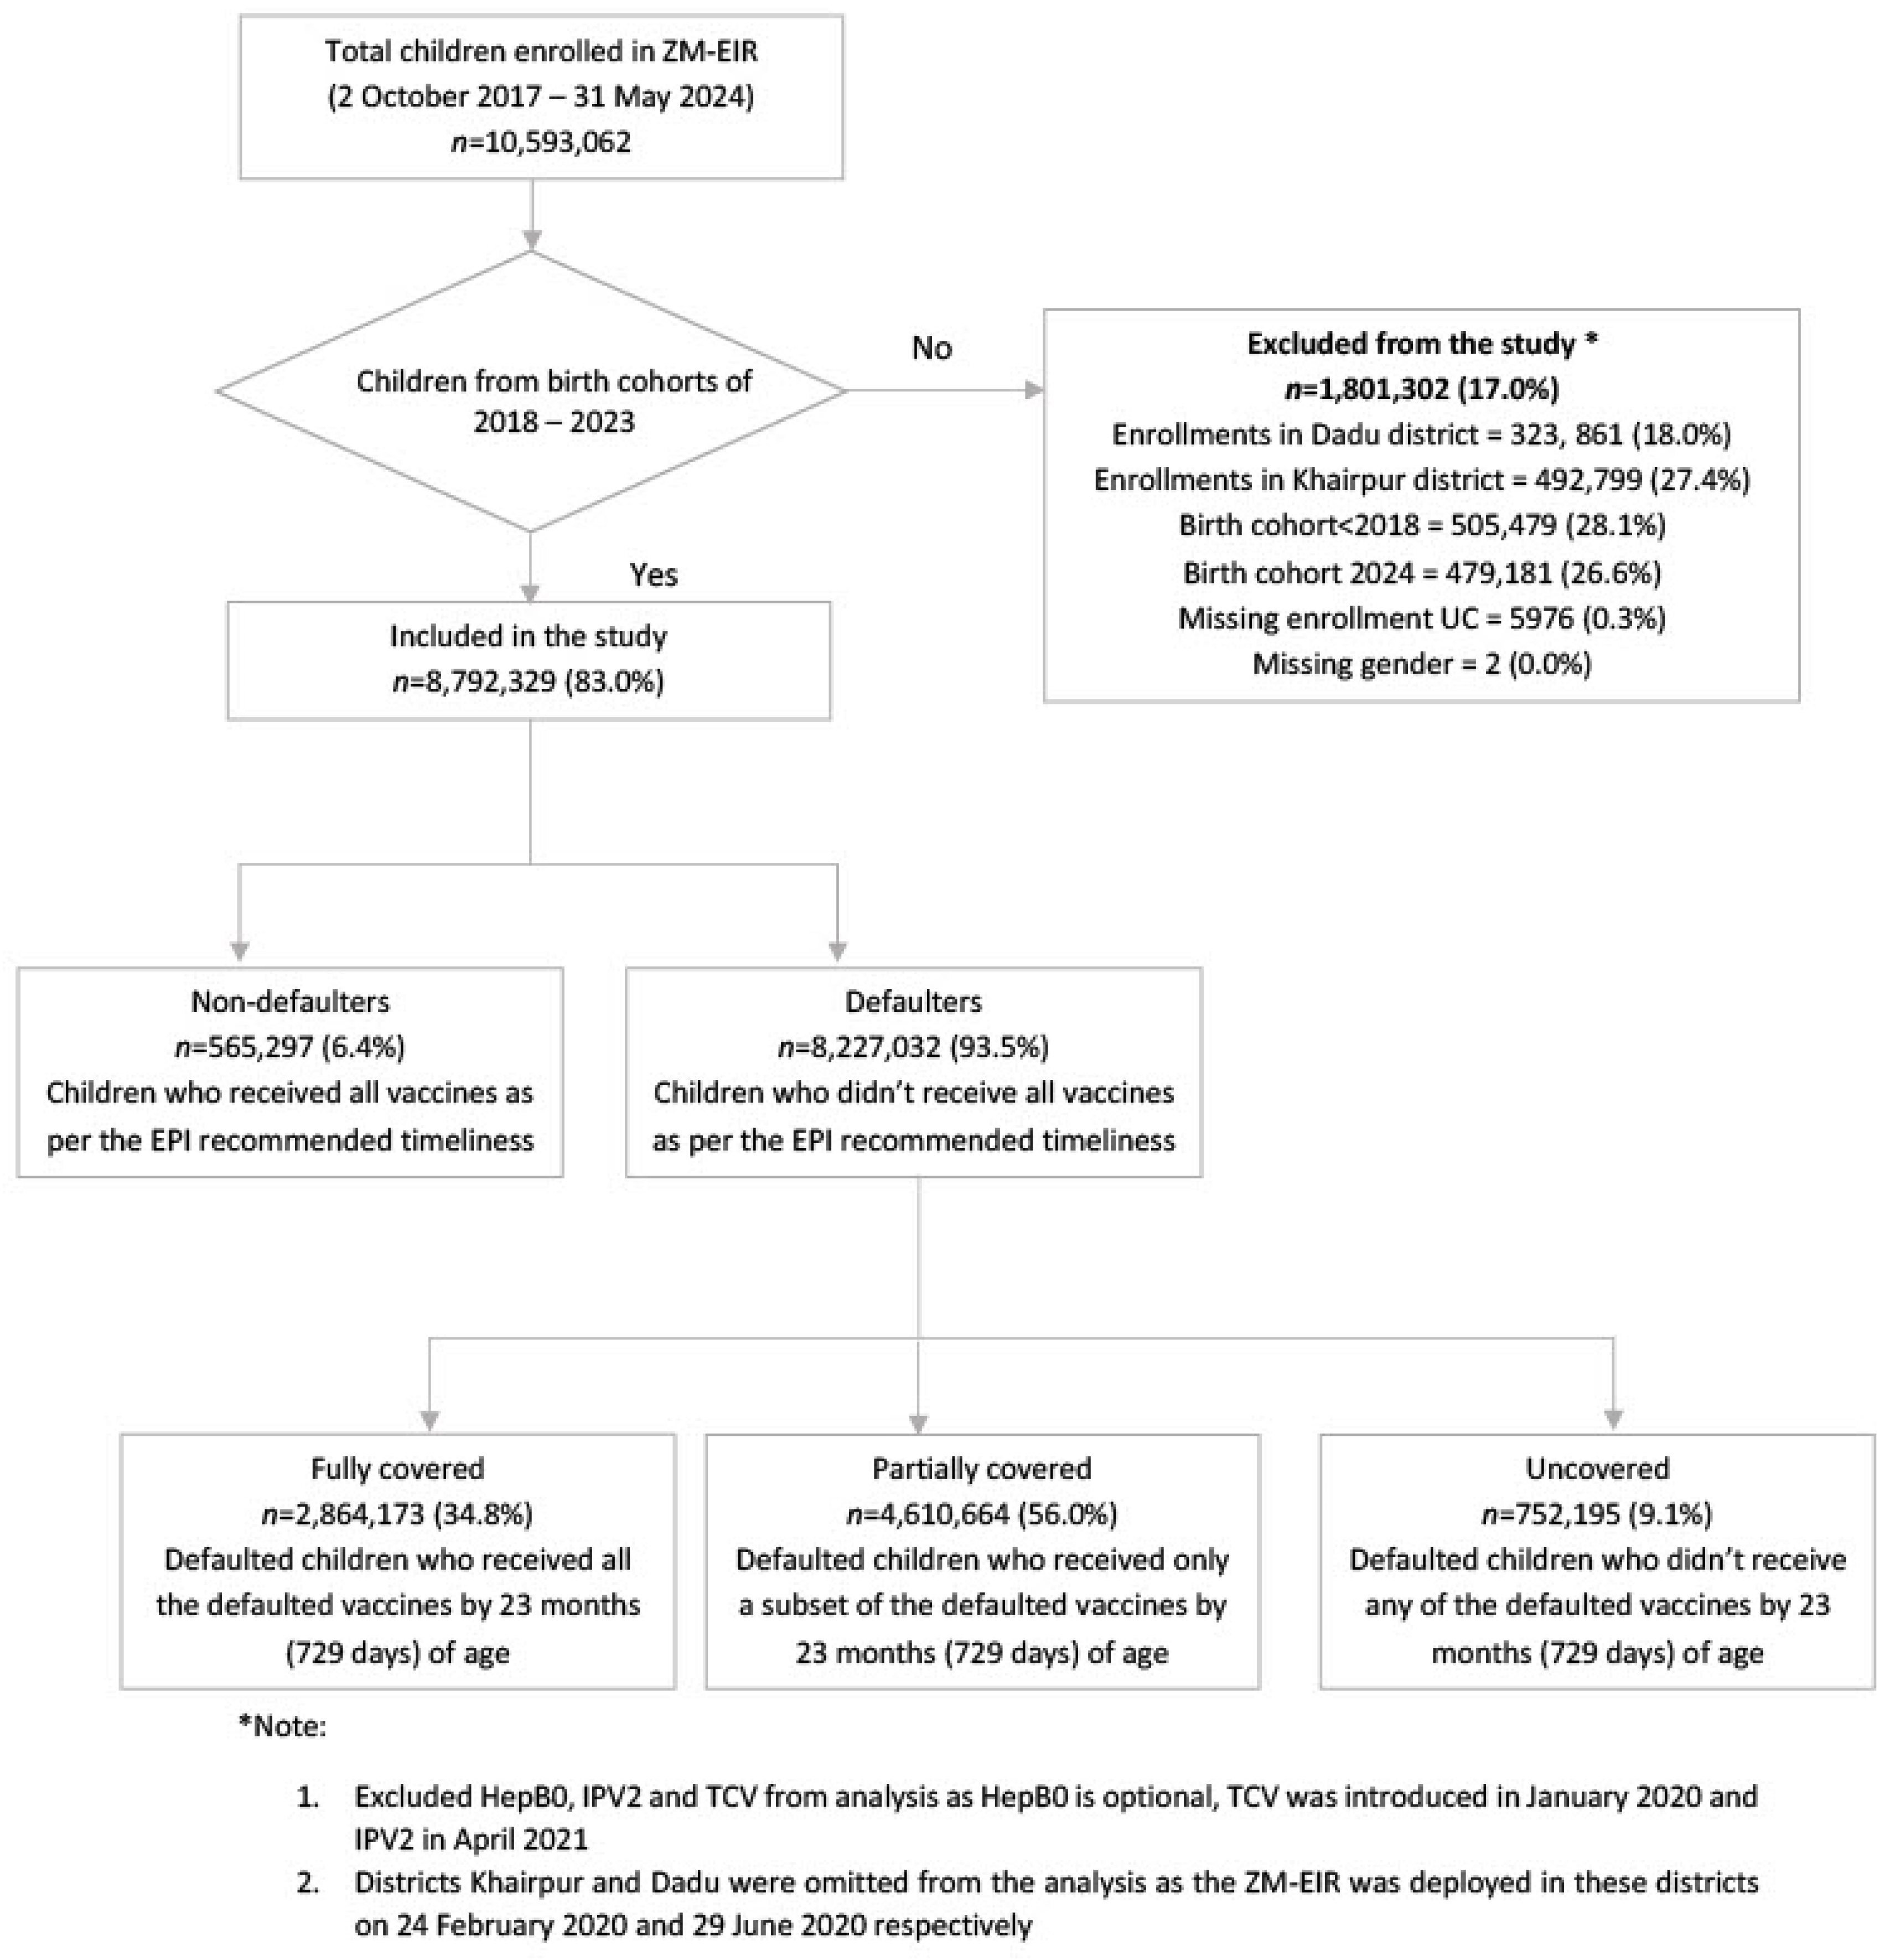
2.5. Study Design and Procedure

We used data for 10,593,062 children enrolled in the ZM-EIR between 2 October 2017, and 31 May 2024. Based on specific inclusion criteria, we extracted child-level longitudinal immunization records from the 2018 to 2023 birth cohorts in Sindh, Pakistan. Children from birth cohorts preceding 2018 and from the birth cohort of 2024, and those with missing enrollment UC data and gender were excluded (Figure 1). We also excluded HepB0, IPV-2, and TCV from our analysis, as HepB0 is optional and TCV and IPV-2 were introduced in January 2020 and April 2021. Data from District Khairpur and District Dadu were omitted from the analysis, as the ZM-EIR was deployed in these districts in 2020. This resulted in a 17% reduction of the original dataset of 10.5 million. Our final analytical sample consisted of records for 8,972,329 children. Our analytical period ranges from 1 January 2018 to 31 May 2024.
We extracted data on demographic information (gender, age, birth year, and mother’s education), immunization history (vaccines received, dates of administration, and geo-coordinates of the vaccination sites), and modality of immunization service delivery (fixed, routine outreach, or enhanced outreach). We also gathered details about the place of birth (home, maternity home, or hospital), provision of the caregiver’s CNIC and contact information, whether the caregiver opted for SMS reminder services at the time of the child’s enrollment, and residential areas and subareas (urban vs. rural, non-remote rural vs. remote rural, and urban slums vs. urban non-slums). Missing data were handled differently depending on the type of analysis. For antigen-specific analyses, like assessing antigen-wise coverage and up-to-date coverage, only records with missing information on the vaccination date for that specific antigen were excluded. Only cases where the exact vaccination date was unavailable were excluded to maintain the accuracy of the timeline analysis, even if the child was confirmed to have been vaccinated. This approach preserved the integrity of the analysis while still maintaining an adequate sample size. Similarly, for reporting socio-demographic characteristics and other predictors, missing data were handled on a variable-by-variable basis. If a record had missing information for a particular variable, it was excluded from the analysis for that specific variable. The proportions of missing values for each variable are clearly reported in the footnote of the tables to ensure transparency. For the multivariable analysis, our analytical sample consisted of 16% (1,434,185/8,792,392) of the child-level sample because observations with missing values were excluded because of Stata’s default list-wise deletion.
We followed the Strengthening the Reporting of Observational Studies in Epidemiology (STROBE) guideline to ensure completeness of reporting [32].

2.6. Outcome and Measures

The primary outcome of our analysis was the receipt of EPI-recommended vaccinations (BCG, polio, penta, PCV, rotavirus, and measles) for children from the birth cohorts of 2018 to 2023. We included outcome data for children up to 23 months (729 days) of age, with right censoring applied to account for the EPI-recommended target vaccination age for children under two. For the 2022–2023 birth cohorts, adjustments were made to accommodate children who had not yet reached 23 months by the end of the study period. For all birth cohorts, at least a five-month buffer period was provided, as the analysis was conducted until 31 May 2024.
We analyzed immunization coverage in several ways, including antigen-wise coverage, which refers to the proportion of children vaccinated by 23 months in each birth cohort. Cumulative up-to-date coverage was also assessed at key age milestones, namely 6, 12, 18, and 23 months, by dividing the number of children vaccinated at each milestone by the number of children eligible for vaccination at that time. Children who had not yet turned 23 months were excluded from this calculation. Additionally, dropout rates were determined by calculating the percentage difference between the number of children who received the first and last vaccines in the EPI schedule. For instance, the BCG-to-Measles-1 dropout rate was calculated by subtracting the number of children vaccinated with Measles-1 from those vaccinated with BCG and then dividing it by the number of children who received BCG. We report dropout rates across various antigens, including BCG to Penta-1, Penta-2, Penta-3, Measles-1, and Measles-2; Penta-1 to Penta-2, Penta-3, Measles-1, and Measles-2; Penta-2 to Penta-3, Measles-1, and Measles-2; Penta-3 to Measles-1 and Measles-2; and Measles-1 to Measles-2.
Vaccine timeliness was assessed by determining the proportion of children who received each vaccine within the recommended time frame. This analysis was limited to children who received the vaccine and was compared across different birth cohorts. We also compared immunization modalities, such as fixed immunization sites, routine outreach, and enhanced outreach programs, across birth cohorts to better understand coverage patterns.
We categorized children as non-defaulters if they received all vaccines according to the EPI-recommended timeliness range. Children who missed any vaccines, as per the EPI recommended timeliness range (Supplementary Table S1), were classified as defaulters. Children younger than the recommended age for a specific vaccine were not considered defaulters. Among defaulters, we defined those who received all missed vaccines by 23 months of age as fully covered, those who received some missed vaccines as partially covered, and those who received none of the vaccines as not covered (Figure 1). We also conducted an in-depth analysis of defaulter children and compared the sociodemographic characteristics of children based on their defaulter status and examined the impact of external shocks, such as the COVID-19 pandemic and the 2022 floods, on the distribution and coverage of defaulters. For age-appropriate coverage, we considered all children eligible for a specific vaccine and categorized children as uncovered if they did not receive the vaccine they were eligible for, regardless of whether they had reached 23 months of age. Lastly, we used defaulter coverage status as an outcome in a multivariable regression to identify key predictors of defaulters who were not covered for any vaccines.

2.7. Statistical Analysis

We reported frequencies and percentages for categorical data and median and interquartile range (IQR) for continuous data, categorized by birth year and defaulter status. The percentage of missing entries for variables such as child’s place of birth, enrollment modality, mother’s education, and SMS reminder enrollment has also been reported in the footnotes of the table. We compared up-to-date coverages at 6, 12, 18, and 23 months across vaccines and by defaulter status across birth cohorts. Univariate and multivariable logistic regression was used to identify predictors of uncovered defaulter children for any missing vaccines. We used a forward stepwise approach for the final multivariable model selection, with gender as a lock term, specifying a p-value of 0.05 for entry and 0.10 for removal to identify the model with the lowest Akaike’s Information Criterion (AIC) score [33]. All tests were two-sided, and statistical significance was set at 0.05. Statistical analyses were conducted using Stata, version 17 (StataCorp, College Station, TX, USA). We utilized digital maps in QGIS (version 3.16.7-Hannover) to visualize defaulter coverage by district and birth cohort.

3. Results

3.1. Overview of Immunization Coverage and Timeliness

Between 1 January 2018 and 31 May 2024, 8,792,329 children were enrolled in the ZM-EIR from the birth cohorts of 2018 (11.7%), 2019 (15.4%), 2020 (16.2%), 2021 (16.6%), 2022 (20.3%), and 2023 (19.9%). Overall, across the years, coverage was highest for BCG (2018: 81.8%, 2019: 82.6%, 2020: 87.0%, 2021: 86.8%, 2022: 90.3%, and 2023: 91.2%) and lowest for Measles-2 (2018: 48.2%, 2019: 57.5%, 2020: 65.8%, 2021: 74.4%, 2022: 64.8%) (Table 1). There was a gradual improvement in immunization coverage for all antigens across birth cohorts. Almost 23% more children were fully immunized in 2022 than in the 2018 birth cohort (FIC-M1 without PCV: 47.5% in 2018 to 70.7% in 2022; and FIC-M2 without PCV: 33.5% in 2018 to 55.7% in 2022). Dropout rates declined across the birth cohorts for children enrolled in the EIR (Supplementary Figure S1). Up-to-date coverage at 23 months was higher than the up-to-date coverages at 6, 12, and 18 months for all antigens (Penta-3: 37.8% at 6 months, 66.0% at 12 months, 74.4% at 18 months, and 77.3% at 23 months) (Figure 2). Up-to-date coverage at all ages was the highest for the birth cohort of 2022 (Penta-3: 86.4% at 23 months) and the lowest for the 2018 birth cohort (Penta-3: 64.6% at 23 months) (Supplementary Figure S2).
Overall, vaccine timeliness declined from the 2018 to 2021 birth cohorts but increased from 2022 to 2023 (Figure 3). Amongst all antigens, BCG had the highest percentage of doses administered on time (2018: 63.6%, 2019: 60.4%, 2020: 58%, 2021: 52.4%, 2022: 52.2%, and 2023: 60.9%). The lowest timeliness was observed for Penta-3 (2018: 23.8%, 2019: 21.9%, 2020: 18.7%, 2021: 14.0%, 2022: 19.5%, and 2023: 26.5%) and Measles-2 (2018: 22.9%, 2019: 25.4%, 2020: 21.5%, 2021: 28.5%, 2022: 34%, 2023: 60.0%). Kaplan–Meier curves show that more than 50% of all three doses of the pentavalent vaccine were given after the recommended EPI age for each birth year (Supplementary Figure S3). Median time intervals between doses for all antigens are presented in Supplementary Table S2. These intervals were consistently longer than recommended, with the longest intervals observed for children born in 2021 (Penta-2 to Penta-3: Median = 53 days, IQR = 34–87; recommended interval = 28 days).
Examining the pattern of immunization modalities through which children were vaccinated, we observe that, for children born in 2018 and 2019, the majority of vaccinations were given through fixed immunization sites (63.6% and 48.9%, respectively). However, for children born in 2020, most of the vaccinations (41.6%) were provided through enhanced outreach activities (Figure 4). For later birth cohorts from 2021 to 2023, almost half of the immunization doses were administered through outreach activities (2021: 47.5%, 2022: 56.8%, and 2023: 49.6%). Antigen-wise comparison of immunization doses administered through fixed, outreach activities, and EOA by birth year and vaccines are presented in Supplementary Figure S4. Across all birth cohorts, vaccines given earlier in life (BCG) were mainly given at fixed sites (Range: 46.0–76.4%), while for later vaccines such as Penta-3, Measles-1, and Measles-2, a higher proportion were given through outreach (range: Penta-3 = 24.9–59.9%, Measles-1 = 23.4–65.8%, and Measles-2 = 20.7–65.8%) or EOA activities (range: Penta-3 = 7.8–44.8%, Measles-1 = 10.4–43.9%, and Measles-2 = 2.4–53.5%).

3.2. Trends in Coverage and Predictors of Immunization Defaulters

Among all children in our sample, 6.4% (565,297/8,792,329) were non-defaulters, and 93.6% (8,227,032/8,792,329) were defaulters (Table 2). Of these defaulters, 34.8% (2,864,173/8,227,032) were fully covered, 56.0% (4,610,664/8,227,032) were partially covered, and 9.1% (752,195/8,227,032) were not covered for any of the recommended vaccines by 23 months of age. The proportion of defaulters decreased from 94.7% to 87.1%, while the proportion of uncovered defaulters declined from 16.2% to 8.0% across the birth cohorts from 2018 to 2023. The proportion of defaulters (94.7% vs. 87.1%) and uncovered defaulters (16.2% vs. 8.0%) decreased across the birth cohorts from 2018 to 2023 (Figure 5). The birth cohorts of 2020 and 2021 saw the highest default rates (96.2% and 96.5%), respectively.
By examining the socio-demographic characteristics of the different defaulter categories, we observe that there was no difference in the proportion of male and female children who were non-defaulters (male: 6.4% vs. female: 6.5%) or defaulters (male: 93.6% vs. female: 93.5%) (Table 2). In terms of geographic distribution, a higher proportion of defaulters was observed in remote rural areas (98%), followed by non-remote rural areas (96.5%) and urban areas (91.2%). However, urban areas had more uncovered defaulters (12.7%), compared to both remote rural areas (3%) and non-remote rural areas (5%). Urban non-slum areas had a higher proportion of defaulters than urban slums (96.7% vs. 91.2%), but more defaulters in urban slums (12.7%) were uncovered. Children born at home had a higher default rate (96.4%) than those born in maternity homes (92.2%) and hospitals (88.9%). A greater proportion of these hospital-born children, however, remained uncovered (14.1%) compared to those born at home (7.4%). Children enrolled through EOAs had a higher default rate (98.1%) compared to those enrolled through fixed sites (90.9%), outreach (95.8%), and mobile immunization vans (96.9%). Yet, a higher proportion of defaulters remained uncovered at fixed sites (13.8%). Among children whose mothers had no education, 97.1% defaulted compared to the lower default rates among those with higher education levels (6–8 years: 93.3%, 9–10 years: 89.7%, and >11 years: 86.3%). Conversely, 23.5% of defaulter children with highly educated mothers (>11 years of education) were not covered for any vaccine, compared to only 8.7% of defaulter children with mothers who had no education.
Up-to-date coverage rates at 6, 12, 18, and 23 months were higher for non-defaulters compared to defaulters (Table 3). The difference in coverage rates was more pronounced for vaccines administered later in the schedule (difference for up-to-date coverage at 6 months between non-defaulters and defaulters; BCG: 18.3%; Penta-1: 20%; Penta-2: 36.5%; and Penta-3: 56.5%). However, as children grew older, the difference between non-defaulters and defaulters became less (BCG: 18.3% at 6 months vs. 10.2% at 23 months). Nevertheless, the difference remained more pronounced for later vaccines (Measles-1: 40.4% at 12 months vs. 18.6% at 23 months). The difference between age-appropriate immunization coverage of non-defaulters and defaulters decreased across birth cohorts (FIC-M1 (without PCV) at 23 months: 34.5% in 2018 vs. 23.3% in 2020) (Supplementary Tables S3.1–S3.4).
By overlaying the proportion of defaulter children with key external shocks between 2018 and 2023, we saw that, even prior to the COVID-19-induced disruptions, (1 January 2018 to 22 March 2020), the percentage of defaulters was high, at 95.7% (Table 4). The proportion of defaulters remained high (>95%) throughout the COVID-19 lockdowns and disruptions, as well as the 2022 floods, only decreasing gradually at the start of 2023 (to 82.4%). The proportion of uncovered defaulters was the highest during the pre-pandemic time (1 January 2018–22 March 2020) and during the initial lockdowns (23 March–9 May 2020) (>10%) but then reduced to almost half during the pandemic’s last duration (17.1% vs. 6.6%) (Table 4; Figure 5).
Table 5 reports the predictors of uncovered defaulters vs. immunized children among children from the 2018 to 2023 birth cohorts. Children born in maternity homes (OR = 0.81, 95% CI: 0.79–0.83, p < 0.001) and at home (OR = 0.83, 95% CI: 0.82–0.84, p < 0.001) were less likely to be uncovered defaulters compared to those born in hospitals. Those born in remote rural areas demonstrated a decreased likelihood of being uncovered defaulters (OR = 0.80, 95% CI: 0.78–0.83, p < 0.001), while those in urban areas (OR = 1.54, 95% CI: 1.52–1.56, p < 0.001) were more likely to be uncovered defaulters compared to those in non-remote rural areas. Enrollment modality also influenced the default rates. Children enrolled through fixed sites (OR = 2.11, 95% CI: 2.08–2.15, p < 0.001) and mobile immunization vans (OR = 1.41, 95% CI: 1.13–1.77, p = 0.003) had a higher risk of being uncovered, while those enrolled through the EOAs (OR = 0.69, 95% CI: 0.67–0.72, p < 0.001) were less likely to be uncovered defaulters compared to those enrolled through outreach. Children of mothers with lower education levels were less likely to be uncovered defaulters compared to those with more education (0 years: OR = 0.72, 95% CI: 0.71–0.74, p < 0.001; 9–10 years: OR = 0.78, 95% CI: 0.76–0.81, p < 0.001). Later birth cohorts showed lower odds of being uncovered defaulters compared to those born in 2018 and 2019 (OR = 0.57, 95% CI: 0.57–0.58, p < 0.001), 2020 (OR = 0.40, 95% CI: 0.39–0.41, p < 0.001), 2021 (OR = 0.25, 95% CI: 0.24–0.25, p < 0.001), 2022 (OR = 0.25, 95% CI: 0.24–0.25, p < 0.001), and 2023 (OR = 0.34, 95% CI: 0.33–0.34, p < 0.001).

4. Discussion

Our analysis of routine immunization coverage for children enrolled in the ZM-EIR from the 2018 to 2023 birth cohorts in Sindh, Pakistan demonstrates an over 20% increase in full immunization coverage, accompanied by a decline in dropouts over the 5-year period. Fewer children received vaccines timely from the 2018 to 2021 birth cohorts. However, there was some improvement from 2022 to 2023. There was a high proportion of defaulters (>90%) in all birth cohorts, particularly in the most marginalized groups (remote rural areas, children born at home, those enrolled in outreach, EOAs or MIVs, and those with uneducated mothers). The proportion of uncovered defaulters peaked before and during early COVID-19 lockdowns but was significantly reduced towards the end of the pandemic. Factors such as residence, place of birth, enrollment modality, maternal education, and birth year influenced a child’s likelihood of being an uncovered defaulter.
We observed a consistent upward trend in immunization coverage rates over the 5-year period from 2018 to 2023. However, this overall trend masks the underlying inequities and challenges that hinder efforts to achieve universal immunization targets. Recent disruptions associated with the pandemic, and the severe flooding of 2022, have been reported to reverse some of the positive immunization trends and led to reduced coverage rates in Pakistan [15,17]. The findings from our earlier work also show that one in two children missed routine vaccinations during the first lockdown in Sindh [20]. While we observed an overall increasing trend in coverage, even in the COVID-19 and post-COVID-19 years, our findings do provide evidence of disruptions during the peak pandemic years (2020 and 2021), where we observed a high default rate (>95%), and a decline in vaccine timeliness. Despite these challenges, the overall improvement in coverage can be attributed to the fact that nearly half of all vaccine doses administered during these peak pandemic years (2020 and 2021) were delivered through outreach efforts or EOAs, which could have likely mitigated the negative impact of the pandemic by focusing on catching up on missed vaccines [34]. A 2023 UNICEF report also identified Pakistan as one of five South Asian countries that successfully restored immunization rates to pre-pandemic levels through initiatives targeting high-risk and vulnerable communities [35]. In Sindh particularly, policies including a dedicated workforce for EPI tasks, adaptive outreach strategies, flexible vaccination sites, strengthened supply chains, and enhanced public awareness helped sustain and recover routine immunization [36].
The timeliness of vaccination also showed varying trends. Fewer children received their vaccines on time from the 2018 to 2021 birth cohorts, which could partly be explained by disruptions caused by the COVID-19 pandemic. These disruptions affected the regular vaccination schedule, leading to delays and missed doses during the pandemic years. However, some improvements in timeliness were observed from the 2022 and 2023 birth cohorts, signaling a recovery as routine health services resumed, and catch-up campaigns were initiated. Timeliness was particularly low for vaccines administered later in life, such as Penta-3, Measles-1, and Measles-2, which are given at 14 weeks, 9 months, and 15 months of age, respectively, illustrating challenges to maintaining continuity in the vaccination schedule. Our findings are in line with other studies in Pakistan that report lower timeliness for older children because of mainly logistic challenges, which result in lower compliance with vaccination appointments [37,38]. Our analysis of age-specific vaccines and timeliness fills an important gap in the literature by providing detailed insights into how delays and dropouts occur at different stages of the immunization schedule. This information is crucial for identifying points in the schedule where targeted interventions can improve coverage and timeliness.
Consistent with global statistics, we found that BCG coverage was consistently the highest across all birth cohorts, whereas Penta-3 and Measles-2 coverage remained the lowest [37,39,40,41]. Additionally, while coverage rates were higher among non-defaulters compared to defaulters throughout, this difference was more pronounced for vaccines administered later in life. BCG often achieves higher coverage due to its administration at birth or shortly thereafter (especially in health facilities), whereas later vaccines, such as Penta-3 and Measles-2, face hurdles such as logistical challenges, low awareness, and vaccine hesitancy [18,42]. Lower coverage for Penta-3 and Measles-2 may also reflect gaps in the continuity of vaccination campaigns, especially in remote and underserved areas where health system disruptions, including reduced outreach services during the pandemic, were most pronounced [43]. Our results also confirm that earlier vaccines like BCG were primarily administered at fixed sites, whereas later vaccines were often delivered through supplementary and catch-up activities (outreach, EOAs, etc.). While this reliance on supplementary immunization strategies ensured coverage for many children, it highlights the underlying gaps in the regular immunization delivery system. There is a need for in-depth studies to understand the factors contributing to the decline in vaccination coverage during the critical 9–15-month period for designing and implementing tailored strategies to address these gaps.
We found that children from remote rural areas, those born at home, those enrolled in the registry through modalities other than fixed sites, and those with uneducated mothers had higher default rates. For children born at home, the higher defaulter rates may stem from limited postnatal care access and cultural practices that reduce formal healthcare visits soon after birth, hindering early integration into the immunization system [44]. Despite more children defaulting in these groups, they had a lower risk of being left uncovered for missed vaccines up to 23 months of age. These findings are somewhat counterintuitive and contrast with the previous research that indicates that the factors associated with parental education, place of birth, and residence typically have a protective effect against missing vaccinations [45,46]. Our contradictory findings could possibly be because, while the most marginalized groups are more likely to default on vaccines, catch-up immunization strategies have been successful in reaching these high-risk populations who may otherwise face barriers to accessing vaccination services [34,42]. Our data also suggest that reliance on supplementary immunization activities (especially for later vaccines and during 2021–2023) could have helped maintain coverage rates, ensuring broader reach among traditionally marginalized groups and addressing the needs of these high-risk populations. It is important to note that, while much of the literature focuses on the factors associated with the risk of defaulting on vaccines, our novel approach—assessing predictors of uncovered defaulters—provides a fresh perspective on the likelihood of achieving coverage among defaulters for missed immunizations.
While our study provides valuable insights into immunization coverage in Sindh province, Pakistan, it has certain limitations. For the multivariable analysis, our analytical sample consisted of only 16% (1,434,185/8,792,392) of the original sample, affecting the reliability and robustness of our findings. As such, the multivariable variables results should be interpreted carefully, particularly in terms of the generalizability of our findings to other settings. Our focus was to provide preliminary insight to the readers on the direction of our results rather than the precise magnitude of the effect size. We emphasize the need for further research with larger sample sizes and combining quantitative data with qualitative data to provide additional insights and help contextualize our findings. It is also important to interpret the lower coverage rates observed in the 2022 and 2023 birth cohort with caution, as many children born in that year may not yet be due for several vaccines scheduled later in life, such as Penta-3 and Measles-2. To avoid the impact of this unequal time of analyses (less than 2 years) for children from the last two birth cohorts (2022 and 2023) and to ensure the reliability of our interpretations, we used proportions for outcomes such as timeliness of vaccines. Some of the vaccination data were collected retrospectively, which may have led to missing information, particularly regarding vaccination dates, due to caregivers’ inability to recall exact dates. While our study identifies associations between factors and the likelihood of being an uncovered defaulter, it is indeed descriptive in nature and does not aim to establish causality. However, as a descriptive analysis, the findings highlight trends and potential relationships, which should be further explored through more robust study designs. Additionally, despite in-built checks in the ZM-EIR app to ensure data reliability, such as locking inaccurate entries and restricting field formats, variability in data entry practices may still occur. Lastly, the generalizability of our results may be limited, as the data are specific to Sindh province and may not fully represent immunization trends in other regions of Pakistan or countries with different health systems. Following the decentralization of the EPI, the provinces have implemented immunization policies according to their contextual requirements. However, the large overarching direction of mass disease prevention policies and agenda remain unified for the country. As such, our findings provide a microcosmic view of Pakistan’s larger immunization landscape, as Sindh’s efforts, policies, and challenges are reflective of nationwide trends. Moreover, challenges and contexts faced by immunization systems are common across low-resource settings, and this commonality suggests that our findings will provide valuable insights for other regions facing similar challenges.
Our findings carry important implications for the immunization efforts in Sindh, Pakistan, and similar low-resource settings. We leveraged big data derived from records of >8 million children to provide a comprehensive and in-depth analysis of immunization coverage, timeliness, and defaulters in Sindh, Pakistan. Our analysis goes beyond merely assessing overall coverage and timeliness; it provides a comprehensive examination of defaulter children, their sociodemographic characteristics, and the risk factors associated with missed vaccines, while also exploring coverage rates in the context of external shocks. The successful recovery of immunization rates, despite major disruptions such as the COVID-19 pandemic and the 2022 floods, reflects the resiliency of the system and the effectiveness of timely, targeted data-driven interventions and adaptive strategies aimed at reaching marginalized groups. This also emphasizes the need for continued investment in vaccination infrastructure, especially in remote and high-risk regions. To improve coverage and address disparities, a coordinated effort among all stakeholders (policymakers, provincial and national governments, health departments, international and local multilateral organizations, etc.) is required to enhance outreach and community engagement, particularly in high-default areas. Integrating real-time data into vaccination programs can further facilitate evidence-based planning and implementation.
Future strategies should focus on strengthening vaccine delivery systems to ensure equitable access, address systemic barriers, and improve timeliness, especially for vaccines scheduled beyond infancy. Additionally, systematic follow-up with defaulters is crucial to completing vaccination schedules. Further work is needed to investigate the underlying reasons for vaccine-specific dropout rates, evaluate the effectiveness of outreach and catch-up vaccination campaigns to refine strategies that effectively target high-risk populations, and assess the long-term impact of external disruptions like COVID-19 and flooding. Future studies with experimental designs are also needed to establish causal relationships between various factors and the likelihood of being uncovered defaulters.

5. Conclusions

Our study demonstrates improvements in immunization coverage across birth cohorts in Sindh, Pakistan, alongside a reduction in dropout rates from 2018 to 2023. While the timeliness of vaccination declined from 2018 to 2021, it showed recovery in 2022 and 2023. Despite a high proportion of children defaulting on due vaccines, the majority were covered for missed vaccinations, while the percentage of uncovered defaulters decreased over time. Key predictors of uncovered defaulters include birthplace, residential area, enrollment modality, and maternal education. However, it is important to acknowledge that these findings are based on the available data, which may not be fully representative of all populations. Moving forward, a collaborative approach involving all stakeholders is essential to address systemic barriers and improve outreach efforts. To create a more robust immunization system, the focus should be on addressing improving vaccine accessibility, particularly in underserved areas, and implementing targeted follow-up and catch-up vaccination strategies. Strengthening data systems for real-time monitoring, increasing public awareness, and engaging communities, especially through maternal education, are essential to reduce default rates. Future research should focus on understanding the factors contributing to high default rates and identifying reasons for vaccine dropouts to guide the development of targeted strategies and policies to ensure comprehensive coverage for defaulters. Further studies with experimental designs are needed to establish the causal relationships between various factors and the likelihood of being uncovered as defaulters. Building a robust and adaptable immunization system is vital for safeguarding the health of all children in Pakistan and ensuring that they receive the vaccines they need for a healthier future.

Supplementary Materials

The following supporting information can be downloaded at: https://www.mdpi.com/article/10.3390/vaccines12121327/s1, Table S1: EPI recommended vaccination age and timeliness; Table S2: Time interval between the administration of subsequent doses among children from 2018 to 2023 birth cohorts enrolled in ZM-EIR across Sindh, Pakistan by birth cohort (n = 8,792,329) 1 January 2018–31 May 2024; Table S3.1: Antigen-wise age-appropriate coverage rates at 6 months among children from 2018 to 2023 birth cohorts enrolled in ZM-EIR across Sindh, Pakistan by birth cohort and defaulter status; Table S3.2: Antigen-wise age-appropriate coverage rates at 12 months among children from 2018 to 2023 birth cohorts enrolled in ZM-EIR across Sindh, Pakistan by birth cohort and defaulter status; Table S3.3: Antigen-wise age-appropriate coverage rates at 18 months among children from 2018 to 2023 birth cohorts enrolled in ZM-EIR across Sindh, Pakistan by birth cohort and defaulter status; Table S3.4: Antigen-wise age-appropriate coverage rates at 23 months among children from 2018 to 2023 birth cohorts enrolled in ZM-EIR across Sindh, Pakistan by birth cohort and defaulter status; Figure S1: Dropout rates among children from 2018–2023 birth cohorts enrolled in ZM-EIR across Sindh, Pakistan by birth cohort; Figure S2: Antigen-wise age-appropriate coverage rates at 6, 12, 18, and 23 months among children from 2018 to 2023 birth cohorts enrolled in ZM-EIR across Sindh, Pakistan by birth cohort (n = 8,792,329); Figure S3: Kaplan–Meier curves for three doses of pentavalent vaccines among children from 2018–2023 birth cohorts enrolled in ZM-EIR across Sindh, Pakistan (n = 8,792,329) by birth year; Figure S4: Antigen-wise comparison of immunization doses administered through different modalities among children from 2018 to 2023 birth cohorts enrolled in ZM-EIR across Sindh, Pakistan (n = 8,792,329).

Author Contributions

Conceptualization and design, D.A.S. and S.C.; Data curation, S.I.; Formal analysis, S.I. and M.S., input from S.C., D.A.S., and F.M.; Methodology, D.A.S., S.C., and F.M.; Project administration, V.K.D. and M.T.S. oversight from S.C. and D.A.S.; Resources, V.K.D. and M.T.S.; Supervision, S.C.; Visualization, S.I., M.S., and F.M.; Writing—original draft, F.M. and D.A.S.; Writing—review and editing, F.M. and D.A.S. All authors have read and agreed to the published version of the manuscript.

Funding

This work was supported by grants from GiveWell and Gavi, the Vaccine Alliance, to support the Government of Sindh in implementing ZM-EIR. The funders had no role in the study design, data collection, data interpretation, or report writing.

Institutional Review Board Statement

This analysis was deemed to be exempt by the Institutional Review Board of Interactive Research and Development under 45 CFR 46.101(b) (study number: IRD_IRB_2020_04_018). The IRB was registered with the U.S. Department of Health and Human Services Office for Human Research Protections with registration number IRB 404 00005148.

Informed Consent Statement

Not applicable.

Data Availability Statement

Data may be obtained from a third party and are not publicly available. The data used for this analysis from the Sindh Electronic Immunization Registry (SEIR; also known as the Zindagi Mehfooz program; ZM-EIR) can be requested from the Government of Sindh’s Expanded Programme on Immunization (EPI).

Acknowledgments

We thank the frontline health workers who vaccinate children and maintain the Sindh Electronic Immunization Registry (ZM-EIR), along with their supervisors and support staff. We also thank EPI-Sindh and the Department of Health, Government of Sindh, for their support.

Conflicts of Interest

The authors declare no conflicts of interest. The funders had no role in the design of the study; in the collection, analyses, or interpretation of data; in the writing of the manuscript; or in the decision to publish the results.

References

  1. Li, X.; Mukandavire, C.; Cucunubá, Z.M.; Londono, S.E.; Abbas, K.; Clapham, H.E.; Jit, M.; Johnson, H.L.; Papadopoulos, T.; Vynnycky, E.; et al. Estimating the Health Impact of Vaccination against Ten Pathogens in 98 Low-Income and Middle-Income Countries from 2000 to 2030: A Modelling Study. Lancet 2021, 397, 398–408. [Google Scholar] [CrossRef] [PubMed]
  2. Global Immunization Efforts Have Saved at Least 154 Million Lives over the Past 50 Years. Available online: https://www.who.int/news/item/24-04-2024-global-immunization-efforts-have-saved-at-least-154-million-lives-over-the-past-50-years (accessed on 26 July 2024).
  3. Essential Programme on Immunization. Available online: https://www.who.int/teams/immunization-vaccines-and-biologicals/essential-programme-on-immunization (accessed on 29 July 2024).
  4. Feikin, D.R.; Flannery, B.; Hamel, M.J.; Stack, M.; Hansen, P.M. Vaccines for Children in Low- and Middle-Income Countries. In Reproductive, Maternal, Newborn, and Child Health: Disease Control Priorities, Third Edition (Volume 2); Black, R.E., Laxminarayan, R., Temmerman, M., Walker, N., Eds.; The International Bank for Reconstruction and Development/The World Bank: Washington, DC, USA, 2016; ISBN 978-1-4648-0348-2. [Google Scholar]
  5. Immunization Agenda 2030. Available online: https://www.who.int/teams/immunization-vaccines-and-biologicals/strategies/ia2030 (accessed on 12 August 2024).
  6. Phase 5 (2021–2025). Available online: https://www.gavi.org/our-alliance/strategy/phase-5-2021-2025 (accessed on 12 August 2024).
  7. Dadari, I.; Belt, R.V.; Iyengar, A.; Ray, A.; Hossain, I.; Ali, D.; Danielsson, N.; Sodha, S.V. Achieving the IA2030 Coverage and Equity Goals through a Renewed Focus on Urban Immunization. Vaccines 2023, 11, 809. [Google Scholar] [CrossRef] [PubMed]
  8. Ota, M.O.C.; Badur, S.; Romano-Mazzotti, L.; Friedland, L.R. Impact of COVID-19 Pandemic on Routine Immunization. Ann. Med. 2021, 53, 2286–2297. [Google Scholar] [CrossRef] [PubMed]
  9. Immunization Coverage. Available online: https://www.who.int/news-room/fact-sheets/detail/immunization-coverage (accessed on 29 July 2024).
  10. EPI. Health Department of Sindh. Available online: https://sindhhealth.gov.pk/EPI (accessed on 30 July 2024).
  11. EMHJ. A Review of EPI Progress in Pakistan towards Achieving Coverage Targets: Present Situation and the Way Forward. Available online: http://www.emro.who.int/emhj-volume-16-2010/volume-16-supplement/article-04.html (accessed on 12 August 2024).
  12. GPEI-Pakistan. Global Polio Eradication Initiative. Available online: https://polioeradication.org/about-polio/where-we-work/ (accessed on 14 November 2024).
  13. Mbaeyi, C.; Baig, S.; Safdar, R.M.; Khan, Z.; Young, H.; Jorba, J.; Wadood, Z.M.; Jafari, H.; Alam, M.M.; Franka, R. Progress Toward Poliomyelitis Eradication—Pakistan, January 2022–June 2023. Morb. Mortal. Wkly. Rep. 2023, 72, 880–885. [Google Scholar] [CrossRef] [PubMed]
  14. National Institute of Population Studies-NIPS/Pakistan and ICF. Pakistan Demographic and Health Survey: 2017–2018. Available online: https://dhsprogram.com/publications/publication-fr354-dhs-final-reports.cfm (accessed on 11 October 2024).
  15. Ali, I.; Hamid, S. Implications of COVID-19 and “Super Floods” for Routine Vaccination in Pakistan: The Reemergence of Vaccine Preventable-Diseases Such as Polio and Measles. Hum. Vaccines Immunother. 2022, 18, 2154099. [Google Scholar] [CrossRef] [PubMed]
  16. Joachim, G.E.; Wagner, A.L.; Naseem, M.; Boulton, M.L. Trends in Childhood Vaccination in Pakistan and Associated Factors; 2006–2018. Vaccine 2024, 42, 795–800. [Google Scholar] [CrossRef] [PubMed]
  17. Ashraf, M.F.; Daim, S.U.R.; Fayyaz, H.; Ashraf, M.A.; Ashraf, M. Navigating Pakistan’s Immunization Landscape: Progress and Pitfalls. IJID Reg. 2024, 12, 100382. [Google Scholar] [CrossRef] [PubMed]
  18. Shahid, S.; Ahmed, S.; Qazi, M.F.; Ali, R.; Ali, S.A.; Zaidi, A.K.M.; Iqbal, N.T.; Jehan, F.; Imran Nisar, M. Differential Coverage for Vaccines in the Expanded Program on Immunization (EPI) among Children in Rural Pakistan. Vaccine 2023, 41, 2680–2689. [Google Scholar] [CrossRef] [PubMed]
  19. Butt, M.; Mohammed, R.; Butt, E.; Butt, S.; Xiang, J. Why Have Immunization Efforts in Pakistan Failed to Achieve Global Standards of Vaccination Uptake and Infectious Disease Control? Risk Manag. Healthc. Policy 2020, 13, 111–124. [Google Scholar] [CrossRef] [PubMed]
  20. Chandir, S.; Siddiqi, D.A.; Mehmood, M.; Setayesh, H.; Siddique, M.; Mirza, A.; Soundardjee, R.; Dharma, V.K.; Shah, M.T.; Abdullah, S.; et al. Impact of COVID-19 Pandemic Response on Uptake of Routine Immunizations in Sindh, Pakistan: An Analysis of Provincial Electronic Immunization Registry Data. Vaccine 2020, 38, 7146–7155. [Google Scholar] [CrossRef] [PubMed]
  21. Sindh: Pakistan Bureau of Statistics. 2023. Available online: https://www.pbs.gov.pk/sites/default/files/population/2023/Sindh.pdf (accessed on 7 July 2024).
  22. Economy—Government of Sindh. Available online: https://www.sindh.gov.pk/economy (accessed on 30 July 2024).
  23. Local Govts—Local Government Department. Available online: https://lgdsindh.gov.pk/wp/local-govts/ (accessed on 7 July 2024).
  24. Factsheet: Strengthening Social Protection Delivery System in Sindh. Available online: https://www.worldbank.org/en/news/factsheet/2022/12/19/factsheet-strengthening-social-protection-delivery-system-in-sindh (accessed on 30 July 2024).
  25. Government of Pakistan. Pakistan Economic Survey: 2020–2021; Finance Division, Government of Pakistan: Islamabad, Pakistan, 2021. [Google Scholar]
  26. UNICEF. Sindh 2018–2019: Child Mortality. Multiple Indicator Cluster Survey; Bureau of Statistics, Planning and Developnment Board, Government of Sindh: Islamabad, Pakistan; UNICEF: New York, NY, USA, 2021. [Google Scholar]
  27. Original Research: Prevalence, Geographical Distribution and Factors Associated with Pentavalent Vaccine Zero Dose Status among Children in Sindh, Pakistan: Analysis of Data from the 2017 and 2018 Birth Cohorts Enrolled in the Provincial Electronic Immunisation Registry—PMC. Available online: https://www.ncbi.nlm.nih.gov/pmc/articles/PMC9119190/ (accessed on 12 August 2024).
  28. Pakistan COVID—Coronavirus Statistics—Worldometer. Available online: https://www.worldometers.info/coronavirus/country/pakistan/ (accessed on 31 July 2024).
  29. Pakistan’s Response to COVID-19: Overcoming National and International Hypes to Fight the Pandemic—PMC. Available online: https://www.ncbi.nlm.nih.gov/pmc/articles/PMC8136406/ (accessed on 31 July 2024).
  30. Coronavirus Disease (COVID-19) Pandemic. Available online: https://www.who.int/europe/emergencies/situations/covid-19 (accessed on 31 July 2024).
  31. Provincial Disaster Management Authority, Rehabilitation Department, Government of Sindh. Admin Flood 2022 in Sindh. PDMA_SINDH 2023. Available online: https://pdma.gos.pk/2023/02/07/flood-2022-in-sindh/ (accessed on 12 August 2024).
  32. von Elm, E.; Altman, D.G.; Egger, M.; Pocock, S.J.; Gøtzsche, P.C.; Vandenbroucke, J.P. The Strengthening the Reporting of Observational Studies in Epidemiology (STROBE) Statement: Guidelines for Reporting Observational Studies. Lancet 2007, 370, 1453–1457. [Google Scholar] [CrossRef] [PubMed]
  33. Bago, B.; Terefe, W.; Sebagadis, G. Individual and Community Level Factors Associated with Defaulting of Immunization among 12–59 Months Children in Ethiopia: Multilevel Modeling Analysis Using 2011Ethiopia Demographic and Health Survey. Curr. Pediatr. Res. 2018, 22, 95–110. [Google Scholar]
  34. Khan, I.; Ameen, A.; Anwar, R.; Rahman, A.U.; Ali, M.W.; Khan, H.; Omair, M.; Alam, M.B. Comprehensive Outreach: Reach Every Child Initiative Expanded Program on Immunization Khyber Pakhtunkhwa, Pakistan. J. Health Rehabil. Res. 2024, 4, 188–193. [Google Scholar] [CrossRef]
  35. Childhood Immunization Bounces Back to Pre-COVID-19 Levels in Five South Asian Countries. Available online: https://www.unicef.org/pakistan/press-releases/childhood-immunization-bounces-back-pre-covid-19-levels-five-south-asian-countries (accessed on 13 August 2024).
  36. “Pakistan Can”: How One Country Repaired Its Routine Immunisation Safety Net. Available online: https://www.gavi.org/vaccineswork/pakistan-can-how-one-country-repaired-its-routine-immunisation-safety-net (accessed on 19 September 2024).
  37. Jamison, A.F.; McCormick, B.J.J.; Hussain, E.; Thomas, E.D.; Azam, S.I.; Hansen, C.L.; Rasmussen, Z.A. Determinants of Vaccine Coverage and Timeliness in a Northern Pakistani Village. PLoS ONE 2022, 17, e0263712. [Google Scholar] [CrossRef] [PubMed]
  38. Noh, J.-W.; Kim, Y.; Akram, N.; Yoo, K.B.; Cheon, J.; Lee, L.J.; Kwon, Y.D.; Stekelenburg, J. Determinants of Timeliness in Early Childhood Vaccination among Mothers with Vaccination Cards in Sindh Province, Pakistan: A Secondary Analysis of Cross-Sectional Survey Data. BMJ Open 2019, 9, e028922. [Google Scholar] [CrossRef] [PubMed]
  39. BMC Pediatrics. BCG Vaccination in Southern Rural Mozambique: An Overview of Coverage and Its Determinants Based on Data from the Demographic and Health Surveillance System in the District of Manhiça. 2018. Available online: https://bmcpediatr.biomedcentral.com/articles/10.1186/s12887-018-1003-4 (accessed on 20 September 2024).
  40. Trends and Determinants of Vaccination Among Children Aged 06–59 Months in Bangladesh: Country Representative Survey from 1993 to 2014. BMC Public Health. 2021. Available online: https://bmcpublichealth.biomedcentral.com/articles/10.1186/s12889-021-11576-0 (accessed on 20 September 2024).
  41. Vaccination and Immunization Statistics. Available online: https://data.unicef.org/topic/child-health/immunization/ (accessed on 20 September 2024).
  42. Schoeps, A.; Ouédraogo, N.; Kagoné, M.; Sié, A.; Müller, O.; Becher, H. Socio-Demographic Determinants of Timely Adherence to BCG, Penta3, Measles, and Complete Vaccination Schedule in Burkina Faso. Vaccine 2013, 32, 96–102. [Google Scholar] [CrossRef] [PubMed]
  43. At Least 80 Million Children Under One at Risk of Diseases Such as Diphtheria, Measles and Polio as COVID-19 Disrupts Routine Vaccination Efforts, Warn Gavi, WHO and UNICEF. Available online: https://www.who.int/news/item/22-05-2020-at-least-80-million-children-under-one-at-risk-of-diseases-such-as-diphtheria-measles-and-polio-as-covid-19-disrupts-routine-vaccination-efforts-warn-gavi-who-and-unicef (accessed on 26 July 2024).
  44. Noh, J.W.; Kim, Y.M.; Akram, N.; Yoo, K.B.; Park, J.; Cheon, J.; Kwon, Y.D.; Stekelenburg, J. Factors Affecting Complete and Timely Childhood Immunization Coverage in Sindh, Pakistan; A Secondary Analysis of Cross-Sectional Survey Data. PLoS ONE 2018, 13, e0206766. Available online: https://journals.plos.org/plosone/article?id=10.1371/journal.pone.0206766 (accessed on 14 November 2024). [CrossRef] [PubMed]
  45. Bekele, G.; Darega, J.; Mulu, E.; Tsegaw, M. Determinants of Immunization Defaulters among Children Aged 12–23 Months in Ambo Town, Oromia, Ethiopia: A Case–Control Study. Hum. Vaccines Immunother. 2024, 20, 2338952. [Google Scholar] [CrossRef] [PubMed]
  46. Krishna, D.; Mohd Zulkefli, N.A.; Md Said, S.; Mahmud, A. Sociodemographic and Health Care Factors in Determining Immunization Defaulters among Preschool Children in Petaling District, Selangor: A Cross-Sectional Study in Malaysia. BMC Public Health 2019, 19, 1275. [Google Scholar] [CrossRef] [PubMed]
Figure 1. Flowchart representing the inclusion and exclusion criteria of the study population for children enrolled from 2018 to 2023 birth cohorts enrolled in ZM-EIR Sindh, Pakistan.
Vaccines 12 01327 g001
Figure 2. Antigen-wise cumulative up-to-date coverage rates at 6, 12, 18, and 23 months among children from 2018 to 2023 birth cohorts enrolled in ZM-EIR across Sindh, Pakistan, by birth cohort (n = 8,792,329)—1 January 2018–31 May 2024.
Vaccines 12 01327 g002
Figure 3. Antigen-wise timeliness among children from 2018 to 2023 birth cohorts enrolled in ZM-EIR across Sindh, Pakistan by birth year.
Vaccines 12 01327 g003
Figure 4. Comparison of immunization doses administered through different modalities among children from 2018 to 2023 birth cohorts enrolled in ZM-EIR across Sindh, Pakistan (n = 8,792,329).
Vaccines 12 01327 g004
Figure 5. (a) Number of defaulter children and (b) covered and uncovered defaulter children based on enrollment district from 2018 to 2023 birth cohorts enrolled in ZM-EIR Sindh, Pakistan by birth year.
Vaccines 12 01327 g005
Table 1. Antigen-wise coverage a among children from 2018 to 2023 birth cohorts enrolled in ZM-EIR across Sindh, Pakistan (n = 8,792,329)—1 January 2018–31 May 2024.
2018
(n = 1,025,904)
2019
(n = 1,349,301)
2020
(n = 1,427,321)
2021
(n = 1,456,235)
2022
(n = 1,781,011)
2023 b
(n = 1,752,557)
n%n%n%n%n%n%
BCG838,75981.81,115,12582.61,241,73687.01,264,24586.81,608,04190.31,598,40091.2
Penta-1795,96577.61,091,99580.91,230,12686.21,274,99487.61,626,99691.41,555,63288.8
OPV-1793,68077.41,090,27180.81,230,83686.21,275,55387.61,627,17091.41,555,72088.8
PCV-1795,71677.61,091,40980.91,229,52586.11,274,61087.51,626,87591.41,555,42788.8
Rota-1726,94970.91,071,66079.41,212,78085.01,262,42186.71,619,48090.91,554,62788.7
Penta-2707,04668.91,005,41874.51,151,89280.71,211,60383.21,519,04585.31,352,71077.2
OPV-2706,41468.91,004,67374.51,152,51180.81,211,89483.21,518,88185.31,352,60977.2
PCV-2707,02968.91,005,00874.51,151,56680.71,211,38183.21,518,93785.31,352,68377.2
Rota-2631,30661.5971,06472.01,120,81278.51,189,10181.71,507,84984.71,351,85177.1
Penta-3662,55664.6962,96271.41,143,24380.11,234,86484.81,521,77385.41,219,26969.6
OPV-3662,49764.6963,02771.41,143,64880.11,234,63384.81,521,35485.41,219,02169.6
PCV-3662,88364.6962,77471.41,142,82080.11,234,38084.81,521,46885.41,219,20869.6
IPV-1701,99668.41,001,39974.21,179,68682.71,269,91787.21,565,80587.91,287,07973.4
Measles-1679,93666.3972,42372.11,163,58881.51,264,04886.81,505,38484.5744,06442.5
Measles-2494,92448.2775,84557.5938,98865.81,083,59674.41,154,17064.885,5434.9
FIC-M1 (without PCV)486,96147.5710,97352.7907,31863.6988,42467.91,258,66870.7622,34035.5
FIC-M1 (with PCV)486,65147.4710,11052.6906,14563.5987,61767.81,257,87670.6622,05035.5
FIC-M1 (with Rota)436,59642.6687,06850.9881,59561.8968,41366.51,247,20970.0620,97735.4
FIC-M2 (without PCV)344,08533.5561,74941.6740,76451.9860,90859.1992,41755.777,3704.4
FIC-M2 (with PCV)343,92733.5561,16441.6739,86751.8860,25359.1991,91455.777,3484.4
FIC-M2 (with Rota)308,87330.1543,47840.3720,46750.5844,30058.0984,34855.377,1464.4
a Coverage: Children who received a particular vaccine within 729 days; FIC-M1: (1) Without PCV = BCG + OPV1-3 + Penta1-3 + M1, (2) With PCV = BCG + OPV1-3 + Penta1-3 + PCV1-3 + M1 (3), With Rota = BCG + OPV1-3 + Penta1-3 + PCV1-3 + Rota1-2 + M1; FIC-M2: (1) Without PCV = BCG + OPV1-3 + Penta1-3 + M1-2 (2) With PCV = BCG + OPV1-3 + Penta1-3 + PCV1-3 + M1-2, (3) With Rota = BCG + OPV1-3 + Penta1-3 + PCV1-3 + Rota1-2 + M1-2; b Lower coverage rates in 2023 birth cohort, as children might still not be due for these vaccines.
Table 2. Socio-demographic characteristics of children enrolled in ZM-EIR by defaulter status (n = 8,792,329)—1 January 2018–31 May 2024.
Non-DefaultersDefaultersDefaultersTotal
Fully CoveredPartially CoveredUncovered
n%n%n%n%n%n%
Total 565,297 6.48,227,03293.6 2,864,173 34.8 4,610,664 56.0 752,195 9.1 8,792,329 100.0
Sex
Male293,7446.44,302,97093.61,497,30234.82,410,96856.0394,7009.24,596,714100.0
Female271,5536.53,924,06293.51,366,87134.82,199,69656.1357,4959.14,195,615100.0
Residential Area
Remote Rural88712.0442,77098.0143,48332.4285,96264.613,3253.0451,641100.0
Non-remote Rural115,9763.53,230,40396.51,212,75837.51,857,46657.5160,1795.03,346,379100.0
Urban440,4508.84,553,85991.21,507,93233.12,467,23654.2578,69112.74,994,309100.0
Residential sub-area
Urban non-slum124,8473.33,673,17396.71,356,24136.92,143,42858.4173,5044.73,798,020100.0
Urban slum440,4508.84,553,85991.21,507,93233.12,467,23654.2578,69112.74,994,309100.0
Place of birth a
Hospital142,04011.11,134,71288.9414,50136.5560,46349.4159,74814.11,276,752100.0
Maternity Home11,8757.8141,01292.250,40235.776,32954.114,28110.1152,887100.0
Home25,0533.6666,94096.4224,56333.7392,95458.949,4237.4691,993100.0
Enrollment Event b
Fixed Site420,0999.14,186,42390.91,561,95337.32,046,38048.9578,09013.84,606,522100.0
Outreach117,1024.22,645,01095.8882,11333.41,643,14062.1119,7574.52,762,112100.0
Enhanced outreach activities25,7161.91,321,51798.1407,55230.8863,21665.350,7493.81,347,233100.0
Mobile Immunization Vans23803.174,08096.912,55316.957,92878.235994.976,460100.0
 Mother’s Education c (years)
017,9642.9591,01097.1202,28234.2337,45857.151,2708.7608,974100.0
1–529,6594.7600,49395.3229,64038.2308,23351.362,62010.4630,152100.0
6–860066.783,60493.329,93635.841,75949.911,90914.289,610100.0
9–10854610.374,75789.725,14533.635,08746.914,52519.483,303100.0
≥11879713.755,37086.318,96134.223,39042.213,01923.564,167100.0
Birth year
201844,4304.3981,47495.7232,14423.7582,69659.4166,63417.01,025,904100.0
201956,2174.21,293,08495.8379,74429.4757,94458.6155,39612.01,349,301100.0
202054,6633.81,372,65896.2492,75235.9770,14056.1109,7668.01,427,321100.0
202150,8693.51,405,36696.5505,14435.9822,61758.577,6055.51,456,235100.0
2022103,7925.81,677,21994.2643,98138.4931,10355.5102,1356.11,781,011100.0
2023255,32614.61,497,23185.4610,40840.8746,16449.8140,6599.41,752,557100.0
 Enrollment Age (months)
0–1532,96810.94,362,78889.12,594,21259.51,235,93428.3532,64212.24,895,756100.0
2–319,6031.01,887,34299.0138,4477.31,620,03785.8128,8586.81,906,945100.0
4–630750.4841,77099.655,8536.6766,89191.119,0262.3844,845100.0
7–930460.7438,77899.324,1745.5394,10989.820,4954.7441,824100.0
10–129090.3340,09199.720,3876.0313,31292.163921.9341,000100.0
13–1544403.3128,62096.784456.697,50275.822,67317.6133,060100.0
16–1812421.0126,45999.014,94211.8106,81784.547003.7127,701100.0
19–2150.051,786100.0549910.646,24889.3390.151,791100.0
≥2290.049,398100.022144.529,81460.417,37035.249,407100.0
Age at Vaccination (in months)MedianIQR eMedianIQR eMedianIQR eMedianIQR eMedianIQR eMedianIQR e
BCG/OPV-00.230.10–0.430.720.23–2.040.430.20–0.891.940.53–3.980.160.03–0.390.660.23–2.00
Penta-1/OPV-1/PCV-11.511.45–1.642.271.71–3.812.041.61–2.832.791.91–5.061.581.48–1.782.141.64–3.58
Penta-2/OPV-2/PCV-22.602.47–2.764.213.09–6.643.752.99–5.264.963.45–8.182.632.50–2.834.012.96–6.34
Penta-3/OPV-3/PCV-33.683.48–3.886.514.67–9.995.824.54–8.327.565.16–11.573.723.55–3.916.154.37–9.60
Measles-19.149.01–9.3410.429.44–12.5910.169.34–11.6410.919.66–13.779.179.04–9.4010.269.34–12.36
Measles-215.1515.02–15.3916.6015.48–18.4416.5015.45–18.2116.8315.71–18.8415.1215.02–15.3816.4015.35–18.21
n%n%n%n%n%n%
 Provision of Contact Number
Provided380,71412.02,792,81388.01,042,47837.31,399,01150.1351,32412.63,173,527100.0
Not provided184,5833.35,434,21996.71,821,69533.53,211,65359.1400,8717.45,618,802100.0
 Provision of CNIC Numbers
Provided109,66214.8629,81885.2250,91839.8283,78045.195,12015.1739,480100.0
Not provided455,6355.77,597,21494.32,613,25534.44,326,88457.0657,0758.68,052,849100.0
SMS Reminders d
Opted195,7183.45,546,85096.61,888,98134.13,250,31558.6407,5547.35,742,568100.0
Not opted363,42512.62,518,55687.4953,55337.91,259,35850.0305,64512.12,881,981100.0
a 75.9% of observations for place of birth are missing in total, 68.4% of observations were missing for non-defaulters, 75.9% of observations missing for fully covered, 77.5% of observations missing for partially covered, and 70.2% for the not covered cohort. 0.05% refused to answer for all the cohorts. b 2 observations for enrollment modality are missing in total, and also, 2 observations for fully covered cohort are missing. c 83.2% of observations for mother’s education are missing in total, 87.4% of observations were missing for non-defaulters, 82.3% of observations missing for fully covered, 83.8% of observations missing for partially covered, and 79.5% for the not covered cohort. 0.04% refused to answer for all the cohorts. d 65.3% of observations for approved reminders are missing in total, 34.6% of observations were missing for non-defaulters, 66.0% of observations missing for fully covered, 70.5% of observations missing for partially covered, and 54.2% for the not covered cohort. e Interquartile Range (25–75%). Abbreviations: BCG, Bacille Calmette-Guérin; OPV, oral polio vaccine; Penta, pentavalent vaccine, including vaccines against diphtheria, tetanus, pertussis, hepatitis B, and hemophilus influenza; PCV, pneumococcal conjugate vaccine. Non-defaulter: children who received all the vaccines as per EPI recommended timeliness. Fully covered defaulters: children who received all the defaulted vaccines by 23 months of age. Partially covered defaulters: Children who received a few of the defaulted vaccines by 23 months of age. Not covered defaulters: Children who did not receive any of the defaulted vaccines by 23 months of age.
Table 3. Antigen-wise up-to-date coverage rates at 6, 12, 18, and 23 months among children from 2018 to 2023 birth cohorts enrolled in ZM-EIR across Sindh, Pakistan by defaulter status (n = 8,792,329)—1 January 2018–31 May 2024.
6 Months12 Months18 Months23 Months
Non-Defaulter
(n = 524,646)
Defaulter
(n = 8,136.916)
% DifferenceNon-Defaulter
(n = 370,589)
Defaulter
(n = 7,359,264)
% DifferenceNon-Defaulter
(n = 298,756)
Defaulter
(n = 6,587,052)
%
Difference
Non-Defaulter
(n = 239,457)
Defaulter
(n = 5,713,459)
%
Difference
n%n%%n%n%%n%n%%n%n%%
BCG509,46597.16,413,18478.818.3357,52596.56,246,03284.911.6286,36595.95,621,46385.310.5227,77295.14,850,52184.910.2
Penta-1496,99894.76,083,63074.820.0358,23896.76,238,13484.811.9286,96496.15,717,62286.89.3228,18195.34,973,35987.08.2
OPV-1496,91494.76,083,28974.820.0358,22496.76,238,58684.811.9286,96196.15,717,44586.89.3228,17795.34,972,58087.08.3
PCV-1497,00594.76,082,37374.820.0358,24196.76,236,83084.711.9286,96696.15,716,35886.89.3228,18295.34,972,04087.08.3
Rota-1496,77894.76,052,00274.420.3357,79096.56,177,91083.912.6286,52495.95,645,39985.710.2227,75795.14,895,95385.79.4
Penta-2486,54692.74,573,54556.236.5356,10696.15,461,25774.221.9284,96395.45,215,59379.216.2226,31894.54,595,96680.414.1
OPV-2486,46792.74,573,40456.236.5356,10996.15,461,73474.221.9284,97195.45,216,05679.216.2226,33194.54,596,04380.414.1
PCV-2486,56092.74,573,61756.236.5356,11596.15,461,14774.221.9284,97095.45,215,22079.216.2226,32394.54,595,46080.414.1
Rota-2478,78791.34,364,76353.637.6350,33794.55,156,11070.124.5280,08593.84,888,07374.219.5222,17792.84,277,52374.917.9
Penta-3476,78790.92,798,43734.456.5353,05195.34,749,00464.530.7282,11794.44,840,11873.521.0223,69693.44,379,56076.716.8
OPV-3476,57290.82,796,20234.456.5352,96595.24,748,63664.530.7282,09794.44,840,01073.520.9223,69993.44,379,32276.616.8
PCV-3476,78990.92,797,51934.456.5353,05395.34,748,86464.530.7282,11894.44,839,41773.521.0223,70393.44,378,58476.616.8
IPV-1476,44990.83,222,40039.651.2356,35296.25,165,54870.226.0285,61595.65,171,67078.517.1226,61894.64,652,84481.413.2
Measles-1 ---354,29095.64,063,98955.240.4298,691100.04,924,28274.825.2239,400100.04,647,01281.318.6
Measles-2 --- -292,49297.92,870,85043.654.3239,371100.03,562,15862.337.6
FIC-M1 (without PCV)-----337,73591.13,217,92943.747.4275,28992.13,882,80658.933.2217,52690.83,597,52363.027.9
FIC-M1 (with PCV)-----337,70491.13,215,86143.747.4275,25992.13,880,35358.933.2217,50190.83,595,09562.927.9
FIC-M1 (with Rota)-----332,60989.83,056,23641.548.2270,69590.63,658,84655.535.1213,65489.23,365,36758.930.3
FIC-M2 (without PCV)----------269,40490.22,419,31436.753.4217,49990.82,896,69150.740.1
FIC-M2 (with PCV)----------269,37590.22,418,18936.753.5217,47490.82,895,01350.740.1
FIC-M2 (with Rota)----------264,90888.72,298,03834.953.8213,62789.22,725,45647.741.5
FIC-M1: (1) Without PCV = BCG + OPV1-3 + Penta1-3 + M1, (2) With PCV = BCG + OPV1-3 + Penta1-3 + PCV1-3 + M1 (3), With Rota = BCG + OPV1-3 + Penta1-3 + PCV1-3 + Rota1-2 + M1; FIC-M2: (1) Without PCV = BCG + OPV1-3 + Penta1-3 + M1-2 (2) With PCV = BCG + OPV1-3 + Penta1-3 + PCV1-3 + M1-2, (3) With Rota = BCG + OPV1-3 + Penta1-3 + PCV1-3 + Rota1-2 + M1-2.
Table 4. Distribution of defaulters and their coverage among children from 2018 to 2023 birth cohorts enrolled in ZM-EIR across Sindh, Pakistan by various periods—31 January 2018–31 May 2024.
Periods DefaultersCoverage Status
Total DueFully Covered DefaultersPartially Covered DefaultersUncovered
Defaulters
nn%n%n%n%
Pre-1st lockdown (1 January 2018–22 March 2020)1,001,803958,28795.66225,11523.49569,60359.44163,56917.07
1st national lockdown (23 March–9 May 2020)794,645767,89196.63236,65630.82452,94558.9978,29010.20
Post-1st lockdown (10 May–18 June 2020)292,520282,13796.4584,52229.96166,58859.0531,02711.00
Smart lockdown (19 June–9 August 2020)675,805649,40896.09190,53929.34397,38761.1961,4829.47
Post-smart lockdown (10 August 2020–8 May 2021)1,002,850957,19095.45360,81037.69502,94352.5493,4379.76
2nd lockdown (9–16 May 2021)120,872117,80197.4639,56933.5971,45160.6567815.76
Restrictions (17 May–6 June 2021)326,215315,68796.77107,24233.97188,63759.7519,8086.27
Post-restrictions (7 June–31 July 2021)182,397175,74396.3565,12837.06100,71257.3199035.63
3rd lockdown (1–8 August 2021)120,094114,85695.6444,07938.3864,20055.9065775.73
Post-3rd lockdown 9 August 2021–30 June 2022)822,703787,91895.77307,84239.07437,81855.5742,2585.36
Floods (1 July–31 August 2022)1,044,658995,87595.33331,50633.29607,68461.0256,6855.69
Post-flood (1 September–31 December 2022)652,128604,52292.70258,84142.82304,12050.3141,5616.88
Pandemic last duration (1 January–5 May 2023)582,728533,15591.49223,67641.95274,07351.4135,4066.64
Post-pandemic (6 May 2023–19 March 2024)1,172,884966,56282.41388,64840.21472,50348.88105,41110.91
Total8,792,3028,227,03293.572,864,17334.814,610,66456.04752,1959.14
Table 5. Predictors of uncovered defaulters vs. immunized children among children from 2018 to 2023 birth cohorts enrolled in ZM-EIR in Sindh province—1 January 2018–31 May 2024.
PredictorMultivariable Analysis
Uncovered Defaulters vs. Immunized Children
(n = 8,792,392)
Uncovered Defaulters vs. Immunized Children
(n = 1,434,185)
ORSEConfidence IntervalORSEConfidence Interval
Sex
Female0.99 ***0.0020.991.000.99 **0.0060.981.00
MaleRef Ref
Place of Birth
Maternity Home0.72 ***0.0070.710.730.81 ***0.0100.790.83
Home0.54 ***0.0030.530.540.83 ***0.0060.820.84
HospitalRef Ref
Residential area
Remote Rural0.60 ***0.0060.590.620.80 ***0.0140.780.83
Urban2.61 ***0.0082.592.621.54 ***0.0111.521.56
Non-Remote RuralRef Ref
Enrollment modality
Fixed3.17 ***0.0103.153.192.11 ***0.0182.082.15
EOA0.86 ***0.0050.850.870.69 ***0.0130.670.72
Van1.09 ***0.0191.051.131.41 **0.1621.131.77
OutreachRef Ref
Mother’s Education (in years)
00.36 ***0.0040.350.370.72 ***0.0090.710.74
1–50.43 ***0.0050.420.440.69 ***0.0080.680.71
6–80.60 ***0.0080.590.620.72 ***0.0110.700.74
9–100.83 ***0.0110.810.850.78 ***0.0110.760.81
≥11Ref Ref
Enrollment Age (months)
0–10.59 ***0.0050.580.600.83 ***0.0510.740.94
2–30.35 ***0.0030.340.350.46 ***0.0280.400.51
4–60.11 ***0.0010.110.110.13 ***0.0090.120.15
7–90.23 ***0.0030.230.240.27 ***0.0170.230.30
10–120.09 ***0.0010.090.090.09 ***0.0070.080.10
13–150.990.0110.971.010.04 ***0.0060.030.06
16–180.18 ***0.0030.180.190.01 ***0.0040.010.03
>18Ref Ref
Provision of Contact Number
Not provided0.62 ***0.0010.610.620.85 ***0.0070.840.87
ProvidedRef Ref
Provision of CNIC Numbers
Not provided0.60 ***0.0020.600.611.03 **0.0081.011.04
ProvidedRef Ref
SMS Reminders
Not opted0.64 ***0.0020.640.651.27 ***0.0121.251.29
OptedRef Ref
Birth Year
20190.67 ***0.0030.670.680.57 ***0.0050.570.58
20200.43 ***0.0020.430.430.40 ***0.0040.390.41
20210.29 ***0.0010.290.290.25 ***0.0030.240.25
20220.31 ***0.0010.310.320.25 ***0.0030.240.25
20230.45 ***0.0020.450.450.34 ***0.0050.330.34
2018Ref Ref
** p < 0.01, *** p < 0.001 indicate statistical significance.
Disclaimer/Publisher’s Note: The statements, opinions and data contained in all publications are solely those of the individual author(s) and contributor(s) and not of MDPI and/or the editor(s). MDPI and/or the editor(s) disclaim responsibility for any injury to people or property resulting from any ideas, methods, instructions or products referred to in the content.

