
Factors Associated with COVID-19 Vaccination Promptness after Eligibility in a North Carolina Longitudinal Cohort Study

 ,
,  ,
,
Abstract
:1. Introduction
2. Materials and Methods
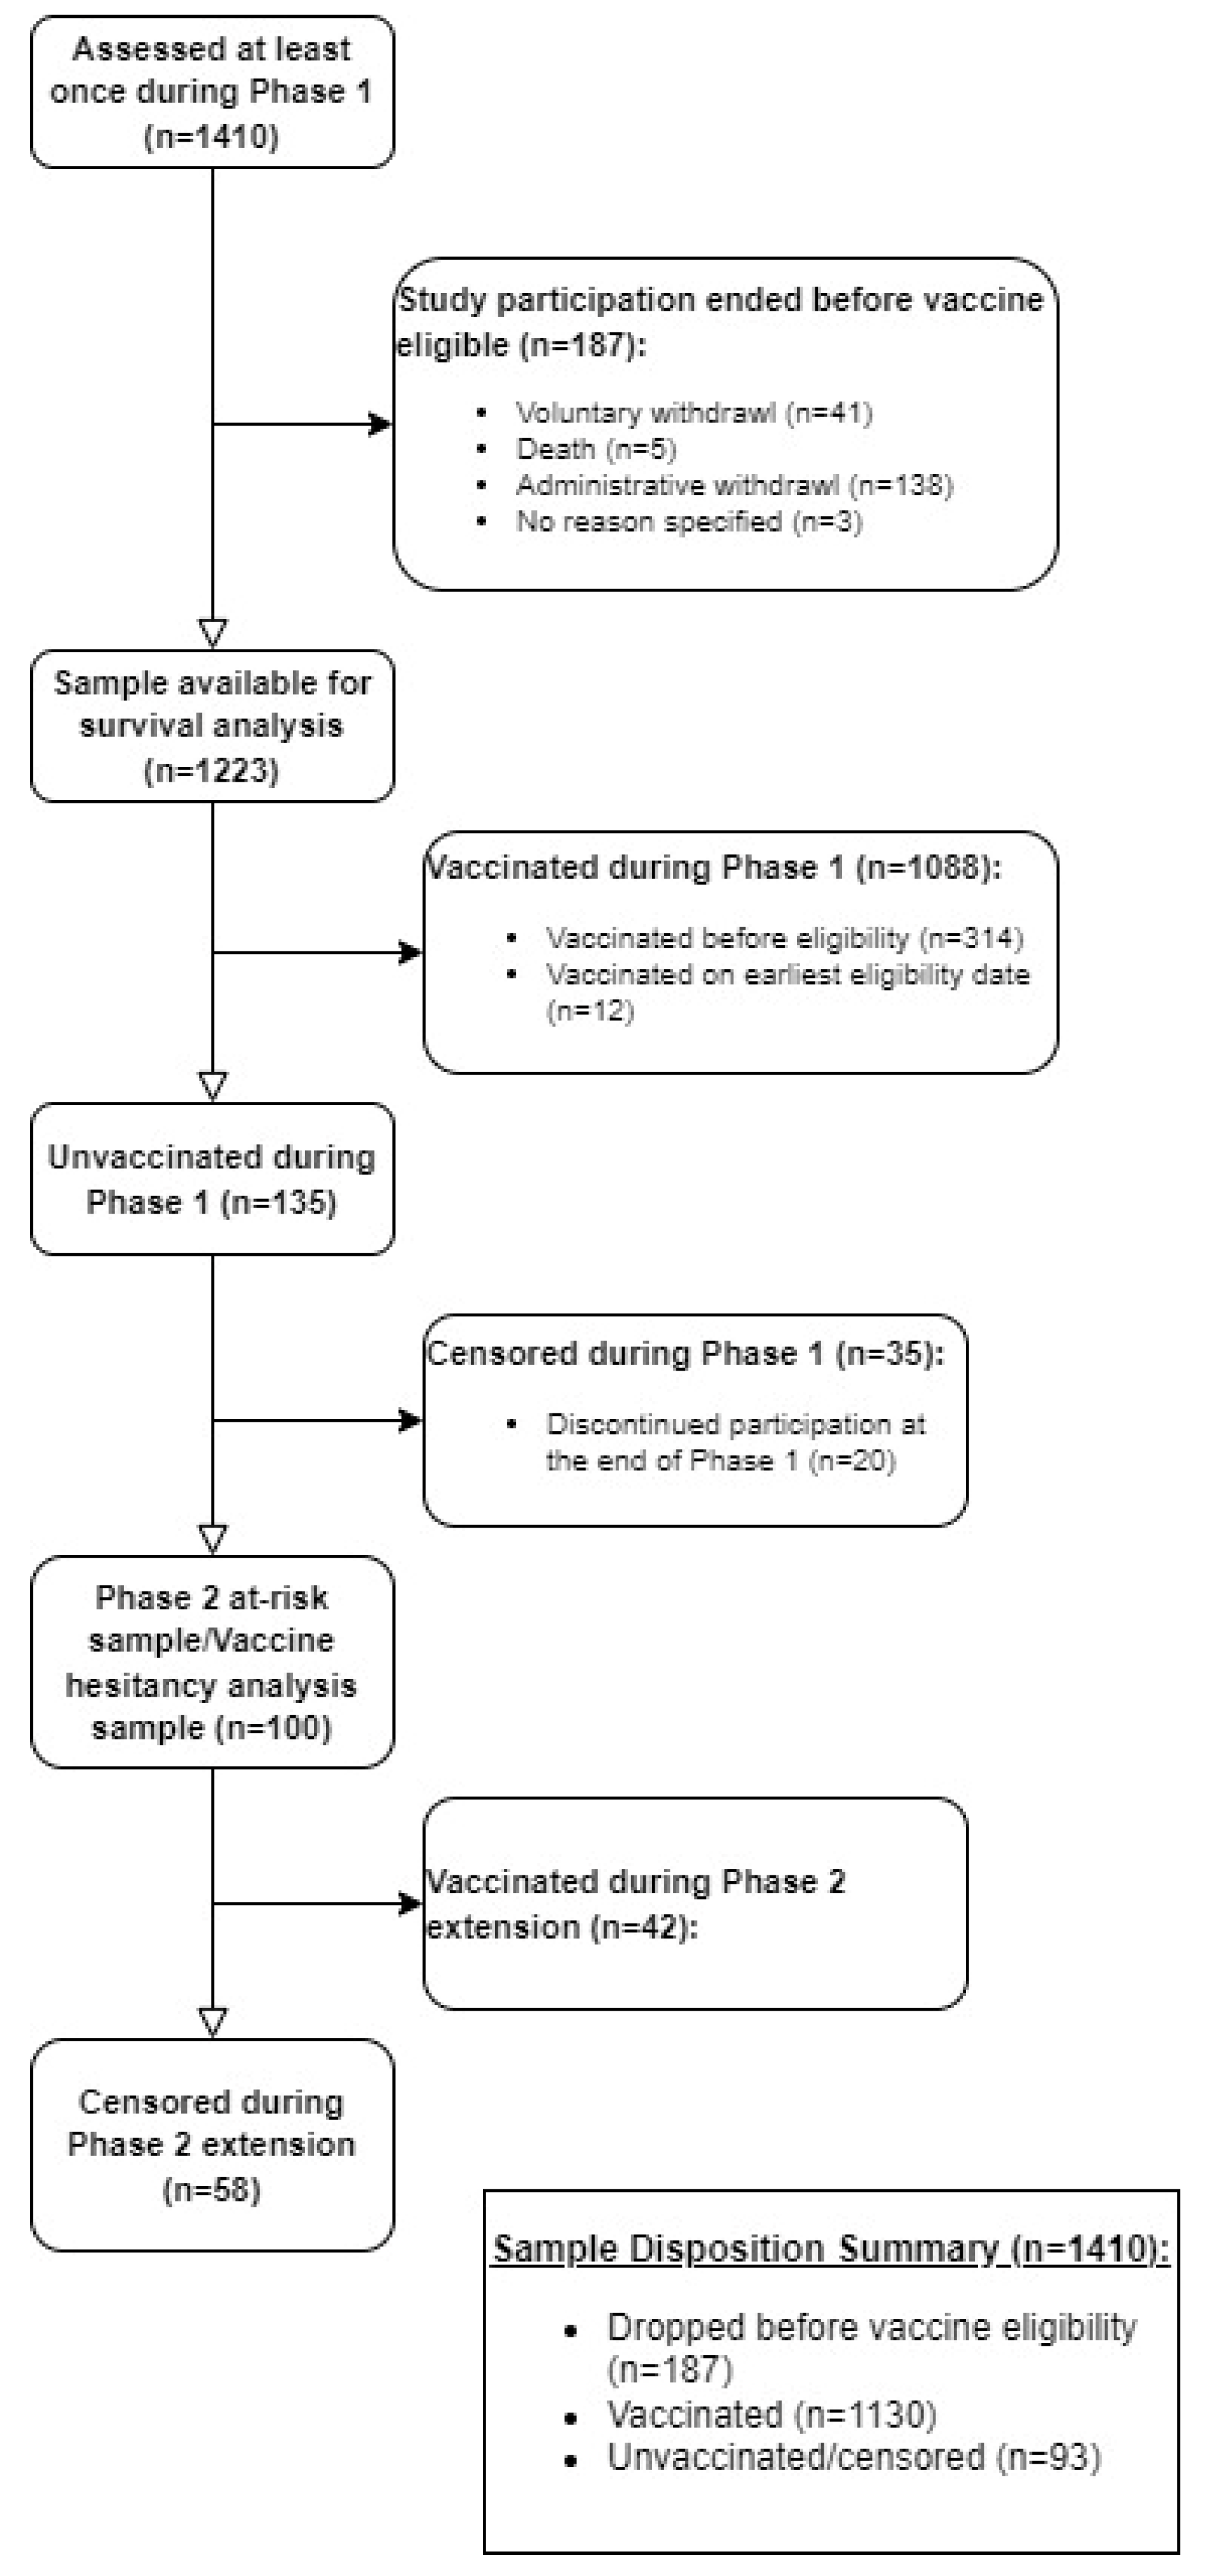
2.1. Study Sample
2.2. Study Measures and Definitions
2.2.1. Vaccination Intention
2.2.2. Vaccination Eligibility Date
2.2.3. Vaccination Promptness
2.2.4. Vaccination Hesitancy
2.3. Statistical Analysis
Missing Data
3. Results
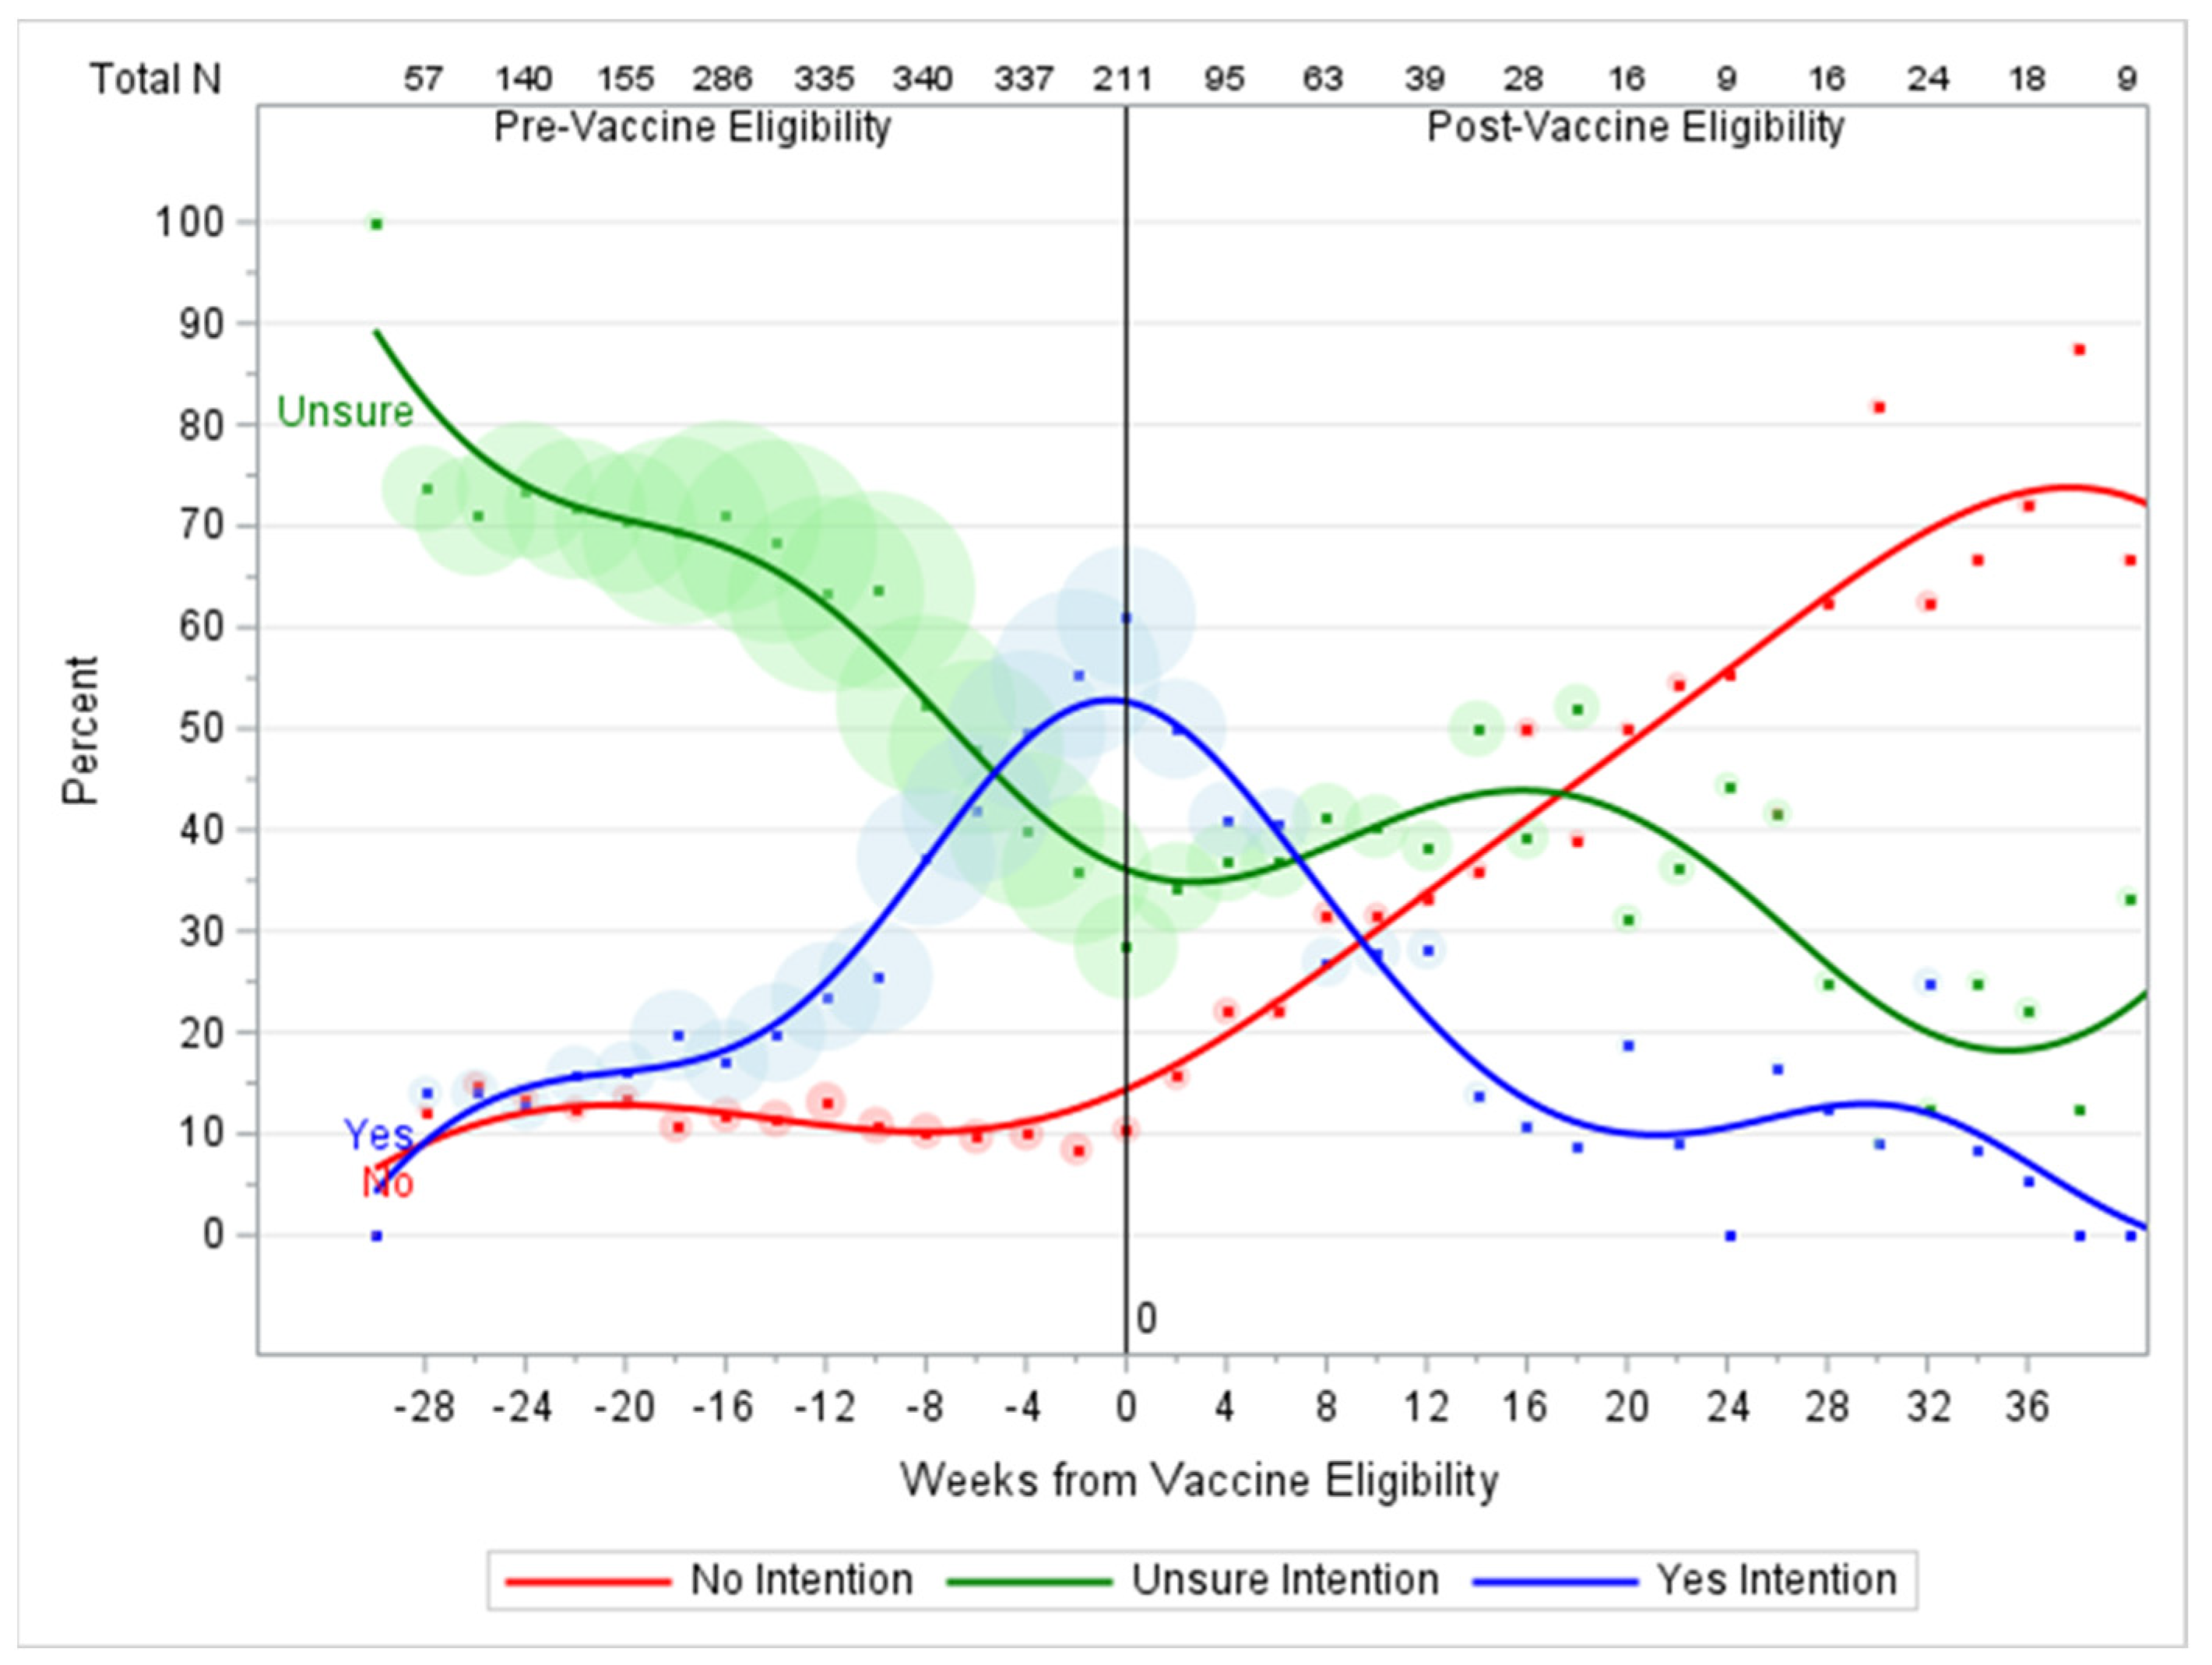
3.1. Baseline Vaccination Intention
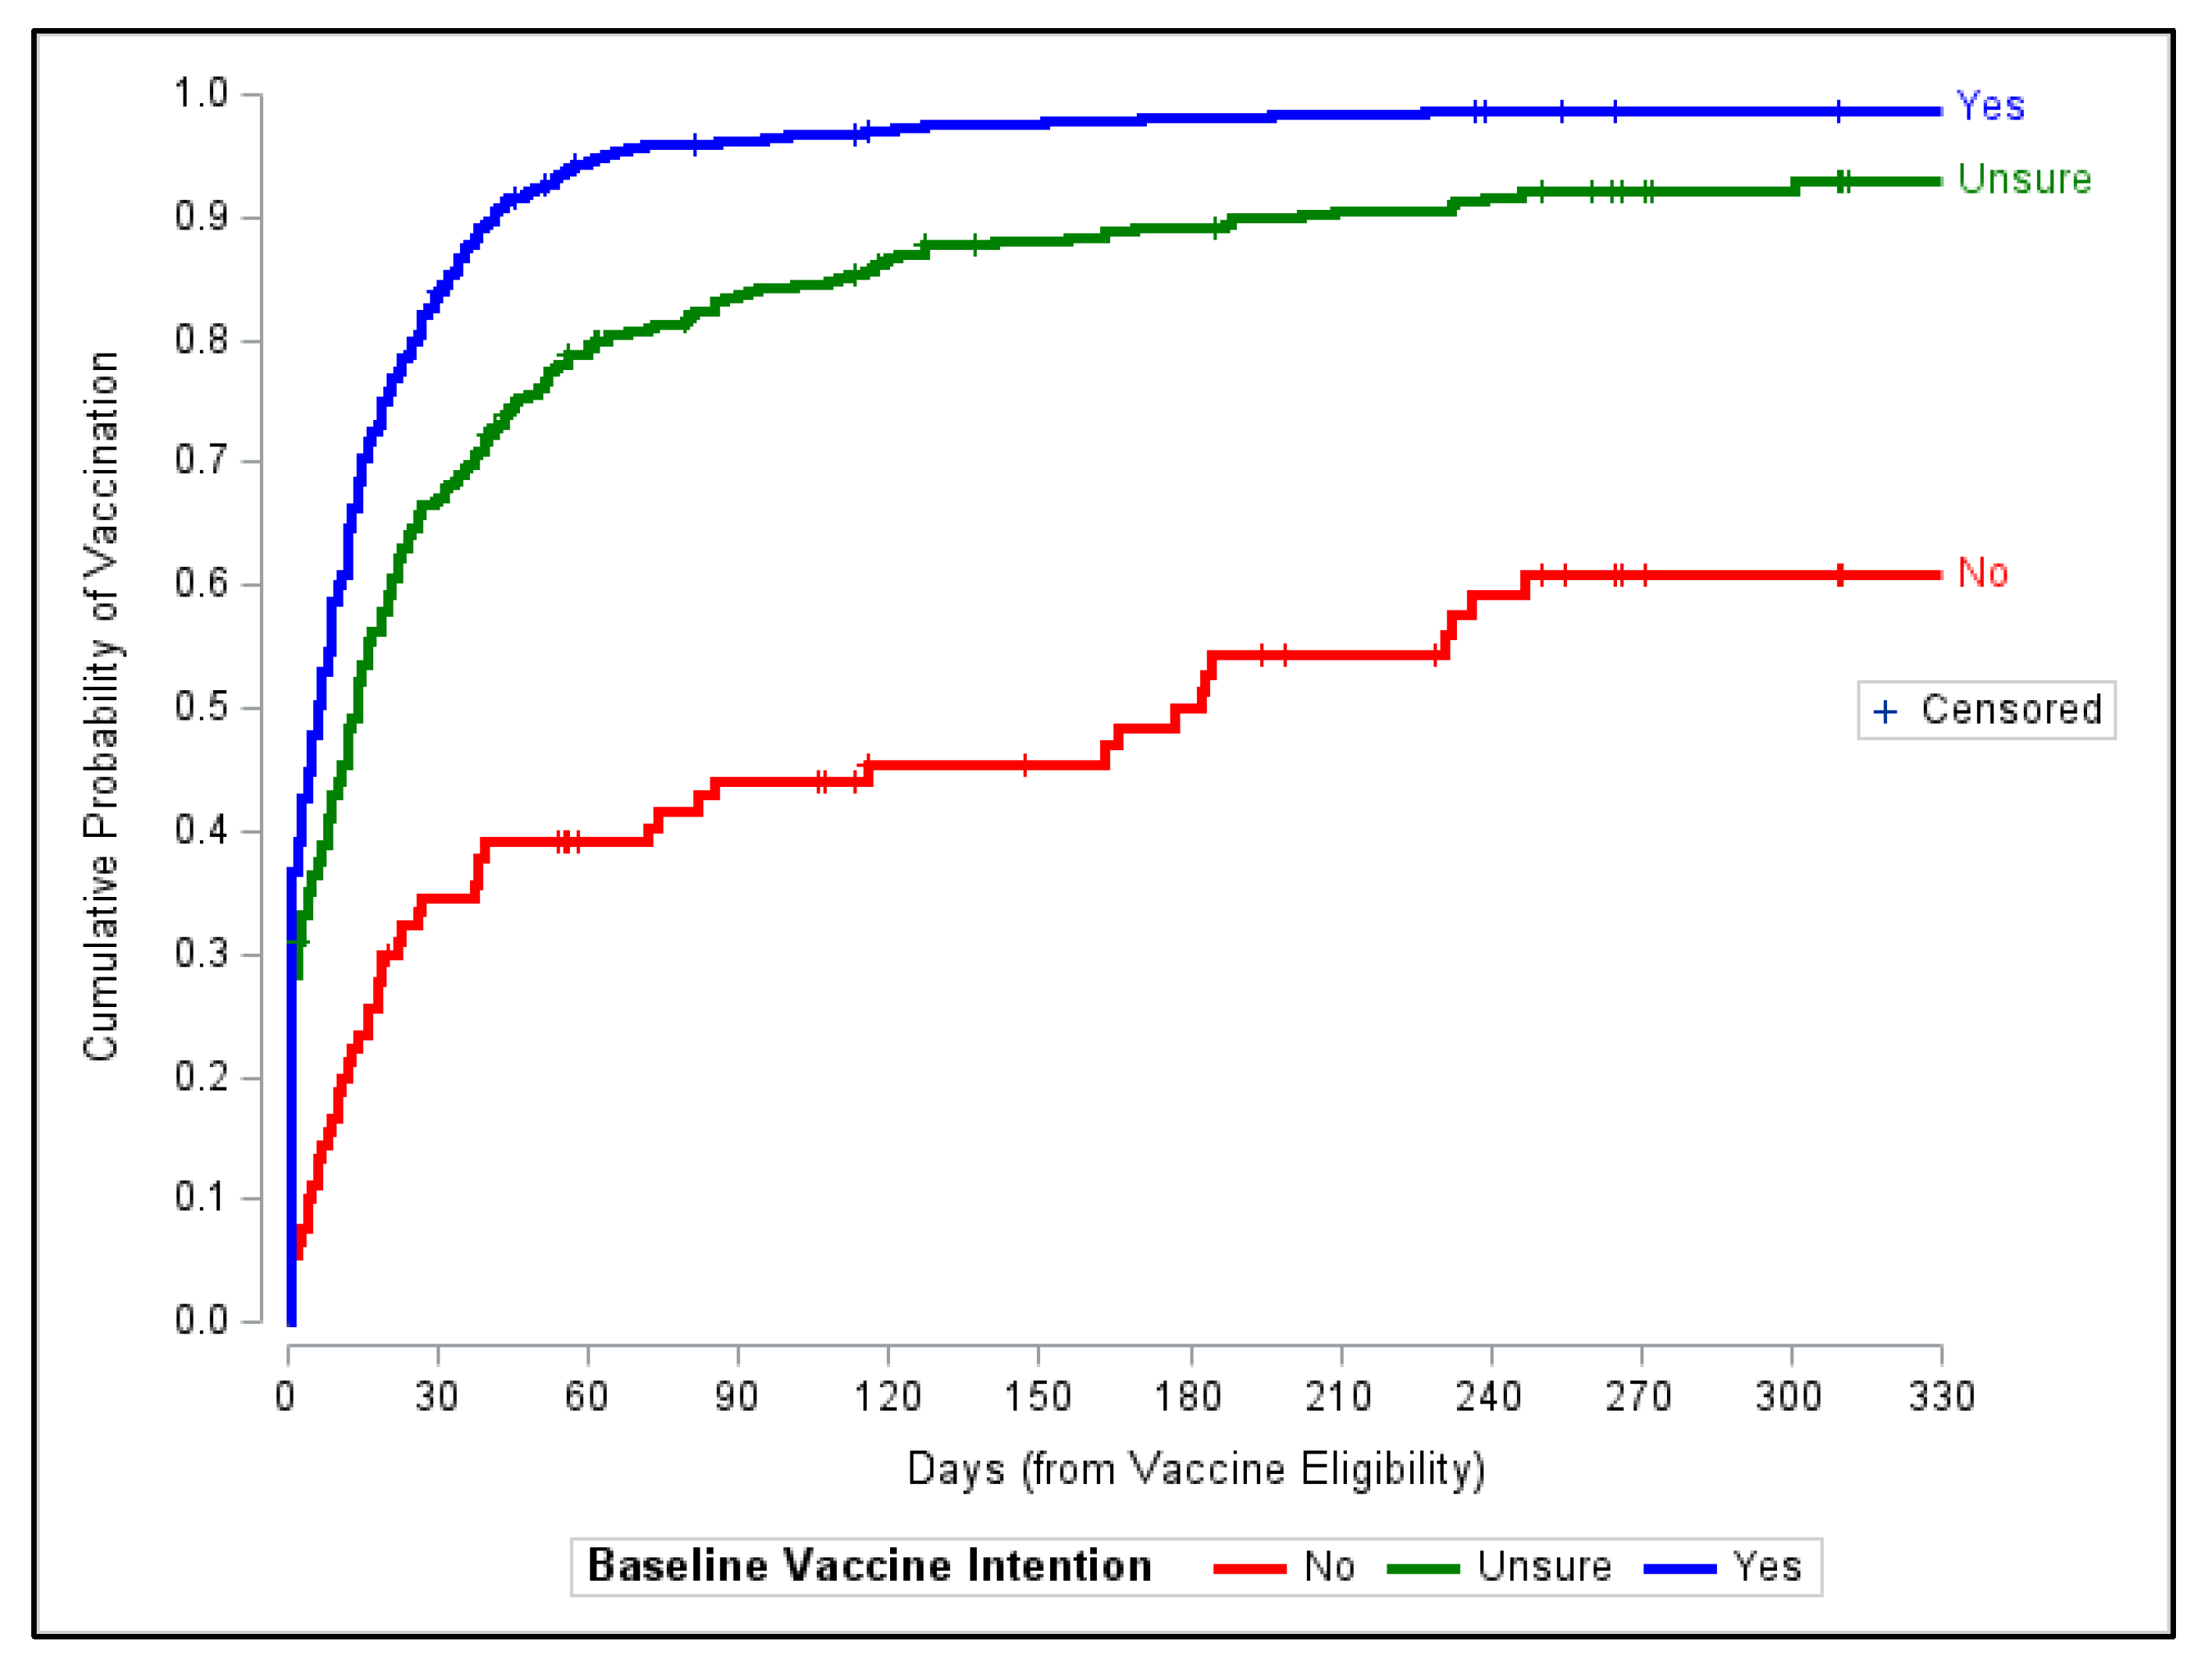
3.2. Vaccination Promptness
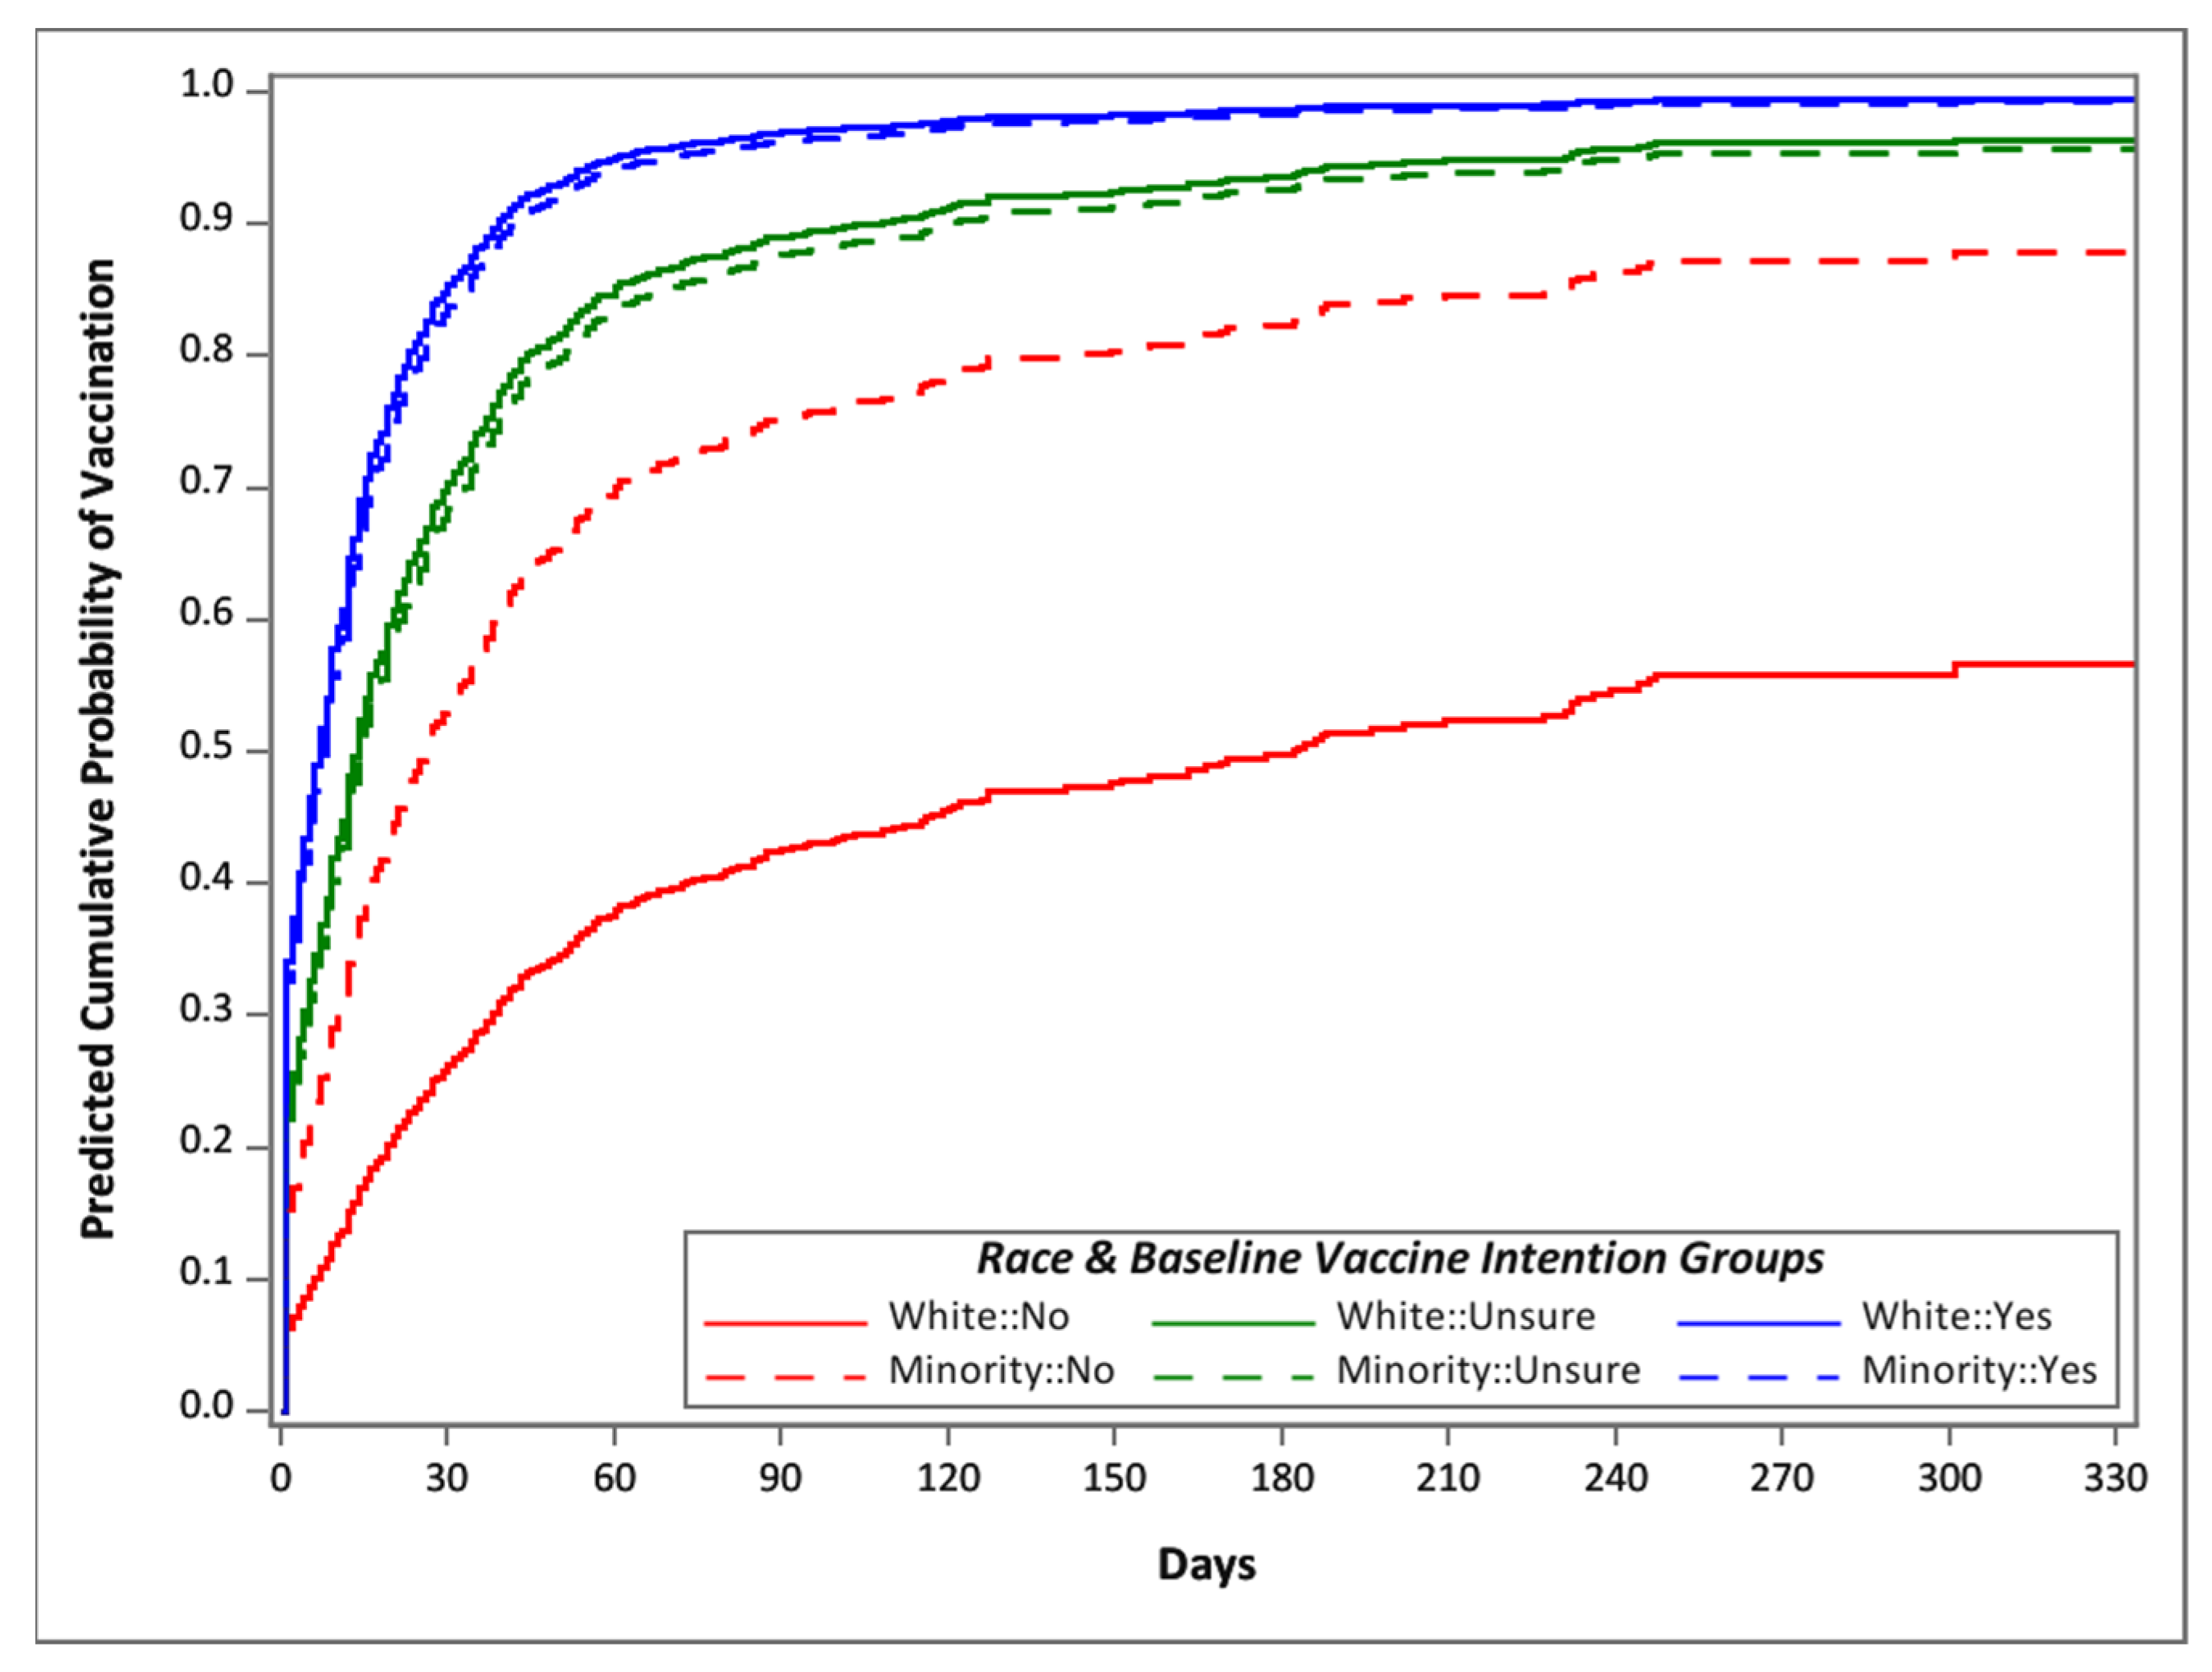
3.3. Factors Affecting Vaccination Promptness
3.4. Reasons for Vaccination Hesitancy
4. Discussion
4.1. Strengths and Limitations
4.2. Implications for the Future
5. Conclusions
Supplementary Materials
Author Contributions
Funding
Institutional Review Board Statement
Informed Consent Statement
Data Availability Statement
Acknowledgments
Conflicts of Interest
References
- Liu, Y.C.; Kuo, R.L.; Shih, S.R. COVID-19: The first documented coronavirus pandemic in history. Biomed. J. 2020, 43, 328–333. [Google Scholar] [CrossRef] [PubMed]
- World Health Organization. The Impact of COVID-19 on Global Health Goals. Available online: https://www.who.int/news-room/spotlight/the-impact-of-covid-19-on-global-health-goals (accessed on 30 March 2023).
- The Original Fund. Results Report 2021; p. 98. Available online: https://www.theglobalfund.org/en/news/2021/2021-09-08-global-fund-results-report-reveals-covid-19-devastating-impact-on-hiv-tb-and-malaria-programs/ (accessed on 30 March 2023).
- Dong, E.; Du, H.; Gardner, L. An interactive web-based dashboard to track COVID-19 in real time. Lancet Infect. Dis. 2020, 20, 533–534. [Google Scholar] [CrossRef] [PubMed]
- Centers for Disease Control and Prevention. Long COVID or Post-COVID Conditions. Available online: https://www.cdc.gov/coronavirus/2019-ncov/long-term-effects/index.html (accessed on 30 March 2023).
- Health and Human Services. Cases and Deaths Dashboard. Available online: https://covid19.ncdhhs.gov/dashboard/cases-and-deaths (accessed on 30 March 2023).
- Abbas, K.; Procter, S.R.; Van Zandvoort, K.; Clark, A.; Funk, S.; Mengistu, T.; Hogan, D.; Dansereau, E.; Jit, M.; Flasche, S.; et al. Routine childhood immunisation during the COVID-19 pandemic in Africa: A benefit-risk analysis of health benefits versus excess risk of SARS-CoV-2 infection. Lancet Glob. Health 2020, 8, e1264–e1272. [Google Scholar] [CrossRef]
- Debellut, F.; Clark, A.; Pecenka, C.; Tate, J.; Baral, R.; Sanderson, C.; Parashar, U.; Atherly, D. Evaluating the potential economic and health impact of rotavirus vaccination in 63 middle-income countries not eligible for Gavi funding: A modelling study. Lancet Glob. Health 2021, 9, e942–e956. [Google Scholar] [CrossRef]
- Jentsch, P.C.; Anand, M.; Bauch, C.T. Prioritising COVID-19 vaccination in changing social and epidemiological landscapes: A mathematical modelling study. Lancet Infect. Dis. 2021, 21, 1097–1106. [Google Scholar] [CrossRef]
- Sandmann, F.G.; Davies, N.G.; Vassall, A.; Edmunds, W.J.; Jit, M. Centre for the Mathematical Modelling of Infectious Diseases, C.-w.g. The potential health and economic value of SARS-CoV-2 vaccination alongside physical distancing in the UK: A transmission model-based future scenario analysis and economic evaluation. Lancet Infect. Dis. 2021, 21, 962–974. [Google Scholar] [CrossRef] [PubMed]
- Kohli, M.; Maschio, M.; Becker, D.; Weinstein, M.C. The potential public health and economic value of a hypothetical COVID-19 vaccine in the United States: Use of cost-effectiveness modeling to inform vaccination prioritization. Vaccine 2021, 39, 1157–1164. [Google Scholar] [CrossRef]
- Padula, W.V.; Malaviya, S.; Reid, N.M.; Cohen, B.G.; Chingcuanco, F.; Ballreich, J.; Tierce, J.; Alexander, G.C. Economic value of vaccines to address the COVID-19 pandemic: A U.S. cost-effectiveness and budget impact analysis. J. Med. Econ. 2021, 24, 1060–1069. [Google Scholar] [CrossRef]
- Leidner, A.J.; Murthy, N.; Chesson, H.W.; Biggerstaff, M.; Stoecker, C.; Harris, A.M.; Acosta, A.; Dooling, K.; Bridges, C.B. Cost-effectiveness of adult vaccinations: A systematic review. Vaccine 2019, 37, 226–234. [Google Scholar] [CrossRef]
- Thompson, J.; Wattam, S. Estimating the impact of interventions against COVID-19: From lockdown to vaccination. PLoS ONE 2021, 16, e0261330. [Google Scholar] [CrossRef]
- BBC News. COVID-19: First Vaccine Given in US as Roll-Out Begins. Available online: https://www.bbc.com/news/world-us-canada-55305720 (accessed on 30 March 2023).
- Atrium Health. First to Administer COVID-19 Vaccine in North Carolina. Available online: https://atriumhealth.org/about-us/newsroom/news/2020/12/atrium-health-first-to-administer-covid-19-vaccine-in-north-carolina (accessed on 30 March 2023).
- Centers for Disease Control and Prevention. Understanding How COVID-19 Vaccines Work. Available online: https://www.cdc.gov/coronavirus/2019-ncov/vaccines/different-vaccines/how-they-work.html?s_cid=11700:covid%20vaccine%20fda%20approval:sem.ga:p:RG:GM:gen:PTN:FY22 (accessed on 30 March 2023).
- Chaney, D.; Lee, M.S. COVID-19 vaccines and anti-consumption: Understanding anti-vaxxers hesitancy. Psychol. Mark. 2022, 39, 741–754. [Google Scholar] [CrossRef] [PubMed]
- World Health Organization. Vaccine Hesitancy: A Growing Challenge for Immunization Programmes. Available online: https://www.who.int/news/item/18-08-2015-vaccine-hesitancy-a-growing-challenge-for-immunization-programmes (accessed on 30 March 2023).
- Centers for Disease Control and Prevention. COVID-19 Vaccine Effectiveness Monthly Update. Available online: https://covid.cdc.gov/covid-data-tracker/#vaccine-effectiveness (accessed on 30 March 2023).
- Anderson, L.T.F.; Marshall, J.; McElrath, K.; Scherer, Z. New Tool Tracks Vaccination and Vaccine Hesitancy Rates Across Geographies, Population Groups. Available online: https://www.census.gov/library/stories/2021/04/how-do-covid-19-vaccination-and-vaccine-hesitancy-rates-vary-over-time.html (accessed on 30 March 2023).
- Centers for Disease Control and Prevention. COVID-19 Vaccinations in the United States. Available online: https://covid.cdc.gov/covid-data-tracker/#vaccinations_vacc-people-booster-percent-pop5 (accessed on 1 August 2023).
- Health and Human Services. Cases and Deaths Dashboard. Vaccinations Dashboard. Available online: https://covid19.ncdhhs.gov/dashboard/vaccinations (accessed on 1 August 2023).
- Lucia, V.C.; Kelekar, A.; Afonso, N.M. COVID-19 vaccine hesitancy among medical students. J. Public Health 2021, 43, 445–449. [Google Scholar] [CrossRef] [PubMed]
- Joshi, A.; Kaur, M.; Kaur, R.; Grover, A.; Nash, D.; El-Mohandes, A. Predictors of COVID-19 Vaccine Acceptance, Intention, and Hesitancy: A Scoping Review. Front. Public Health 2021, 9, 698111. [Google Scholar] [CrossRef] [PubMed]
- Hubach, R.D.; Shannon, B.; Morgan, K.D.; Alexander, C.; O’Neil, A.M.; Ernst, C.; Giano, Z. COVID-19 vaccine hesitancy among rural Oklahomans. Rural. Remote Health 2022, 22, 7128. [Google Scholar] [CrossRef] [PubMed]
- Myers, A.; Ipsen, C.; Lissau, A. COVID-19 vaccination hesitancy among Americans with disabilities aged 18-65: An exploratory analysis. Disabil. Health J. 2022, 15, 101223. [Google Scholar] [CrossRef]
- Gin, J.L.; Balut, M.D.; Dobalian, A. COVID-19 Vaccine Hesitancy among U.S. Veterans Experiencing Homelessness in Transitional Housing. Int. J. Environ. Res. Public Health 2022, 19, 15863. [Google Scholar] [CrossRef]
- Purnell, M.; Maxwell, T.; Hill, S.; Patel, R.; Trower, J.; Wangui, L.; Truong, H.A. Exploring COVID-19 vaccine hesitancy at a rural historically black college and university. J. Am. Pharm. Assoc. 2022, 62, 340–344. [Google Scholar] [CrossRef]
- McFadden, S.M.; Demeke, J.; Dada, D.; Wilton, L.; Wang, M.; Vlahov, D.; Nelson, L.E. Confidence and Hesitancy During the Early Roll-out of COVID-19 Vaccines Among Black, Hispanic, and Undocumented Immigrant Communities: A Review. J. Urban Health 2022, 99, 3–14. [Google Scholar] [CrossRef]
- Ruiz, J.B.; Bell, R.A. Parental COVID-19 Vaccine Hesitancy in the United States. Public Health Rep. 2022, 137, 1162–1169. [Google Scholar] [CrossRef]
- Fisher, C.; Bragard, E.; Madhivanan, P. COVID-19 Vaccine Hesitancy among Economically Marginalized Hispanic Parents of Children under Five Years in the United States. Vaccines 2023, 11, 599. [Google Scholar] [CrossRef]
- Warren, A.M.; Bennett, M.M.; Da Graca, B.; Waddimba, A.C.; Gottlieb, R.L.; Douglas, M.E.; Powers, M.B. Intentions to receive COVID-19 vaccines in the united states: Sociodemographic factors and personal experiences with COVID-19. Health Psychol. 2023, 42, 531–540. [Google Scholar] [CrossRef] [PubMed]
- Minaya, C.; McKay, D.; Benton, H.; Blanc, J.; Seixas, A.A. Medical Mistrust, COVID-19 Stress, and Intent to Vaccinate in Racial-Ethnic Minorities. Behav. Sci. 2022, 12, 186. [Google Scholar] [CrossRef] [PubMed]
- Nah, S.; Williamson, L.D.; Kahlor, L.A.; Atkinson, L.; Upshaw, S.J.; Ntang-Beb, J.L. The Roles of Social Media Use and Medical Mistrust in Black Americans’ COVID-19 Vaccine Hesitancy: The RISP Model Perspective. Health Commun. 2023, 1–14. [Google Scholar] [CrossRef] [PubMed]
- Morgan, K.M.; Maglalang, D.D.; Monnig, M.A.; Ahluwalia, J.S.; Avila, J.C.; Sokolovsky, A.W. Medical Mistrust, Perceived Discrimination, and Race: A Longitudinal Analysis of Predictors of COVID-19 Vaccine Hesitancy in US Adults. J. Racial Ethn. Health Disparities 2023, 10, 1846–1855. [Google Scholar] [CrossRef] [PubMed]
- Kricorian, K.; Civen, R.; Equils, O. COVID-19 vaccine hesitancy: Misinformation and perceptions of vaccine safety. Hum. Vaccines Immunother. 2022, 18, 1950504. [Google Scholar] [CrossRef]
- Kricorian, K.; Turner, K. COVID-19 Vaccine Acceptance and Beliefs among Black and Hispanic Americans. PLoS ONE 2021, 16, e0256122. [Google Scholar] [CrossRef]
- Tsai, R.; Hervey, J.; Hoffman, K.; Wood, J.; Johnson, J.; Deighton, D.; Clermont, D.; Loew, B.; Goldberg, S.L. COVID-19 Vaccine Hesitancy and Acceptance Among Individuals With Cancer, Autoimmune Diseases, or Other Serious Comorbid Conditions: Cross-sectional, Internet-Based Survey. JMIR Public Health Surveill. 2022, 8, e29872. [Google Scholar] [CrossRef]
- Dhanani, L.Y.; Franz, B. A meta-analysis of COVID-19 vaccine attitudes and demographic characteristics in the United States. Public Health 2022, 207, 31–38. [Google Scholar] [CrossRef]
- Salmon, D.A.; Dudley, M.Z.; Brewer, J.; Kan, L.; Gerber, J.E.; Budigan, H.; Proveaux, T.M.; Bernier, R.; Rimal, R.; Schwartz, B. COVID-19 vaccination attitudes, values and intentions among United States adults prior to emergency use authorization. Vaccine 2021, 39, 2698–2711. [Google Scholar] [CrossRef]
- Willis, D.E.; Schootman, M.; Shah, S.K.; Reece, S.; Selig, J.P.; Andersen, J.A.; McElfish, P.A. Parent/guardian intentions to vaccinate children against COVID-19 in the United States. Hum. Vaccines Immunother. 2022, 18, 2071078. [Google Scholar] [CrossRef]
- Doherty, I.A.; Pilkington, W.; Brown, L.; Billings, V.; Hoffler, U.; Paulin, L.; Kimbro, K.S.; Baker, B.; Zhang, T.; Locklear, T.; et al. COVID-19 vaccine hesitancy in underserved communities of North Carolina. PLoS ONE 2021, 16, e0248542. [Google Scholar] [CrossRef] [PubMed]
- Neighbors, C.E.; Wu, A.E.; Wixted, D.G.; Heidenfelder, B.L.; Kingsbury, C.A.; Register, H.M.; Louzao, R.; Sloane, R.; Eckstrand, J.; Pieper, C.C.; et al. The Cabarrus County COVID-19 Prevalence and Immunity (C3PI) Study: Design, methods, and baseline characteristics. Am. J. Transl. Res. 2022, 14, 5693–5711. [Google Scholar] [PubMed]
- Bhattacharya, S.; Dunham, A.A.; Cornish, M.A.; Christian, V.A.; Ginsburg, G.S.; Tenenbaum, J.D.; Nahm, M.L.; Miranda, M.L.; Califf, R.M.; Dolor, R.J.; et al. The Measurement to Understand Reclassification of Disease of Cabarrus/Kannapolis (MURDOCK) Study Community Registry and Biorepository. Am. J. Transl. Res. 2012, 4, 458–470. [Google Scholar] [PubMed]
- Tenenbaum, J.D.; Christian, V.; Cornish, M.A.; Dolor, R.J.; Dunham, A.A.; Ginsburg, G.S.; Kraus, V.B.; McHutchison, J.G.; Nahm, M.L.; Newby, L.K.; et al. The MURDOCK Study: A long-term initiative for disease reclassification through advanced biomarker discovery and integration with electronic health records. Am. J. Transl. Res. 2012, 4, 291–301. [Google Scholar] [PubMed]
- David, W.; Hosmer, S.L.; May, S. Applied Survival Analysis: Regression Modeling of Time-to-Event Data, 2nd ed.; John Wiley & Sons, Inc.: Hoboken, NJ, USA, 2008; p. 401. [Google Scholar]
- Terry, M.; Therneau, P.M.G. Modeling Survival Data: Extending the Cox Model; Springer Science + Business Media, LLC: New York, NY, USA, 2000; p. 350. [Google Scholar]
- Vuong, L.; Bidwell, J.T.; Apesoa-Varano, E.C.; Cothran, F.A.; Catz, S.L. COVID-19 vaccine hesitancy and intent in California registered nurses. Vaccine X 2022, 11, 100162. [Google Scholar] [CrossRef]
- Servidio, R.; Malvaso, A.; Vizza, D.; Valente, M.; Campagna, M.R.; Iacono, M.L.; Martin, L.R.; Bruno, F. The intention to get COVID-19 vaccine and vaccine uptake among cancer patients: An extension of the theory of planned behaviour (TPB). Support. Care Cancer 2022, 30, 7973–7982. [Google Scholar] [CrossRef]
- Padamsee, T.J.; Bond, R.M.; Dixon, G.N.; Hovick, S.R.; Na, K.; Nisbet, E.C.; Wegener, D.T.; Garrett, R.K. Changes in COVID-19 Vaccine Hesitancy Among Black and White Individuals in the US. JAMA Netw. Open 2022, 5, e2144470. [Google Scholar] [CrossRef]
- Enwezor, C.H.; Peacock, J.E., Jr.; Seals, A.L.; Edelstein, S.L.; Hinkelman, A.N.; Wierzba, T.F.; Munawar, I.; Maguire, P.D.; Lagarde, W.H.; Runyon, M.S.; et al. Changing Attitudes toward the COVID-19 Vaccine among North Carolina Participants in the COVID-19 Community Research Partnership. Vaccines 2021, 9, 916. [Google Scholar] [CrossRef]
- Zimmerman, T.; Shiroma, K.; Fleischmann, K.R.; Xie, B.; Jia, C.; Verma, N.; Lee, M.K. Misinformation and COVID-19 vaccine hesitancy. Vaccine 2023, 41, 136–144. [Google Scholar] [CrossRef]
- Moye, R.; Skipper, A.; Towns, T.; Rose, D. Attitudes toward vaccines during the COVID-19 pandemic: Results from HBCU students. AIMS Public Health 2022, 9, 155–172. [Google Scholar] [CrossRef]
- Khairat, S.; Zou, B.; Adler-Milstein, J. Factors and reasons associated with low COVID-19 vaccine uptake among highly hesitant communities in the US. Am. J. Infect. Control. 2022, 50, 262–267. [Google Scholar] [CrossRef] [PubMed]
- Adu, P.; Poopola, T.; Medvedev, O.N.; Collings, S.; Mbinta, J.; Aspin, C.; Simpson, C.R. Implications for COVID-19 vaccine uptake: A systematic review. J. Infect. Public Health 2023, 16, 441–466. [Google Scholar] [CrossRef] [PubMed]
- Schilling, S.; Orr, C.J.; Delamater, A.M.; Flower, K.B.; Heerman, W.J.; Perrin, E.M.; Rothman, R.L.; Yin, H.S.; Sanders, L. COVID-19 vaccine hesitancy among low-income, racially and ethnically diverse US parents. Patient Educ. Couns. 2022, 105, 2771–2777. [Google Scholar] [CrossRef] [PubMed]
- Gurley, S.; Bennett, B.; Sullivan, P.S.; Kiley, M.; Linde, J.; Szczerbacki, D.; Guest, J. COVID-19 Vaccine Perceptions, Intentions, and Uptake Among Young Adults in the United States: Prospective College-Based Cohort Study. JMIR Public Health Surveill. 2021, 7, e33739. [Google Scholar] [CrossRef]
- Shamshirsaz, A.A.; Hessami, K.; Morain, S.; Afshar, Y.; Nassr, A.A.; Arian, S.E.; Asl, N.M.; Aagaard, K. Intention to Receive COVID-19 Vaccine during Pregnancy: A Systematic Review and Meta-analysis. Am. J. Perinatol. 2022, 39, 492–500. [Google Scholar] [CrossRef] [PubMed]
- Shmueli, L. Predicting intention to receive COVID-19 vaccine among the general population using the health belief model and the theory of planned behavior model. BMC Public Health 2021, 21, 804. [Google Scholar] [CrossRef]
- Luo, C.; Yang, Y.; Liu, Y.; Zheng, D.; Shao, L.; Jin, J.; He, Q. Intention to COVID-19 vaccination and associated factors among health care workers: A systematic review and meta-analysis of cross-sectional studies. Am. J. Infect. Control. 2021, 49, 1295–1304. [Google Scholar] [CrossRef]
- Wang, Q.; Yang, L.; Jin, H.; Lin, L. Vaccination against COVID-19: A systematic review and meta-analysis of acceptability and its predictors. Prev. Med. 2021, 150, 106694. [Google Scholar] [CrossRef]
- AlShurman, B.A.; Khan, A.F.; Mac, C.; Majeed, M.; Butt, Z.A. What Demographic, Social, and Contextual Factors Influence the Intention to Use COVID-19 Vaccines: A Scoping Review. Int. J. Environ. Res. Public Health 2021, 18, 9342. [Google Scholar] [CrossRef]
- Duran, S.; Duran, R.; Acunas, B.; Sahin, E.M. Changes in parents’ attitudes towards childhood vaccines during the course of COVID-19 pandemic. Pediatr. Int. 2023, 65, e15520. [Google Scholar] [CrossRef]


| Vaccination Group | Vaccination Eligibility Date | Definition | Analysis Sample n (%) |
|---|---|---|---|
| Priority Group 1 | 12/14/2020 | Healthcare workers, residents and staff of long-term care facilities | 145 (11.9%) |
| Priority Group 2 | 1/18/2021 | Older adults (age 65+) | 531 (43.4%) |
| Priority Group 3a | 2/24/2021 | Primary, secondary, and preschool teachers and other school staff | 68 (5.6%) |
| Priority Group 3b | 3/3/2021 | Other frontline essential workers | 141 (11.5%) |
| Priority Group 4a | 3/17/2021 | People with high-risk medical conditions; People living in close group settings like homeless shelters, jails, or prisons | 289 (23.6%) |
| Priority Group 4b | 3/30/2021 | Other essential workers; other people living in group settings like dormitories or fraternity houses | 9 (0.7%) |
| All adults (Ages 16+) | 4/7/2021 | Everyone 16 years of age or older | 40 (3.3%) |
| Variables | Analysis Population (n = 1223) | BL Vax Intent = ‘NO’ (n = 90) | BL Vax Intent = ‘UNSURE’ (n = 372) | BL Vax Intent = ‘YES’ (n = 761) | p-Value + |
|---|---|---|---|---|---|
| Baseline Age in years | 0.0001 | ||||
| Mean ± SD | 61.2 ± 12.1 | 58.0 ± 11.3 | 58.7 ± 12.3 | 62.8 ± 11.8 | |
| Min–Max | 26.0–90 | 26.0–81.0 | 26.0–87.0 | 27.0–98.0 | |
| Sex | 0.0001 | ||||
| Female | 848 (69.3%) | 72 (80.0%) | 293 (78.8%) | 483 (63.5%) | |
| Male | 375 (30.7%) | 18 (20.0%) | 79 (21.2%) | 278 (36.5%) | |
| Race | 0.0001 | ||||
| White | 1069 (87.4%) | 68 (75.6%) | 295 (79.3%) | 706 (92.8%) | |
| Black | 102 (8.3%) | 15 (16.7%) | 51 (13.7%) | 36 (4.7%) | |
| Other | 52 (4.3%) | 7 (7.8%) | 26 (7.0%) | 19 (2.5%) | |
| Hispanic Ethnicity | 0.0027 | ||||
| Non-Hispanic | 1167 (95.4%) | 85 (94.4%) | 344 (92.5%) | 738 (97.0%) | |
| Hispanic | 56 (4.6%) | 5 (5.6%) | 28 (7.5%) | 23 (3.0%) | |
| Education Level | 0.0001 | ||||
| HS or less | 85 (7.0%) | 7 (7.8%) | 43 (11.6%) | 35 (4.6%) | |
| Some College | 278 (22.7%) | 25 (27.8%) | 96 (25.8%) | 157 (20.6%) | |
| College Grad | 480 (39.2%) | 40 (44.4%) | 136 (36.6%) | 304 (39.9%) | |
| Graduate School | 380 (31.1%) | 18 (20.0%) | 97 (26.1%) | 265 (34.8%) | |
| Household Income | 0.0001 | ||||
| <30,000 | 96 (7.8%) | 7 (7.8%) | 44 (11.8%) | 45 (5.9%) | |
| 30,000–49,999 | 144 (11.8%) | 18 (20.0%) | 60 (16.1%) | 66 (8.7%) | |
| 50,000–74,999 | 195 (15.9%) | 15 (16.7%) | 52 (14.0%) | 128 (16.8%) | |
| 75,000–89,999 | 213 (17.4%) | 14 (15.6%) | 69 (18.5%) | 130 (17.1%) | |
| 90,000+ | 575 (47.0%) | 36 (40.0%) | 147 (39.5%) | 392 (51.5%) | |
| BMI | 0.0003 | ||||
| Mean ± SD | 28.6 ± 6.1 | 30.7 ± 7.3 | 29.0 ± 5.9 | 28.2 ± 5.9 | |
| Min–Max | 16.0–62.0 | 17.3–62.0 | 16.0–53.7 | 16.0–54.1 | |
| BMI Group | 0.0273 | ||||
| Underweight (BMI < 18.5) | 15 (1.2%) | 1 (1.1%) | 6 (1.6%) | 8 (1.1%) | |
| Healthy (18.5 ≤ BMI < 25) | 327 (26.7%) | 16 (17.8%) | 86 (23.1%) | 225 (29.6%) | |
| Overweight (25 ≤ BMI < 30) | 467 (38.2%) | 30 (33.3%) | 146 (39.2%) | 291 (38.2%) | |
| Obese (30 ≤ BMI < 40) | 350 (28.6%) | 34 (37.8%) | 116 (31.2%) | 200 (26.3%) | |
| Severely Obese (BMI ≥ 40) | 64 (5.2%) | 9 (10.0%) | 18 (4.8%) | 37 (4.9%) | |
| Current Smoker | 0.0353 | ||||
| Yes | 39 (3.2%) | 3 (3.3%) | 19 (5.1%) | 17 (2.2%) | |
| No | 1184 (96.8%) | 87 (96.7%) | 353 (94.9%) | 744 (97.8%) | |
| Received a COVID-19 vaccine during the study period | <0.0001 | ||||
| Yes | 1130 (92.4%) | 51 (56.7%) | 334 (89.8%) | 745 (97.9%) | |
| No | 93 (7.6%) | 39 (43.3%) | 38 (10.2%) | 16 (2.1%) |
| Characteristic | Param Est. (SE) | Hazard Ratio (95% CI) | Joint Test p-Value | Pairwise Comparison p-Value |
|---|---|---|---|---|
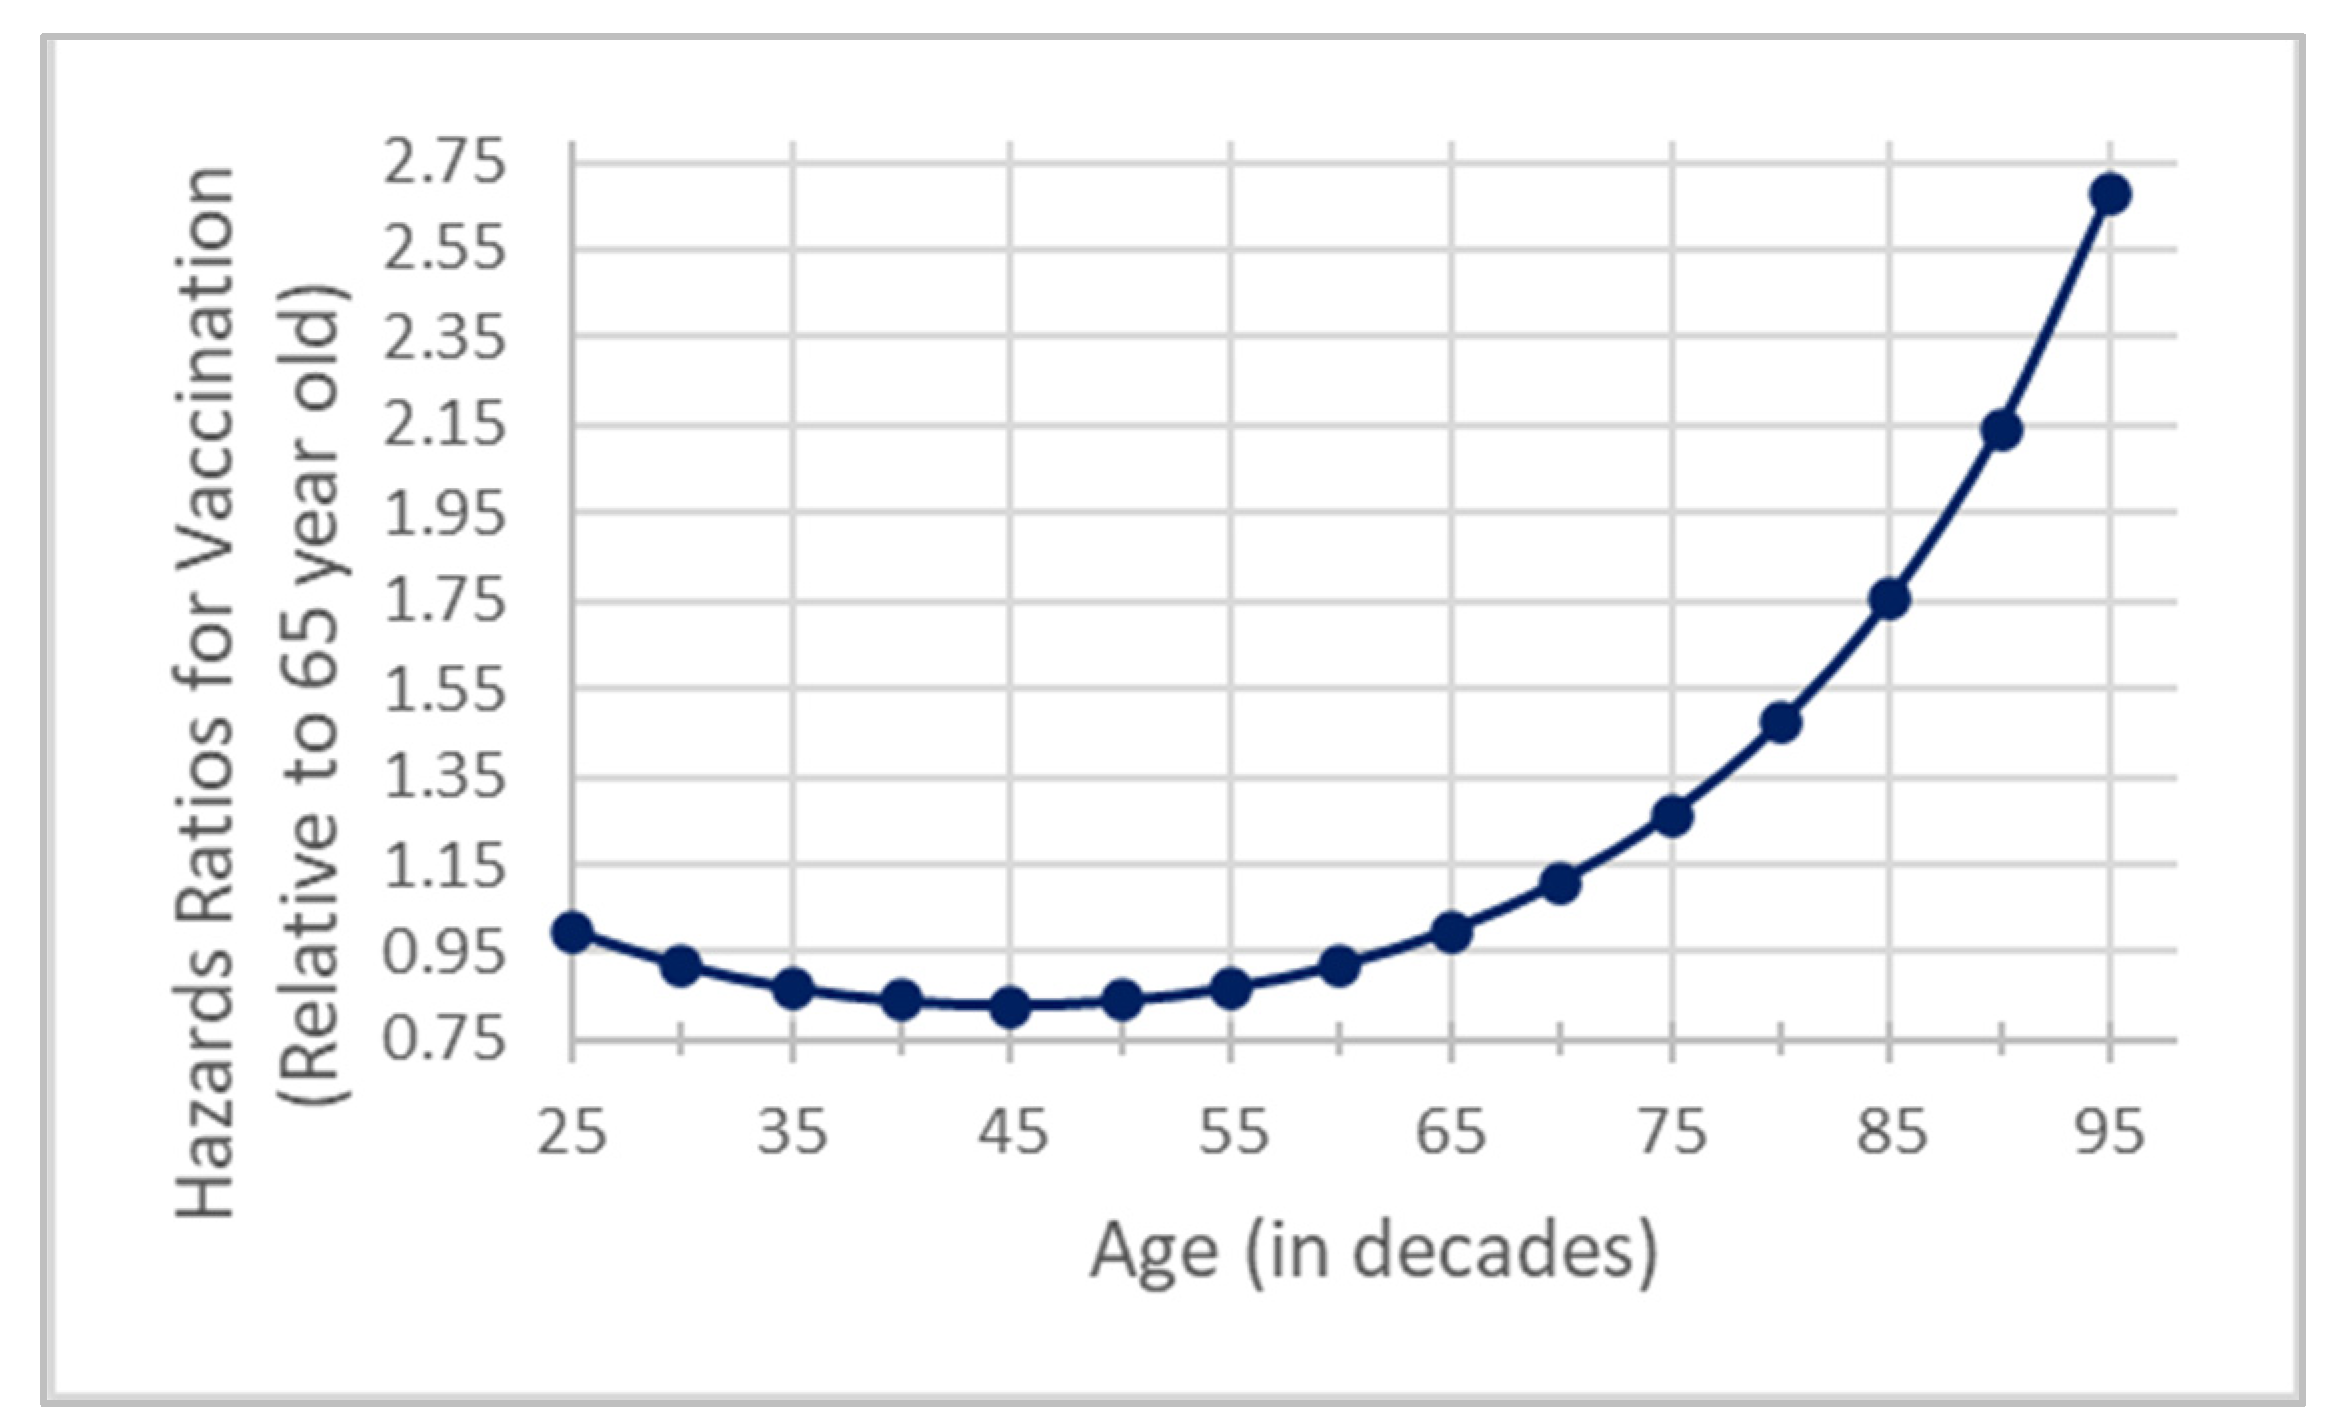
| Age at baseline (in decades, centered at 65) | 0.19 (0.03) | 1.21 (1.13–1.29) | 0.0001 | |
| Age2 at baseline (in decades, centered at 65) | 0.05 (0.02) | 1.05 (1.01–1.06) | 0.0066 | |
| Male | −0.06 (0.07) | 0.95 (0.83–1.08) | 0.3947 | |
| Minority Race | −0.06 (0.11) | 0.95 (0.77–1.16) | 0.5900 | |
| Hispanic | 0.18 (0.15) | 1.20 (0.88–1.62) | 0.2466 | |
| Some College or less | −0.23 (0.07) | 0.80 (0.69–0.92) | 0.0014 | |
| Income < $50,000 | −0.17 (0.08) | 0.84 (0.72–0.98) | 0.0312 | |
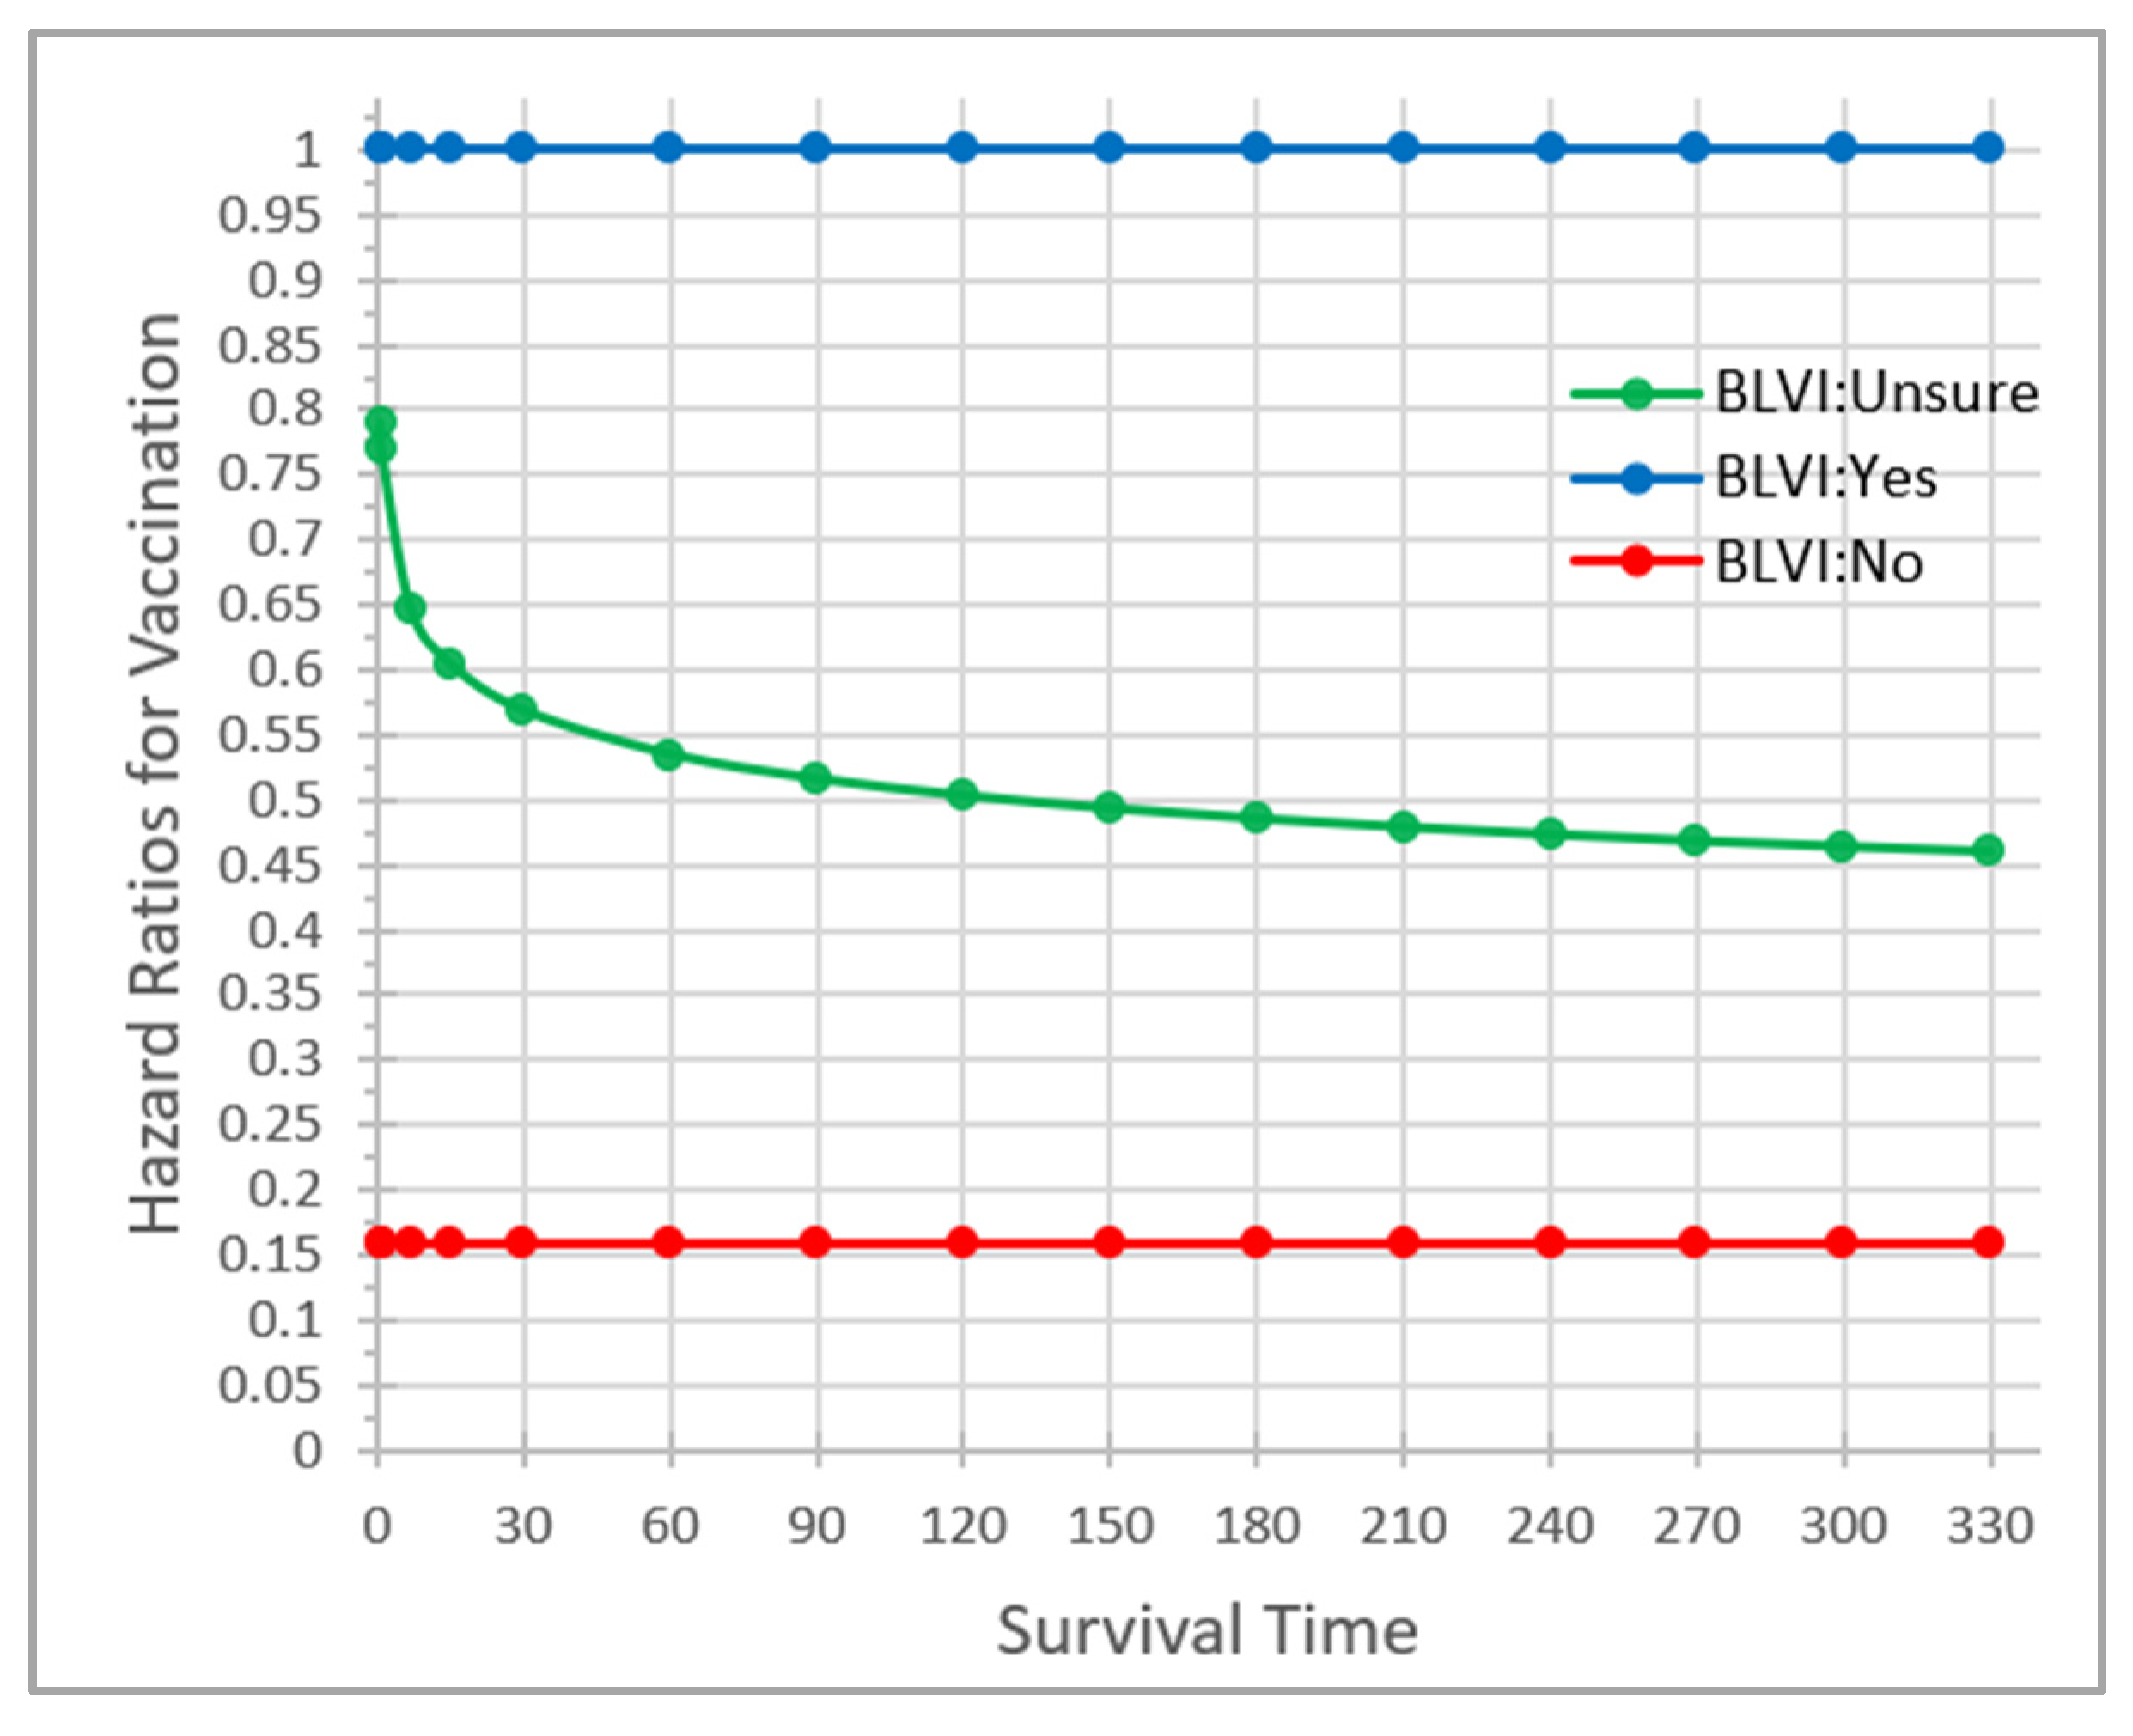
| BL Vaccination Intention (‘Yes’ = ref) | 0.0001 | |||
| No | −1.84 (0.19) | 0.16 (0.11–0.23) | 0.0001 | |
| Unsure | −0.26 (0.10) | 0.77 (0.63–0.94) | 0.0088 | |
| Minority Race XBL Vaccination Intention (BVI) | ||||
| Minority: Yes X BVI = ‘Unsure’ | 0.98 (0.31) | 2.67 (1.46–4.88) | 0.0014 | |
| BL Vaccination Intention X Time to Vaccination | 0.0535 | |||
| BVI = ’Unsure’ X Time to Vaccination | −0.09 (0.04) | 0.92 (0.85–0.99) | 0.0203 |
Disclaimer/Publisher’s Note: The statements, opinions and data contained in all publications are solely those of the individual author(s) and contributor(s) and not of MDPI and/or the editor(s). MDPI and/or the editor(s) disclaim responsibility for any injury to people or property resulting from any ideas, methods, instructions or products referred to in the content. |
© 2023 by the authors. Licensee MDPI, Basel, Switzerland. This article is an open access article distributed under the terms and conditions of the Creative Commons Attribution (CC BY) license (https://creativecommons.org/licenses/by/4.0/).
Share and Cite
Neighbors, C.E.; Faldowski, R.A.; Pieper, C.F.; Taylor, J.; Gaines, M.; Sloane, R.; Wixted, D.; Woods, C.W.; Newby, L.K. Factors Associated with COVID-19 Vaccination Promptness after Eligibility in a North Carolina Longitudinal Cohort Study. Vaccines 2023, 11, 1639. https://doi.org/10.3390/vaccines11111639
Neighbors CE, Faldowski RA, Pieper CF, Taylor J, Gaines M, Sloane R, Wixted D, Woods CW, Newby LK. Factors Associated with COVID-19 Vaccination Promptness after Eligibility in a North Carolina Longitudinal Cohort Study. Vaccines. 2023; 11(11):1639. https://doi.org/10.3390/vaccines11111639
Chicago/Turabian StyleNeighbors, Coralei E., Richard A. Faldowski, Carl F. Pieper, Joshua Taylor, Megan Gaines, Richard Sloane, Douglas Wixted, Christopher W. Woods, and L. Kristin Newby. 2023. "Factors Associated with COVID-19 Vaccination Promptness after Eligibility in a North Carolina Longitudinal Cohort Study" Vaccines 11, no. 11: 1639. https://doi.org/10.3390/vaccines11111639
APA StyleNeighbors, C. E., Faldowski, R. A., Pieper, C. F., Taylor, J., Gaines, M., Sloane, R., Wixted, D., Woods, C. W., & Newby, L. K. (2023). Factors Associated with COVID-19 Vaccination Promptness after Eligibility in a North Carolina Longitudinal Cohort Study. Vaccines, 11(11), 1639. https://doi.org/10.3390/vaccines11111639