
IV BCG Vaccination and Aerosol BCG Revaccination Induce Mycobacteria-Responsive γδ T Cells Associated with Protective Efficacy against M. tb Challenge
 , , ,
, , , 
Abstract
:1. Introduction
2. Materials and Methods
2.1. Animals
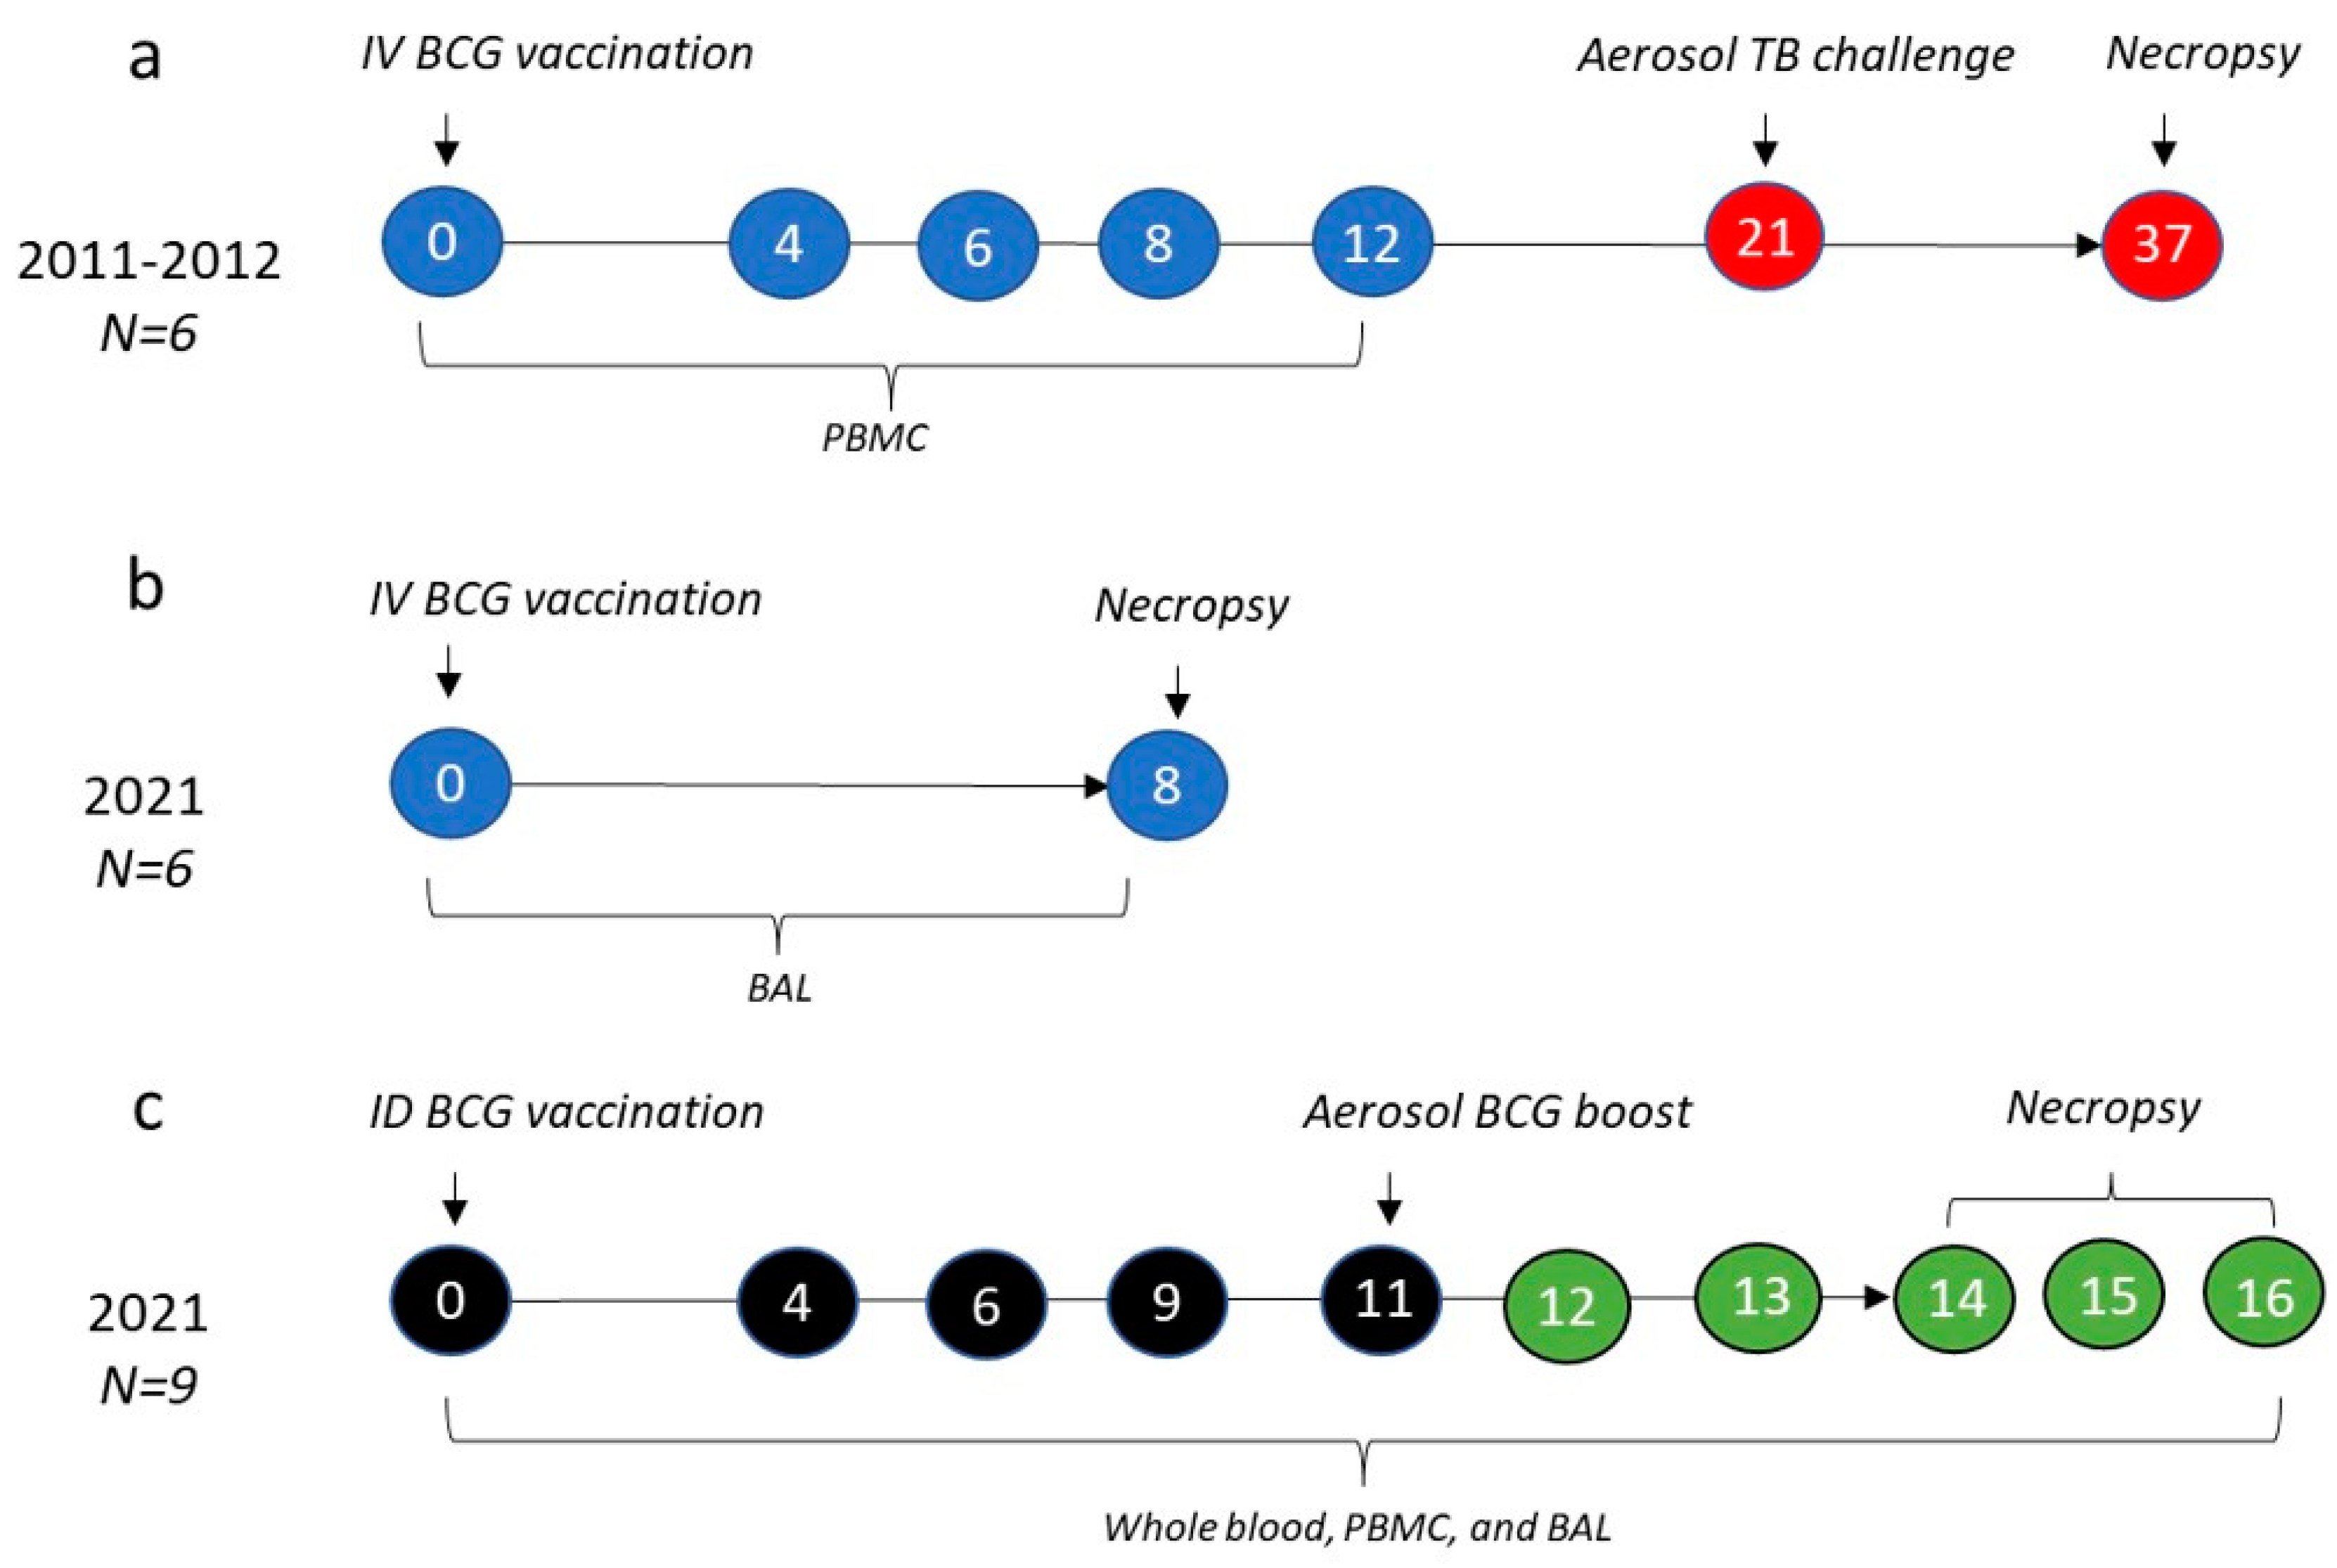
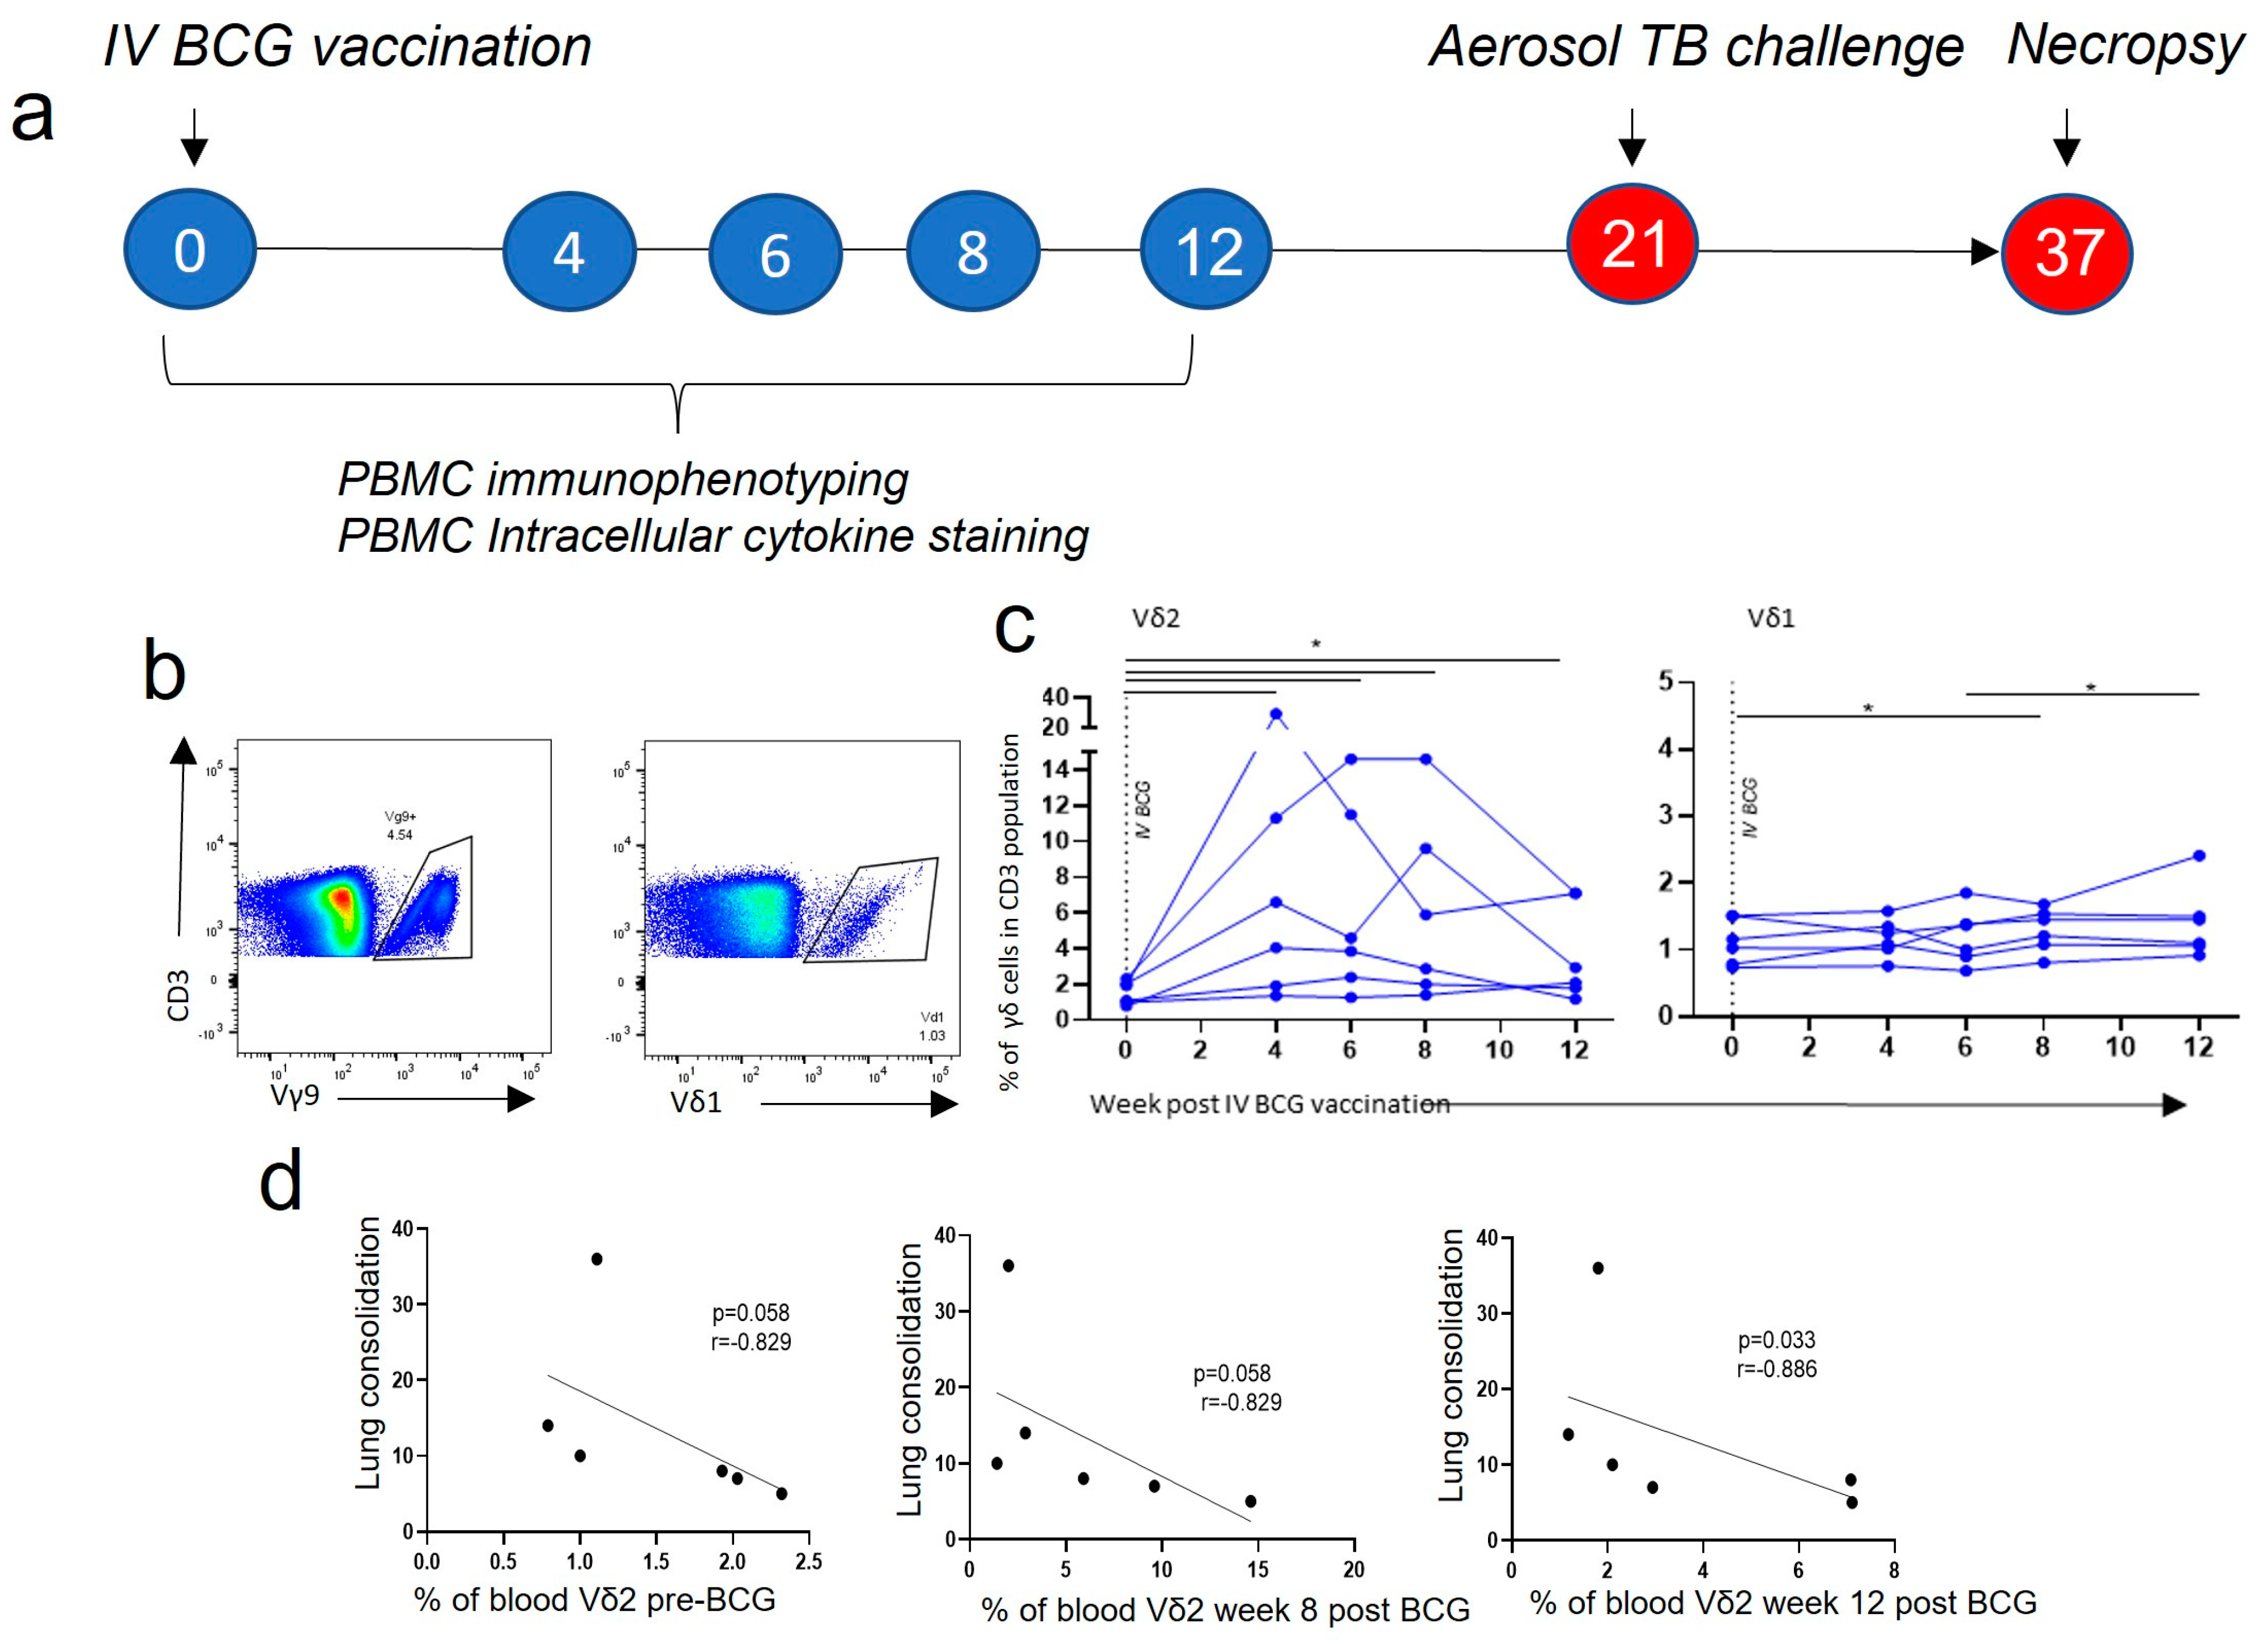
2.2. Study Design
2.3. Tuberculosis Challenge
2.4. Clinical Outcomes
2.5. Mononuclear Cell Isolation
2.6. Surface Staining and Flow Cytometry
2.7. Whole Blood Immunophenotyping
2.8. Cytokine and Cytotoxicity Analysis
2.9. Statistics
3. Results
3.1. Vδ2 T Cell Populations Expanded in PBMCs after IV BCG Vaccination and Were Associated with a Reduction in TB Pathology
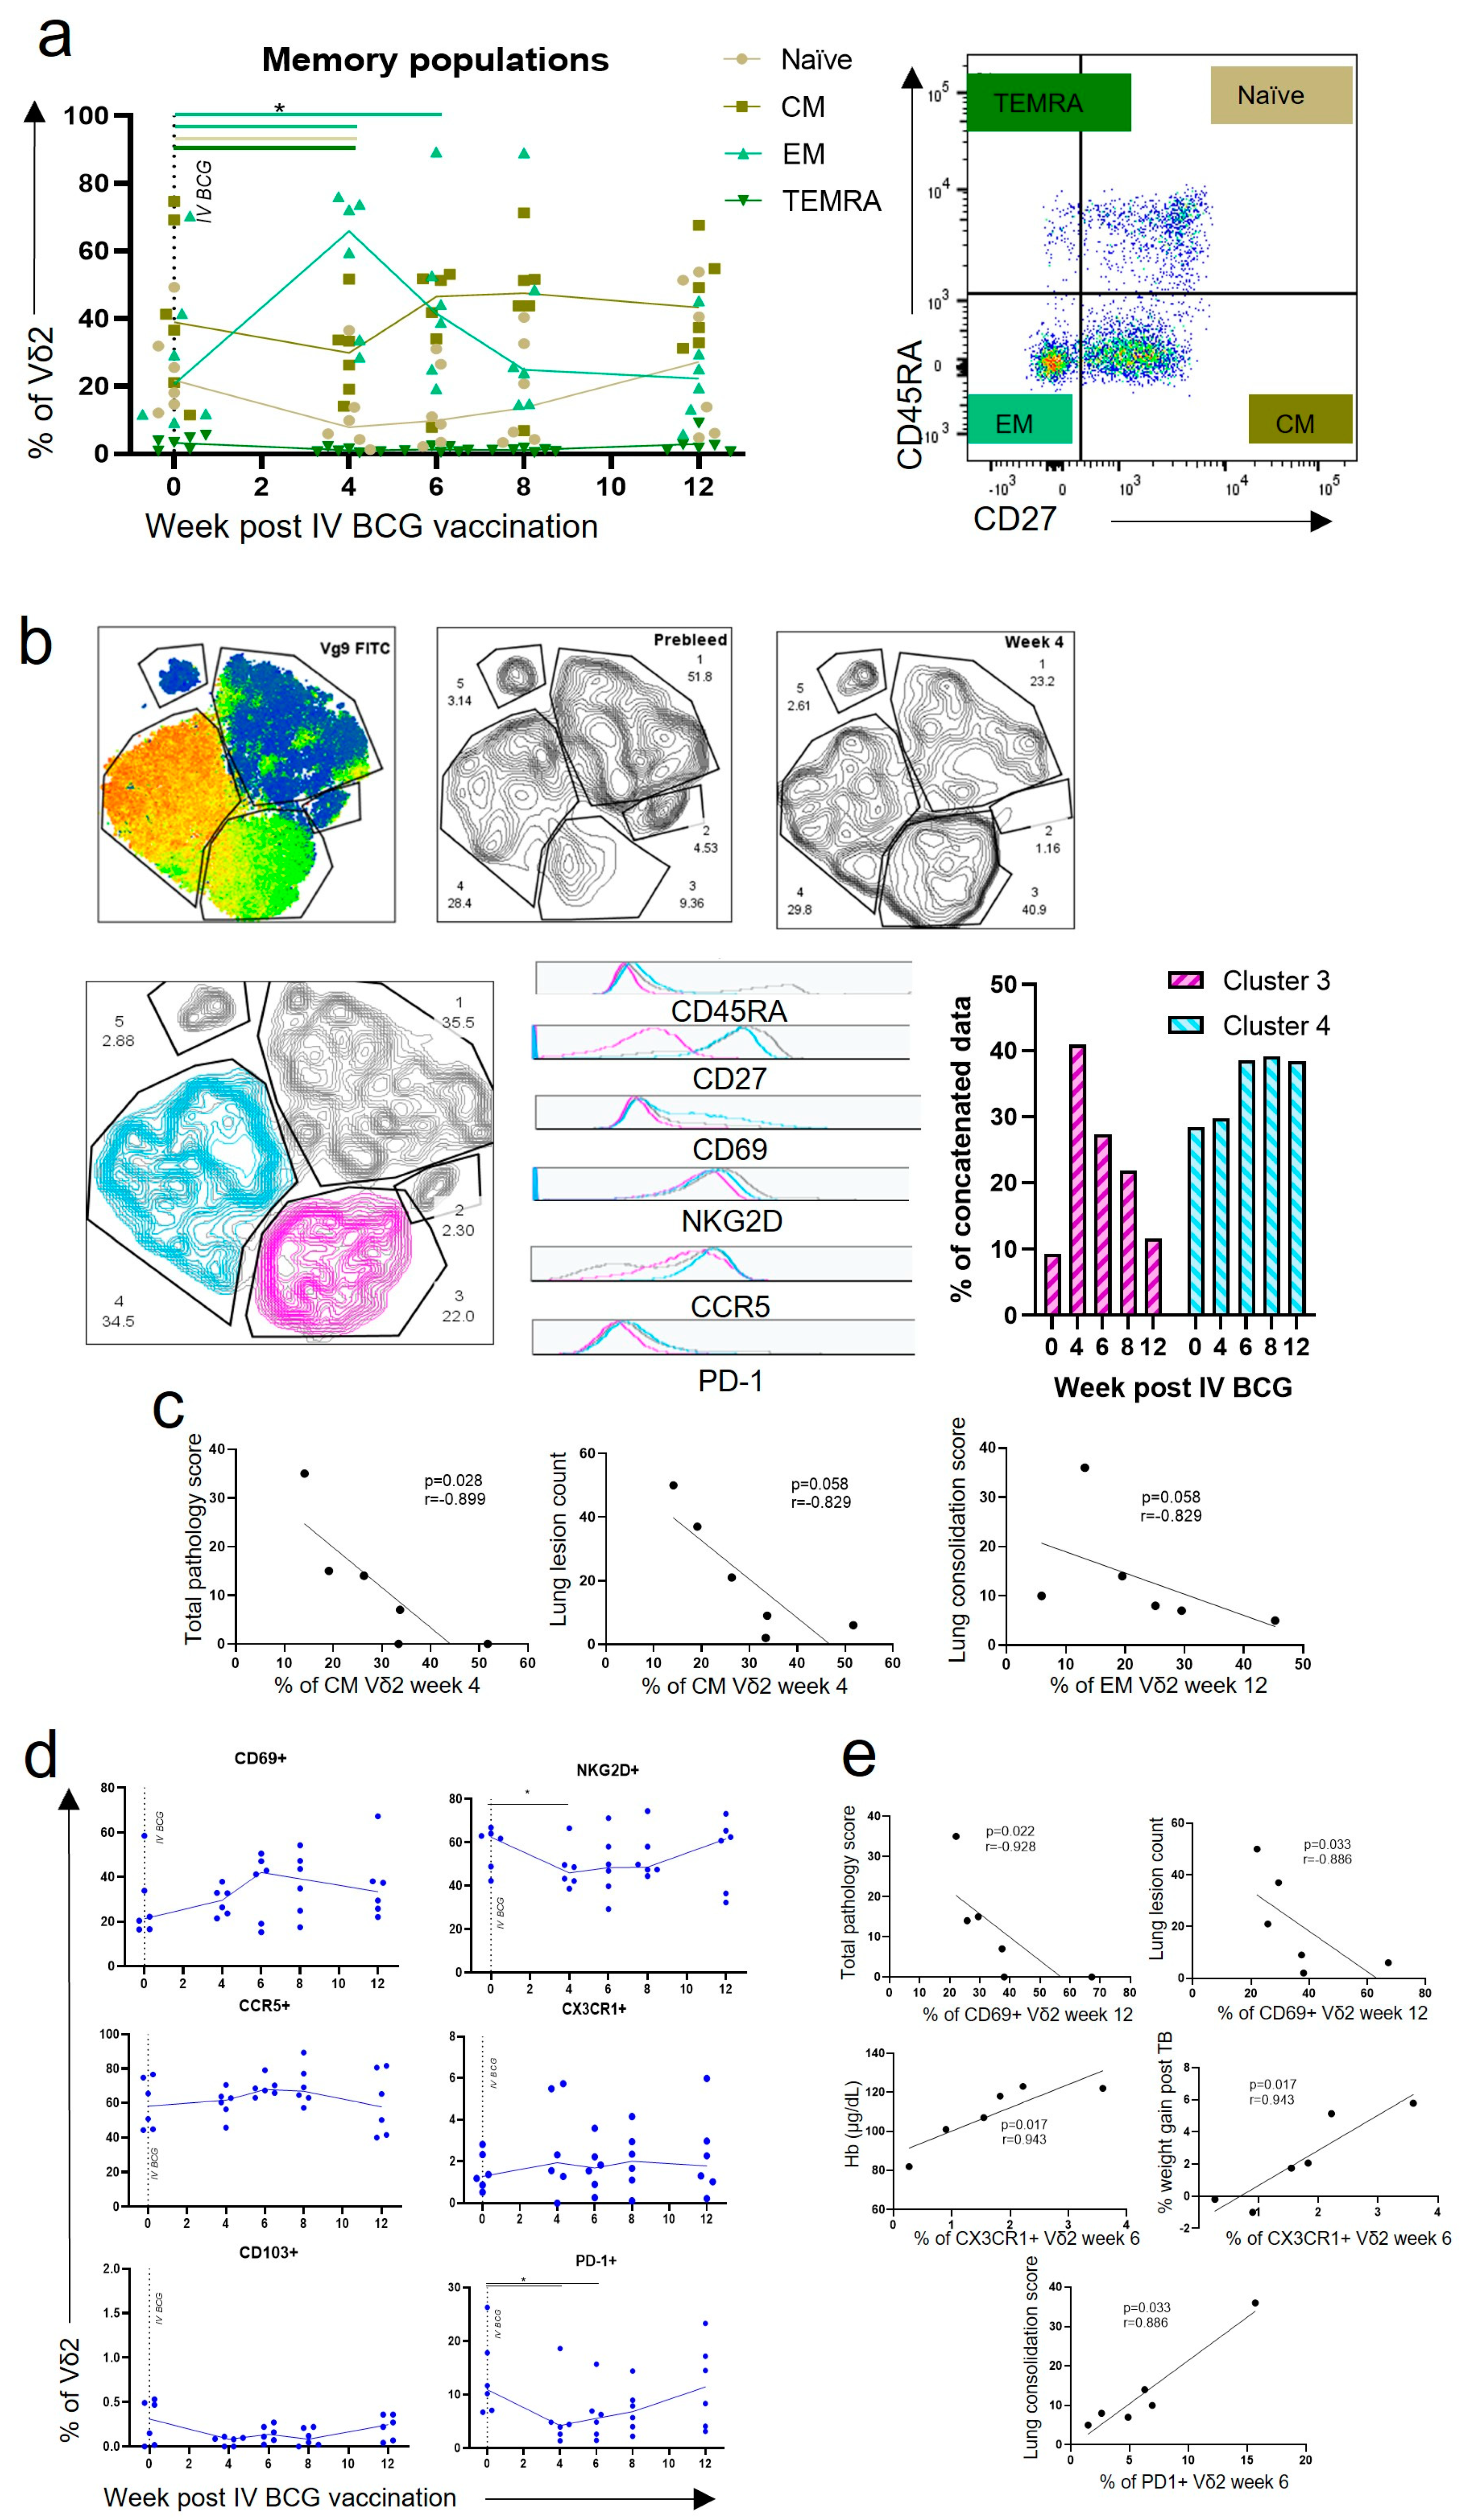
3.2. Central Memory and Effector Memory Vδ2 Cells Expressing Activation and Homing Markers after IV BCG Vaccination Were Associated with a Reduction in TB Pathology
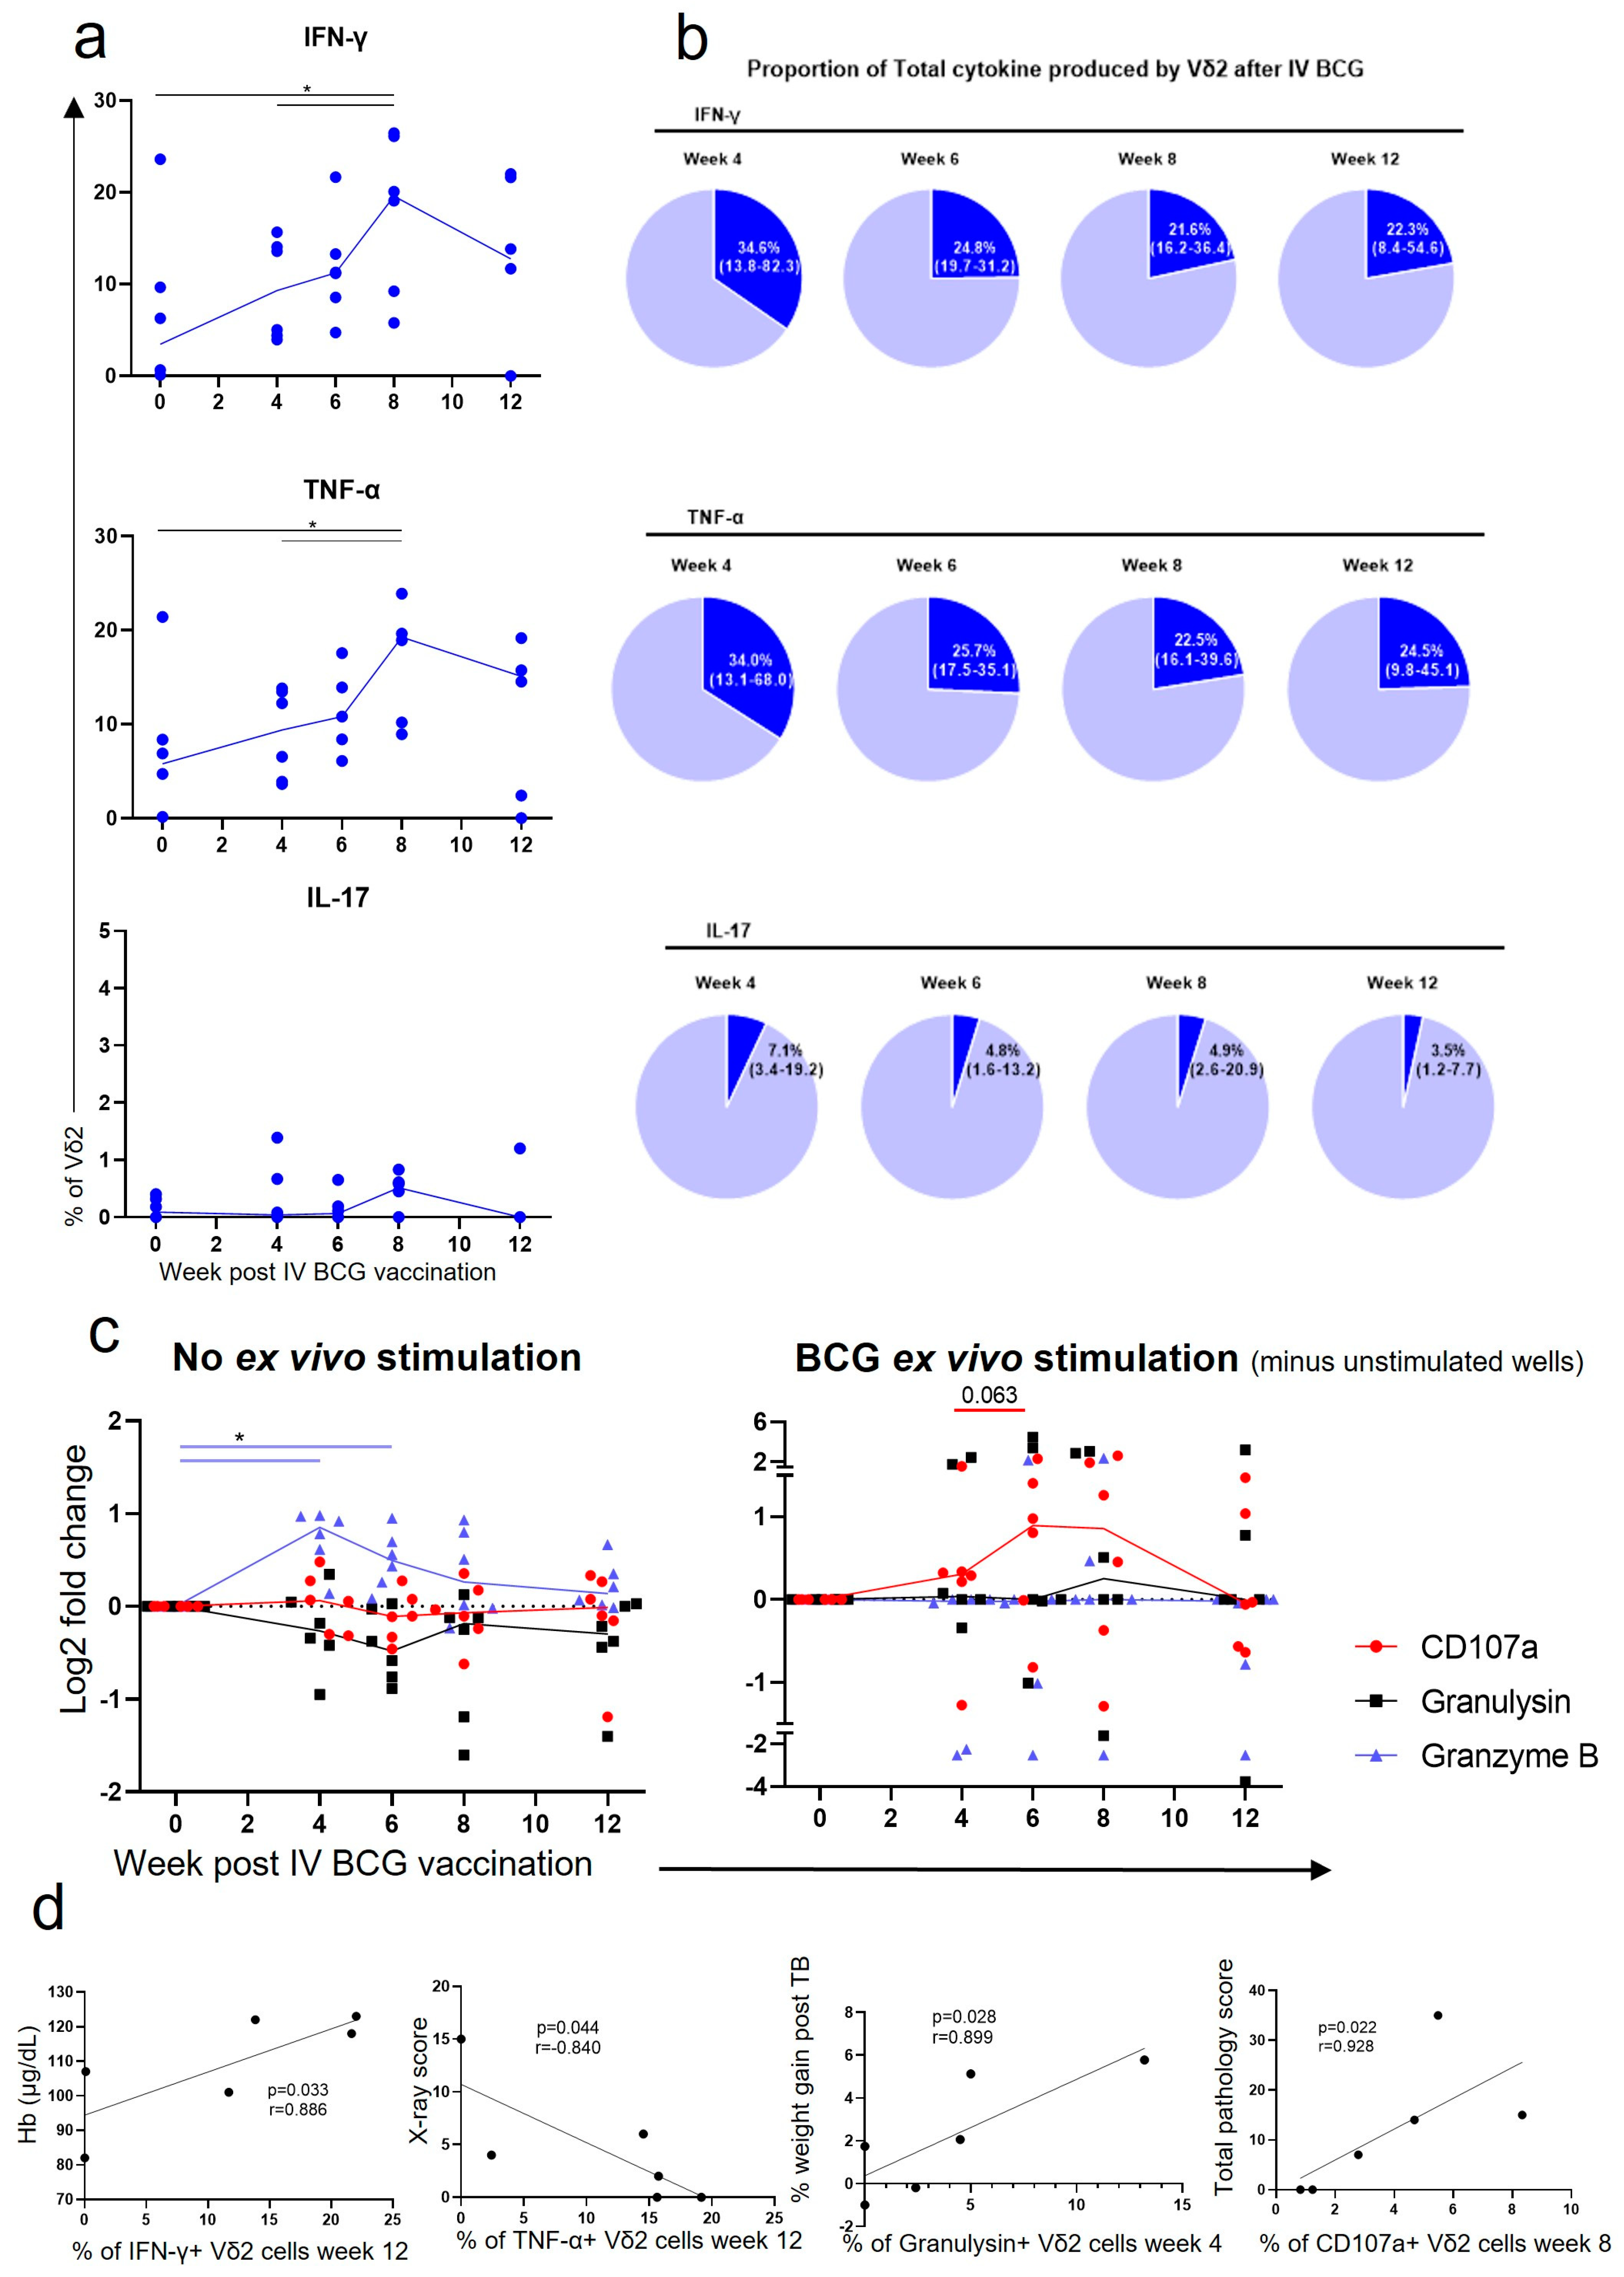
3.3. Vδ2 Cells Produced Inflammatory Cytokines after IV BCG Vaccination, Which Was Associated with A Reduction in TB Pathology
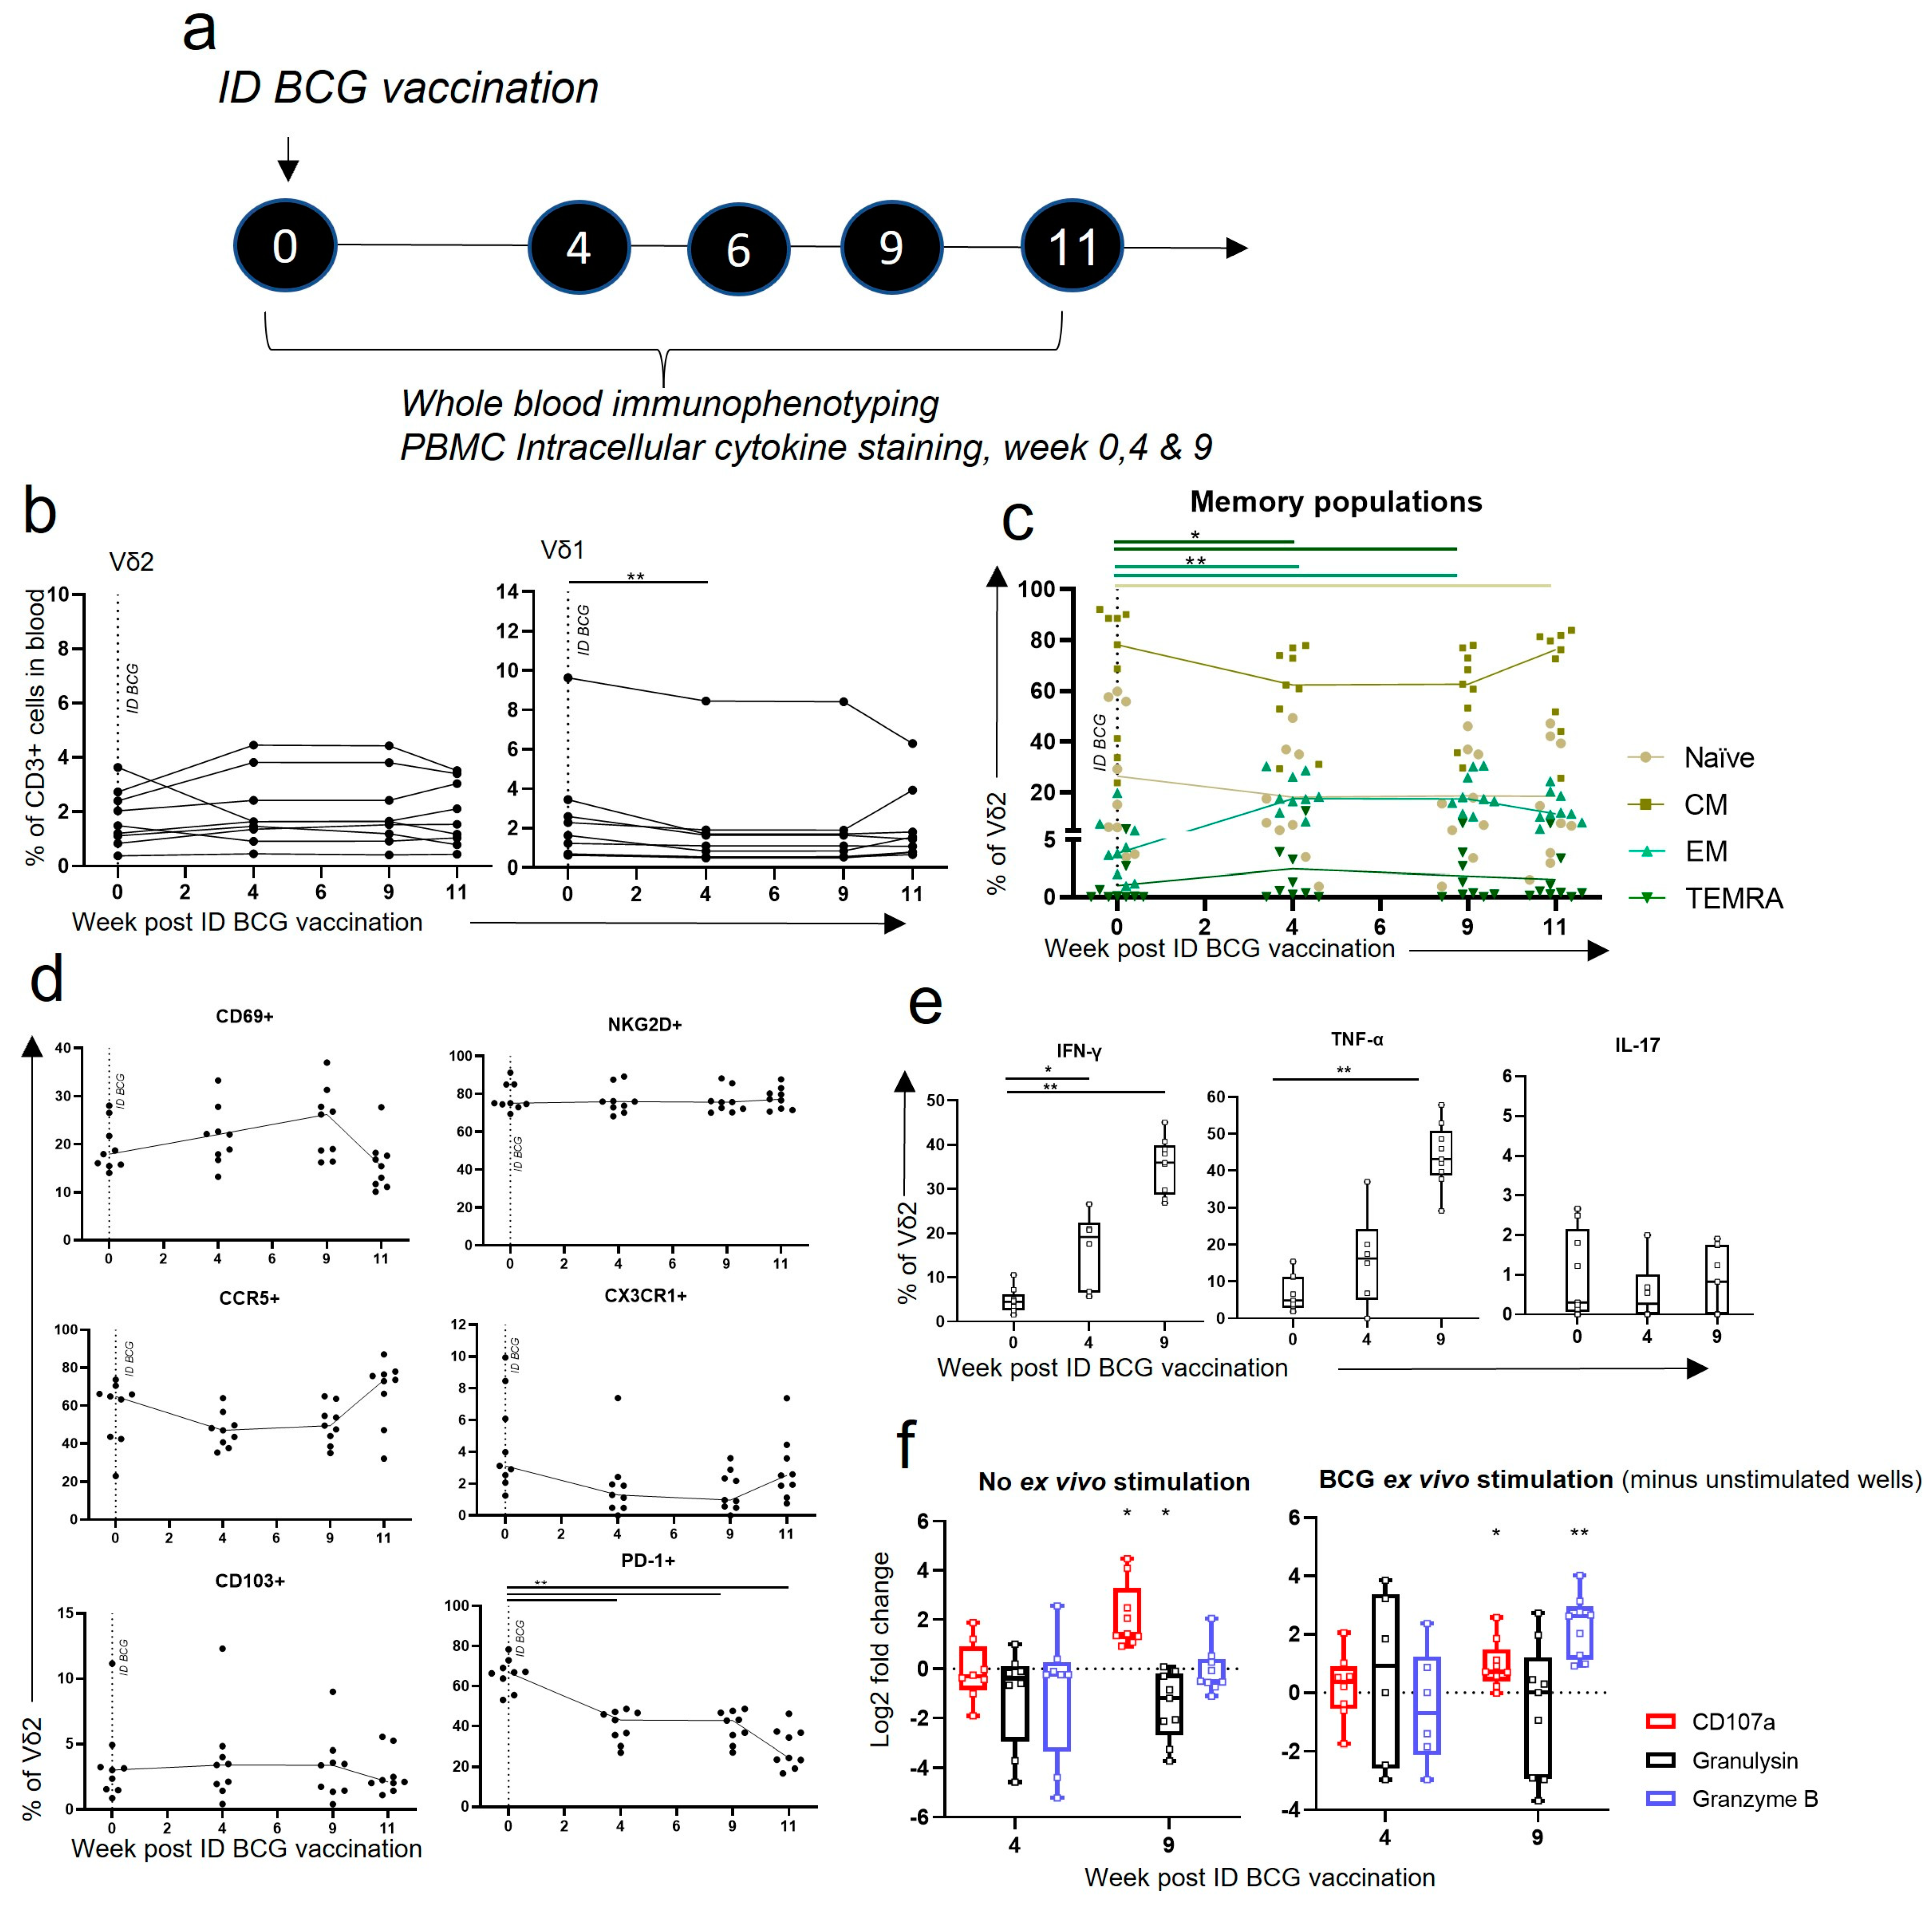
3.4. Vδ2 T Cells Did Not Expand in the Blood after ID BCG, but Showed Phenotypic and Functional Changes
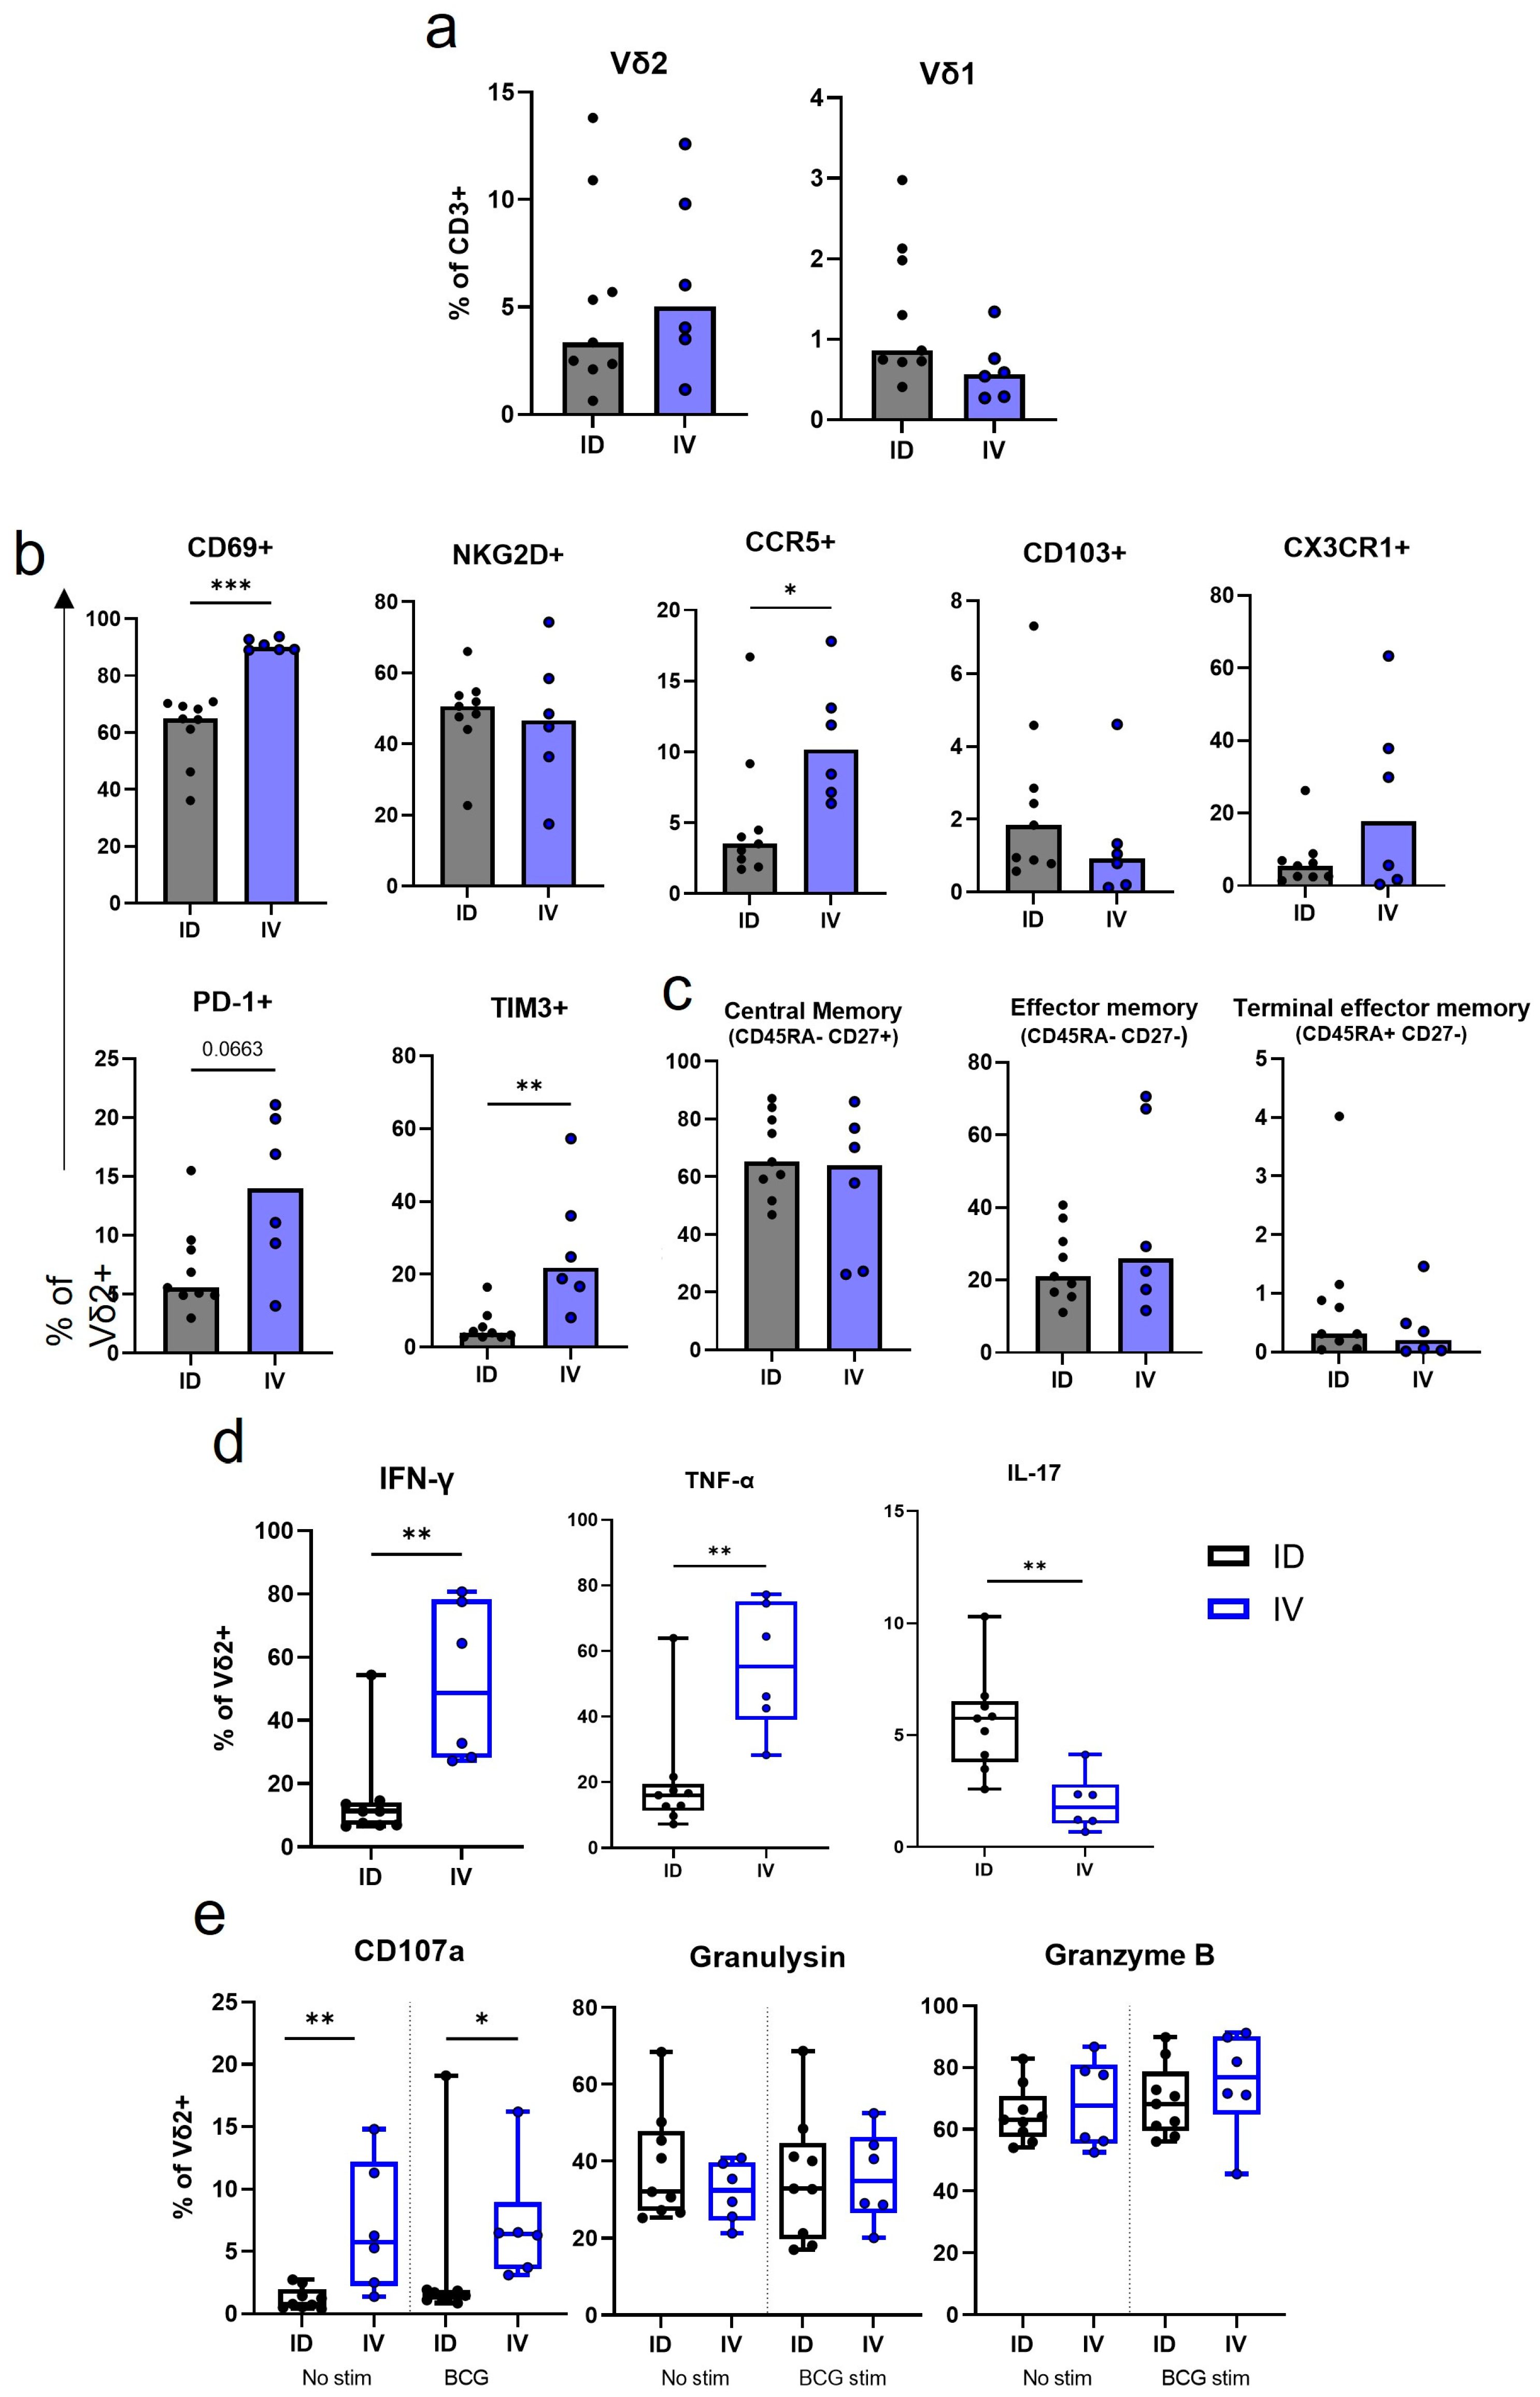
3.5. IV BCG Results in a Higher Proportion of CD69+ CCR5+ Vδ2 Cells in the Lung in Comparison to ID BCG Vaccination
3.6. IV BCG Results in More BCG-Specific Inflammatory Cytokine and Cytotoxic Molecule Producing Vδ2 Cells in the BAL
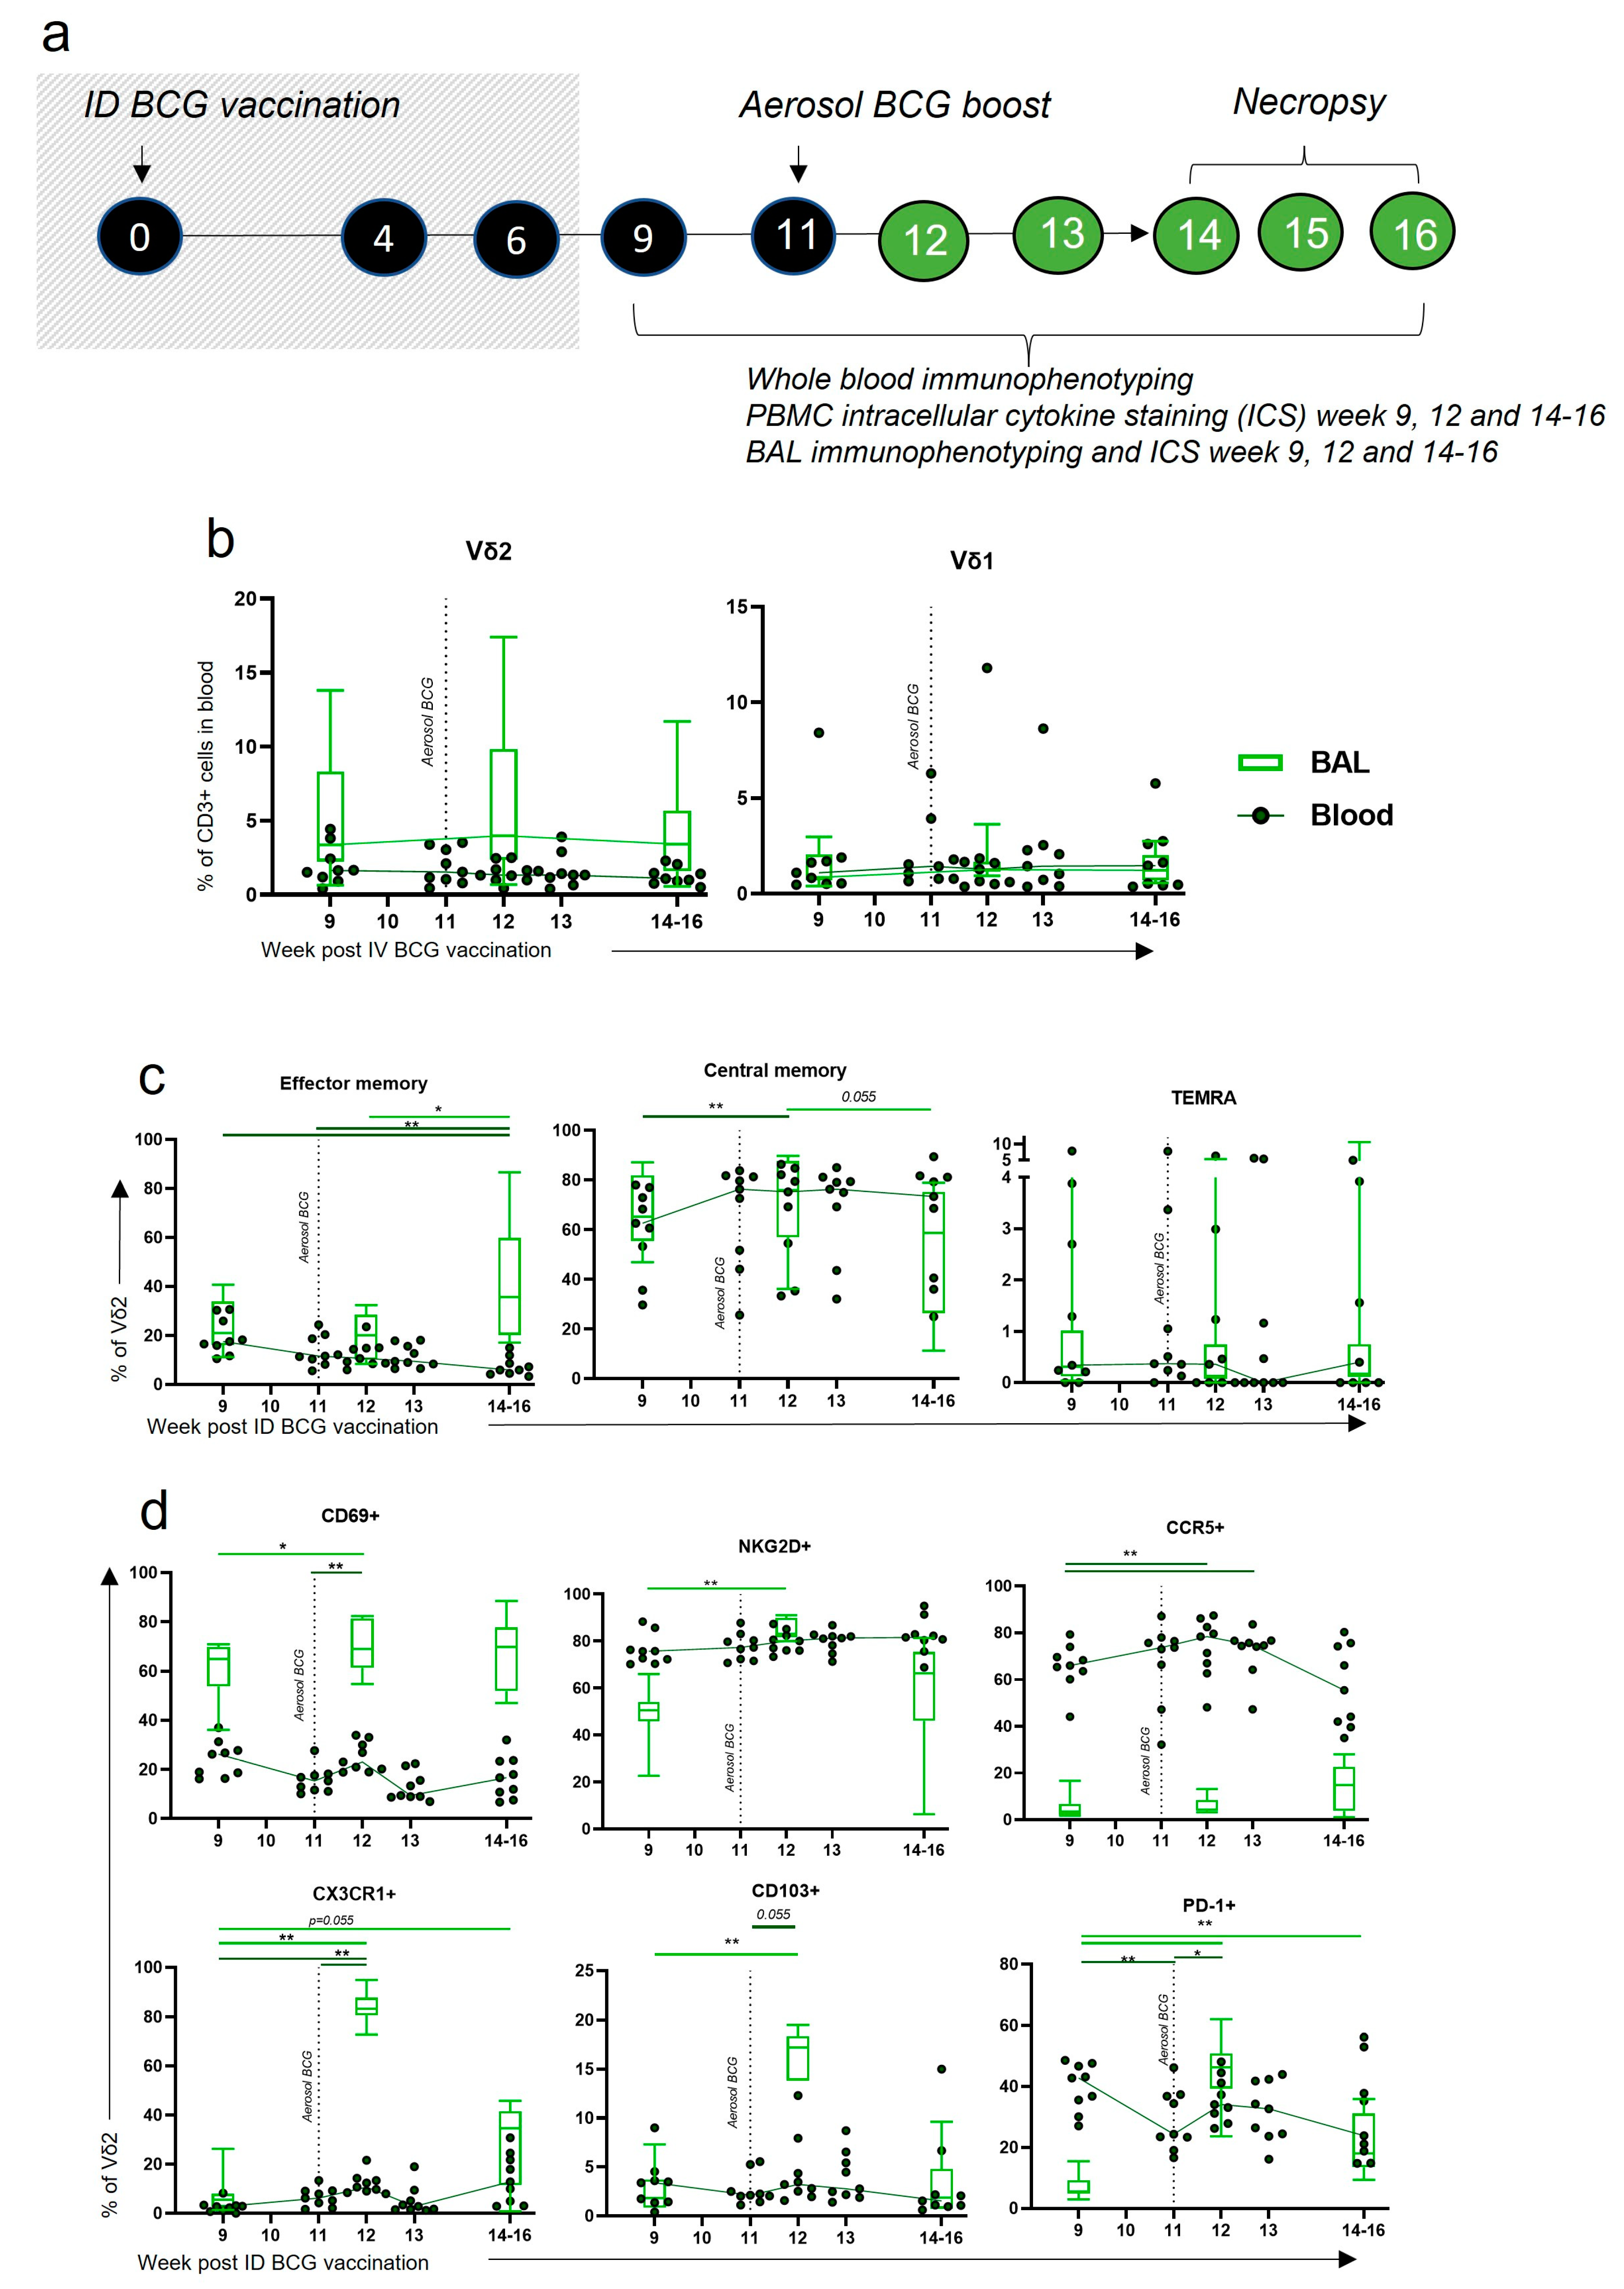
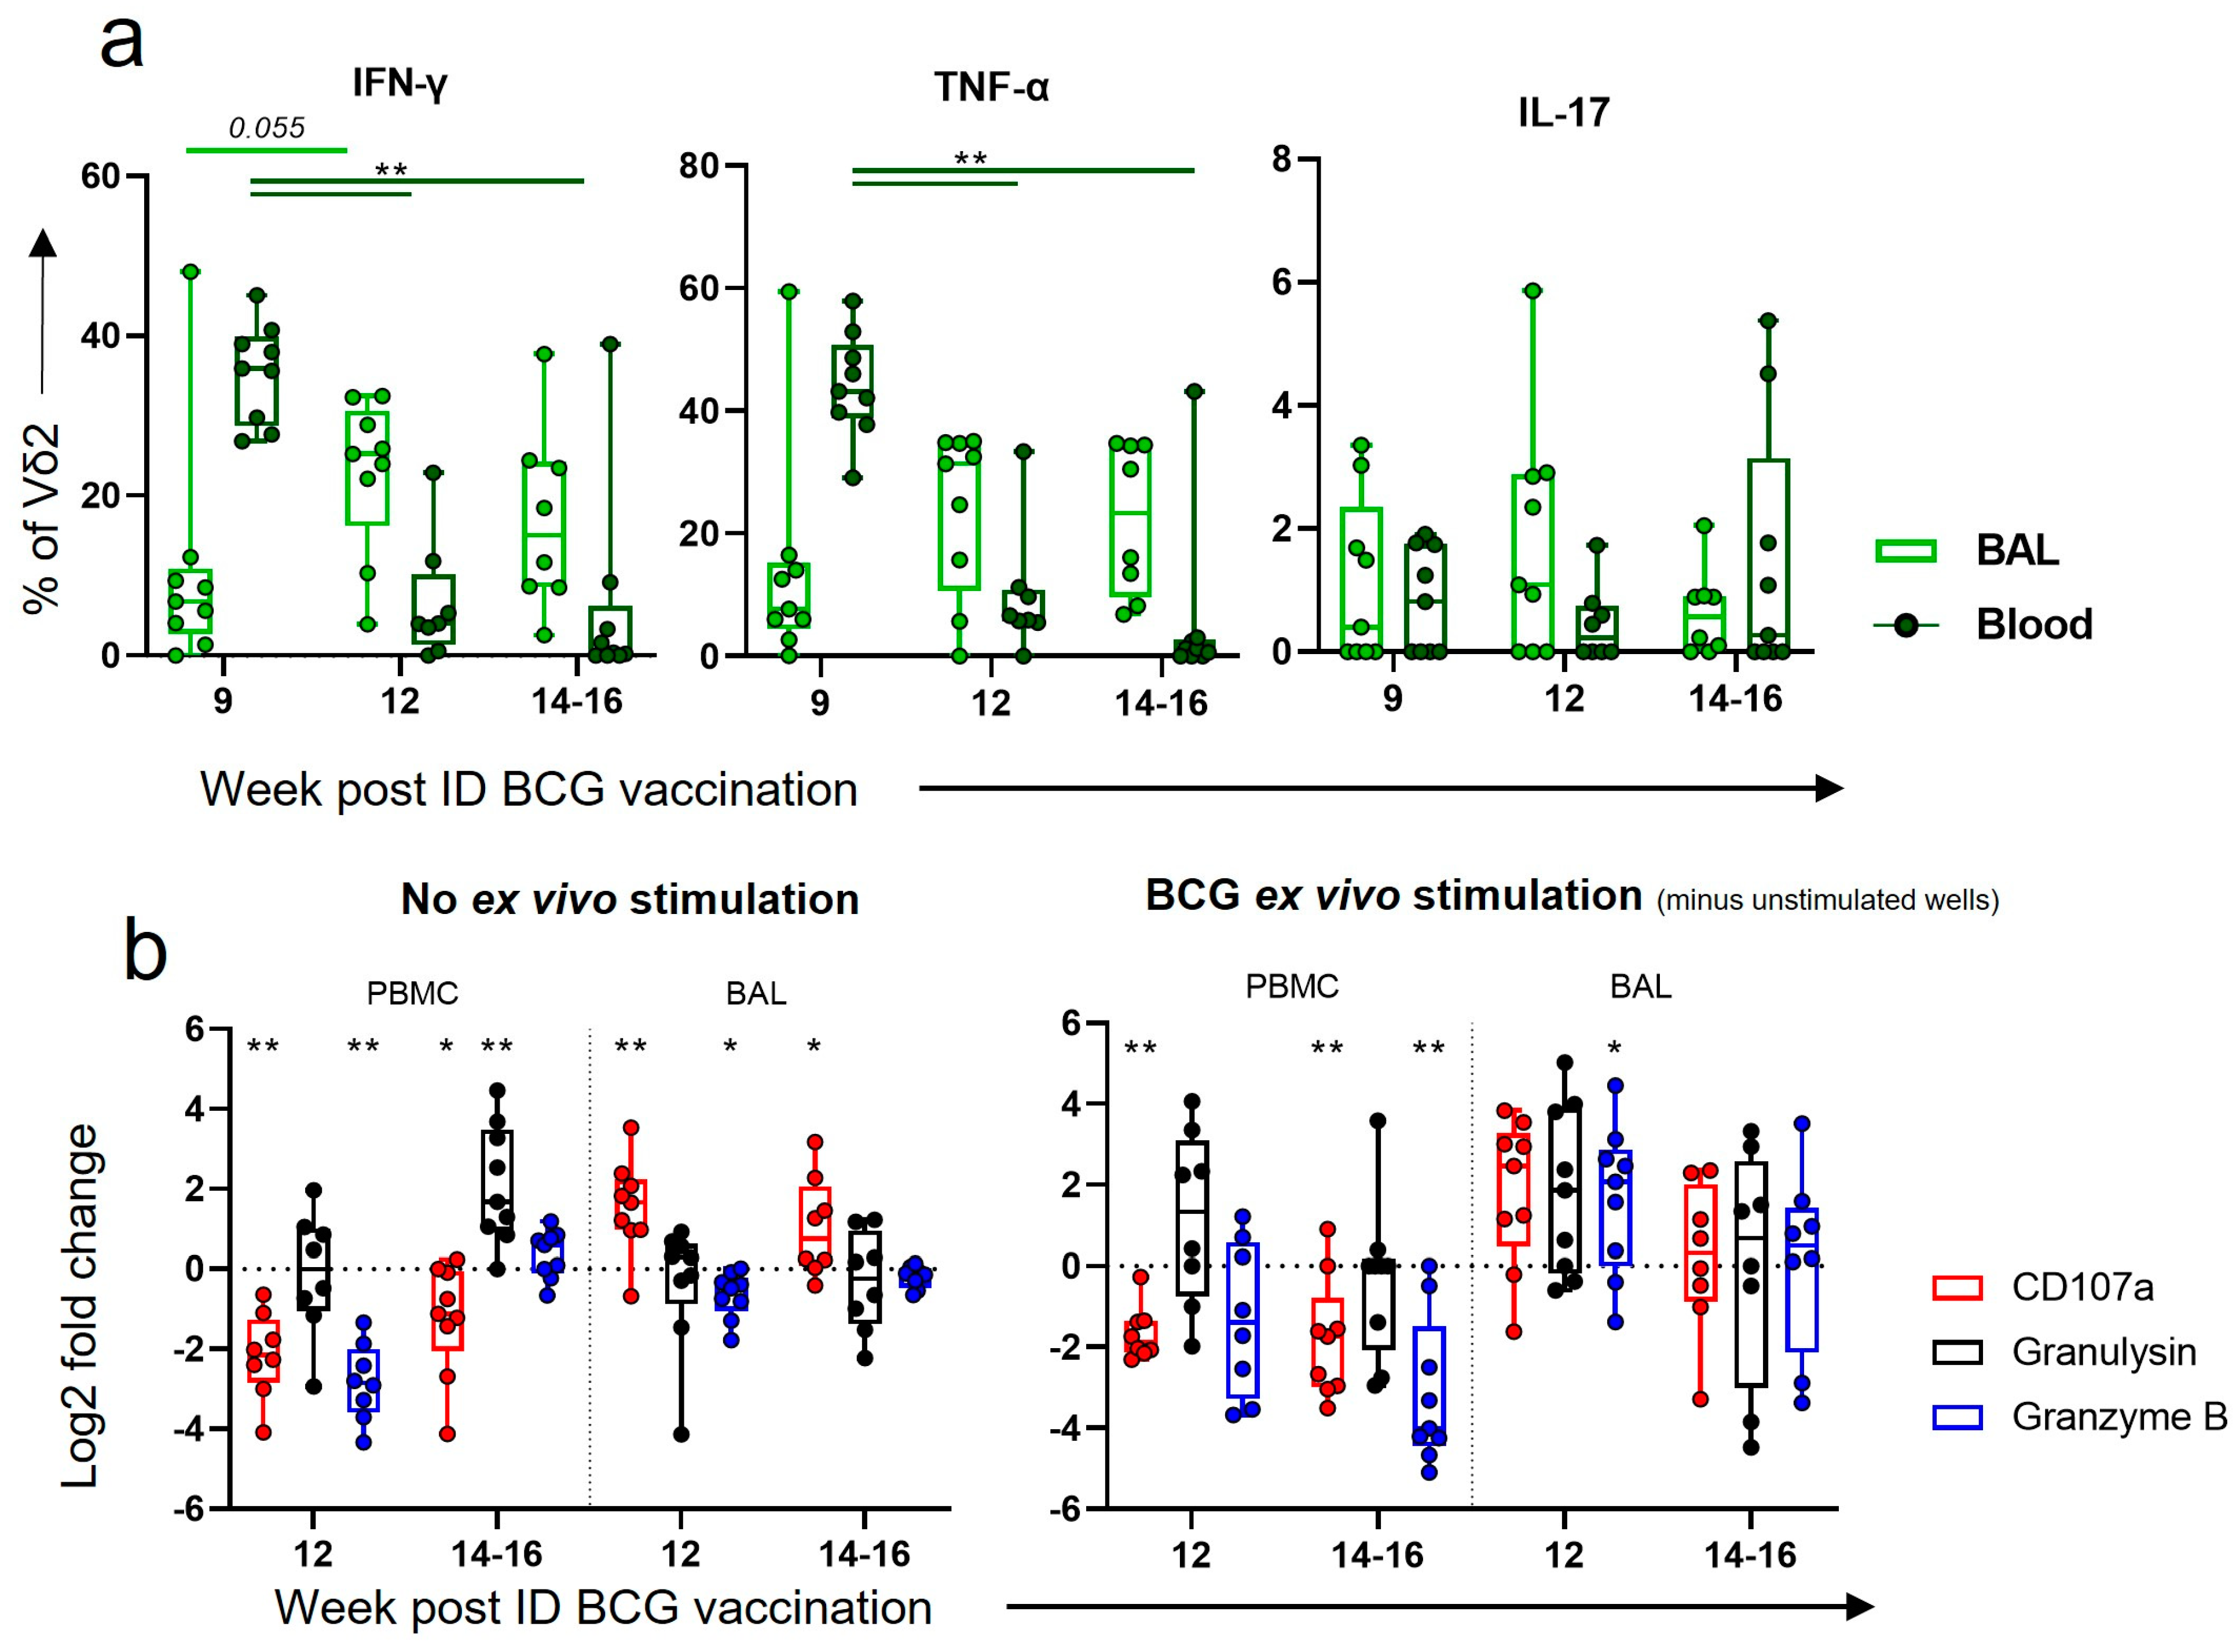
3.7. Aerosol BCG Boosting of ID BCG-Vaccinated Macaques Leads to Changes in BAL Vδ2 Phenotype
3.8. After Boosting, a Decrease in Vδ2 Functional Responses in the Blood Corresponded to an Increase in Functional Responses in the BAL
4. Discussion
4.1. Memory Vδ2 T Cells Expressing Activation and Homing Markers Were Associated with Better TB Outcome after IV BCG
4.2. Homing of Functional Cells to Peripheral Sites May Be an Important Part of the Vδ2 IV BCG Response
4.3. An Aerosol BCG Boost Can Redirect ID BCG Immune Responses to the Airway
Supplementary Materials
Author Contributions
Funding
Institutional Review Board Statement
Informed Consent Statement
Data Availability Statement
Acknowledgments
Conflicts of Interest
References
- Global Tuberculosis Programme. Available online: https://www.who.int/teams/global-tuberculosis-programme/tb-reports (accessed on 25 May 2023).
- Trunz, B.B.; Fine, P.; Dye, C. Effect of BCG vaccination on childhood tuberculous meningitis and miliary tuberculosis worldwide: A meta-analysis and assessment of cost-effectiveness. Lancet 2006, 367, 1173–1180. [Google Scholar] [CrossRef] [PubMed]
- Martinez, L.; Cords, O.; Liu, Q.; Acuna-Villaorduna, C.; Bonnet, M.; Fox, G.J.; Carvalho, A.C.C.; Chan, P.-C.; Croda, J.; Hill, P.C.; et al. Infant BCG vaccination and risk of pulmonary and extrapulmonary tuberculosis throughout the life course: A systematic review and individual participant data meta-analysis. Lancet Glob. Health 2022, 10, e1307–e1316. [Google Scholar] [CrossRef] [PubMed]
- McShane, H. Insights and challenges in tuberculosis vaccine development. Lancet Respir. Med. 2019, 7, 810–819. [Google Scholar] [CrossRef] [PubMed]
- Dockrell, H.M. Towards new TB vaccines: What are the challenges? Pathog. Dis. 2016, 74, ftw016. [Google Scholar] [CrossRef]
- Fritschi, N.; Curtis, N.; Ritz, N. Bacille Calmette Guérin (BCG) and new TB vaccines: Specific, cross-mycobacterial and off-target effects. Paediatr. Respir. Rev. 2020, 36, 57. [Google Scholar] [CrossRef]
- Nemes, E.; Geldenhuys, H.; Rozot, V.; Rutkowski, K.T.; Ratangee, F.; Bilek, N.; Mabwe, S.; Makhethe, L.; Erasmus, M.; Toefy, A.; et al. Prevention of M. tuberculosis Infection with H4:IC31 Vaccine or BCG Revaccination. N. Engl. J. Med. 2018, 379, 138–149. [Google Scholar] [CrossRef]
- Barreto, M.L.; Pereira, S.M.; Pilger, D.; Cruz, A.A.; Cunha, S.S.; Sant’Anna, C.; Ichihara, M.Y.; Genser, B.; Rodrigues, L.C. Evidence of an effect of BCG revaccination on incidence of tuberculosis in school-aged children in Brazil: Second report of the BCG-REVAC cluster-randomised trial. Vaccine 2011, 29, 4875–4877. [Google Scholar] [CrossRef]
- Roth, A.E.; Benn, C.S.; Ravn, H.; Rodrigues, A.; Lisse, I.M.; Yazdanbakhsh, M.; Whittle, H.; Aaby, P. Effect of revaccination with BCG in early childhood on mortality: Randomised trial in Guinea-Bissau. BMJ 2010, 340, c671. [Google Scholar] [CrossRef]
- Karonga Prevention Trial Group. Randomised controlled trial of single BCG, repeated BCG, or combined BCG and killed Mycobacterium leprae vaccine for prevention of leprosy and tuberculosis in Malawi. Karonga Prevention Trial Group. Lancet 1996, 348, 17–24. [Google Scholar] [CrossRef]
- Sharpe, S.; White, A.; Sarfas, C.; Sibley, L.; Gleeson, F.; McIntyre, A.; Basaraba, R.; Clark, S.; Hall, G.; Rayner, E.; et al. Alternative BCG delivery strategies improve protection against Mycobacterium tuberculosis in non-human primates: Protection associated with mycobacterial antigen-specific CD4 effector memory T-cell populations. Tuberculosis 2016, 101, 174–190. [Google Scholar] [CrossRef]
- Darrah, P.A.; Zeppa, J.J.; Maiello, P.; Hackney, J.A.; Wadsworth, M.H.; Hughes, T.K.; Pokkali, S.; Swanson, P.A.; Grant, N.L.; Rodgers, M.A.; et al. Prevention of tuberculosis in macaques after intravenous BCG immunization. Nature 2020, 577, 95–102. [Google Scholar] [CrossRef]
- Barclay, W.R.; Busey, W.M.; Dalgard, D.W.; Good, R.C.; Janicki, B.W.; Kasik, J.E.; Ribi, E.; Ulrich, C.E.; Wolinsky, E. Protection of monkeys against airborne tuberculosis by aerosol vaccination with bacillus Calmette-Guerin. Am. Rev. Respir. Dis. 1973, 107, 351–358. [Google Scholar] [CrossRef] [PubMed]
- Verreck, F.A.W.; Tchilian, E.Z.; Vervenne, R.A.W.; Sombroek, C.C.; Kondova, I.; Eissen, O.A.; Sommandas, V.; van der Werff, N.M.; Verschoor, E.; Braskamp, G.; et al. Variable BCG efficacy in rhesus populations: Pulmonary BCG provides protection where standard intra-dermal vaccination fails. Tuberculosis 2017, 104, 46–57. [Google Scholar] [CrossRef]
- Dijkman, K.; Vervenne, R.A.W.; Sombroek, C.C.; Boot, C.; Hofman, S.O.; van Meijgaarden, K.E.; Ottenhoff, T.H.M.; Kocken, C.H.M.; Haanstra, K.G.; Vierboom, M.P.M.; et al. Disparate Tuberculosis Disease Development in Macaque Species Is Associated With Innate Immunity. Front. Immunol. 2019, 10, 02479. [Google Scholar] [CrossRef] [PubMed]
- Chen, L.; Wang, J.; Zganiacz, A.; Xing, Z. Single Intranasal Mucosal Mycobacterium bovis BCG Vaccination Confers Improved Protection Compared to Subcutaneous Vaccination against Pulmonary Tuberculosis. Infect. Immun. 2004, 72, 238–246. [Google Scholar] [CrossRef] [PubMed]
- Giri, P.K.; Verma, I.; Khuller, G.K. Protective efficacy of intranasal vaccination with Mycobacterium bovis BCG against airway Mycobacterium tuberculosis challenge in mice. J. Infect. 2006, 53, 350–356. [Google Scholar] [CrossRef]
- Goonetilleke, N.P.; McShane, H.; Hannan, C.M.; Anderson, R.J.; Brookes, R.H.; Hill, A.V.S. Enhanced Immunogenicity and Protective Efficacy against Mycobacterium tuberculosis of Bacille Calmette-Guérin Vaccine Using Mucosal Administration and Boosting with a Recombinant Modified Vaccinia Virus Ankara. J. Immunol. 2003, 171, 1602–1609. [Google Scholar] [CrossRef]
- Gheorghiu, M. BCG-induced mucosal immune responses. Int. J. Immunopharmacol. 1994, 16, 435–444. [Google Scholar] [CrossRef]
- White, A.D.; Sarfas, C.; Sibley, L.S.; Gullick, J.; Clark, S.; Rayner, E.; Gleeson, F.; Català, M.; Nogueira, I.; Cardona, P.-J.; et al. Protective Efficacy of Inhaled BCG Vaccination against Ultra-Low Dose Aerosol M. tuberculosis Challenge in Rhesus Macaques. Pharmaceutics 2020, 12, 394. [Google Scholar] [CrossRef]
- Shen, Y.; Zhou, D.; Qiu, L.; Lai, X.; Simon, M.; Shen, L.; Kou, Z.; Wang, Q.; Jiang, L.; Estep, J.; et al. Adaptive immune response of Vγ2Vδ2 + T cells during mycobacterial infections. Science 2002, 295, 2255–2258. [Google Scholar] [CrossRef]
- Morgan, J.; Muskat, K.; Tippalagama, R.; Sette, A.; Burel, J.; Lindestam Arlehamn, C.S. Classical CD4 T cells as the cornerstone of antimycobacterial immunity. Immunol. Rev. 2021, 301, 10–29. [Google Scholar] [CrossRef] [PubMed]
- Lin, P.L.; Flynn, J.L. CD8 T cells and Mycobacterium tuberculosis infection. Semin. Immunopathol. 2015, 37, 239–249. [Google Scholar] [CrossRef] [PubMed]
- Barnes, P.F.; Grisso, C.L.; Abrams, J.S.; Band, H.; Rea, T.H.; Modlin, R.L. γδ T Lymphocytes in Human Tuberculosis. J. Infect. Dis. 1992, 165, 506–512. [Google Scholar] [CrossRef] [PubMed]
- Harper, G.J.; Morton, J.D. The respiratory retention of bacterial aerosols: Experiments with radioactive spores. J. Hyg. 1953, 51, 372–385. [Google Scholar] [CrossRef]
- Sharpe, S.A.; McShane, H.; Dennis, M.J.; Basaraba, R.J.; Gleeson, F.; Hall, G.; McIntyre, A.; Gooch, K.; Clark, S.; Beveridge, N.E.R.; et al. Establishment of an Aerosol Challenge Model of Tuberculosis in Rhesus Macaques and an Evaluation of Endpoints for Vaccine Testing. Clin. Vaccine Immunol. 2010, 17, 1170–1182. [Google Scholar] [CrossRef]
- Clark, S.O.O.; Hall, Y.; Kelly, D.L.F.L.F.; Hatch, G.J.J.; Williams, A. Survival of Mycobacterium tuberculosis during experimental aerosolization and implications for aerosol challenge models. J. Appl. Microbiol. 2011, 111, 350–359. [Google Scholar] [CrossRef]
- Sharpe, S.A.; Eschelbach, E.; Basaraba, R.J.; Gleeson, F.; Hall, G.A.; McIntyre, A.; Williams, A.; Kraft, S.L.; Clark, S.; Gooch, K.; et al. Determination of lesion volume by MRI and stereology in a macaque model of tuberculosis. Tuberculosis 2009, 89, 405–416. [Google Scholar] [CrossRef]
- Salguero, F.J.; White, A.D.; Slack, G.S.; Fotheringham, S.A.; Bewley, K.R.; Gooch, K.E.; Longet, S.; Humphries, H.E.; Watson, R.J.; Hunter, L.; et al. Comparison of rhesus and cynomolgus macaques as an infection model for COVID-19. Nat. Commun. 2021, 12, 1260. [Google Scholar] [CrossRef]
- Olbrich, L.; Stockdale, L.; Basu Roy, R.; Song, R.; Cicin-Sain, L.; Whittaker, E.; Prendergast, A.J.; Fletcher, H.; Seddon, J.A. Understanding the interaction between cytomegalovirus and tuberculosis in children: The way forward. PLoS Pathog. 2021, 17, e1010061. [Google Scholar] [CrossRef]
- Dieli, F.; Poccia, F.; Lipp, M.; Sireci, G.; Caccamo, N.; Di Sano, C.; Salerno, A. Differentiation of effector/memory Vδ2 T cells and migratory routes in lymph nodes or inflammatory sites. J. Exp. Med. 2003, 198, 391–397. [Google Scholar] [CrossRef]
- Fenn, J. An In Vitro Study Investigating the Effect of Bacillus Calmette-Guerin on V62+ T-Cell Responses to Tumour Cells; St. George’s University of London: London, UK, 2019. [Google Scholar]
- Cho, T.; Khatchadourian, C.; Nguyen, H.; Dara, Y.; Jung, S.; Venketaraman, V. A review of the BCG vaccine and other approaches toward tuberculosis eradication. Hum. Vaccines Immunother. 2021, 17, 2454–2470. [Google Scholar] [CrossRef]
- de Martino, M.; Lodi, L.; Galli, L.; Chiappini, E. Immune Response to Mycobacterium tuberculosis: A Narrative Review. Front. Pediatr. 2019, 7, 350. [Google Scholar] [CrossRef] [PubMed]
- Chandra, P.; Grigsby, S.J.; Philips, J.A. Immune evasion and provocation by Mycobacterium tuberculosis. Nat. Rev. Microbiol. 2022, 20, 750–766. [Google Scholar] [CrossRef] [PubMed]
- Qu, M.; Zhou, X.; Li, H. BCG vaccination strategies against tuberculosis: Updates and perspectives. Hum. Vaccines Immunother. 2021, 17, 5284–5295. [Google Scholar] [CrossRef] [PubMed]
- Morrison, A.L.; Sharpe, S.; White, A.D.; Bodman-Smith, M. Cheap and Commonplace: Making the Case for BCG and γδ T Cells in COVID-19. Front. Immunol. 2021, 12, 743924. [Google Scholar] [CrossRef]
- Puan, K.-J.; Jin, C.; Wang, H.; Sarikonda, G.; Raker, A.M.; Lee, H.K.; Samuelson, M.I.; Märker-Hermann, E.; Pasa-Tolic, L.; Nieves, E.; et al. Preferential recognition of a microbial metabolite by human Vgamma2Vdelta2 T cells. Int. Immunol. 2007, 19, 657–673. [Google Scholar] [CrossRef]
- Chen, Z.W. Multifunctional immune responses of HMBPP-specific Vγ2Vδ2 T cells in M. tuberculosis and other infections. Cell. Mol. Immunol. 2013, 10, 58–64. [Google Scholar] [CrossRef]
- Dieli, F.; Troye-Blomberg, M.; Ivanyi, J.; Fournié, J.J.; Bonneville, M.; Peyrat, M.A.; Sireci, G.; Salerno, A. Vgamma9/Vdelta2 T lymphocytes reduce the viability of intracellular Mycobacterium tuberculosis. Eur. J. Immunol. 2000, 30, 1512–1519. [Google Scholar] [CrossRef]
- Caron, J.; Ridgley, L.A.; Bodman-Smith, M. How to Train Your Dragon: Harnessing Gamma Delta T Cells Antiviral Functions and Trained Immunity in a Pandemic Era. Front. Immunol. 2021, 12, 983. [Google Scholar] [CrossRef]
- Van Acker, H.H.; Anguille, S.; Van Tendeloo, V.F.; Lion, E. Empowering gamma delta T cells with antitumor immunity by dendritic cell-based immunotherapy. Oncoimmunology 2015, 4, e1021538. [Google Scholar] [CrossRef]
- Chen, C.Y.; Huang, D.; Wang, R.C.; Shen, L.; Zeng, G.; Yao, S.; Shen, Y.; Halliday, L.; Fortman, J.; McAllister, M.; et al. A critical role for CD8 T cells in a nonhuman primate model of tuberculosis. PLoS Pathog. 2009, 5, e1000392. [Google Scholar] [CrossRef]
- Gioia, C.; Agrati, C.; Casetti, R.; Cairo, C.; Borsellino, G.; Battistini, L.; Mancino, G.; Goletti, D.; Colizzi, V.; Pucillo, L.P.; et al. Lack of CD27-CD45RA-V gamma 9V delta 2+ T cell effectors in immunocompromised hosts and during active pulmonary tuberculosis. J. Immunol. 2002, 168, 1484–1489. [Google Scholar] [CrossRef]
- Vogelzang, A.; Perdomo, C.; Zedler, U.; Kuhlmann, S.; Hurwitz, R.; Gengenbacher, M.; Kaufmann, S.H.E. Central Memory CD4+ T Cells Are Responsible for the Recombinant Bacillus Calmette-Guérin ΔureC::hly Vaccine’s Superior Protection against Tuberculosis. J. Infect. Dis. 2014, 210, 1928–1937. [Google Scholar] [CrossRef]
- Duong, V.T.; Skwarczynski, M.; Toth, I. Towards the development of subunit vaccines against tuberculosis: The key role of adjuvant. Tuberculosis 2023, 139, 102307. [Google Scholar] [CrossRef]
- Lanzavecchia, A.; Sallusto, F. Understanding the generation and function of memory T cell subsets. Curr. Opin. Immunol. 2005, 17, 326–332. [Google Scholar] [CrossRef] [PubMed]
- Lau, C.M.; Sun, J.C. The widening spectrum of immunological memory. Curr. Opin. Immunol. 2018, 54, 42–49. [Google Scholar] [CrossRef]
- Khairallah, C.; Chu, T.H.; Sheridan, B.S. Tissue Adaptations of Memory and Tissue-Resident Gamma Delta T Cells. Front. Immunol. 2018, 9, 02636. [Google Scholar] [CrossRef]
- Zheng, M.Z.M.; Wakim, L.M. Tissue resident memory T cells in the respiratory tract. Mucosal Immunol. 2022, 15, 379–388. [Google Scholar] [CrossRef] [PubMed]
- Chen, Z.; Xie, X.; Jiang, N.; Li, J.; Shen, L.; Zhang, Y. CCR5 signaling promotes lipopolysaccharide-induced macrophage recruitment and alveolar developmental arrest. Cell Death Dis. 2021, 12, 184. [Google Scholar] [CrossRef]
- Galkina, E.; Thatte, J.; Dabak, V.; Williams, M.B.; Ley, K.; Braciale, T.J. Preferential migration of effector CD8+ T cells into the interstitium of the normal lung. J. Clin. Investig. 2005, 115, 3473–3483. [Google Scholar] [CrossRef] [PubMed]
- Darrah, P.A.; Patel, D.T.; De Luca, P.M.; Lindsay, R.W.B.; Davey, D.F.; Flynn, B.J.; Hoff, S.T.; Andersen, P.; Reed, S.G.; Morris, S.L.; et al. Multifunctional TH1 cells define a correlate of vaccine-mediated protection against Leishmania major. Nat. Med. 2007, 13, 843–850. [Google Scholar] [CrossRef]
- Caccamo, N.; Guggino, G.; Joosten, S.A.; Gelsomino, G.; Di Carlo, P.; Titone, L.; Galati, D.; Bocchino, M.; Matarese, A.; Salerno, A.; et al. Multifunctional CD4(+) T cells correlate with active Mycobacterium tuberculosis infection. Eur. J. Immunol. 2010, 40, 2211–2220. [Google Scholar] [CrossRef]
- Gela, A.; Murphy, M.; Hadley, K.; Hanekom, W.A.; Henry Boom, W.; Johnson, J.L.; Hoft, D.F.; Joosten, S.A.; Ottenhoff, T.H.; Suliman, S.; et al. Effects of BCG vaccination on donor unrestricted T cells in humans. bioRxiv 2021. bioRxi:2021.04.29.441927. [Google Scholar] [CrossRef]
- Zufferey, C.; Germano, S.; Dutta, B.; Ritz, N.; Curtis, N. The contribution of non-conventional T cells and NK cells in the mycobacterial-specific IFNγ response in Bacille Calmette-Guérin (BCG)-immunized infants. PLoS ONE 2013, 8, e77334. [Google Scholar] [CrossRef]
- Mazzola, T.N.; Da Silva, M.T.N.; Moreno, Y.M.F.; Lima, S.C.B.S.; Carniel, E.F.; Morcillo, A.M.; Antonio, M.A.R.G.M.; Zanolli, M.L.; Netto, A.A.; Blotta, M.H.; et al. Robust gammadelta+ T cell expansion in infants immunized at birth with BCG vaccine. Vaccine 2007, 25, 6313–6320. [Google Scholar] [CrossRef]
- Taştan, Y.; Arvas, A.; Demir, G.; Alikaşifoğlu, M.; Gür, E.; Kiray, E. Influence of Bacillus Calmette-Guèrin vaccination at birth and 2 months old age on the peripheral blood T-cell subpopulations [gamma/delta and alpha-beta T cell]. Pediatr. allergy Immunol. Off. Publ. Eur. Soc. Pediatr. Allergy Immunol. 2005, 16, 624–629. [Google Scholar] [CrossRef]
- Umemura, M.; Yahagi, A.; Hamada, S.; Begum, M.D.; Watanabe, H.; Kawakami, K.; Suda, T.; Sudo, K.; Nakae, S.; Iwakura, Y.; et al. IL-17-mediated regulation of innate and acquired immune response against pulmonary Mycobacterium bovis bacille Calmette-Guerin infection. J. Immunol. 2007, 178, 3786–3796. [Google Scholar] [CrossRef] [PubMed]
- Okamoto Yoshida, Y.; Umemura, M.; Yahagi, A.; O’Brien, R.L.; Ikuta, K.; Kishihara, K.; Hara, H.; Nakae, S.; Iwakura, Y.; Matsuzaki, G. Essential role of IL-17A in the formation of a mycobacterial infection-induced granuloma in the lung. J. Immunol. 2010, 184, 4414–4422. [Google Scholar] [CrossRef] [PubMed]
- Zhao, Y.; Niu, C.; Cui, J. Gamma-delta (γδ) T Cells: Friend or Foe in Cancer Development. J. Transl. Med. 2018, 16, 3. [Google Scholar] [CrossRef]
- Torrado, E.; Cooper, A.M. IL-17 and Th17 cells in tuberculosis. Cytokine Growth Factor Rev. 2010, 21, 455–462. [Google Scholar] [CrossRef]
- Sparrow, E.L.; Fowler, D.W.; Fenn, J.; Caron, J.; Copier, J.; Dalgleish, A.G.; Bodman-Smith, M.D. The cytotoxic molecule granulysin is capable of inducing either chemotaxis or fugetaxis in dendritic cells depending on maturation: A role for Vδ2+ γδ T cells in the modulation of immune response to tumour? Immunology 2020, 161, 245–258. [Google Scholar] [CrossRef]
- Glynn, J.R.; Dube, A.; Fielding, K.; Crampin, A.C.; Kanjala, C.; Fine, P.E.M. The effect of BCG revaccination on all-cause mortality beyond infancy: 30-year follow-up of a population-based, double-blind, randomised placebo-controlled trial in Malawi. Lancet Infect. Dis. 2021, 21, 1590–1597. [Google Scholar] [CrossRef] [PubMed]
- Cha, S.B.; Kim, W.S.; Kim, J.-S.; Kim, H.; Kwon, K.W.; Han, S.J.; Eum, S.-Y.; Cho, S.-N.; Shin, S.J. Repeated Aerosolized-Boosting with Gamma-Irradiated Mycobacterium bovis BCG Confers Improved Pulmonary Protection against the Hypervirulent Mycobacterium tuberculosis Strain HN878 in Mice. PLoS ONE 2015, 10, e0141577. [Google Scholar] [CrossRef] [PubMed]
- White, A.D.; Sibley, L.; Sarfas, C.; Morrison, A.L.; Bewley, K.; Churchward, C.; Fotheringham, S.; Gkolfinos, K.; Gooch, K.; Handley, A.; et al. Influence of Aerosol Delivered BCG Vaccination on Immunological and Disease Parameters following SARS-CoV-2 Challenge in Rhesus Macaques. Front. Immunol. 2022, 12, 801799. [Google Scholar] [CrossRef] [PubMed]
- White, A.D.; Sarfas, C.; West, K.; Sibley, L.S.; Wareham, A.S.; Clark, S.; Dennis, M.J.; Williams, A.; Marsh, P.D.; Sharpe, S.A. Evaluation of the Immunogenicity of Mycobacterium bovis BCG Delivered by Aerosol to the Lungs of Macaques. Clin. Vaccine Immunol. 2015, 22, 992–1003. [Google Scholar] [CrossRef] [PubMed]
- Investigating Immune Responses to Aerosol BCG Challenge in Healthy UK Adults—ClinicalTrials.gov. Available online: https://clinicaltrials.gov/ct2/show/NCT03912207 (accessed on 3 October 2023).
- Aerosol BCG Challenge Trial in Healthy UK Adults—ClinicalTrials.gov. Available online: https://clinicaltrials.gov/ct2/show/NCT02709278 (accessed on 4 October 2023).
- Waldrep, J.C.; Dhand, R. Advanced nebulizer designs employing vibrating mesh/aperture plate technologies for aerosol generation. Curr. Drug Deliv. 2008, 5, 114–119. [Google Scholar] [CrossRef] [PubMed]
- Sibley, L.; Sarfas, C.; Morrison, A.L.; Williams, J.; Gkolfinos, K.; Mabbutt, A.; Eckworth, W.; Lawrence, S.; Dennis, M.; White, A.; et al. Pre-print: Immune cell population dynamics following neonatal BCG vaccination and aerosol BCG revaccination in rhesus macaques. Res. Sq. 2023. [Google Scholar] [CrossRef]


Disclaimer/Publisher’s Note: The statements, opinions and data contained in all publications are solely those of the individual author(s) and contributor(s) and not of MDPI and/or the editor(s). MDPI and/or the editor(s) disclaim responsibility for any injury to people or property resulting from any ideas, methods, instructions or products referred to in the content. |
© 2023 by the authors. Licensee MDPI, Basel, Switzerland. This article is an open access article distributed under the terms and conditions of the Creative Commons Attribution (CC BY) license (https://creativecommons.org/licenses/by/4.0/).
Share and Cite
Morrison, A.L.; Sarfas, C.; Sibley, L.; Williams, J.; Mabbutt, A.; Dennis, M.J.; Lawrence, S.; White, A.D.; Bodman-Smith, M.; Sharpe, S.A. IV BCG Vaccination and Aerosol BCG Revaccination Induce Mycobacteria-Responsive γδ T Cells Associated with Protective Efficacy against M. tb Challenge. Vaccines 2023, 11, 1604. https://doi.org/10.3390/vaccines11101604
Morrison AL, Sarfas C, Sibley L, Williams J, Mabbutt A, Dennis MJ, Lawrence S, White AD, Bodman-Smith M, Sharpe SA. IV BCG Vaccination and Aerosol BCG Revaccination Induce Mycobacteria-Responsive γδ T Cells Associated with Protective Efficacy against M. tb Challenge. Vaccines. 2023; 11(10):1604. https://doi.org/10.3390/vaccines11101604
Chicago/Turabian StyleMorrison, Alexandra L., Charlotte Sarfas, Laura Sibley, Jessica Williams, Adam Mabbutt, Mike J. Dennis, Steve Lawrence, Andrew D. White, Mark Bodman-Smith, and Sally A. Sharpe. 2023. "IV BCG Vaccination and Aerosol BCG Revaccination Induce Mycobacteria-Responsive γδ T Cells Associated with Protective Efficacy against M. tb Challenge" Vaccines 11, no. 10: 1604. https://doi.org/10.3390/vaccines11101604
APA StyleMorrison, A. L., Sarfas, C., Sibley, L., Williams, J., Mabbutt, A., Dennis, M. J., Lawrence, S., White, A. D., Bodman-Smith, M., & Sharpe, S. A. (2023). IV BCG Vaccination and Aerosol BCG Revaccination Induce Mycobacteria-Responsive γδ T Cells Associated with Protective Efficacy against M. tb Challenge. Vaccines, 11(10), 1604. https://doi.org/10.3390/vaccines11101604