
A Mathematical Model to Study the Potential Hepatitis B Virus Infections and Effects of Vaccination Strategies in China

 , ,
, ,
Abstract
:1. Introduction
2. Methods
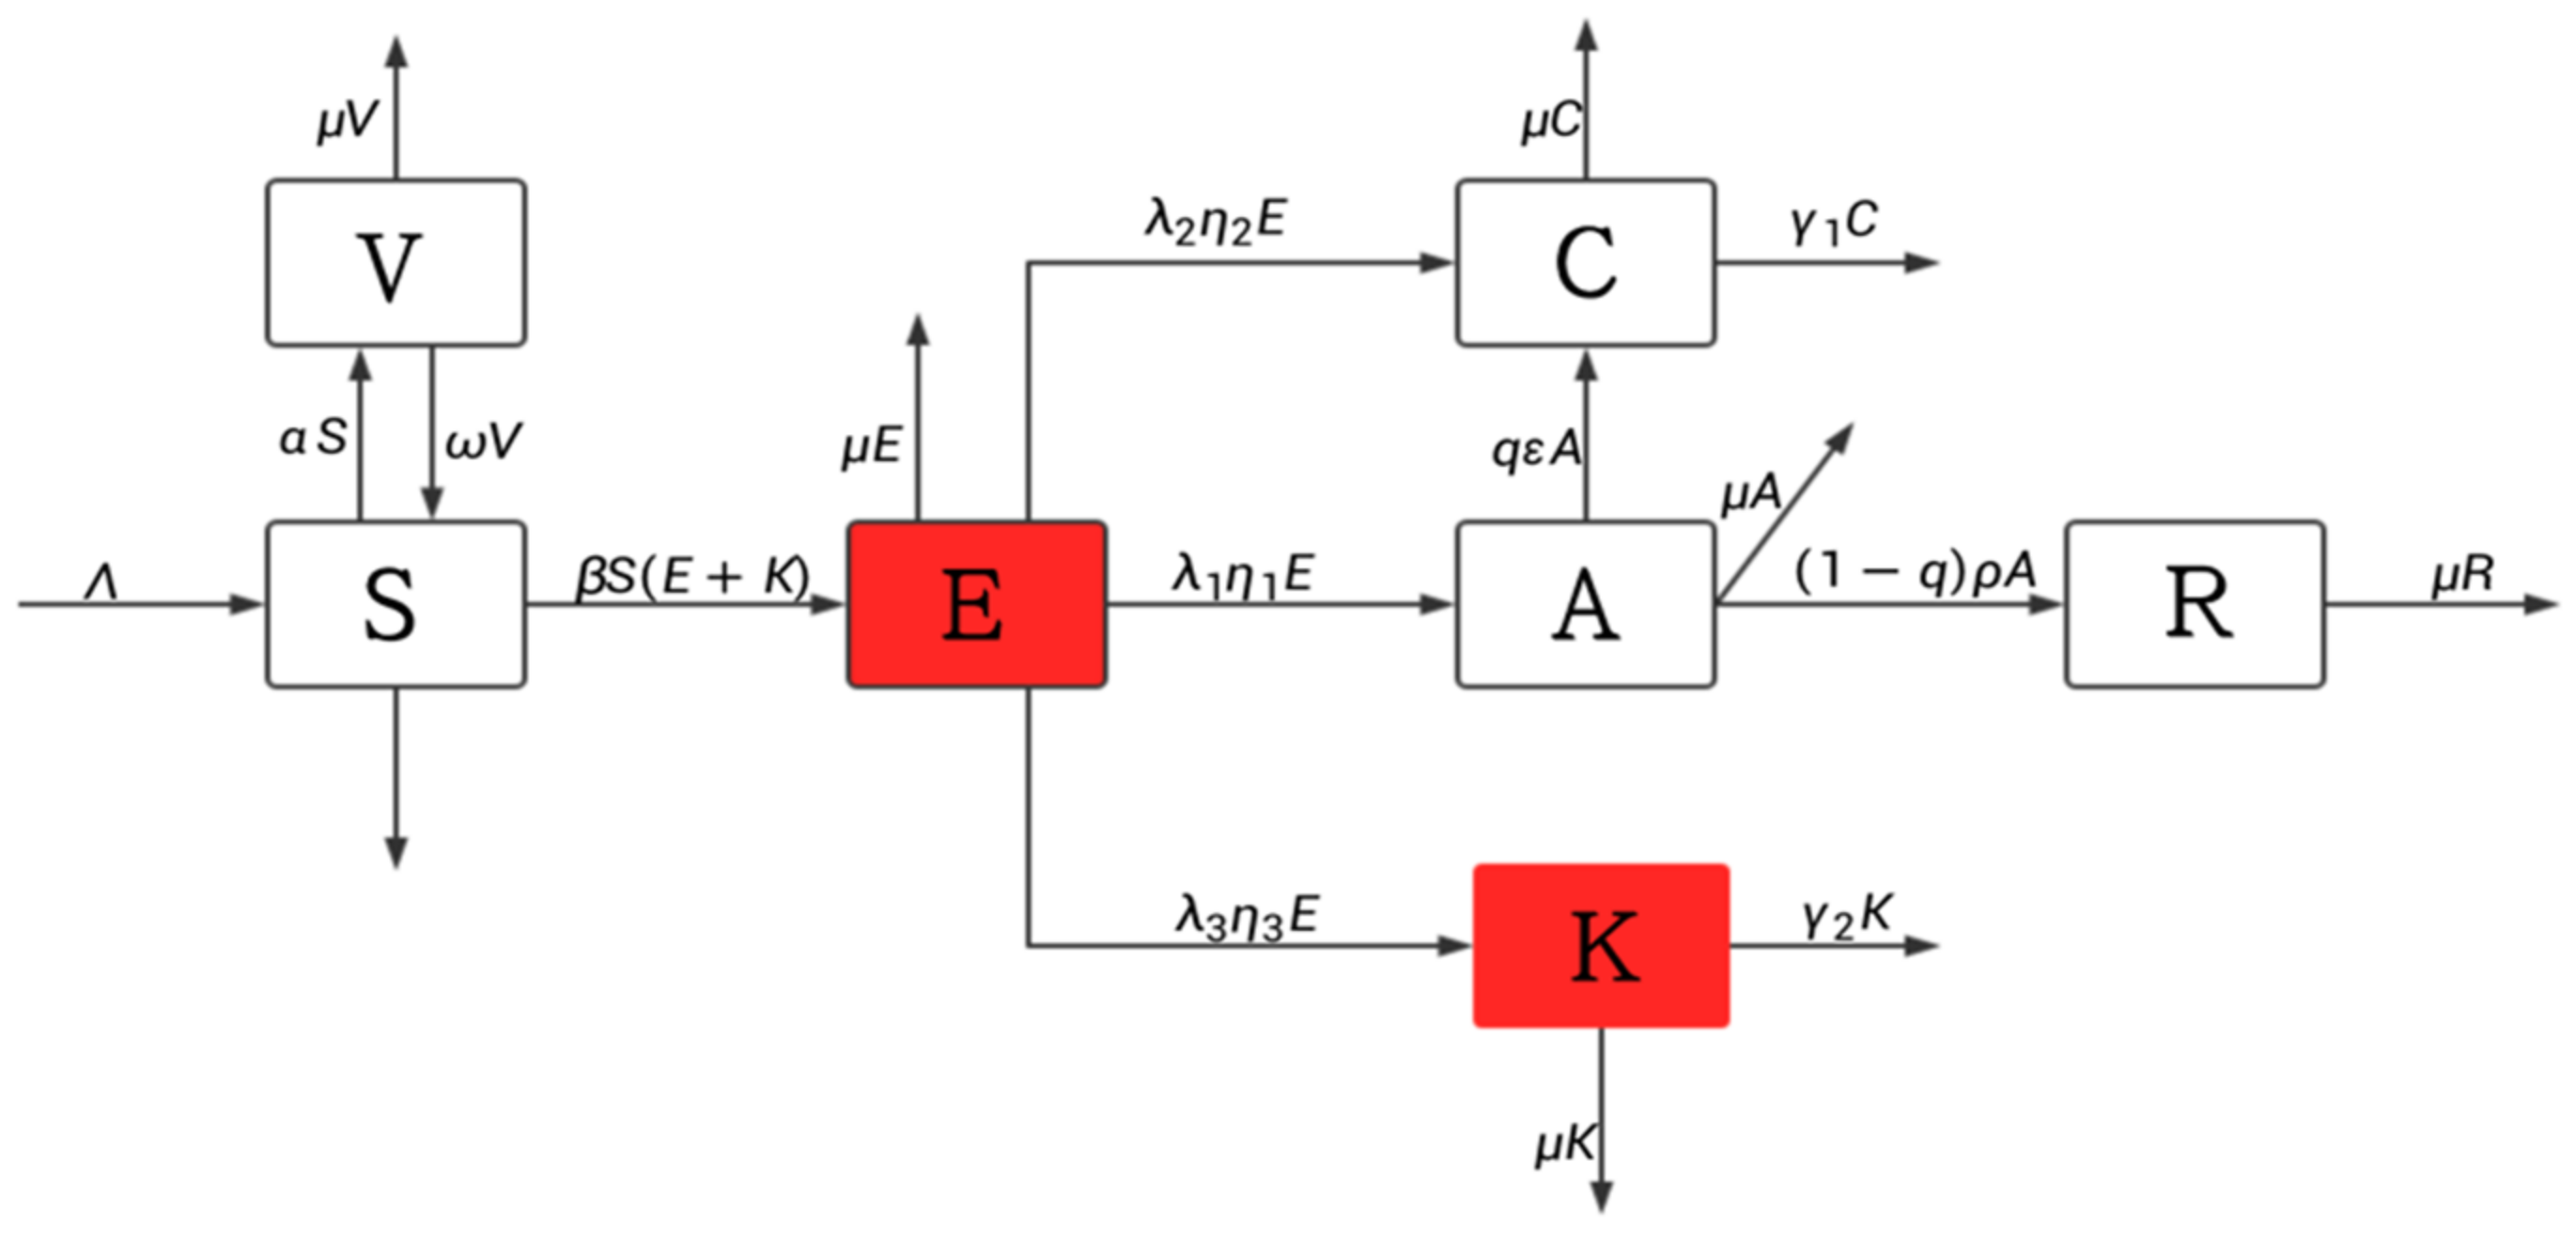
2.1. Model Building
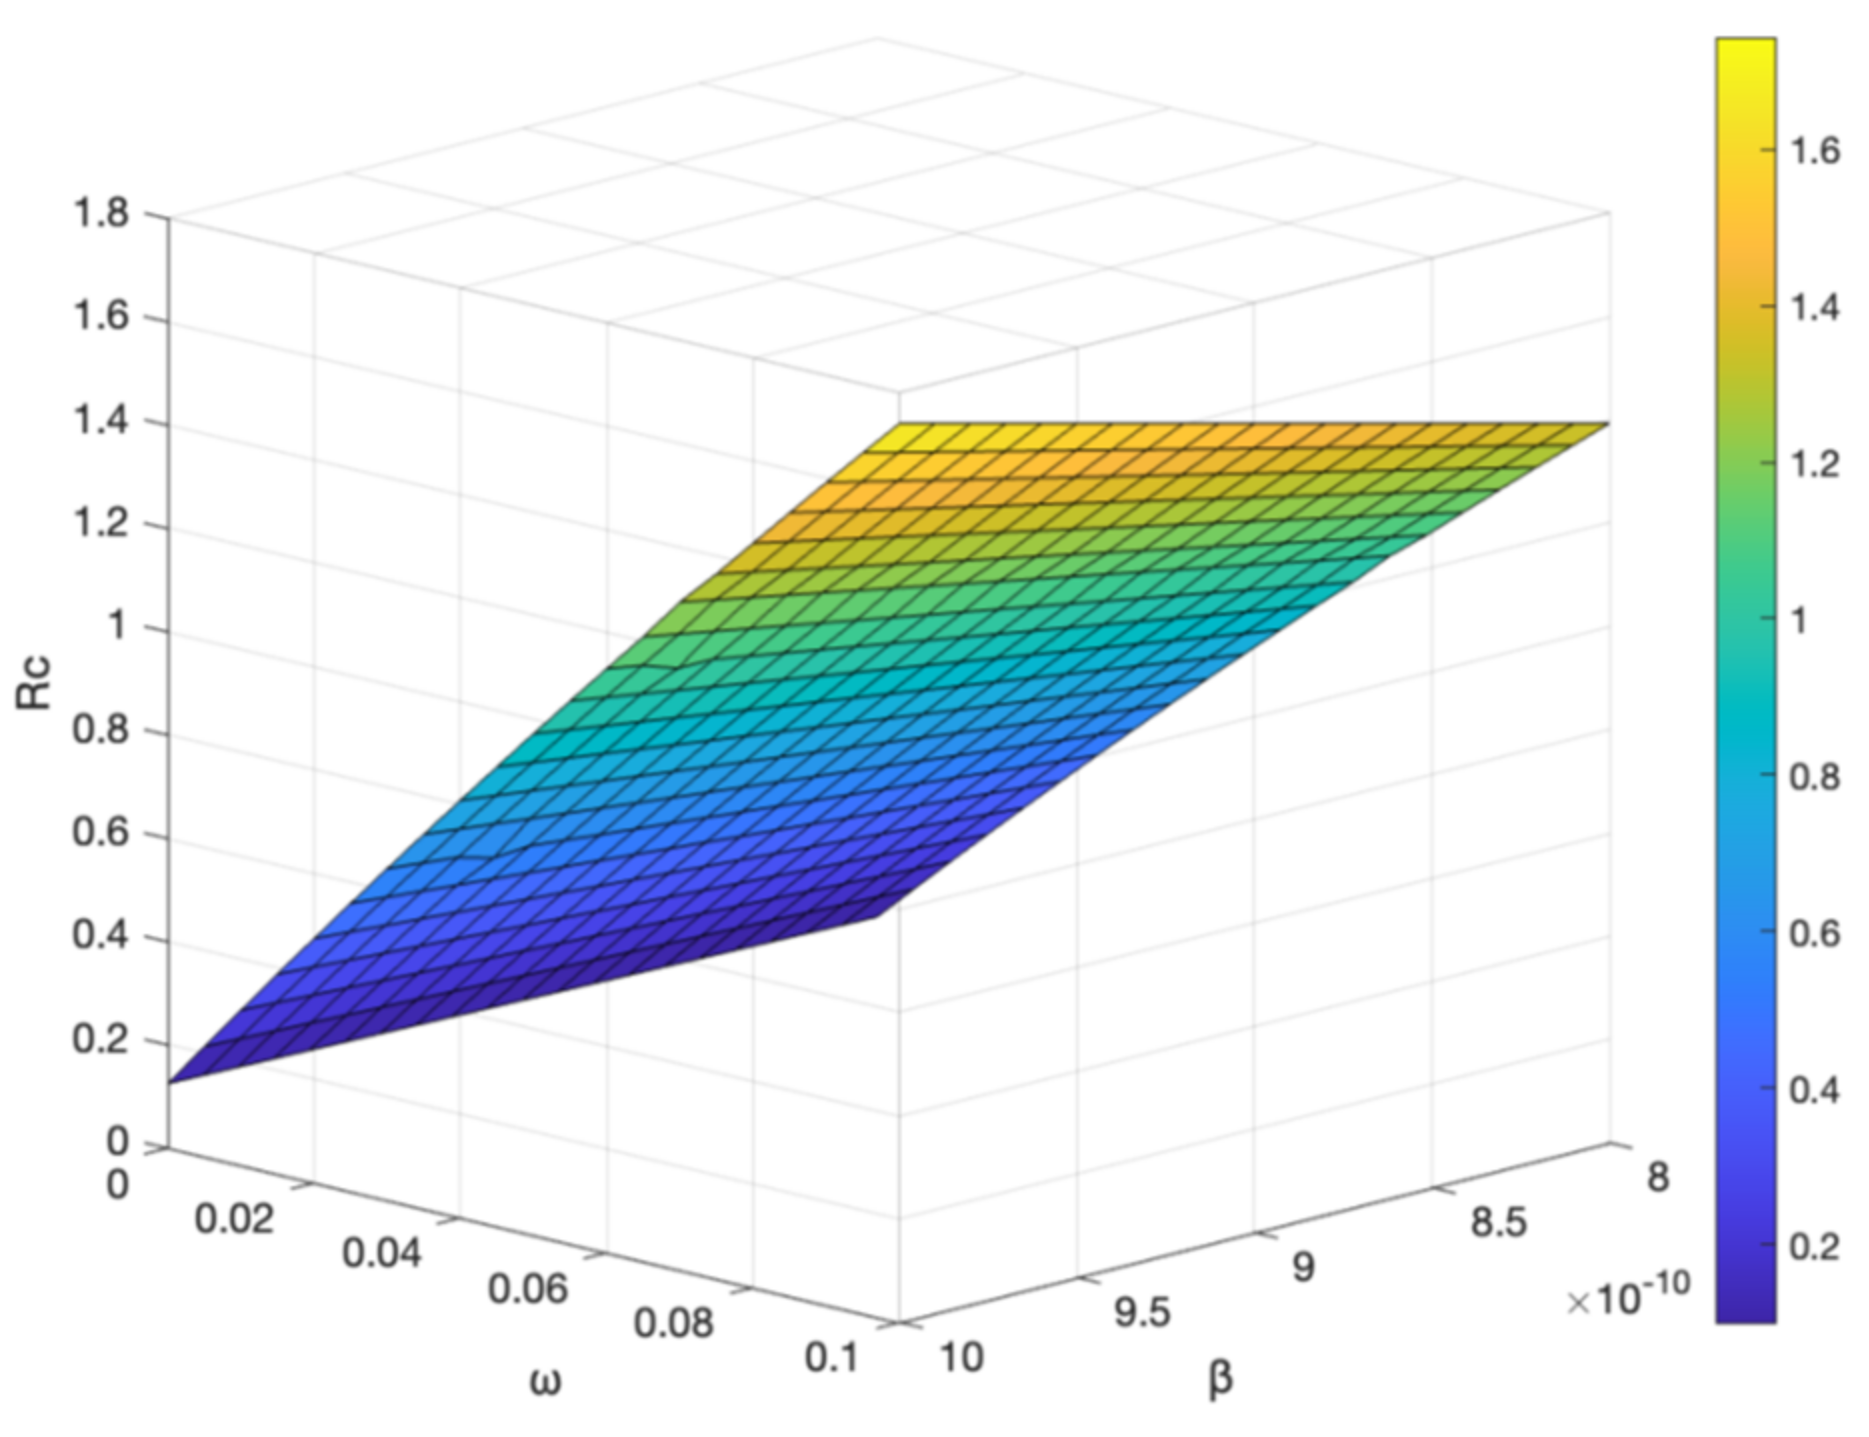
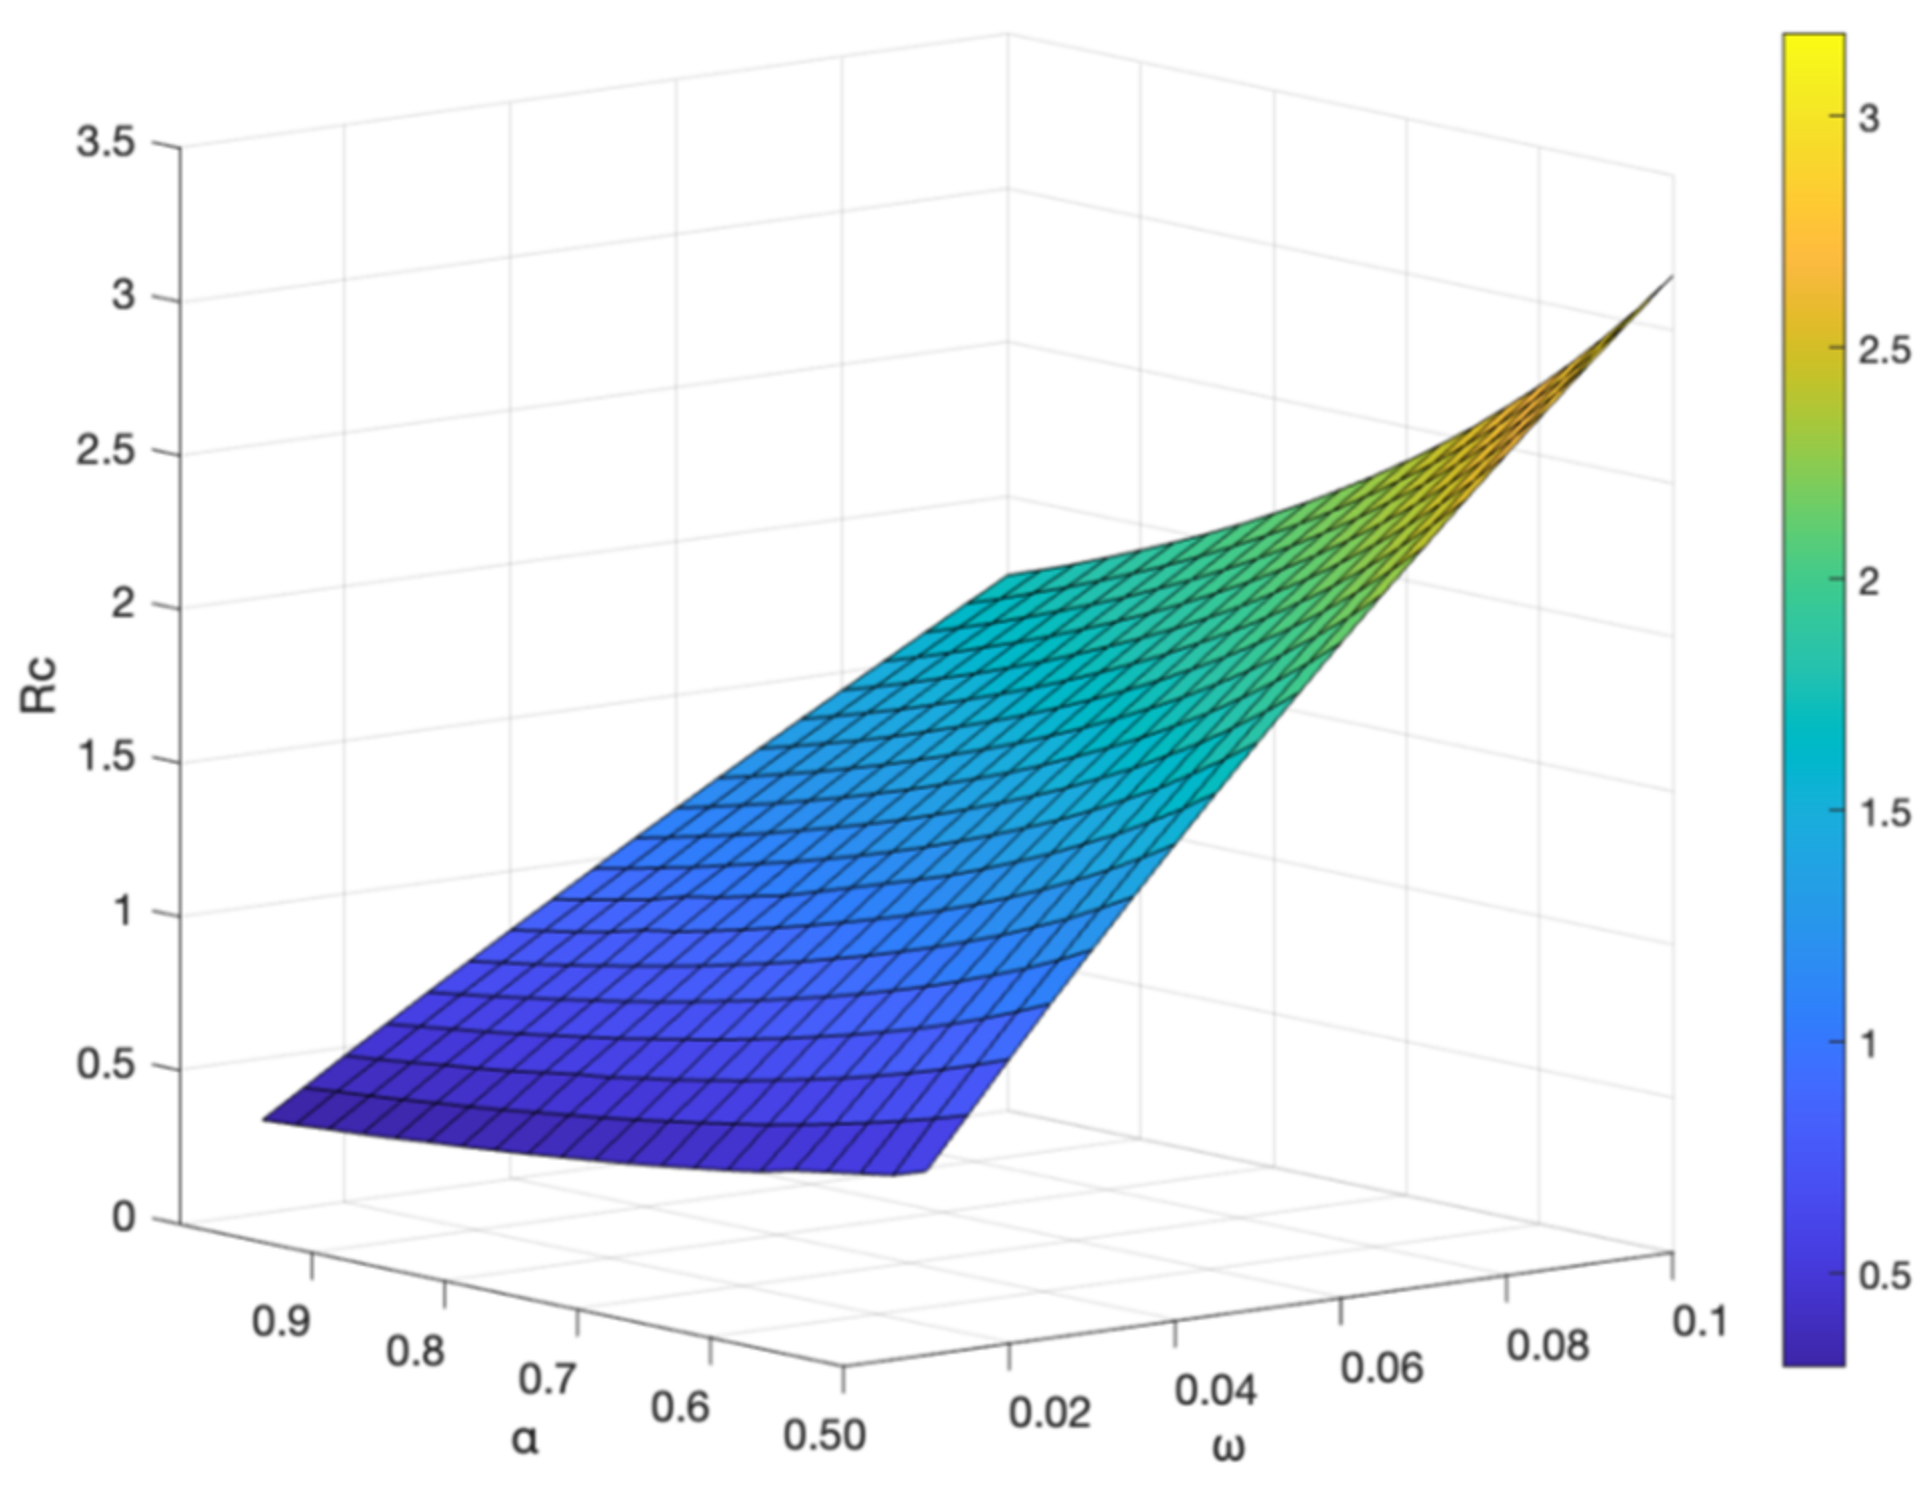
2.2. Control Reproduction Number
2.3. Disease-Free Equilibrium Point and Its Stability
2.4. Endemic Equilibrium Point and Its Stability
3. Results
3.1. Parameter Values and Sources
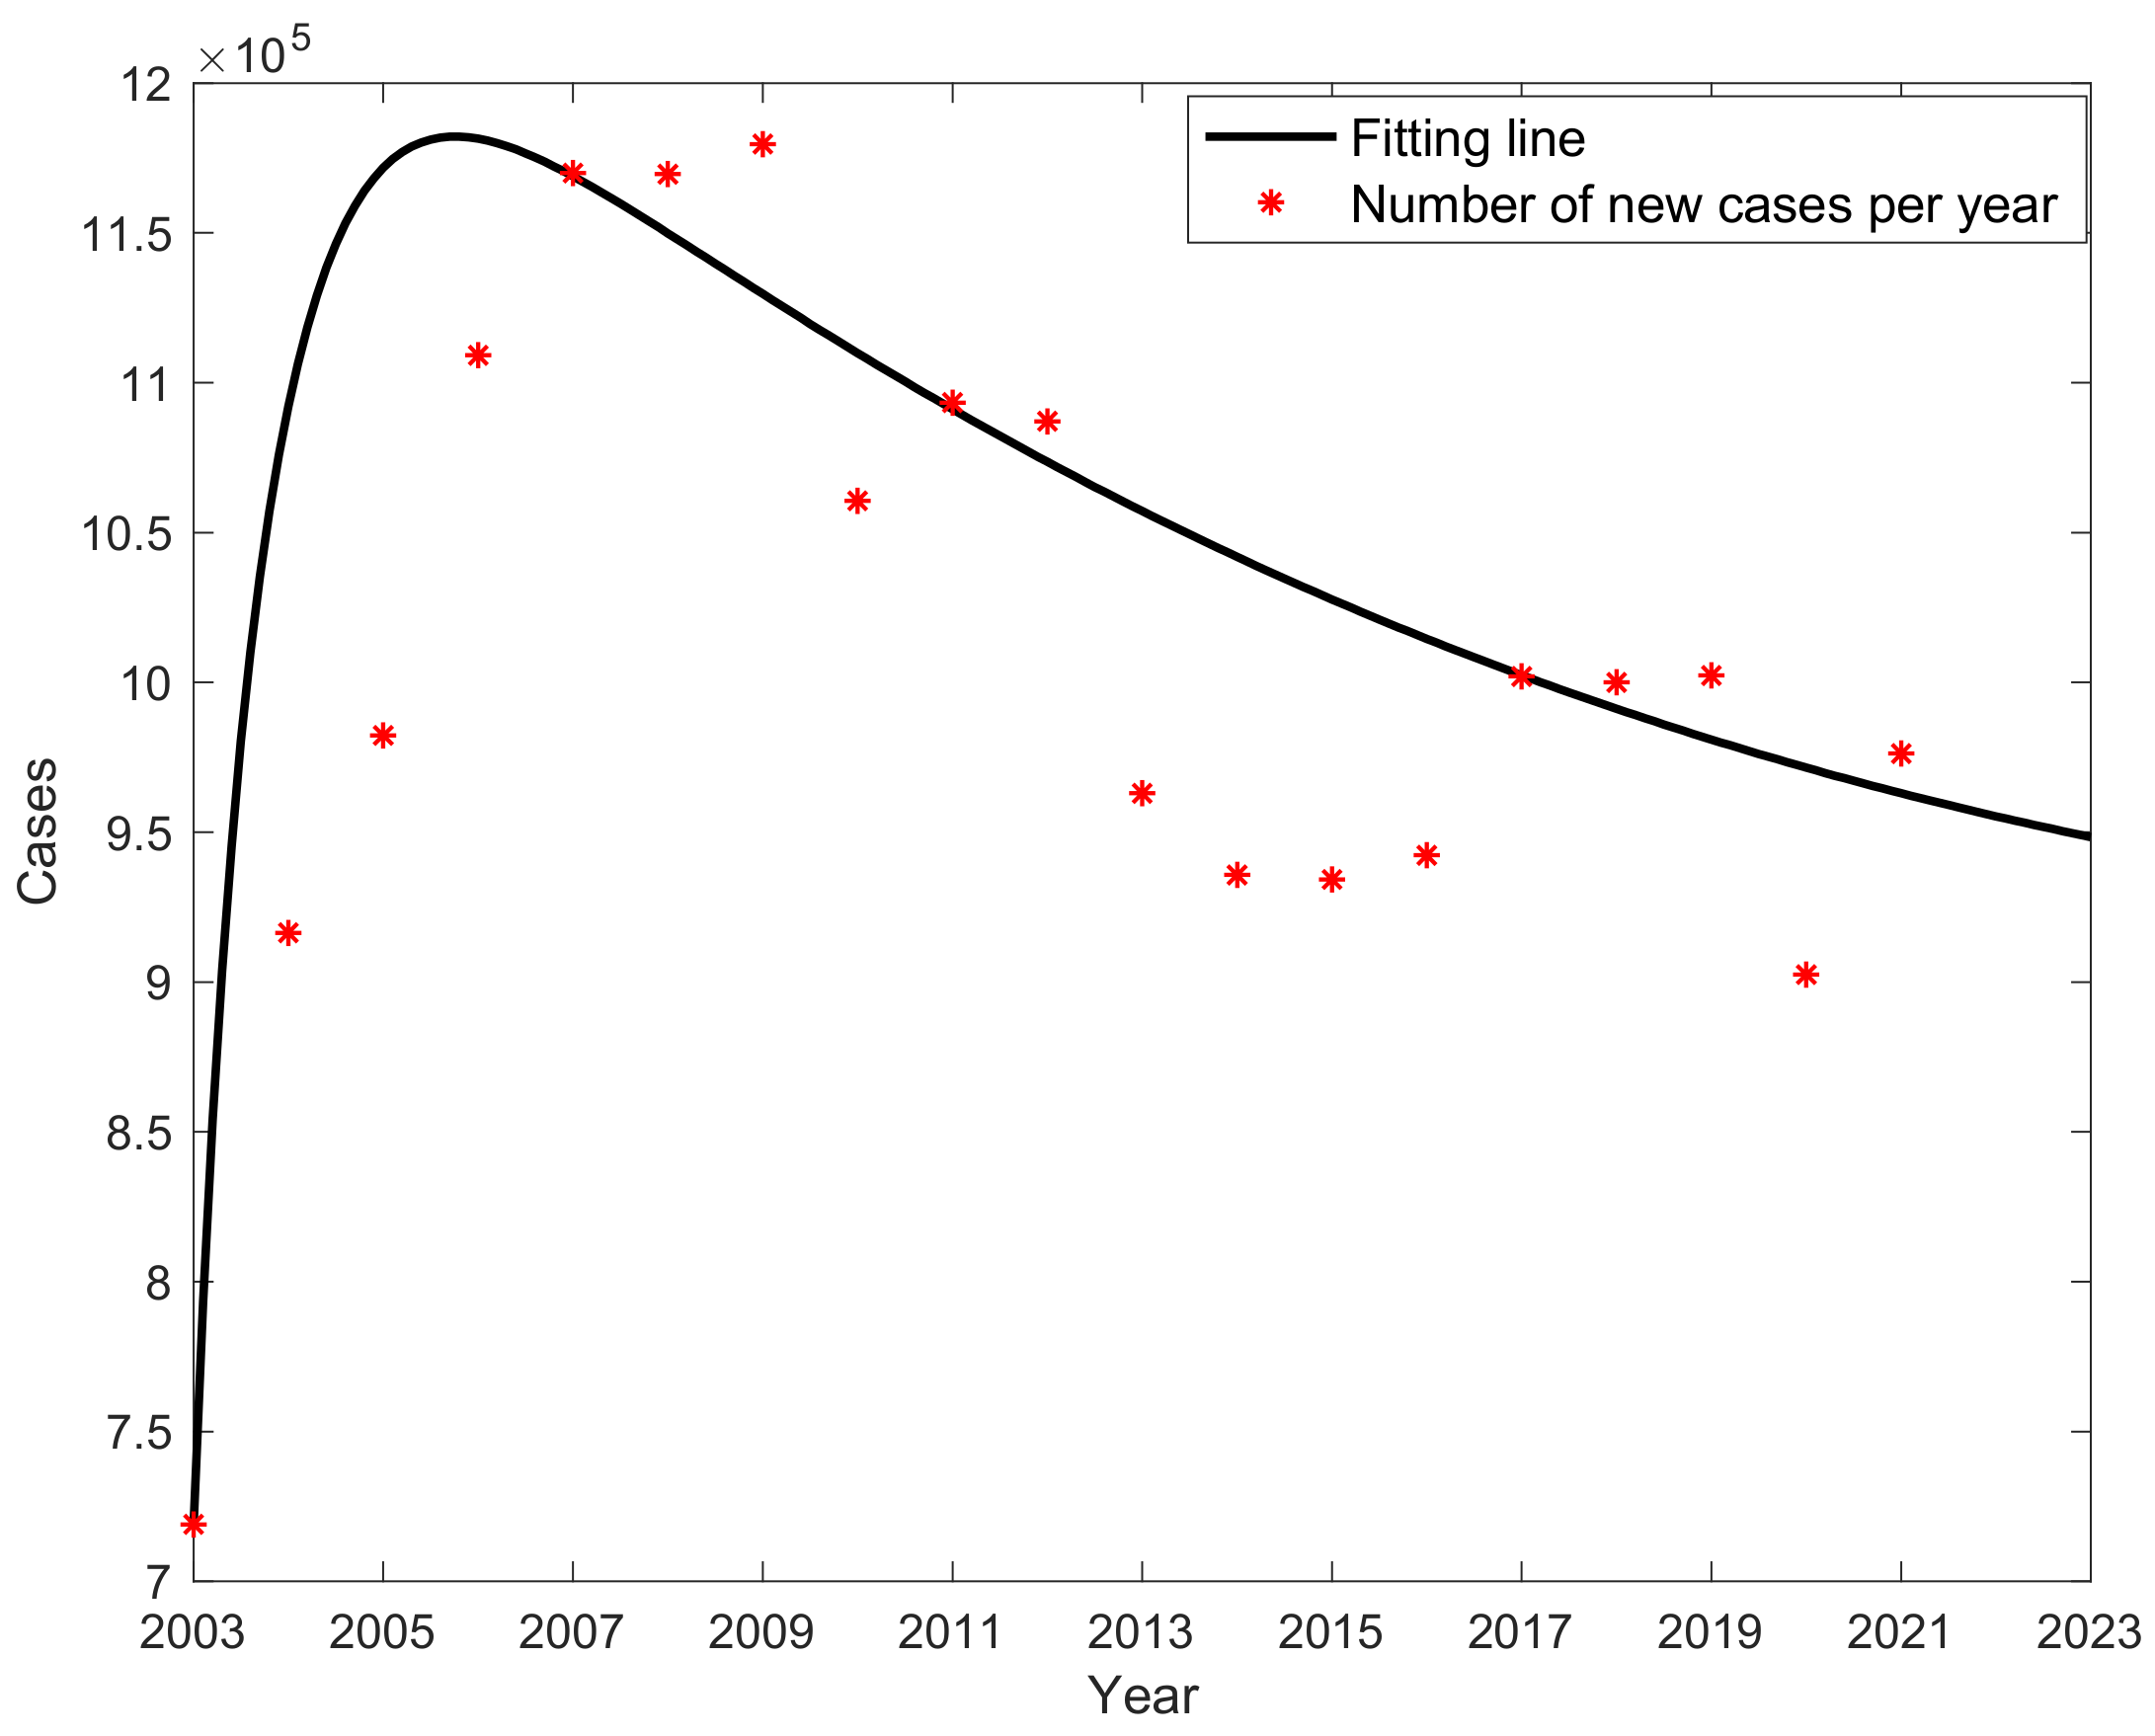
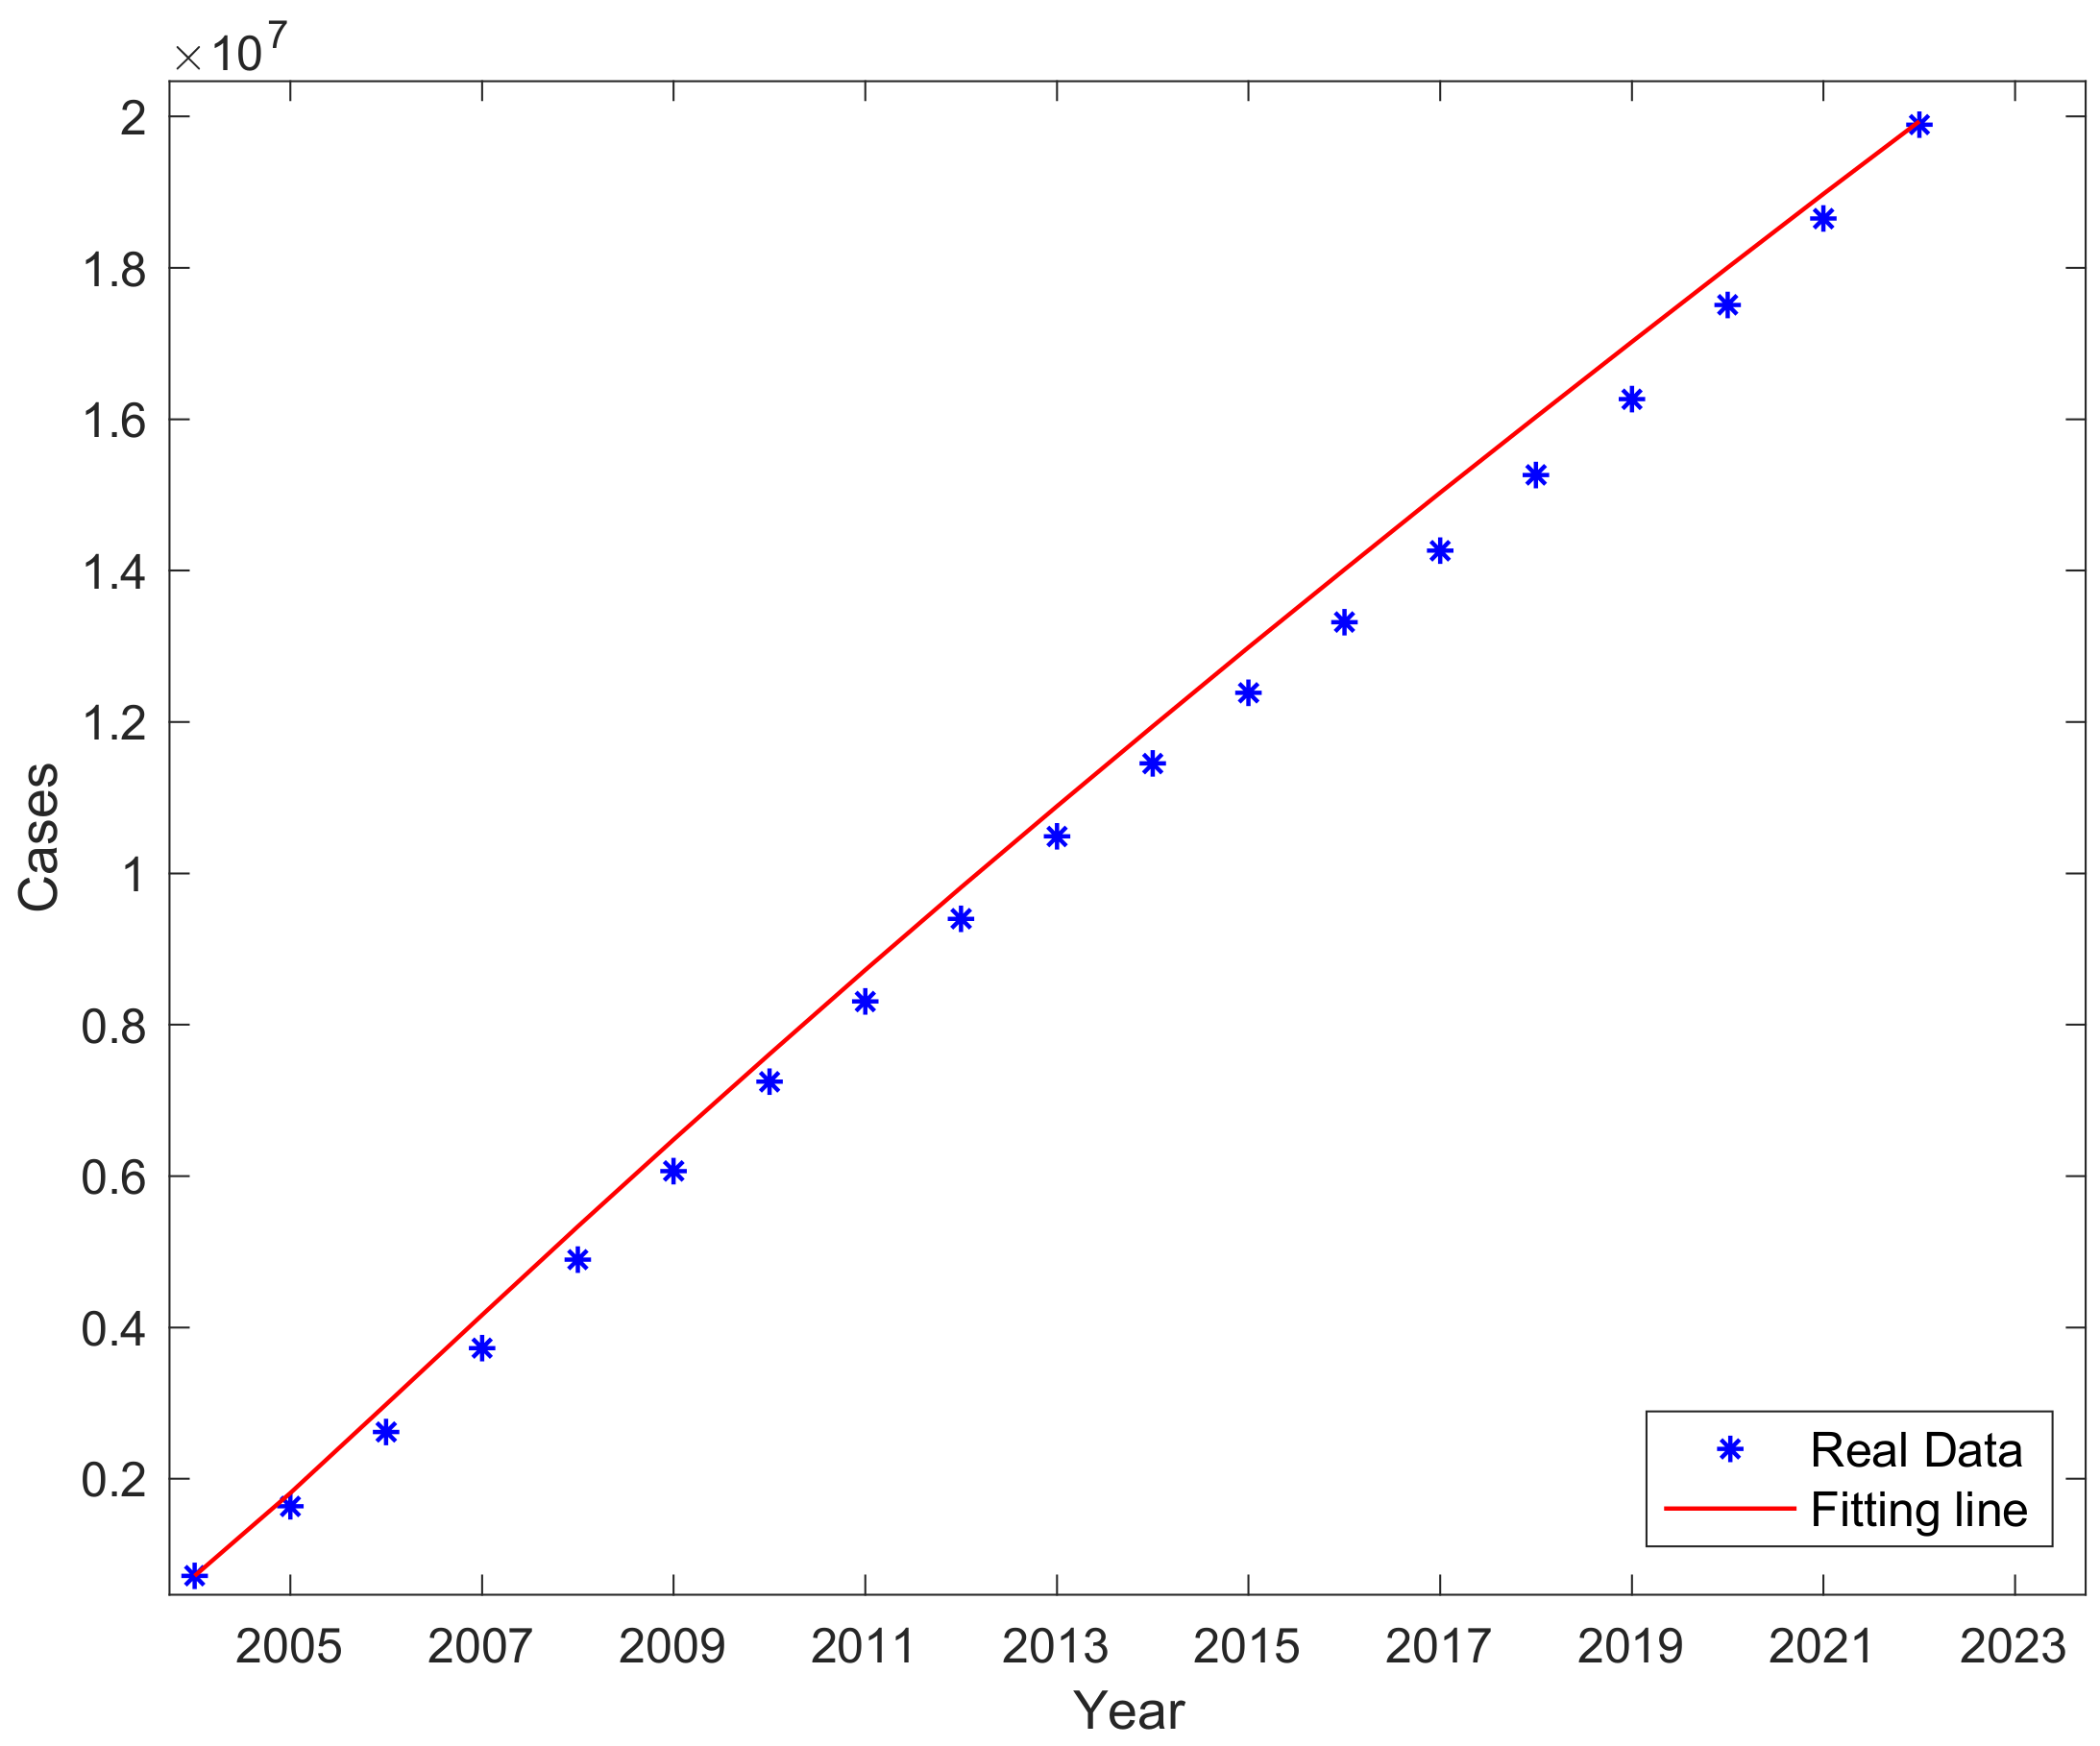
3.2. Fitting Result
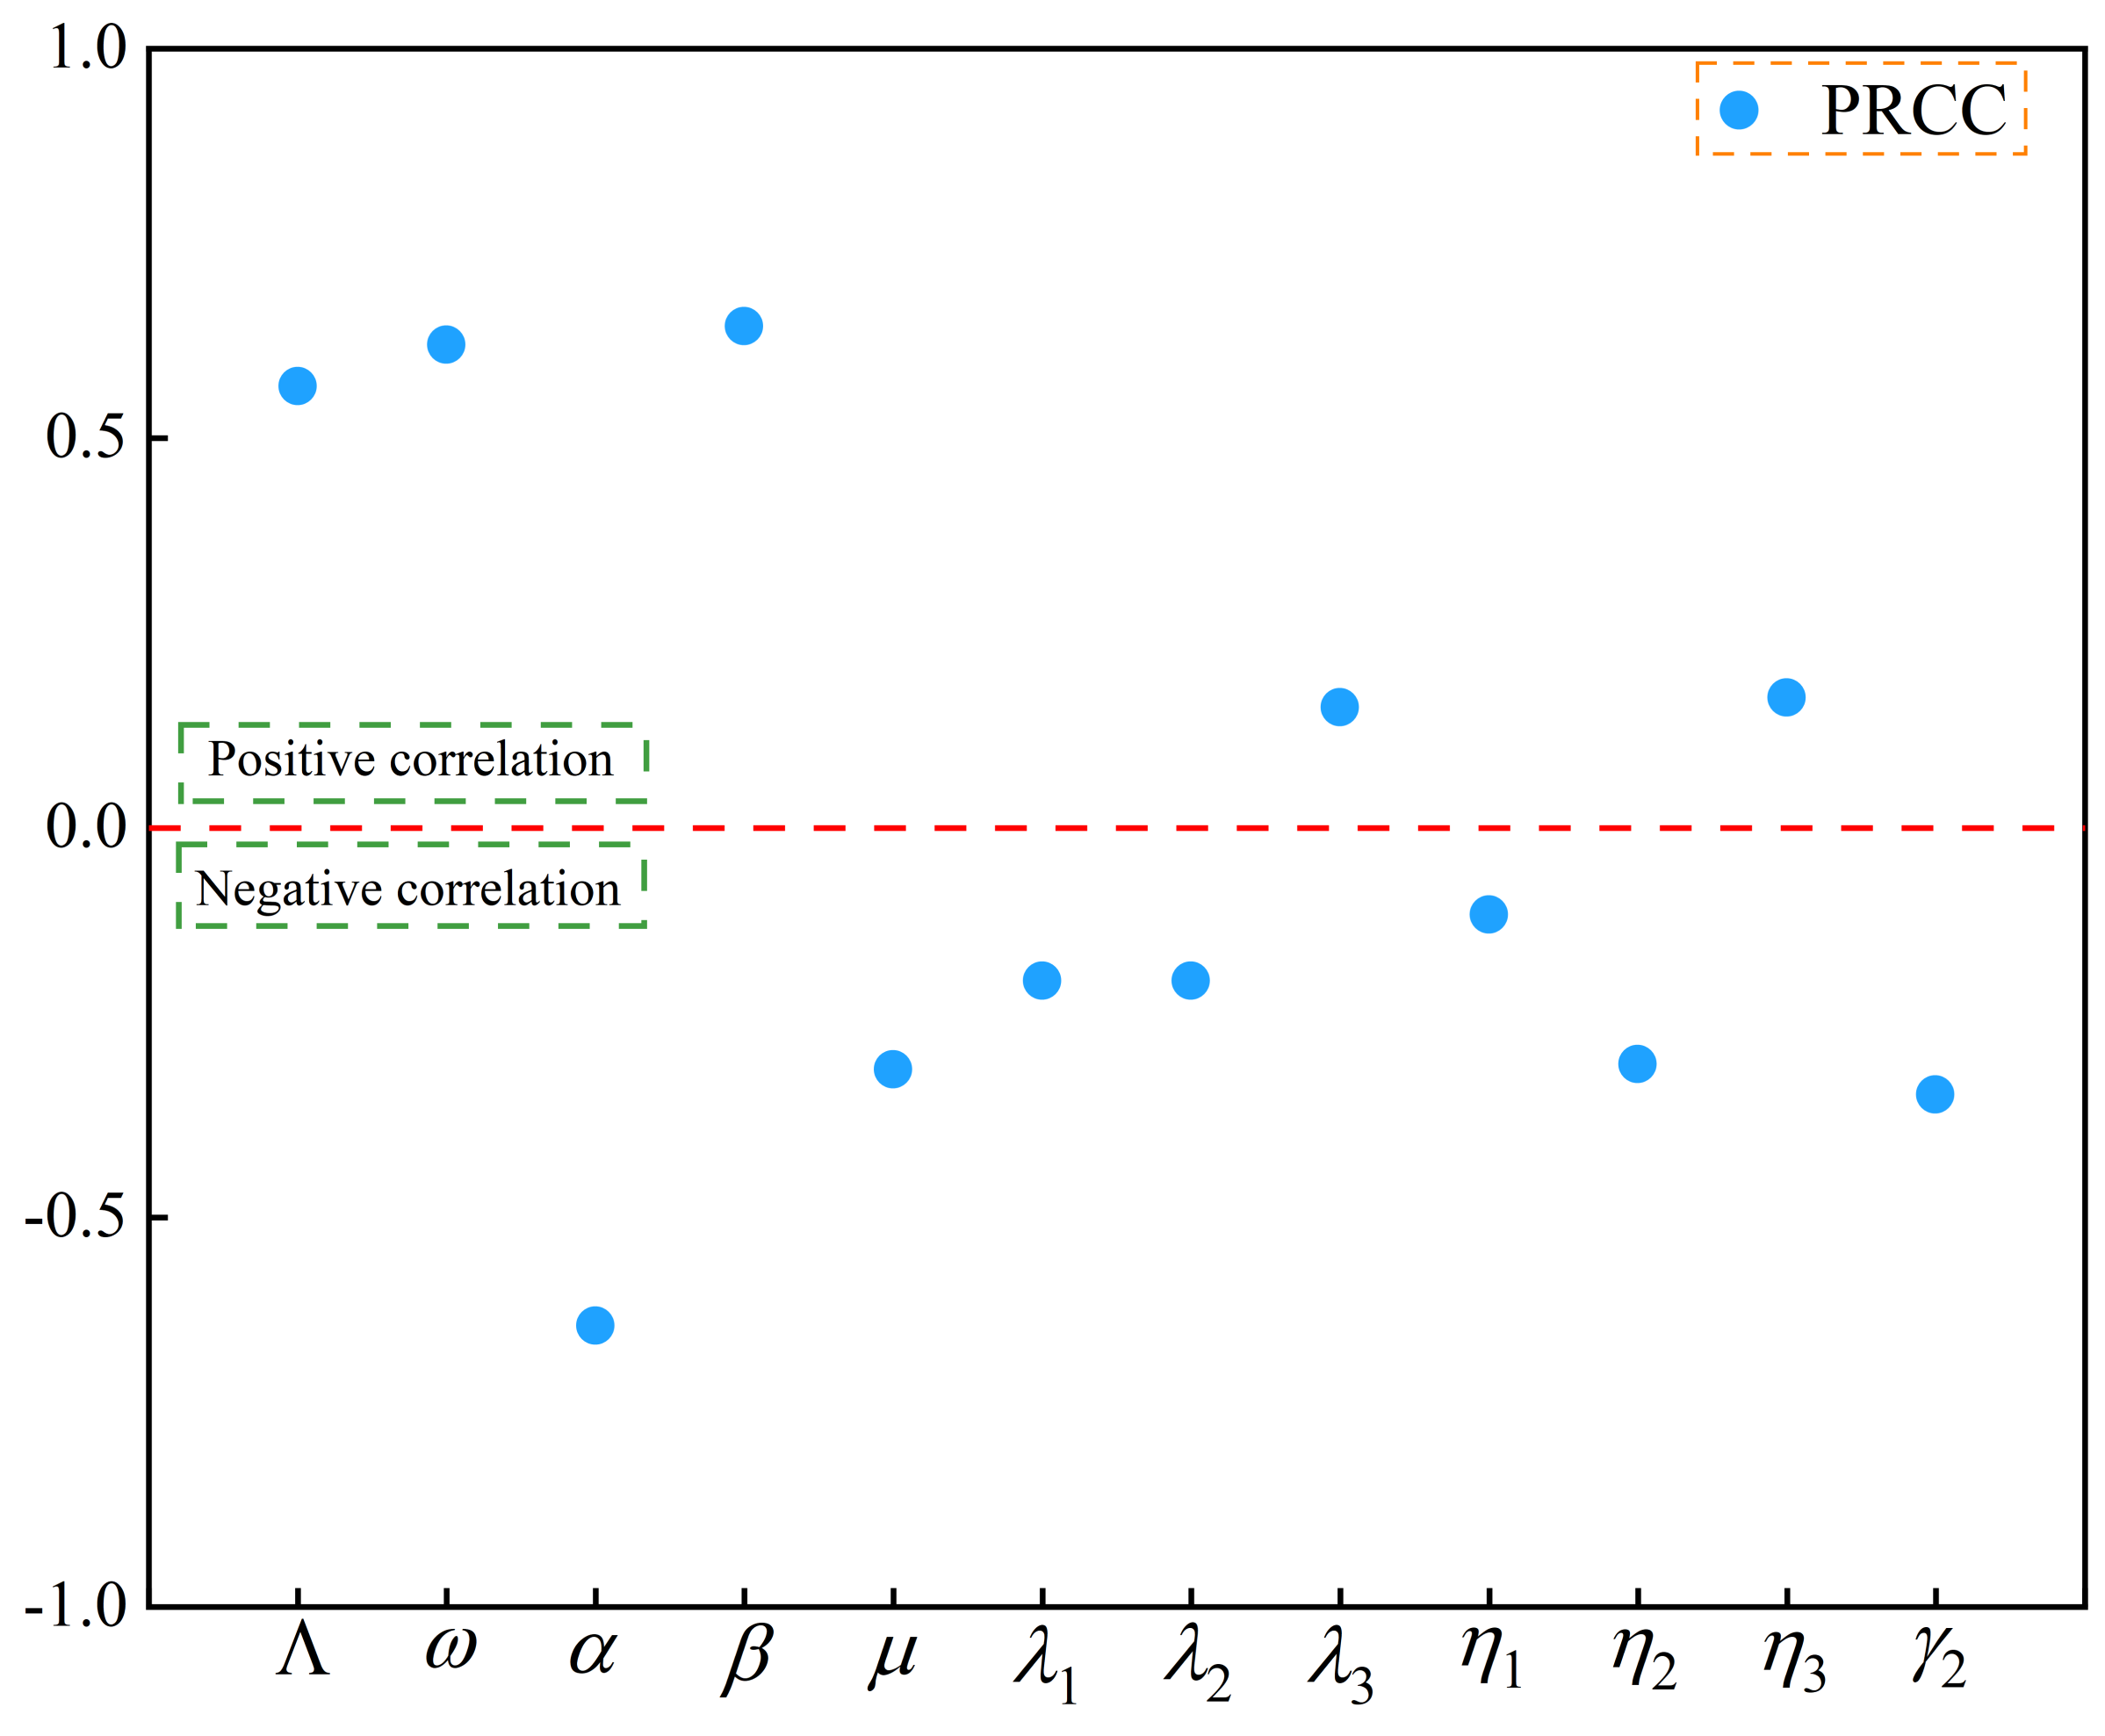
3.3. Sensitivity Analysis
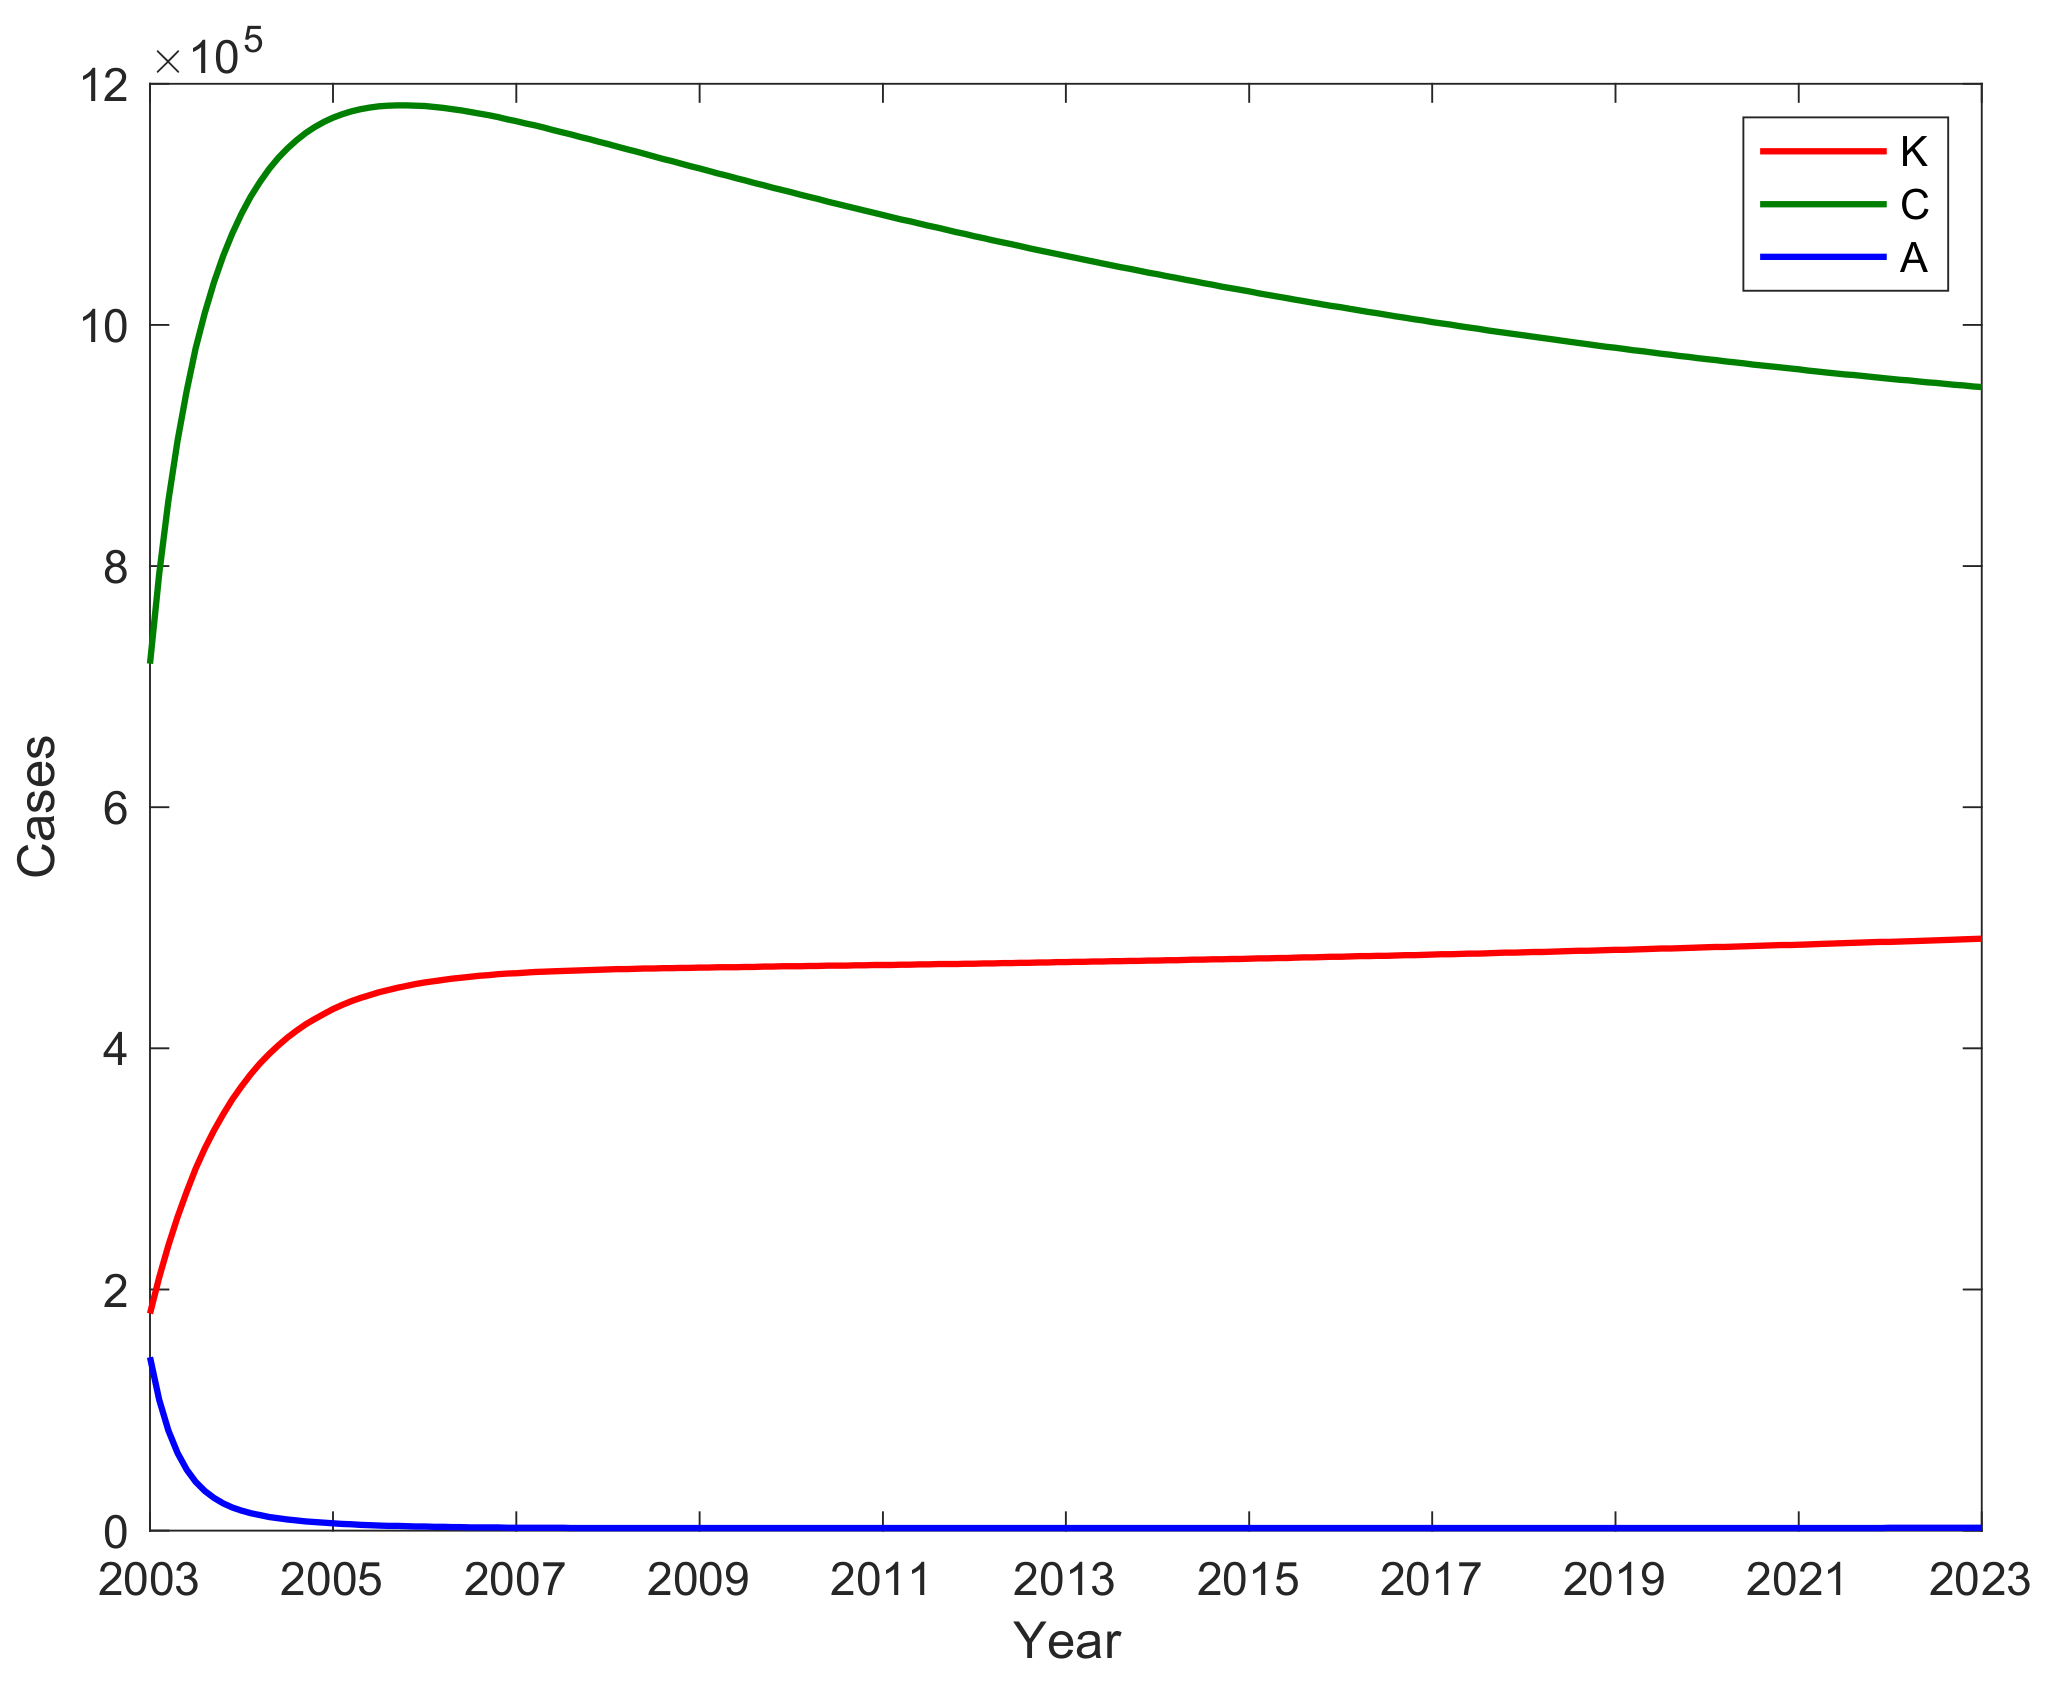
3.4. The Number of A, C, and Potential Virus Infections K with Time
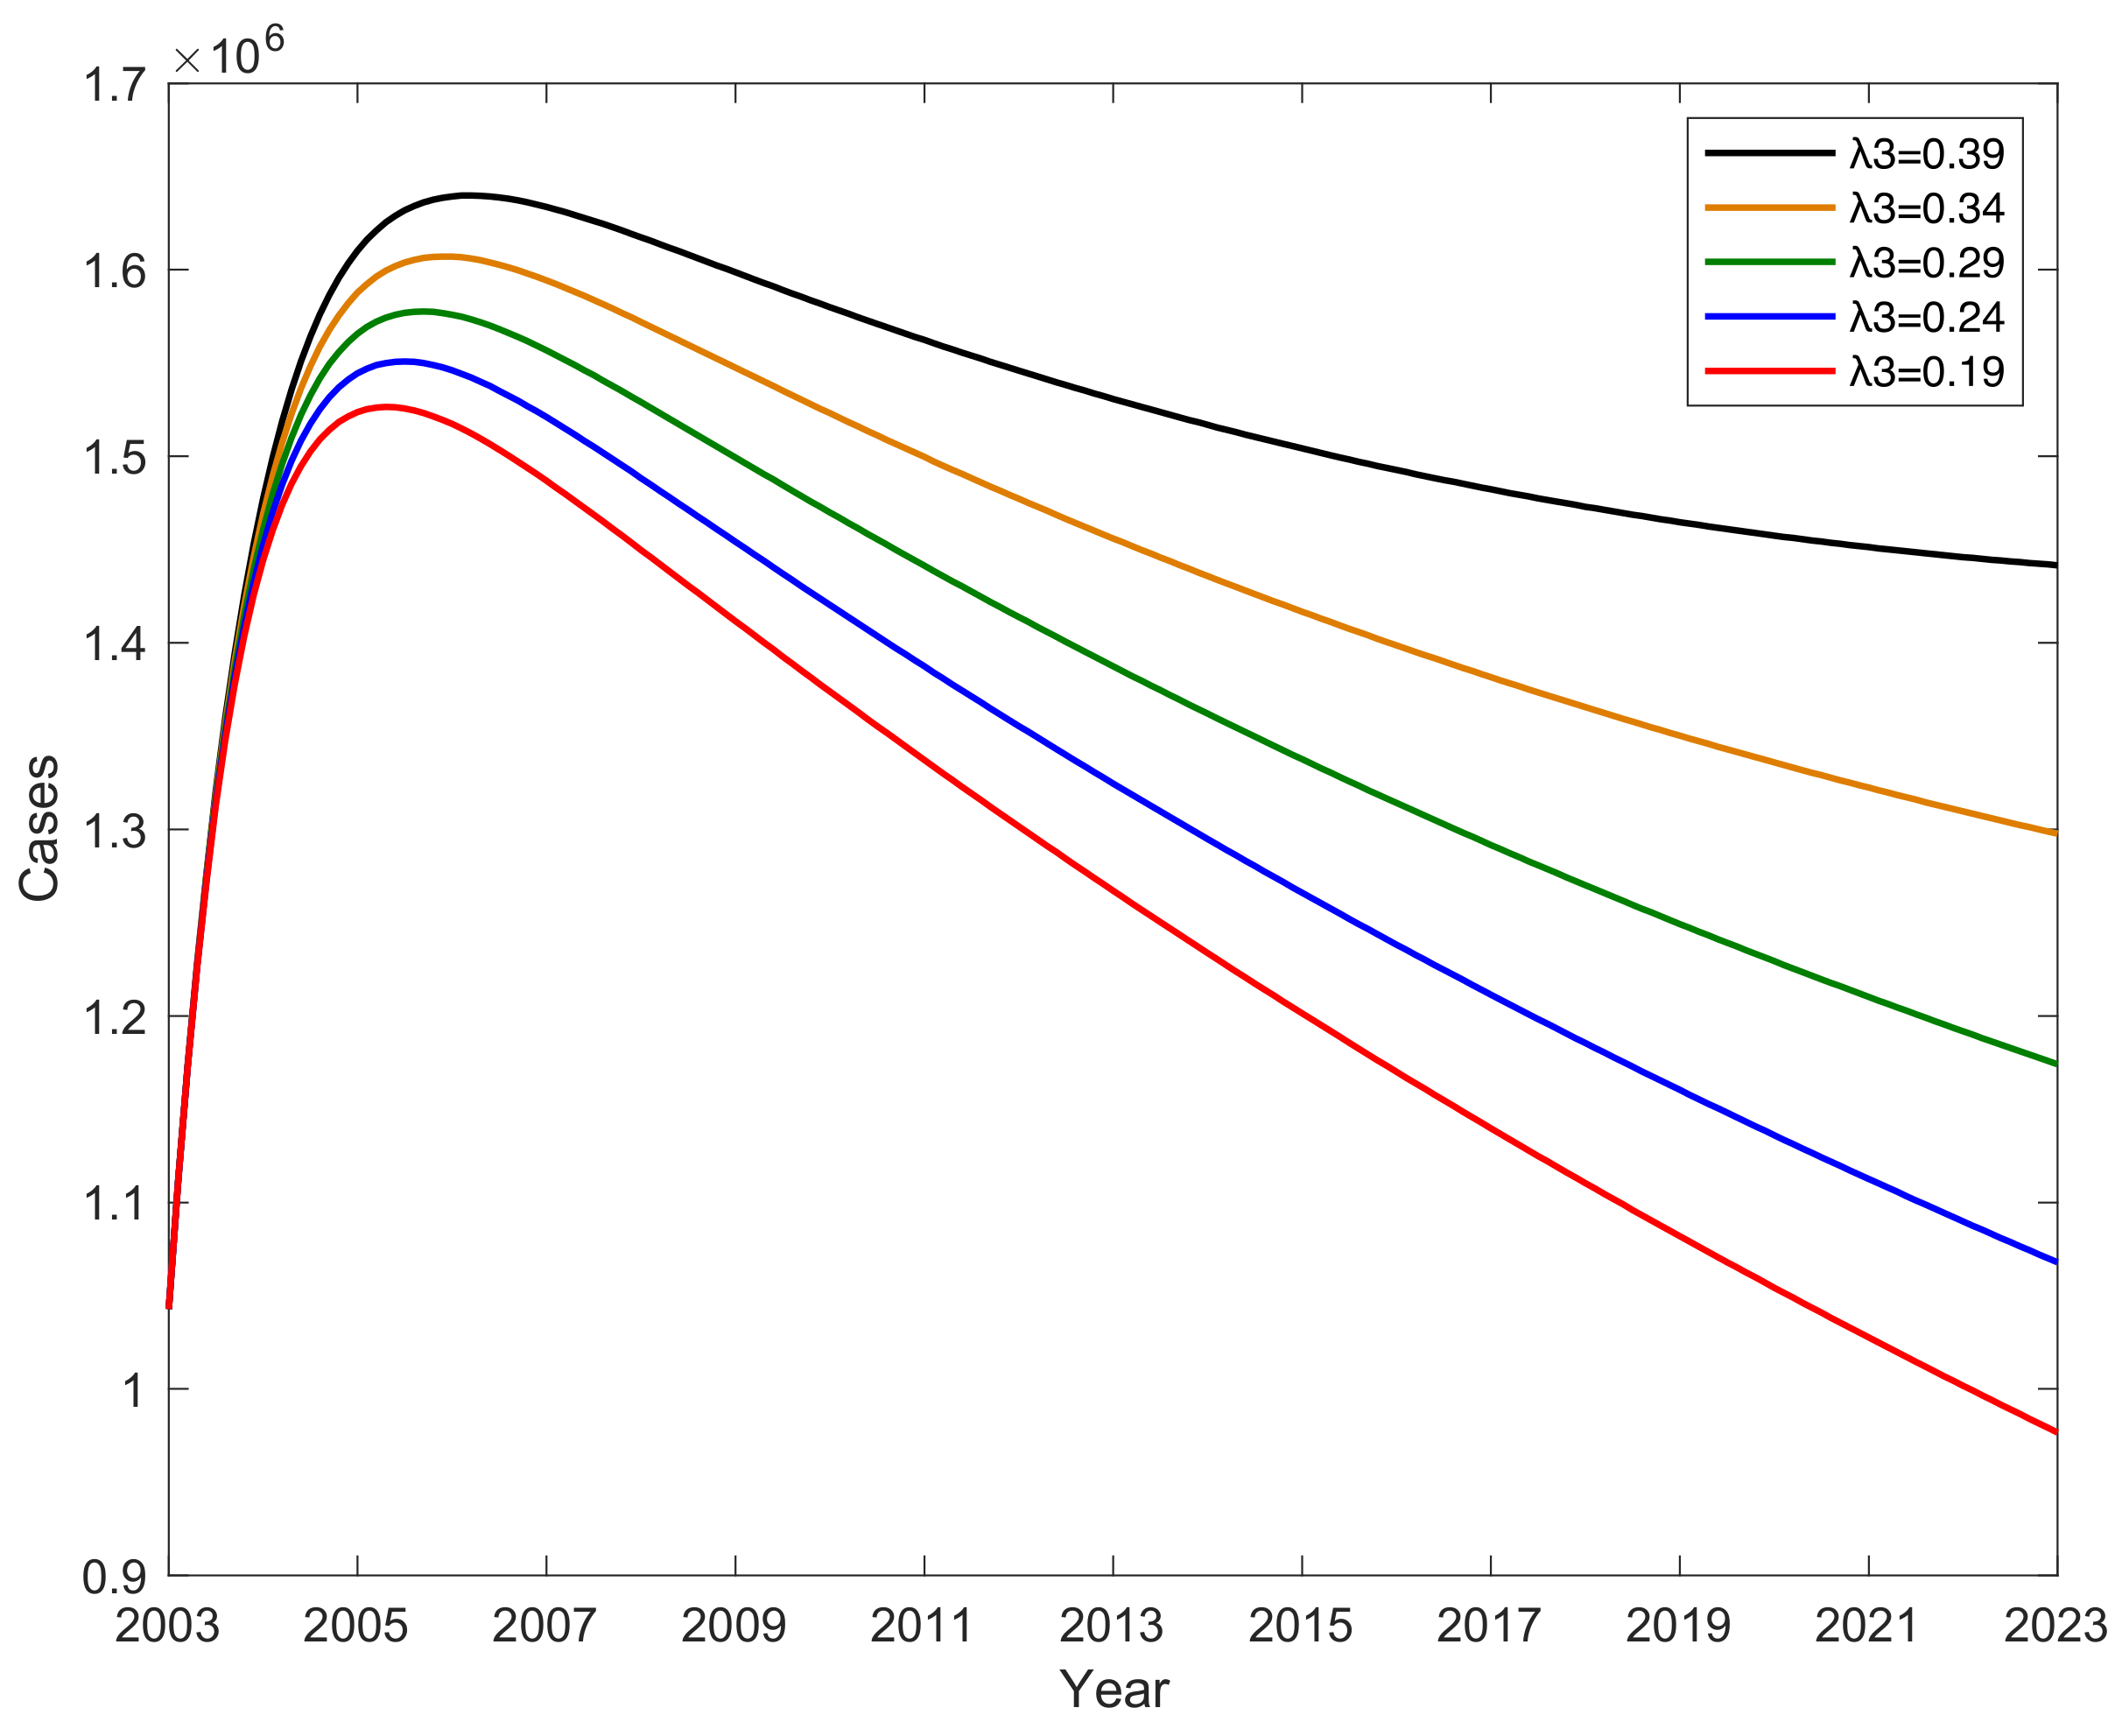
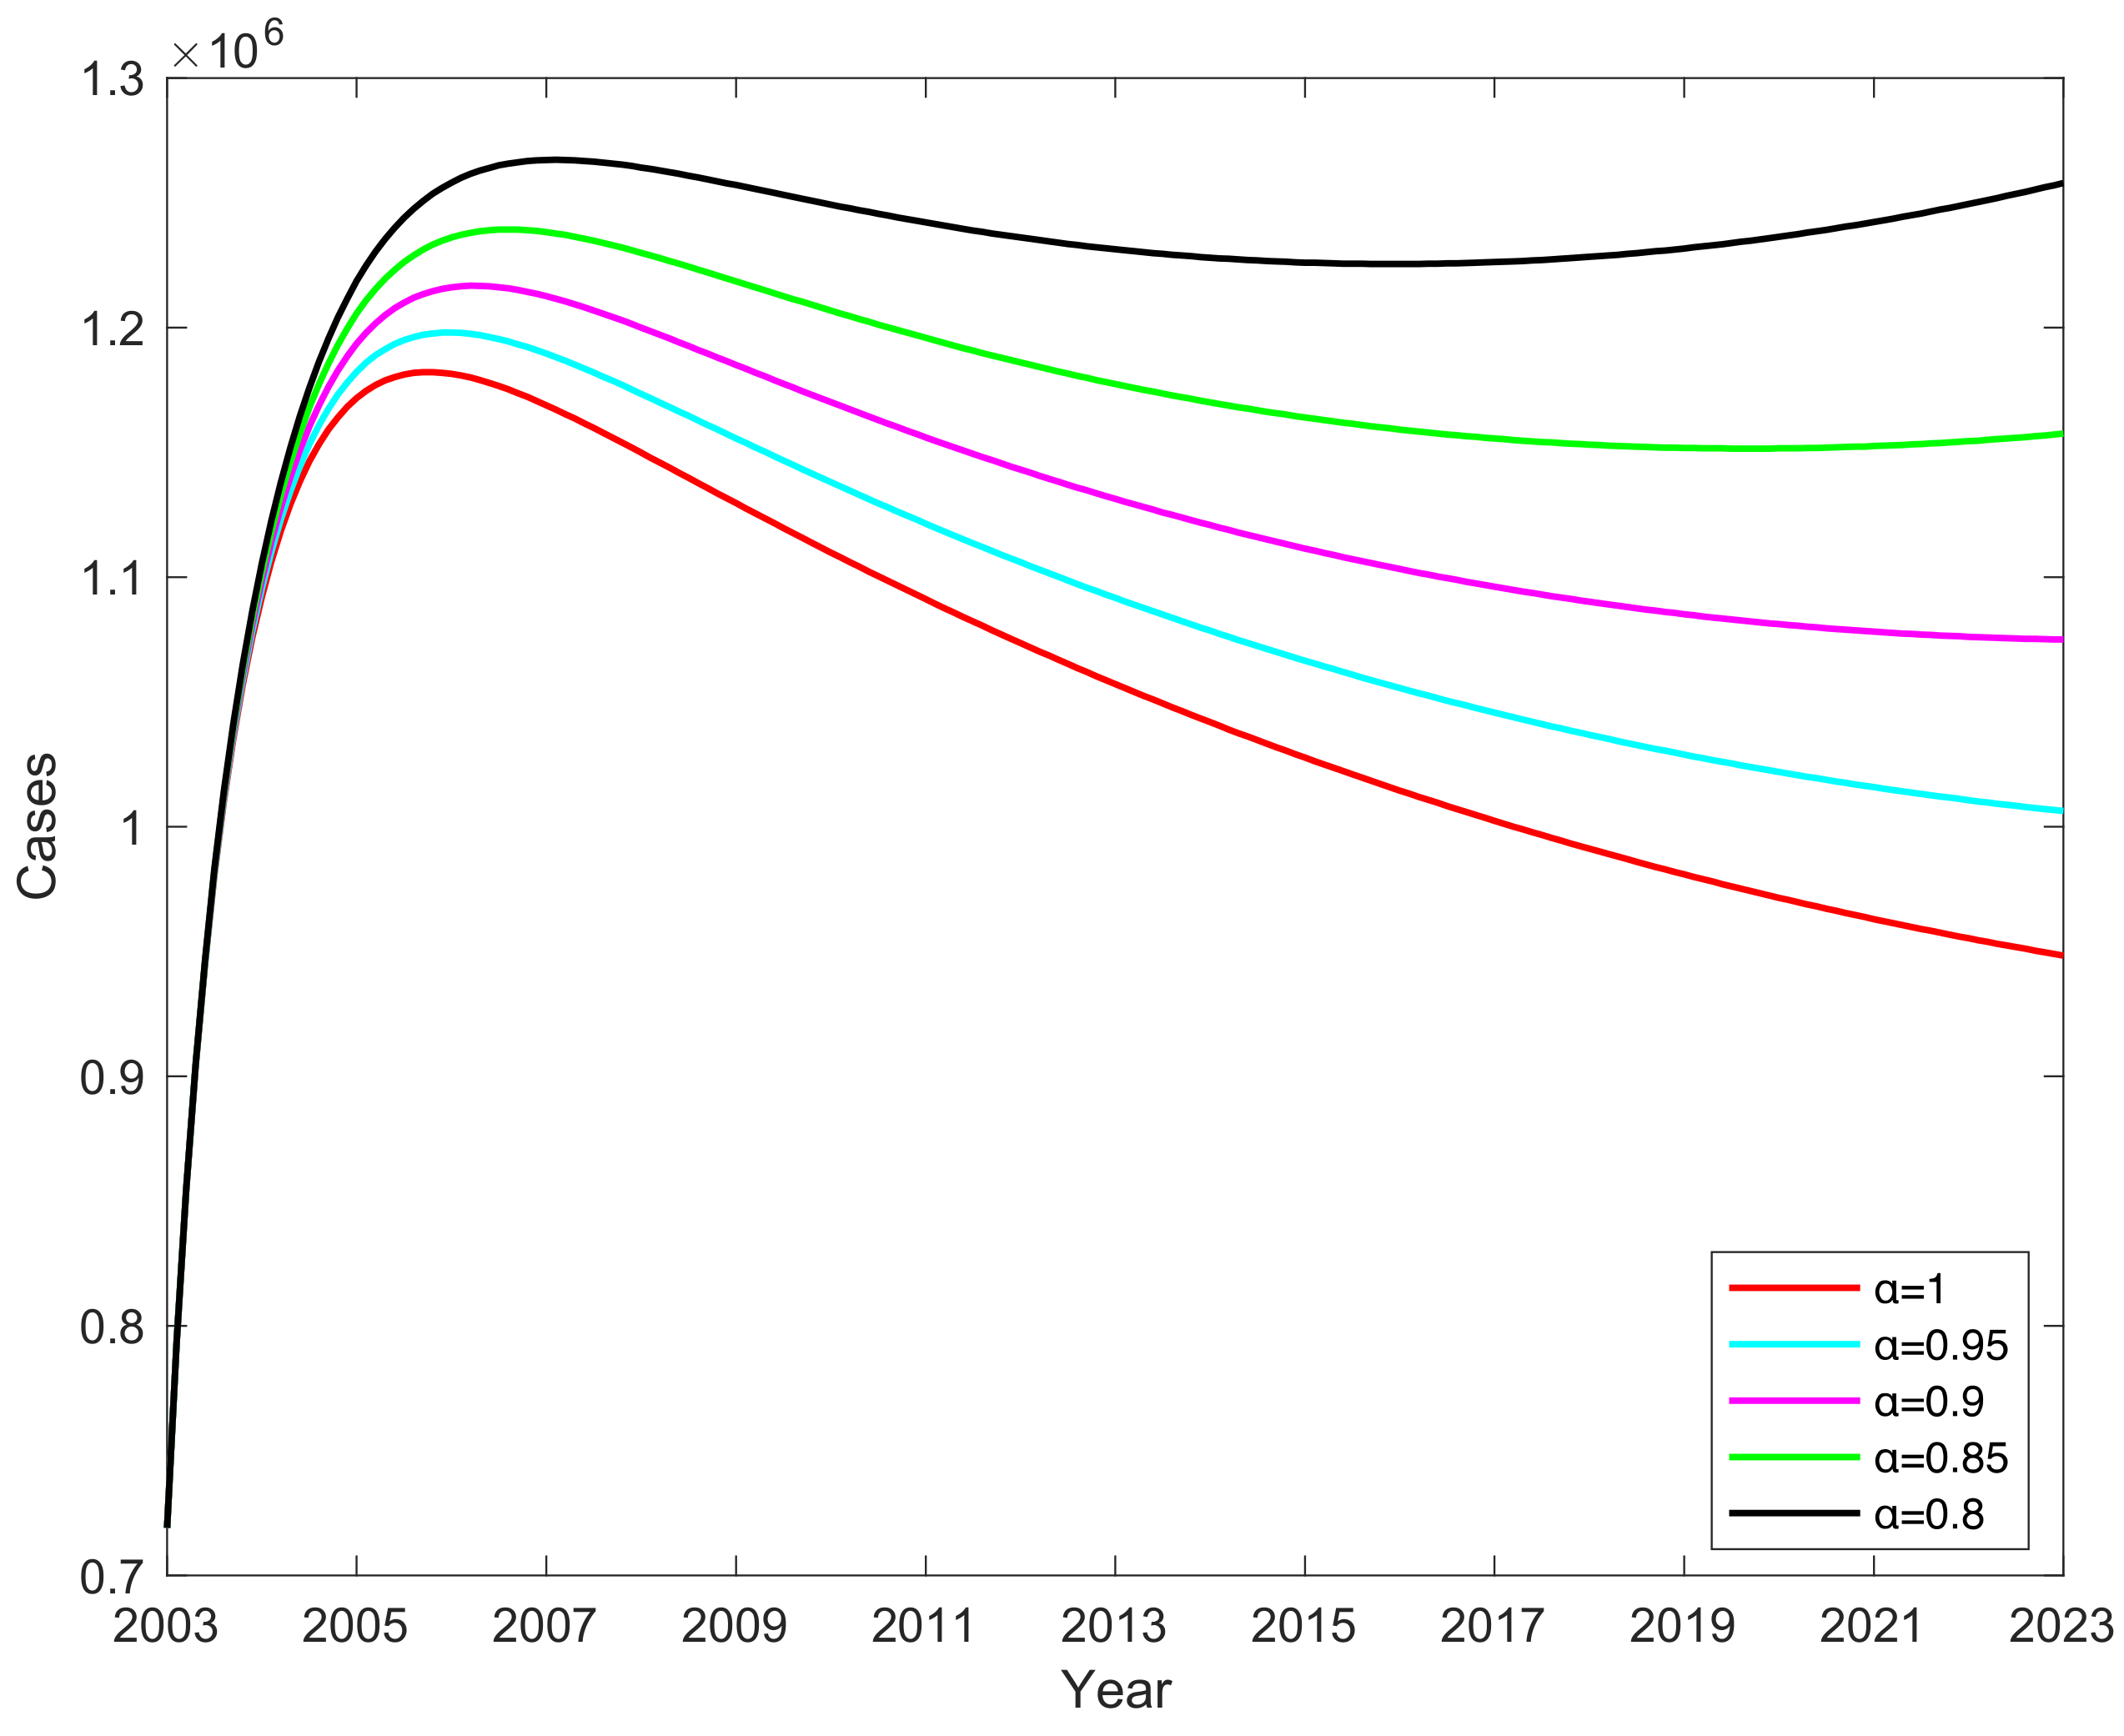
3.5. The Impact of Parameter on Hepatitis B Virus Transmission
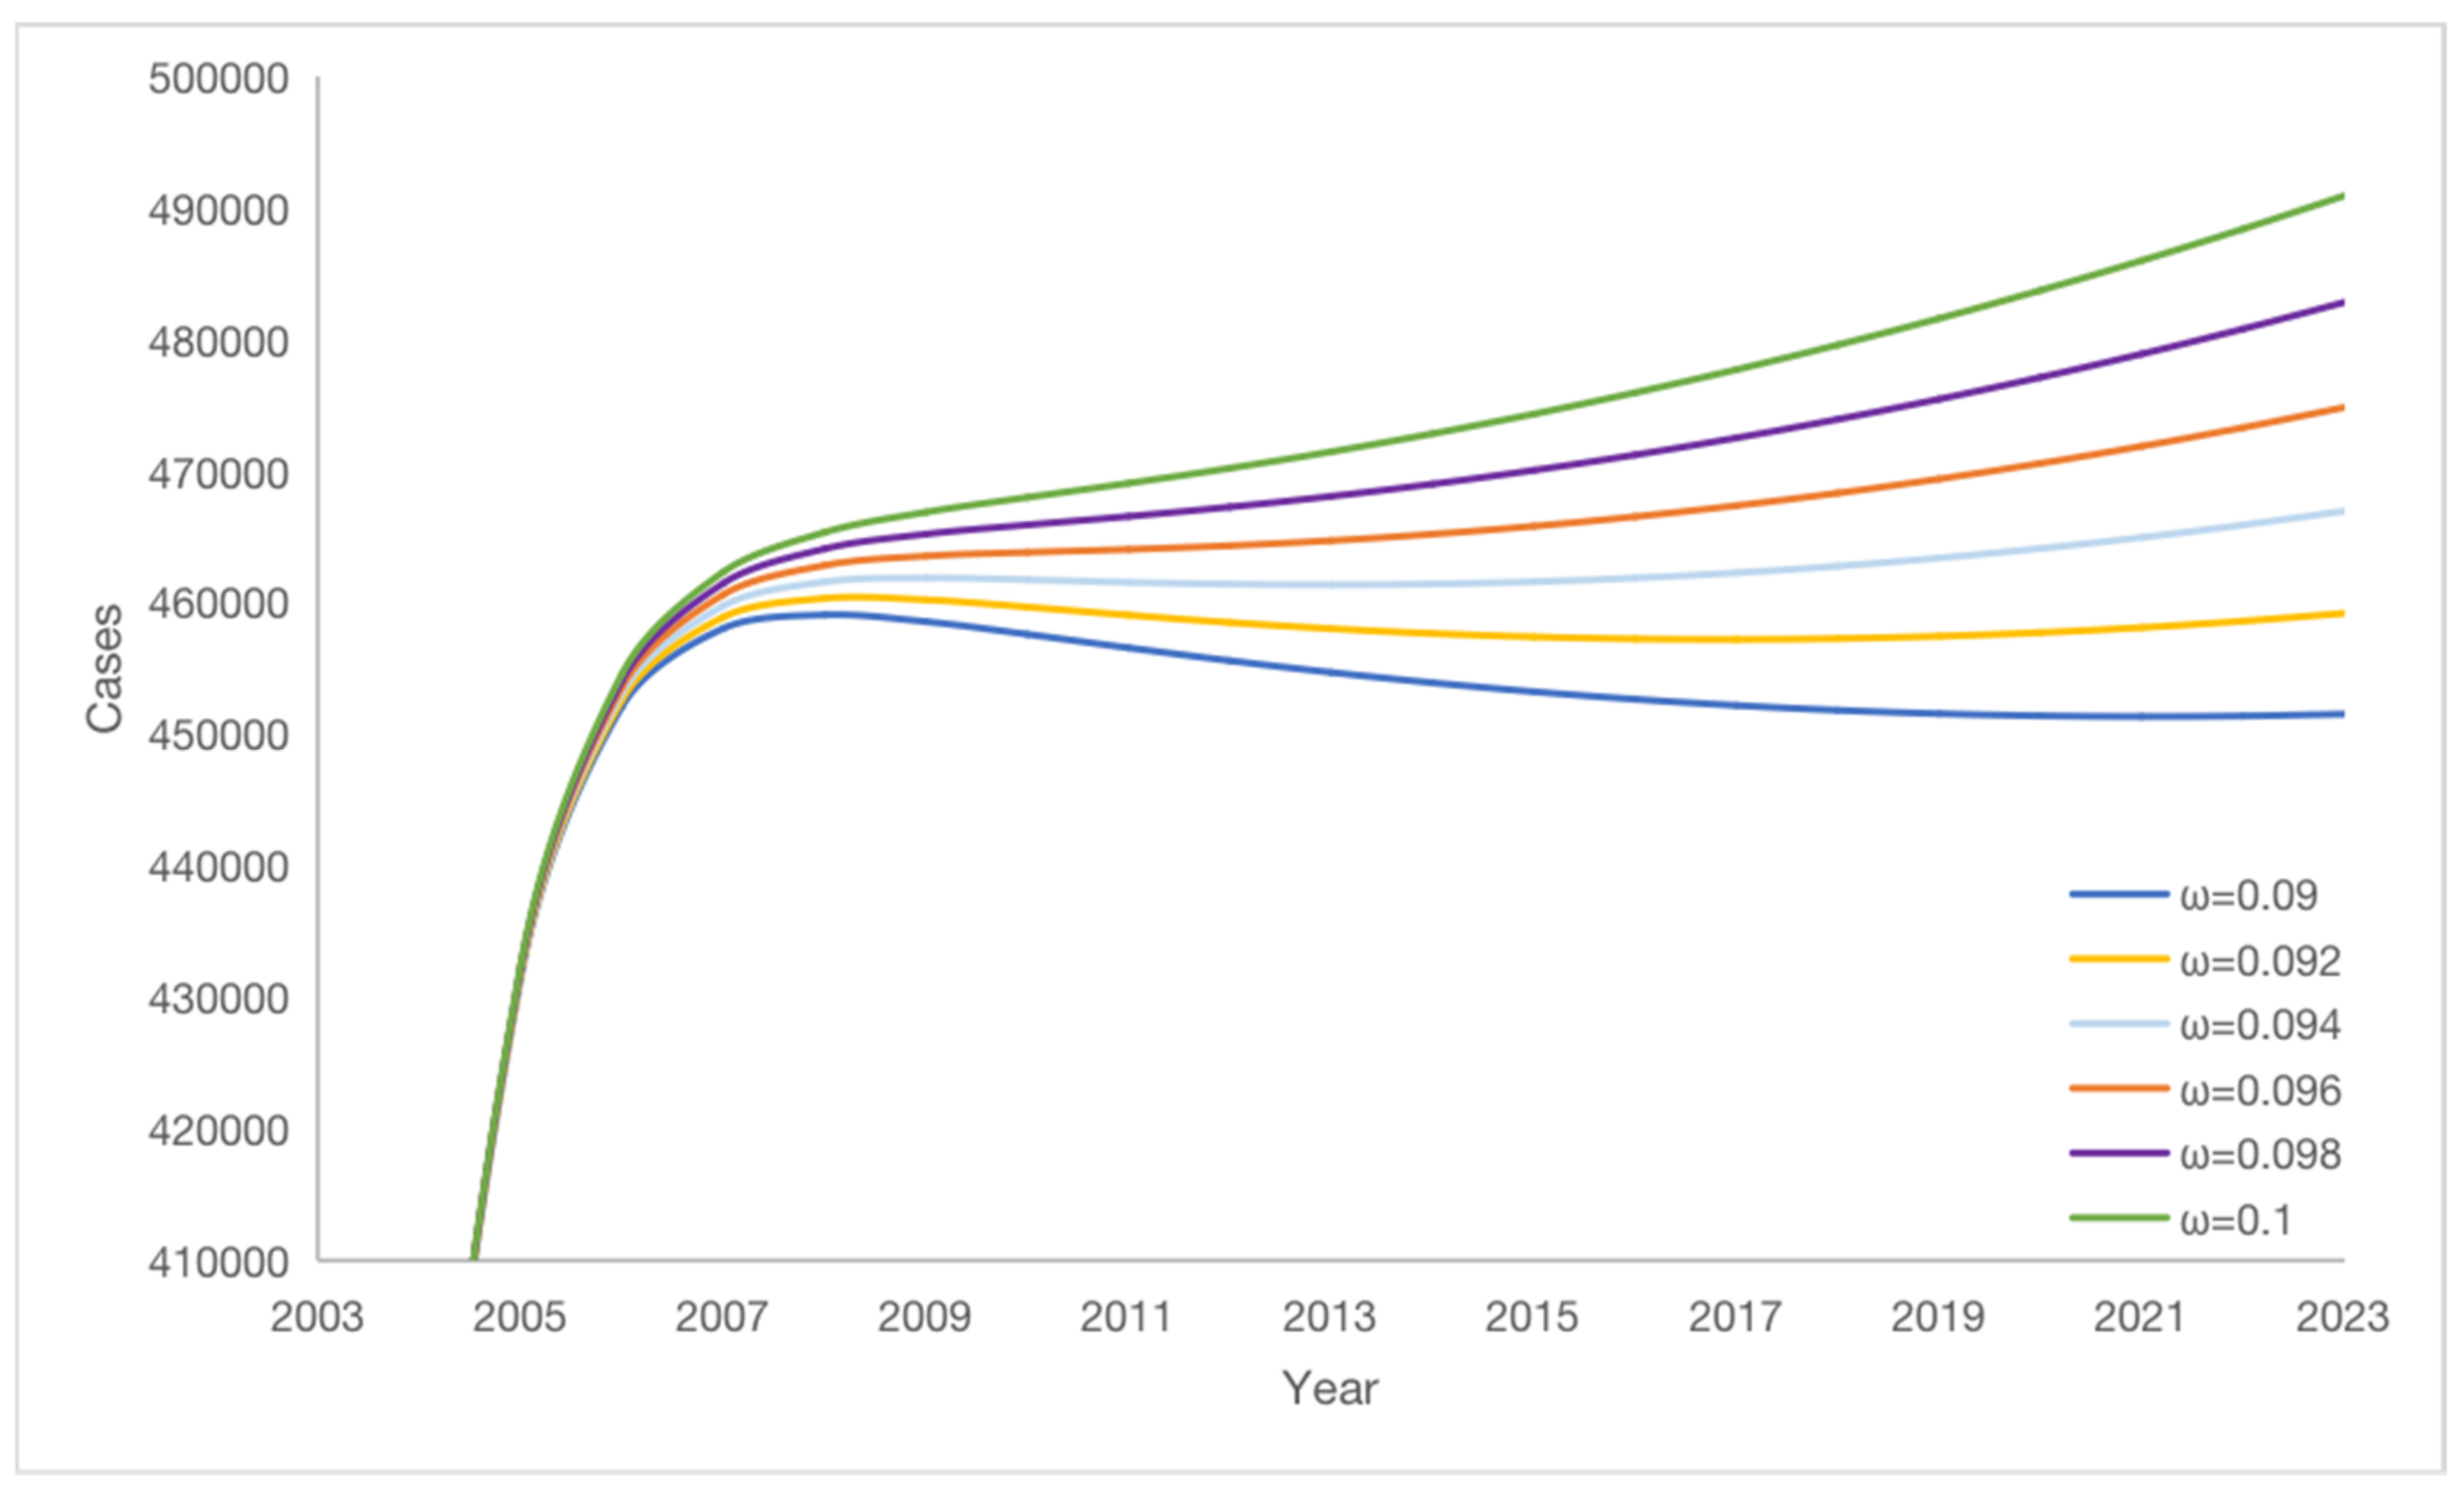
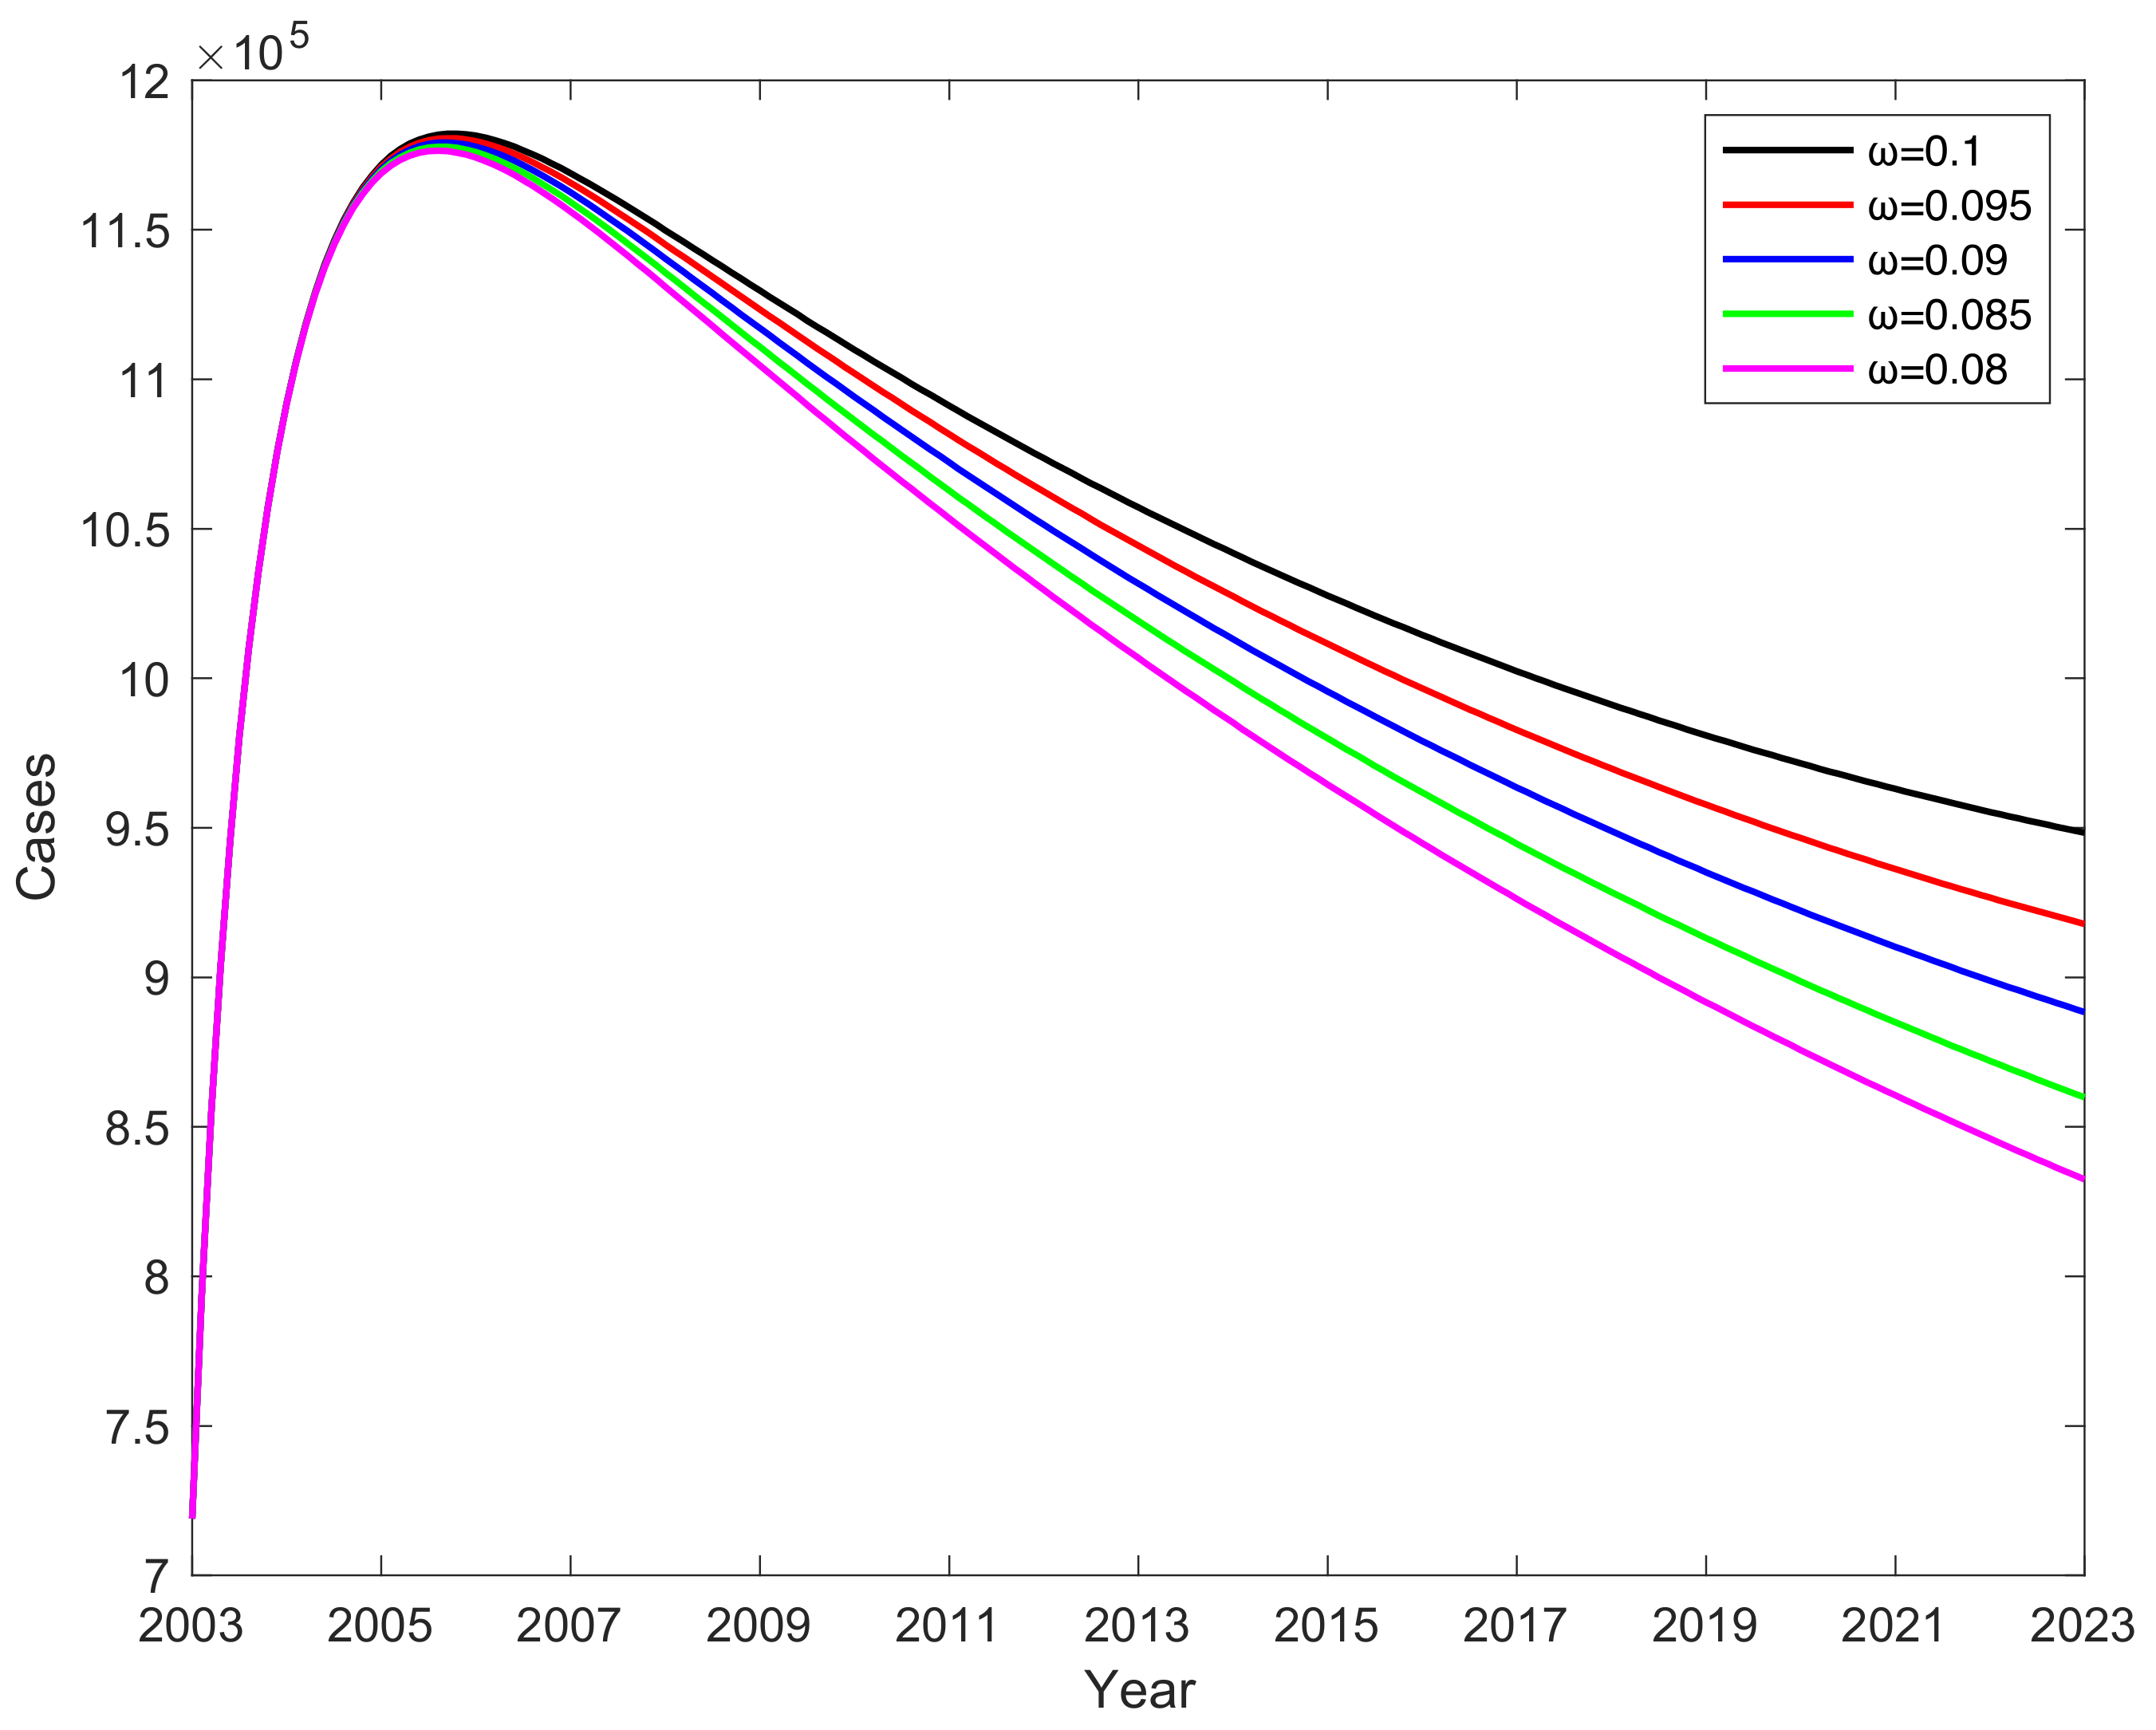
3.6. Impact of Vaccine Failure Rate on Potential Hepatitis B Virus Infections
3.7. Effect of Vaccine Failure Rates on the Number of C When Vaccination Rate Is 100%
3.8. Effect of Vaccination Rates on the Number of C When Vaccine Failure Rate Is 0.1
3.9. Effect on
4. Conclusions
Author Contributions
Funding
Institutional Review Board Statement
Informed Consent Statement
Data Availability Statement
Acknowledgments
Conflicts of Interest
References
- Dong, X.S.; Xie, L.; Guo, X.J.; Xiong, G.; Guo, J.W. Research on Improved Dynamic Models of Hepatitis B virus. Sci. Technol. Bull. 2011, 27, 773–776. [Google Scholar]
- World Health Organization. Available online: https://www.who.int/zh/news-room/fact-sheets/detail/hepatitis-b (accessed on 2 June 2023).
- National Health Commission of the People’s Republic of China. Available online: http://www.nhc.gov.cn (accessed on 2 June 2023).
- Wang, X.J. The GAVI project in China. China Public Health Manag. 2004, 20, 410–412. [Google Scholar] [CrossRef]
- Huang, X.; Fang, S.; Song, X. Observation on the immunization effect of two domestic recombinant Hepatitis B vaccines. Chin. J. Public Health Manag. 2014, 30, 686–687. [Google Scholar]
- Chinese Center for Disease Control and Prevention. Available online: https://www.chinacdc.cn (accessed on 2 June 2023).
- Su, L.L.; Li, W.D.; Yang, A.L.; Chen, W.B. Analysis and application of a kind of transmission dynamics of Hepatitis B virus. J. Lanzhou Univ. 2018, 54, 410–416, 423. [Google Scholar]
- Sun, Y.N.; Xue, Y.K. Analysis of a Hepatitis B Kinetic Model with Physical Examination and Immunization. Pract. Underst. Math. 2020, 50, 265–272. [Google Scholar]
- Li, D.M.; Liu, W.H.; Wang, Q.; Guo, M.J. Dynamics Model of Hepatitis B Immunoglobulin Blocking the Transmission of Hepatitis B virus between Mother and Infant. J. Eng. Math. 2021, 38, 151–166. [Google Scholar]
- Liu, Y.Y.; Luo, Y.; Hu, Y.Z. The Study on Dynamical Model of HBV Infection. J. Wenzhou Univ. (Nat. Sci. Ed.) 2017, 38, 33–41. [Google Scholar]
- Tao, Y.J.; Feng, H.P. Hepatitis B virus infection model with vertical transmission and infection period. J. Hebei Univ. (Nat. Sci. Ed.) 2017, 37, 567–571. [Google Scholar]
- Zhao, T.T.; Luo, D.M.; Xu, W.; Li, X.Y.; Uthman, D.L.F.Z.; Yang, Y. Study on Dynamic Model of Hepatitis B in Xinjiang during 2005–2014. Sci. Technol. Perspect. 2017, 20, 1–2, 36. [Google Scholar]
- O’Leary, C.; Hong, Z.; Zhang, F.; Dawood, M.; Smart, G.; Kaita, K.; Wu, J. A mathematical model to study the effect of Hepatitis B virus vaccine and antivirus treatment among the Canadian Inuit population. Eur. J. Clin. Microbiol. Infect. Dis. 2009, 29, 63–72. [Google Scholar] [CrossRef] [PubMed]
- Pang, J.; Cui, J.A.; Zhou, X. Dynamical behavior of a Hepatitis B virus transmission model with vaccination. J. Theor. Biol. 2010, 265, 572–578. [Google Scholar] [CrossRef] [PubMed]
- Habenom, H.; Suthar, D.L.; Baleanu, D.; Purohit, S.D. A Numerical Simulation on the Effect of Vaccination and Treatments for the Fractional Hepatitis B Model. ASME J. Comput. Nonlinear Dynamic. 2021, 16, 011004. [Google Scholar] [CrossRef]
- Demasse, R.D.; Tewa, J.J.; Bowong, S.; Emvudu, Y. Optimal control for an age-structured model for the transmission of Hepatitis B. J. Math. Biol. 2016, 73, 305–333. [Google Scholar] [CrossRef] [PubMed]
- Li, Q.; Lu, F.; Deng, G.; Wang, K. Modeling the effects of covalently closed circular DNA and den dritic cells in chronic HBV infection. J. Theor. Biol. 2014, 357, 1–9. [Google Scholar] [CrossRef] [PubMed]
- Goyal, A. Modeling reveals no direct role of the extent of HBV DNA integrations on the outcome of infection. J. Theor. Biol. 2021, 526, 110793. [Google Scholar] [CrossRef]
- Yang, H.L. The Dynamic Analysis of a Hepatitis B Virus Transmission Model; School of Mathematics and Statistics, Huazhong Normal University: Wuhan, China, 2015. [Google Scholar]
- Driessche, P.V.D. Reproduction numbers of infectious disease models. Infect. Dis. Model. 2017, 2, 288–303. [Google Scholar] [CrossRef] [PubMed]
- Sun, G.Q.; Zhang, J.; Song, L.P.; Jin, Z.; Li, B.L. Pattern formation of a spatial predator-prey system. Appl. Math. Comput. 2012, 218, 11151–11162. [Google Scholar] [CrossRef]
- National Bureau of Statistics. Available online: http://www.stats.gov.cn (accessed on 2 June 2023).
- Gao, D.; Lou, Y.; He, D.; Porco, T.C.; Kuang, Y.; Chowell, G.; Ruan, S. Prevention and control of Zika as a mosquito-borne and sexually transmitted disease: A mathematical modeling analysis. Sci. Rep. 2016, 6, 28070. [Google Scholar] [CrossRef] [PubMed]
- Yan, L.K. Application of Correlation Coefficient and Biased Correlation Coefficient in Related Analysis. J. Yunnan Univ. Financ. Econ. 2003, 19, 78–80. [Google Scholar]
- Williams, J.R.; Nokes, D.J.; Medley, G.F.; Anderson, R.M. The transmission dynamics of hepatitis B in the UK: A mathematical model for evaluating costs and effectiveness of immunization programmers. Epidemiol. Infect. 1996, 116, 71–89. [Google Scholar] [CrossRef] [PubMed]


| Parameter | Value | Reference | Parameter | Value | Reference |
|---|---|---|---|---|---|
| 1 | Estimated | 0.007 | [22] | ||
| 0.1 | [6] | 0.11 | Fitted | ||
| 3.4 | Calculated | 0.5 | Fitted | ||
| 3.4 | Calculated | 0.39 | Calculated | ||
| 3.4 | Calculated | 0.8805 | [1] | ||
| 0.0461 | Calculated | 0.0461 | Calculated | ||
| Fitted | 4 | [1] | |||
| 4 | [1] | 16,540,000 | [22] |
| Parameter | PRCC |
|---|---|
| 0.644 | |
| 0.620 | |
| 0.567 | |
| 0.167 | |
| 0.155 | |
| −0.111 | |
| −0.196 | |
| −0.196 | |
| −0.303 | |
| −0.310 | |
| −0.342 | |
| −0.639 |
| = 0.08 | = 0.09 | = 0.1 | ||||
|---|---|---|---|---|---|---|
| Year | K | K | K | |||
| 2004 | 0.28 | 368,296 | 0.28 | 368,431 | 0.28 | 368,566 |
| 2005 | 0.30 | 430,598 | 0.30 | 431,571 | 0.30 | 432,541 |
| 2006 | 0.29 | 449,705 | 0.29 | 452,167 | 0.29 | 454,624 |
| 2007 | 0.28 | 453,797 | 0.28 | 458,081 | 0.28 | 462,366 |
| 2008 | 0.28 | 452,865 | 0.28 | 459,110 | 0.28 | 465,379 |
| 2009 | 0.28 | 450,334 | 0.28 | 458,592 | 0.28 | 466,907 |
| 2010 | 0.30 | 447,350 | 0.30 | 457,632 | 0.31 | 468,028 |
| 2011 | 0.29 | 444,292 | 0.29 | 456,603 | 0.30 | 469,102 |
| 2012 | 0.29 | 441,287 | 0.29 | 455,625 | 0.30 | 470,246 |
| 2013 | 0.31 | 438,374 | 0.32 | 454,738 | 0.33 | 471,495 |
| 2014 | 0.32 | 435,566 | 0.33 | 453,952 | 0.34 | 472,866 |
| 2015 | 0.32 | 432,865 | 0.33 | 453,272 | 0.34 | 474,361 |
| 2016 | 0.31 | 430,269 | 0.32 | 452,698 | 0.34 | 475,983 |
| 2017 | 0.30 | 427,778 | 0.31 | 452,229 | 0.32 | 477,732 |
| 2018 | 0.30 | 425,387 | 0.31 | 451,865 | 0.32 | 479,609 |
| 2019 | 0.30 | 423,097 | 0.31 | 451,603 | 0.32 | 481,614 |
| 2020 | 0.32 | 420,904 | 0.33 | 451,444 | 0.35 | 483,749 |
| 2021 | 0.30 | 418,807 | 0.32 | 451,386 | 0.33 | 486,013 |
Disclaimer/Publisher’s Note: The statements, opinions and data contained in all publications are solely those of the individual author(s) and contributor(s) and not of MDPI and/or the editor(s). MDPI and/or the editor(s) disclaim responsibility for any injury to people or property resulting from any ideas, methods, instructions or products referred to in the content. |
© 2023 by the authors. Licensee MDPI, Basel, Switzerland. This article is an open access article distributed under the terms and conditions of the Creative Commons Attribution (CC BY) license (https://creativecommons.org/licenses/by/4.0/).
Share and Cite
Xu, C.; Wang, Y.; Cheng, K.; Yang, X.; Wang, X.; Guo, S.; Liu, M.; Liu, X. A Mathematical Model to Study the Potential Hepatitis B Virus Infections and Effects of Vaccination Strategies in China. Vaccines 2023, 11, 1530. https://doi.org/10.3390/vaccines11101530
Xu C, Wang Y, Cheng K, Yang X, Wang X, Guo S, Liu M, Liu X. A Mathematical Model to Study the Potential Hepatitis B Virus Infections and Effects of Vaccination Strategies in China. Vaccines. 2023; 11(10):1530. https://doi.org/10.3390/vaccines11101530
Chicago/Turabian StyleXu, Chuanqing, Yu Wang, Kedeng Cheng, Xin Yang, Xiaojing Wang, Songbai Guo, Maoxing Liu, and Xiaoling Liu. 2023. "A Mathematical Model to Study the Potential Hepatitis B Virus Infections and Effects of Vaccination Strategies in China" Vaccines 11, no. 10: 1530. https://doi.org/10.3390/vaccines11101530
APA StyleXu, C., Wang, Y., Cheng, K., Yang, X., Wang, X., Guo, S., Liu, M., & Liu, X. (2023). A Mathematical Model to Study the Potential Hepatitis B Virus Infections and Effects of Vaccination Strategies in China. Vaccines, 11(10), 1530. https://doi.org/10.3390/vaccines11101530