Article

Forecasted Trends of the New COVID-19 Epidemic Due to the Omicron Variant in Thailand, 2022

by
Rapeepong Suphanchaimat
1,2,
Pard Teekasap
3,
Natthaprang Nittayasoot
1,
Mathudara Phaiyarom
2 and
Nisachol Cetthakrikul
2,*
1
Division of Epidemiology, Department of Disease Control, Ministry of Public Health, Nonthaburi 11000, Thailand
2
International Health Policy Program, Ministry of Public Health, Nonthaburi 11000, Thailand
3
Faculty of Business and Technology, Stamford International University, Bangkok 10250, Thailand
*
Author to whom correspondence should be addressed.
Vaccines 2022, 10(7), 1024; https://doi.org/10.3390/vaccines10071024
Submission received: 26 April 2022 / Revised: 17 June 2022 / Accepted: 21 June 2022 / Published: 27 June 2022
(This article belongs to the Special Issue COVID-19 Vaccination, Role of Vaccines and Global Health)

Abstract

:
Thailand is among many countries severely affected by COVID-19 since the beginning of the global pandemic. Thus, a deliberate planning of health care resource allocation against health care demand in light of the new SARS-CoV-2 variant, Omicron, is crucial. This study aims to forecast the trends in COVID-19 cases and deaths from the Omicron variant in Thailand. We used a compartmental susceptible-exposed-infectious-recovered model combined with a system dynamics model. We developed four scenarios with differing values of the reproduction number (R) and vaccination rates. In the most pessimistic scenario (R = 7.5 and base vaccination rate), the number of incident cases reached a peak of 49,523 (95% CI: 20,599 to 99,362) by day 73, and the peak daily deaths grew to 270 by day 50. The predicted cumulative cases and deaths at the end of the wave were approximately 3.7 million and 22,000, respectively. In the most optimistic assumption (R = 4.5 and speedy vaccination rate), the peak incident cases was about one third the cases in the pessimistic assumption (15,650, 95% CI: 12,688 to 17,603). In the coming months, Thailand may face a new wave of the COVID-19 epidemic due to the Omicron variant. The case toll due to the Omicron wave is likely to outnumber the earlier Delta wave, but the death toll is proportionately lower. Vaccination campaigns for the booster dose should be expedited to prevent severe illnesses and deaths in the population.

1. Introduction

Over the past 2–3 years, the world has recognized the coronavirus disease 2019 (COVID-19) pandemic as one of the most serious health threats in human history. The disease is caused by severe acute respiratory syndrome coronavirus-2 (SARS-CoV-2), which is transmitted by direct contact with droplets containing pathogens and indirect contact with contaminated surfaces [1,2]. The first reported case of COVID-19 was found in China, but then the disease spread rapidly throughout the world and became a global pandemic [3]. In January 2022, the global case toll had reached almost 300 million, with approximately 5.5 million accumulated deaths [4].
A SARS-CoV-2 variant with a significant genetic change from the original strain that demonstrated increased transmissibility and severity and showed evidence of immunity escaped characterized by the World Health Organization (WHO) as a variant of concern (VOC) [5,6]. During the second and the third quarters of 2021, the world was severely hit by the Delta variant, which was first detected in India [7,8]. By late 2021, while the world was hoping to see a promising end to the pandemic as global incident cases gradually subsided, another VOC, the Omicron variant, was reported. It was believed to have numerous mutations, with the potential to increase transmissibility compared with prior variants, and to partially escape infection- or vaccine-induced immunity [9,10,11].
Thailand is among many countries that have been critically affected by the COVID-19 pandemic. The first COVID-19 wave in Thailand occurred during March–May 2020 due to super-spreading events from a boxing stadium and a nightlife hotspot in Bangkok downtown [12]. The second wave originated from a cluster of cases in a shrimp market in the inner city of Samut Sakhon and lasted between December 2020 and February 2021 [12,13]. The third wave was mostly caused by the Alpha variant in April 2021, followed by the fourth wave beginning in June 2021 due to extensive local transmission of the Delta variant [13]. During that time, the Thai government implemented a lockdown policy as a pre-emptive measure to avoid the collapse of the health care system, and COVID-19 vaccines were rapidly rolled out. By early December, the volume of Thais receiving at least one shot of the COVID-19 vaccine numbered about 70% of the total population, the benchmark believed to make the country achieve herd immunity [14].
In December 2021, the Thai Ministry of Public Health (MOPH) declared the discovery of the first imported case of the Omicron variant, and the local transmission of the Omicron variant was confirmed. This situation caused significant concern for the government that the Thai health care system might risk collapsing as during the Delta pandemic.
This study therefore aims to forecast the trends of new cases as well as the death toll and use of health resources for severe cases given the advent of the Omicron variant in Thailand. We hope that the findings of this study will help aid policy decisions for optimal preparation of the country’s health care system in response to the coming pandemic.

2. Materials and Methods

2.1. Study Design

A secondary data analysis was employed. Most parameters used in this study were acquired from the internal database of the Department of Disease Control (DDC) and the Department of Medical Services (DMS). Some basic parameters such as incubation period and infectious duration were obtained from international literature. Parameters reflecting the Thai health care system performance were obtained from expert opinions and model adjustment. The forecasting duration was 120 days. It is worth noting that as the Omicron variant is quite new to the world, some variant-specific parameters were not available at the time of writing. We therefore adopted the parameters specific to the Delta variant instead.

2.2. Model Framework

We employed a compartmental susceptible-exposed-infectious-recovered (SEIR) model and the system dynamics (SD) model to frame the analysis [15,16]. The SEIR model was commonly used to explain the epidemic force in many diseases (such as HIV, influenza, and tuberculosis) long before the COVID-19 pandemic [17,18,19]. The model simply explains the rate of change of the unit of interest from one stage to another. This concept is also in line with the idea of the stock and flow diagram, which is often applied in the SD model. The simplified model framework is demonstrated in Figure 1. We divided the entire Thai population into four groups based on the vaccination profile: (i) the unvaccinated, (ii) the one-dose, (iii) the two-dose, and (iv) the booster (receiving at least three shots of vaccine). In each group, we categorized the population into five subcategories according to the infection status: (i) the susceptible, (ii) the exposed, (iii) the infectious before isolation, (iv) the infectious after isolation, and (v) the recovered. The speed of transfer from the susceptible group to the exposed group was mainly influenced by the reproduction number (R) [20]. The transition from the exposed group to the infectious group depended on the incubation period. We adapted the traditional SEIR model by splitting the infectious group into before isolation and after isolation. The reason behind this is that once admitted to a hospital, an infected person would be isolated by the hospital protocol (supposing no nosocomial infection). The length of stay (LOS) in a hospital influenced the speed of recovery. Among the admitted patients, the prevalence of intubated cases attracted the attention of policy makers the most. This is because the volume of intubated cases represents the reserve capacity of intensive care, while asymptomatic or mild cases are allowed to be isolated at home or in the community according to the current MOPH protocol [21]. We further assumed that some of the intubated cases later died and that no deaths occurred without intubation. An unvaccinated susceptible person encountered two paths, either becoming exposed to the disease or remaining as a susceptible person and receiving the first vaccine shot, which depended on the vaccination rate in the entire population. The same concept also applied for the one-dose, the two-dose, and the booster groups.

2.3. Model Assumptions, Parameters and the Formula

The model was governed by the following assumptions. First, the population was homogenously mixed, allowing for inferring that all susceptible individuals were subject to infection (with varying probabilities conditional on vaccination status). This assumption coincided with present evidence that pointed to the immune–escape property of the Omicron variant [22,23].
Second, in most pandemics, the exact number of initial infectees could hardly be identified. We proposed that the volume of infectees equaled 10,000, about threefold the daily incident cases at the time of this writing. This assumption corresponded with the experience of the DDC outbreak investigators that when a super-spreading event was notified, approximately three to four generations of infection had already passed by.
Third, there existed some degree of underreporting for asymptomatic and mildly symptomatic infectees. The literature suggested that underreporting was common during the surge of the outbreak [24]. The field operations of the Rural Doctor Society of Thailand in mid-2020 affirmed that from an active screening, over 13% of people in high-density communities in Bangkok were found infected with COVID-19 but their records were not present in the official MOPH infectee list [16]. However, we postulated that there was no underreporting of intubated cases and deaths.
Fourth, recent evidence affirmed that the Omicron variant is transmitted more easily and faster than the Delta variant. Based on the model calibration against the incident cases during the peak of the Delta epidemic (July–December 2021), we found the value of 1.38 best represented the R for the entire population. We further proposed that if the Omicron variant caused another epidemic wave in Thailand, its R value would be about 3.1–5.4 times larger than that of the Delta variant [25,26]. These figures were later used to construct the model scenarios.
Fifth, in reality, the R did not remain constant over time due to social adaptability and various social measures. We postulated that it took 15 days for the R of the Omicron variant to climb from the current R in Thailand at the time of this writing (0.86) to reach the set value (fourth assumption) and that then it naturally dropped by two points within 60 days later.
Fifth, the R was influenced by two key factors: (i) the vaccine effectiveness (VE) against any infection and (ii) the contact rate of the people in the society. The COVID-19 vaccine not only acted on the probability of susceptibility to being exposed but also altered the severity profile of the infectious compartment (reducing the probability of becoming severe cases or deaths). Since no officially published report of the VE against the Omicron infection in Thailand had come out yet, we used the VE of the viral-vector vaccines in the UK instead (also the same vaccine type widely administered in Thailand) [27].
Sixth, we used the vaccination rate as of late 2021 as a base vaccination rate in the population and assumed that this remained unchanged throughout the study course. We touched upon the vaccination rate again in the later section, “Model scenarios and interested outcomes”. The COVID-19 vaccines were administered only when an individual lay in the susceptible state.
Lastly, and linked to the fifth assumption, the contact rate of individuals depended on the magnitude of the outbreak. Social measures and individual protective behaviors become stricter when the volume of incident cases enlarges. This idea concurred with the fact that the mobility trend (using public transport use as a proxy) of Thai individuals diminished by 68% during the Delta epidemic compared with the pre-COVID-19 era. By December 2021, when the Delta epidemic declined, the mobility trend declined by 25% relative to before 2020 [28]. We therefore added a parameter reflecting the effectiveness of social measures in the model.
We used Microsoft Excel and Stella 2.0 (number: 251-401-786-859) for model execution. Table 1 and Table 2 exhibit the important parameters and formulas of the model.

2.4. Model Scenarios and Interested Outcomes

We focused on the following outcomes: (i) daily reported incident cases, (ii) daily deaths, (iii) prevalent intubated cases (requiring invasive ventilator), (iv) cumulative case toll and (v) cumulative death toll. These outcomes were commonly used by the MOPH to gauge the health care burden. We constructed the interested scenarios by varying the values of R (highly transmitted [R = 4.3] versus very highly transmitted [R = 7.5]) and the vaccination rate (base pace (as shown in Table 1) versus speedy pace [three times faster than the base pace]) (Table 3). Scenario 1 was most pessimistic, whereas scenario 4 was most optimistic. Scenarios 2–3 were between the two ends. The model was run 100 times for each scenario, using infectious duration and incubation period as the sensitivity parameters.

3. Results

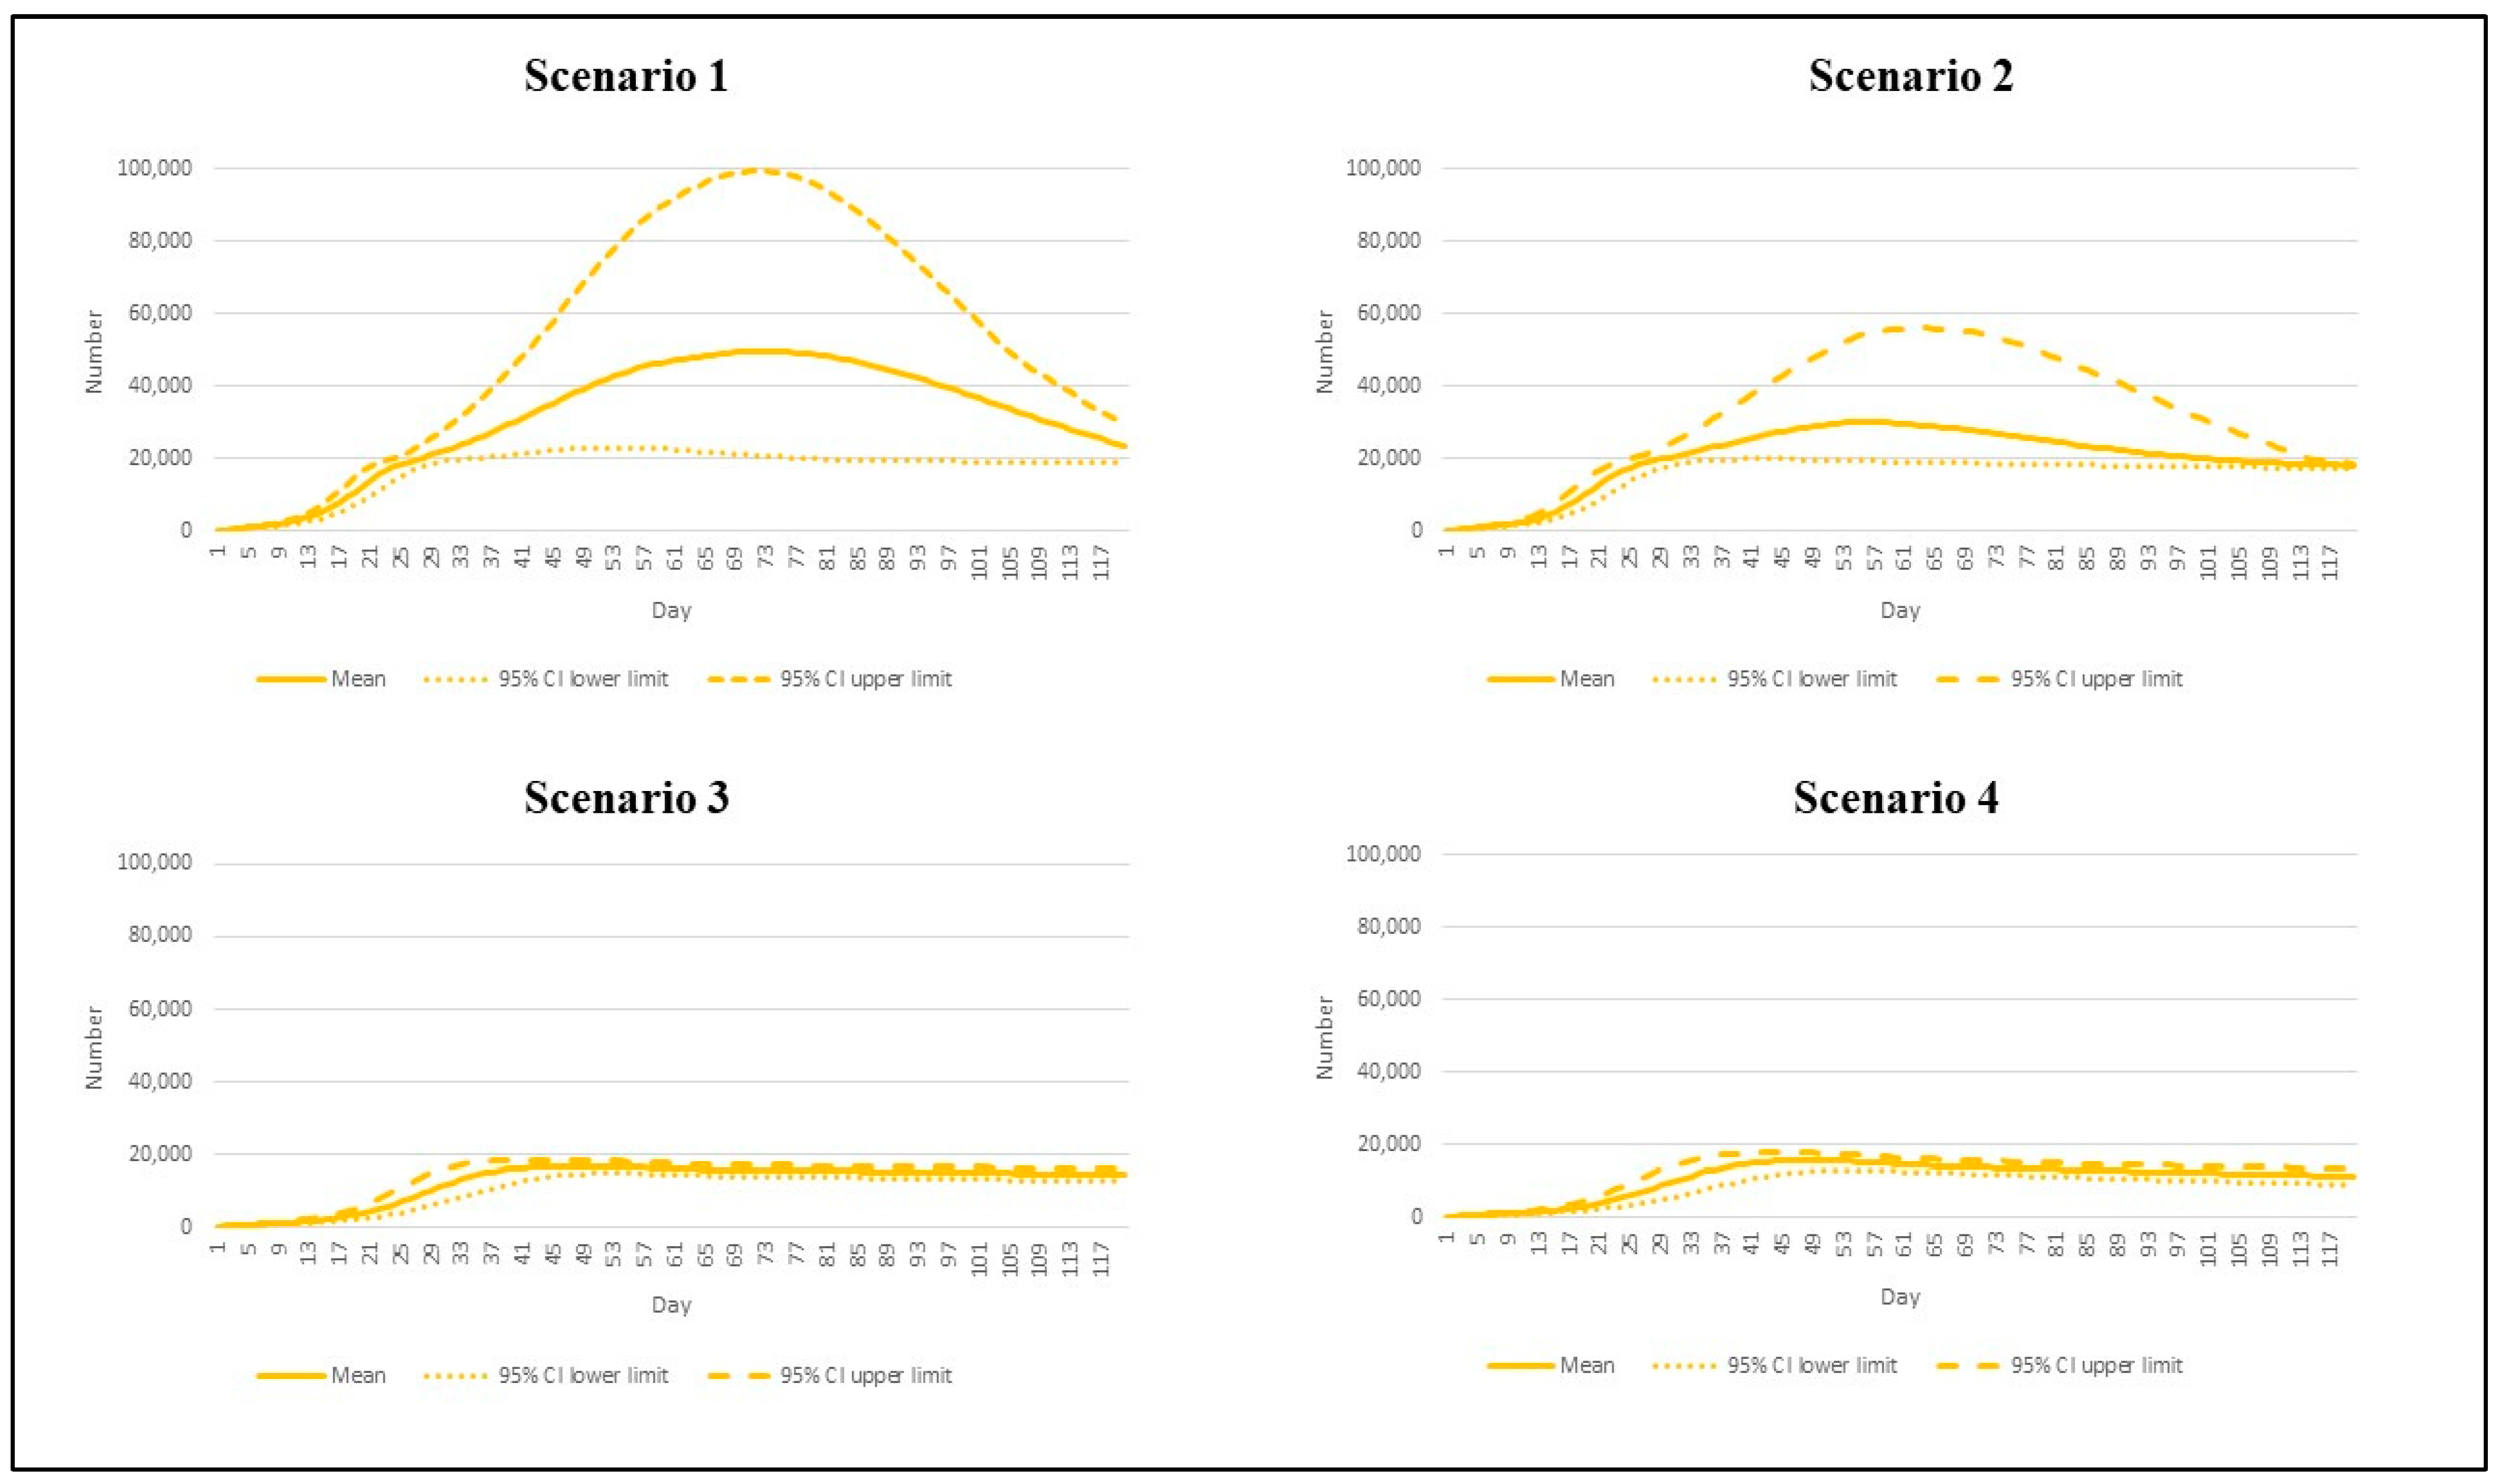
We first presented the number of estimated daily reported cases in Figure 2. In the most pessimistic scenario (scenario 1), the peak daily incident cases exceeded other scenarios. The incident cases reached 49,523 per day by day 73 (95% CI: 20,599 to 99,362). Scenario 2, where the vaccination rate was sped up but the R remained high (7.5), saw the peak incident cases of 30,025 (95% CI: 19,358 to 54,317). With the R dipping down to 4.3 in scenarios 3 and 4, we found the peaks of the daily new cases at 16,889 (95% CI: 14,644 to 18,437) and 15,650 (95% CI: 12,688 to 17,603), respectively, by about day 50.
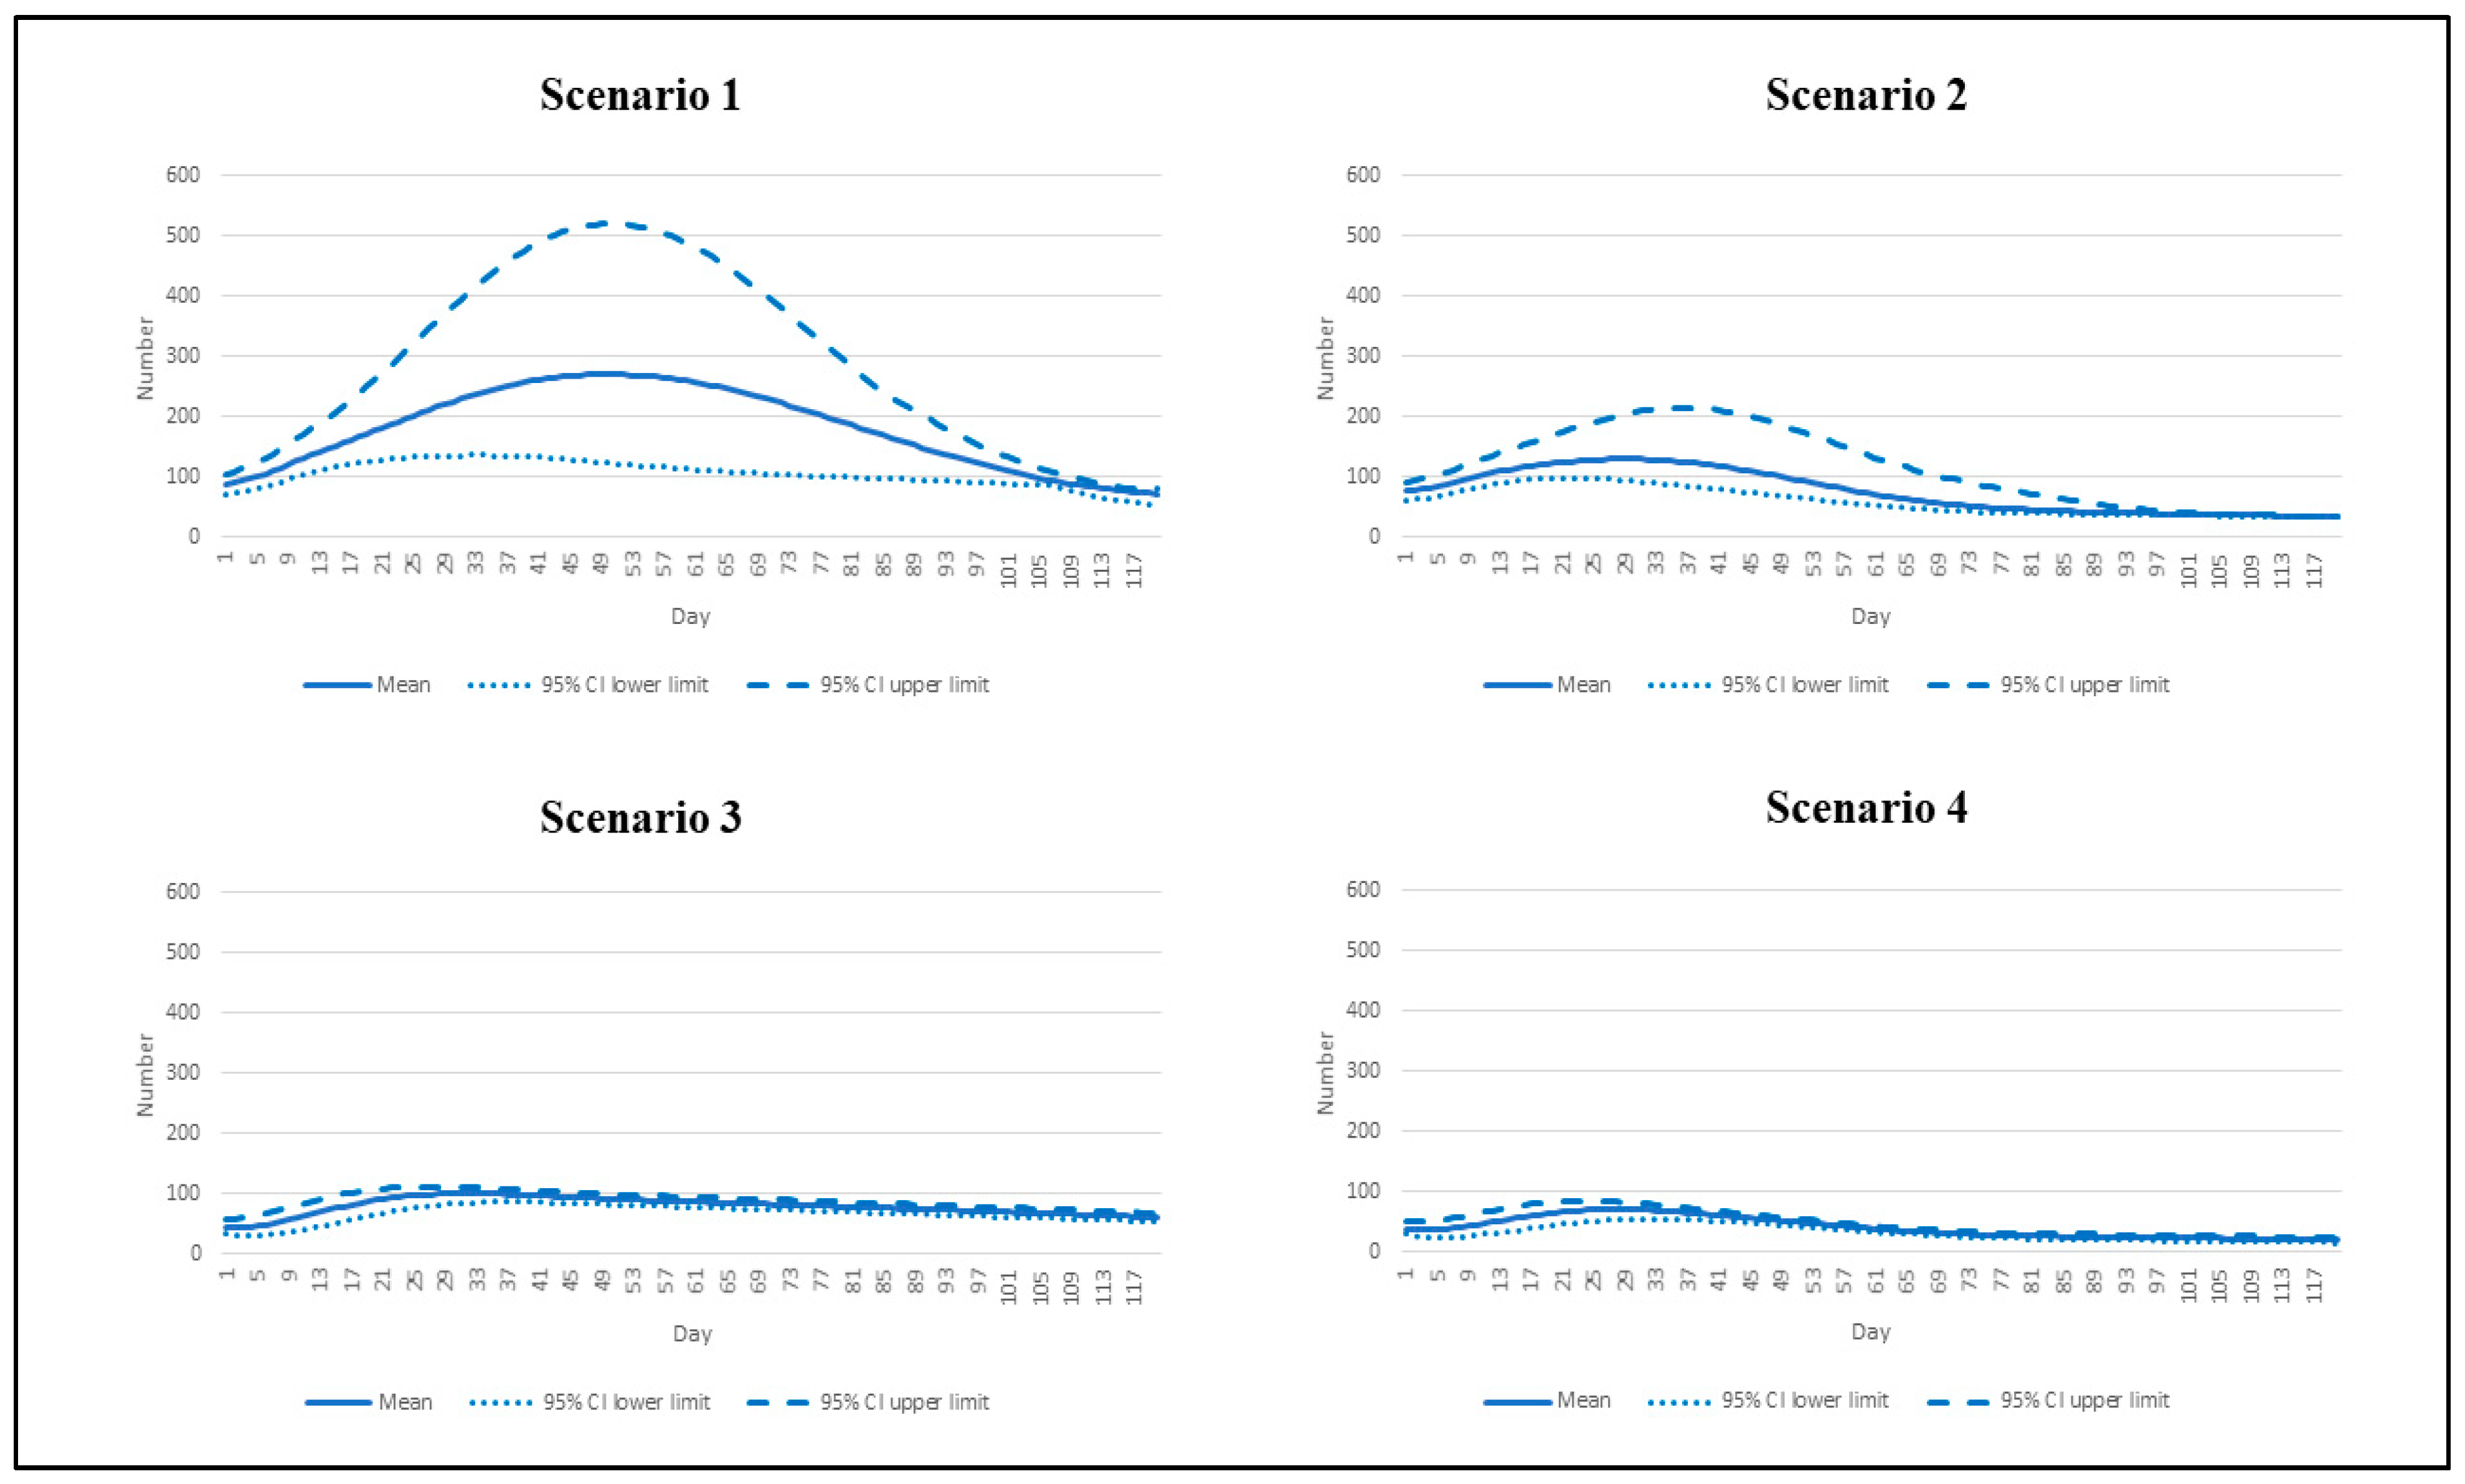
For the daily deaths, the number exceeded 100 by day 5 and reached the peak at 270 (95% CI: 126 to 518) by about day 50 in scenario 1. The second-highest toll presented in scenario 2 with a peak of 129 deaths by approximately day 30 (95% CI: 91 to 211). Scenarios 3 and 4 demonstrated almost the same pattern over the course of the analysis. Scenario 4 showed the smallest number of peak daily deaths relative to the other scenarios (72 deaths by day 28, 95% CI: 54 to 84) (Figure 3).
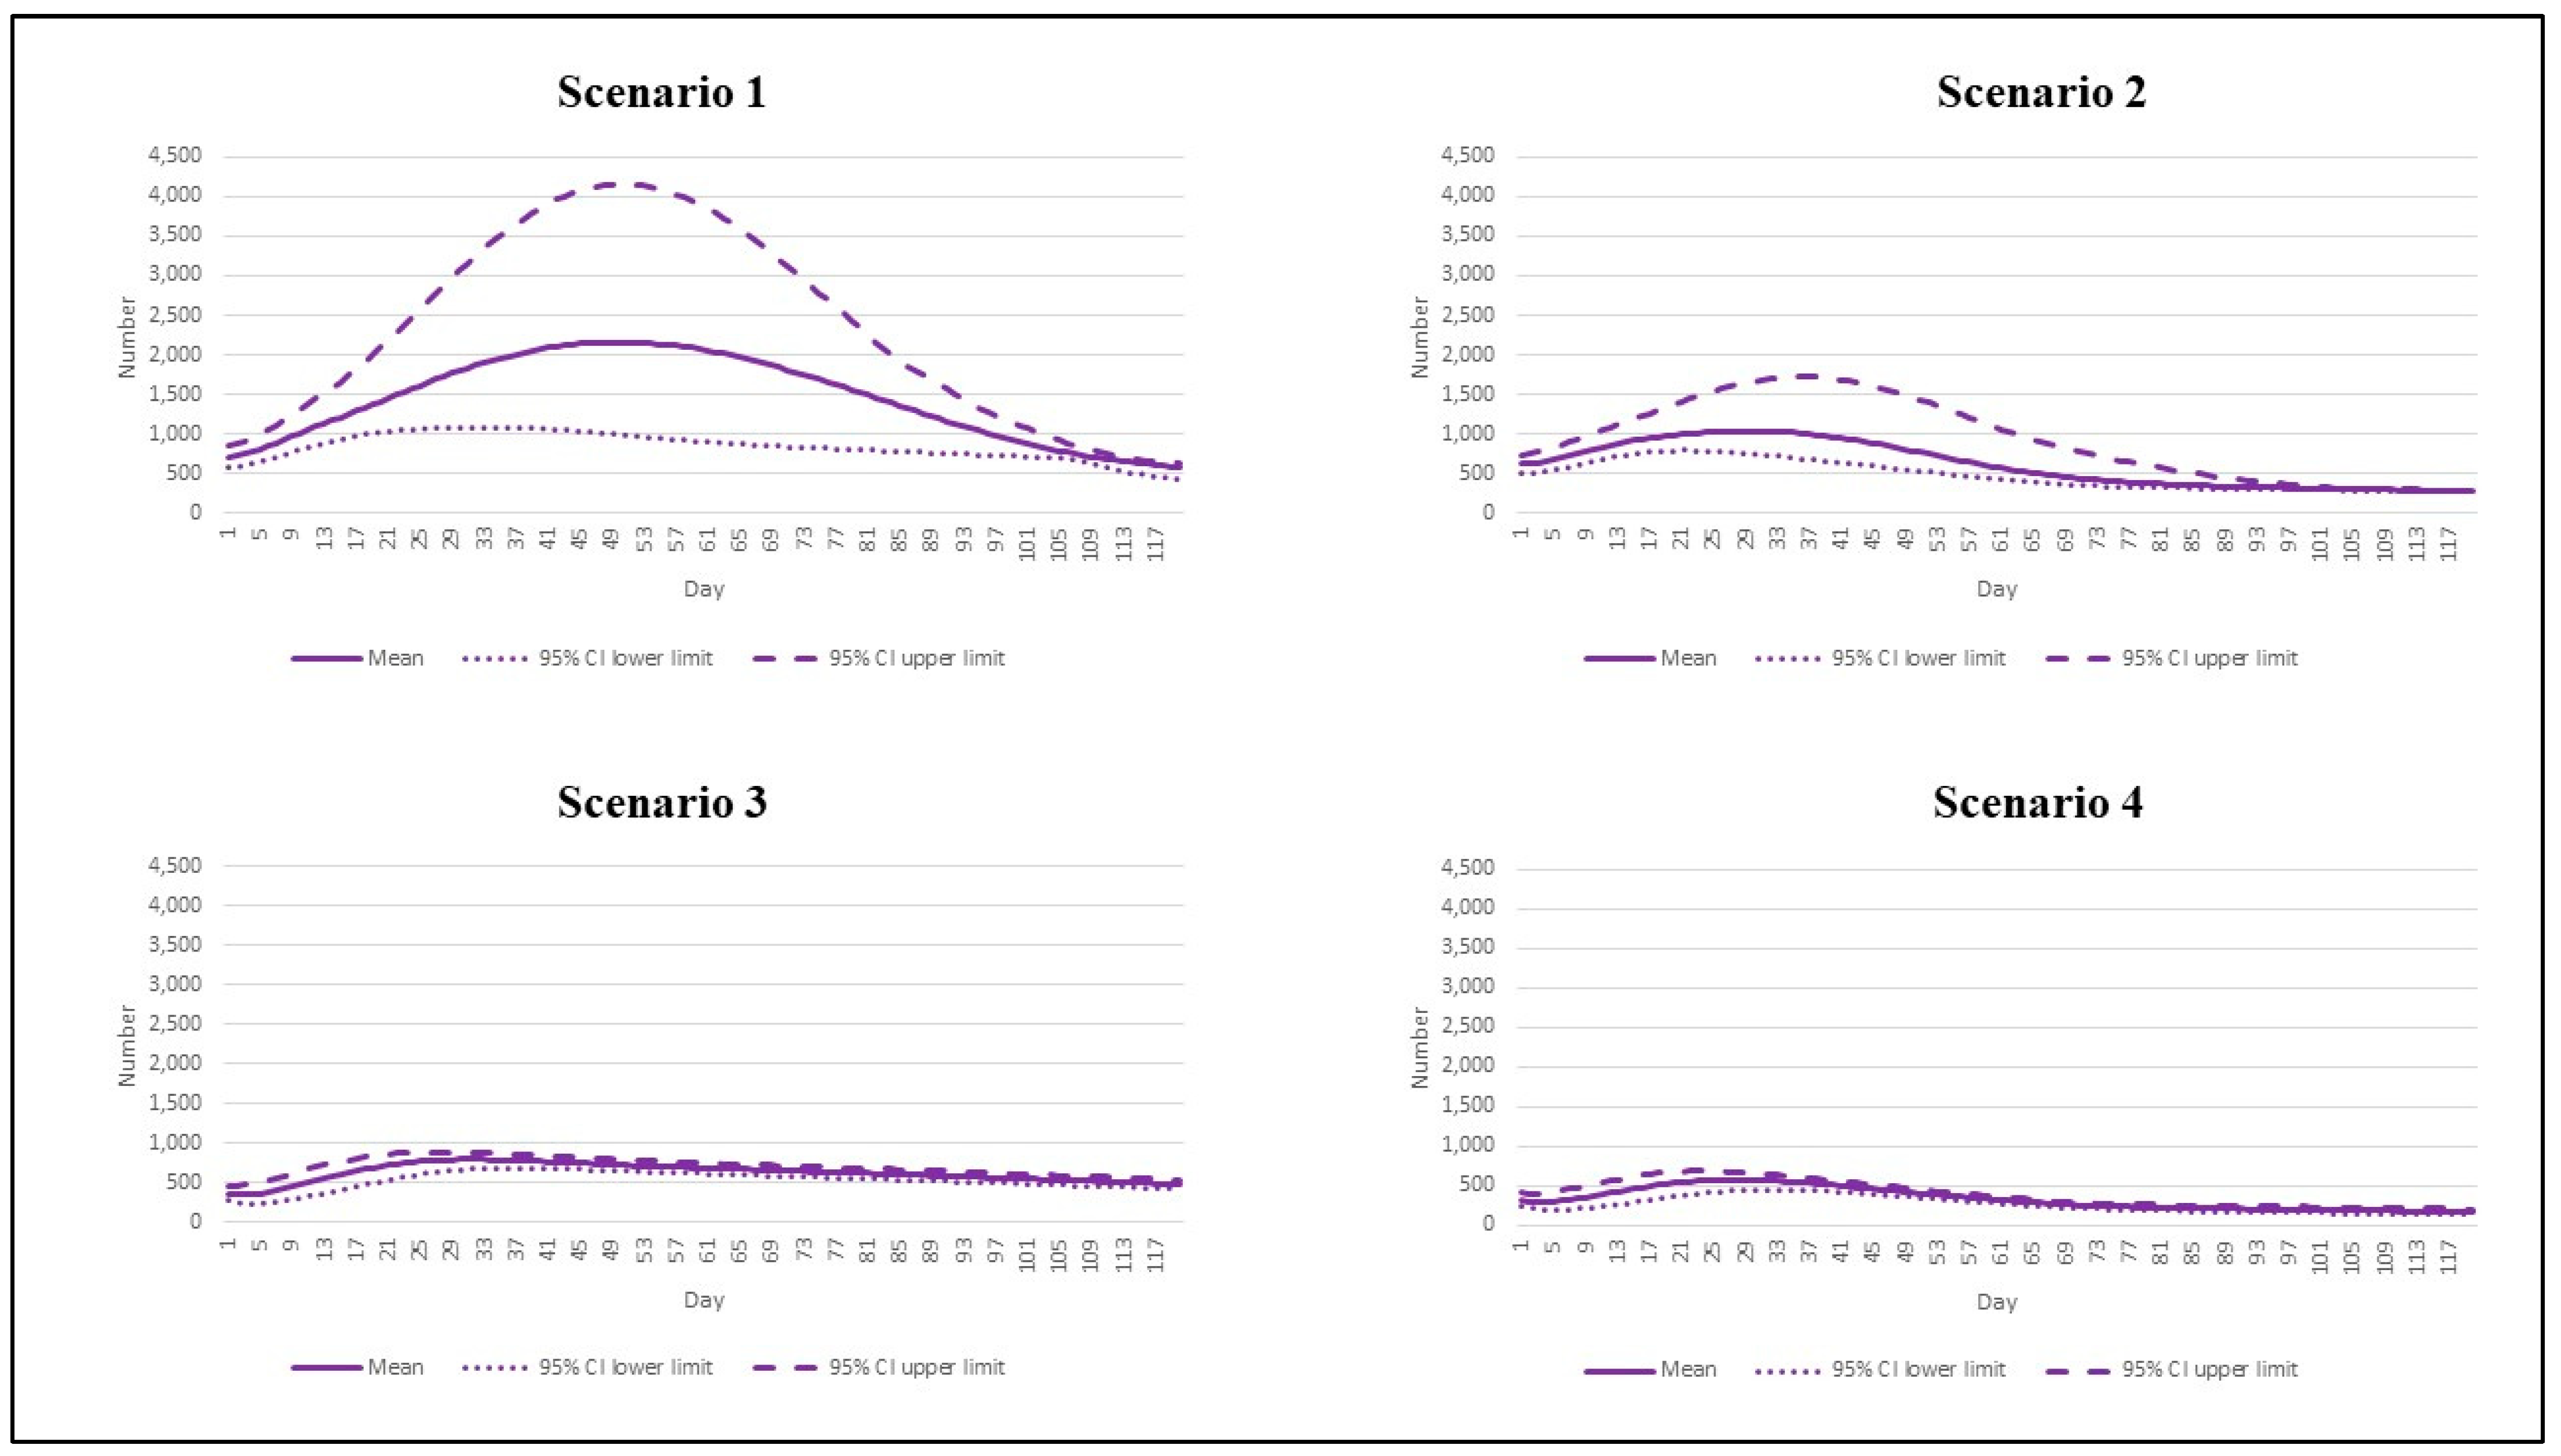
The prevalence of intubated cases followed the same pattern as the daily deaths. Scenario 1 saw the highest number of prevalent intubated cases (2161 cases by 50, 95% CI: 987 to 4161). Scenario 2 exhibited the second-highest peak, following scenario 1. The peak number reached 1035 by day 30 (95% CI: 743 to 1658). In scenario 3, the peak dropped to 800 during days 31–32 (95% CI: 675 to 888), and this further dipped to 572 in scenario 4 (95% CI interval: 429 to 675) (Figure 4).
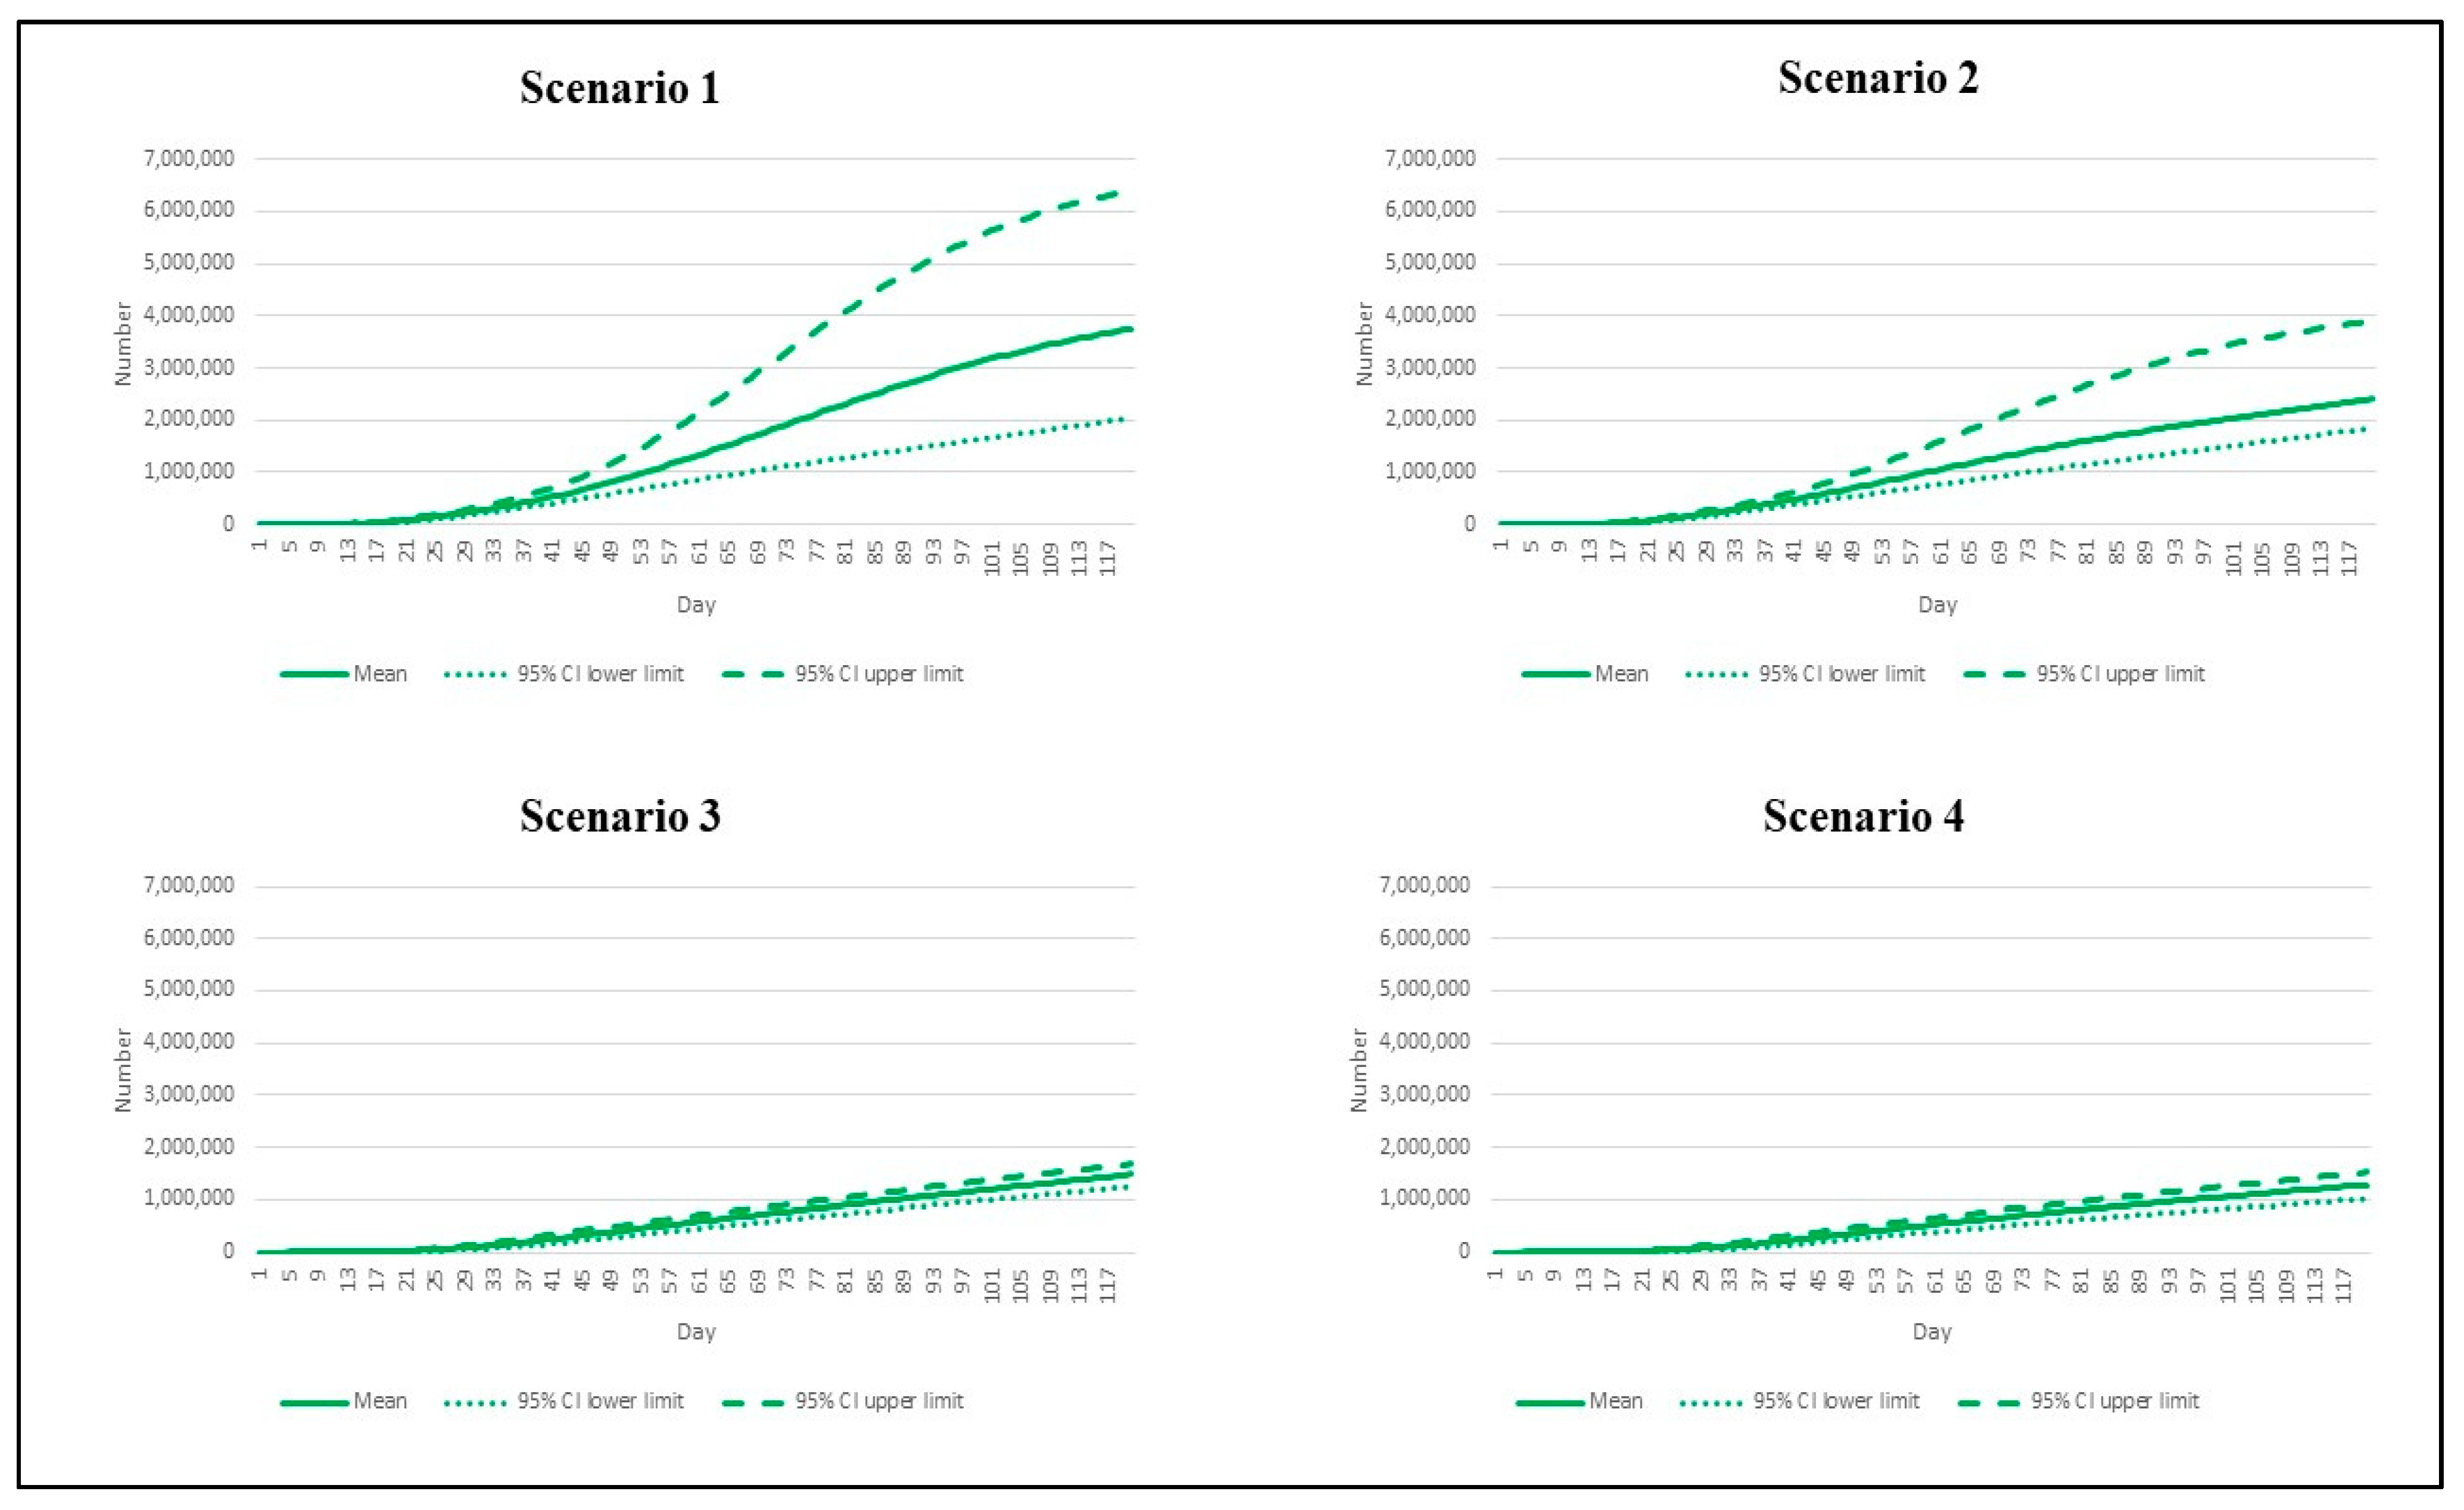
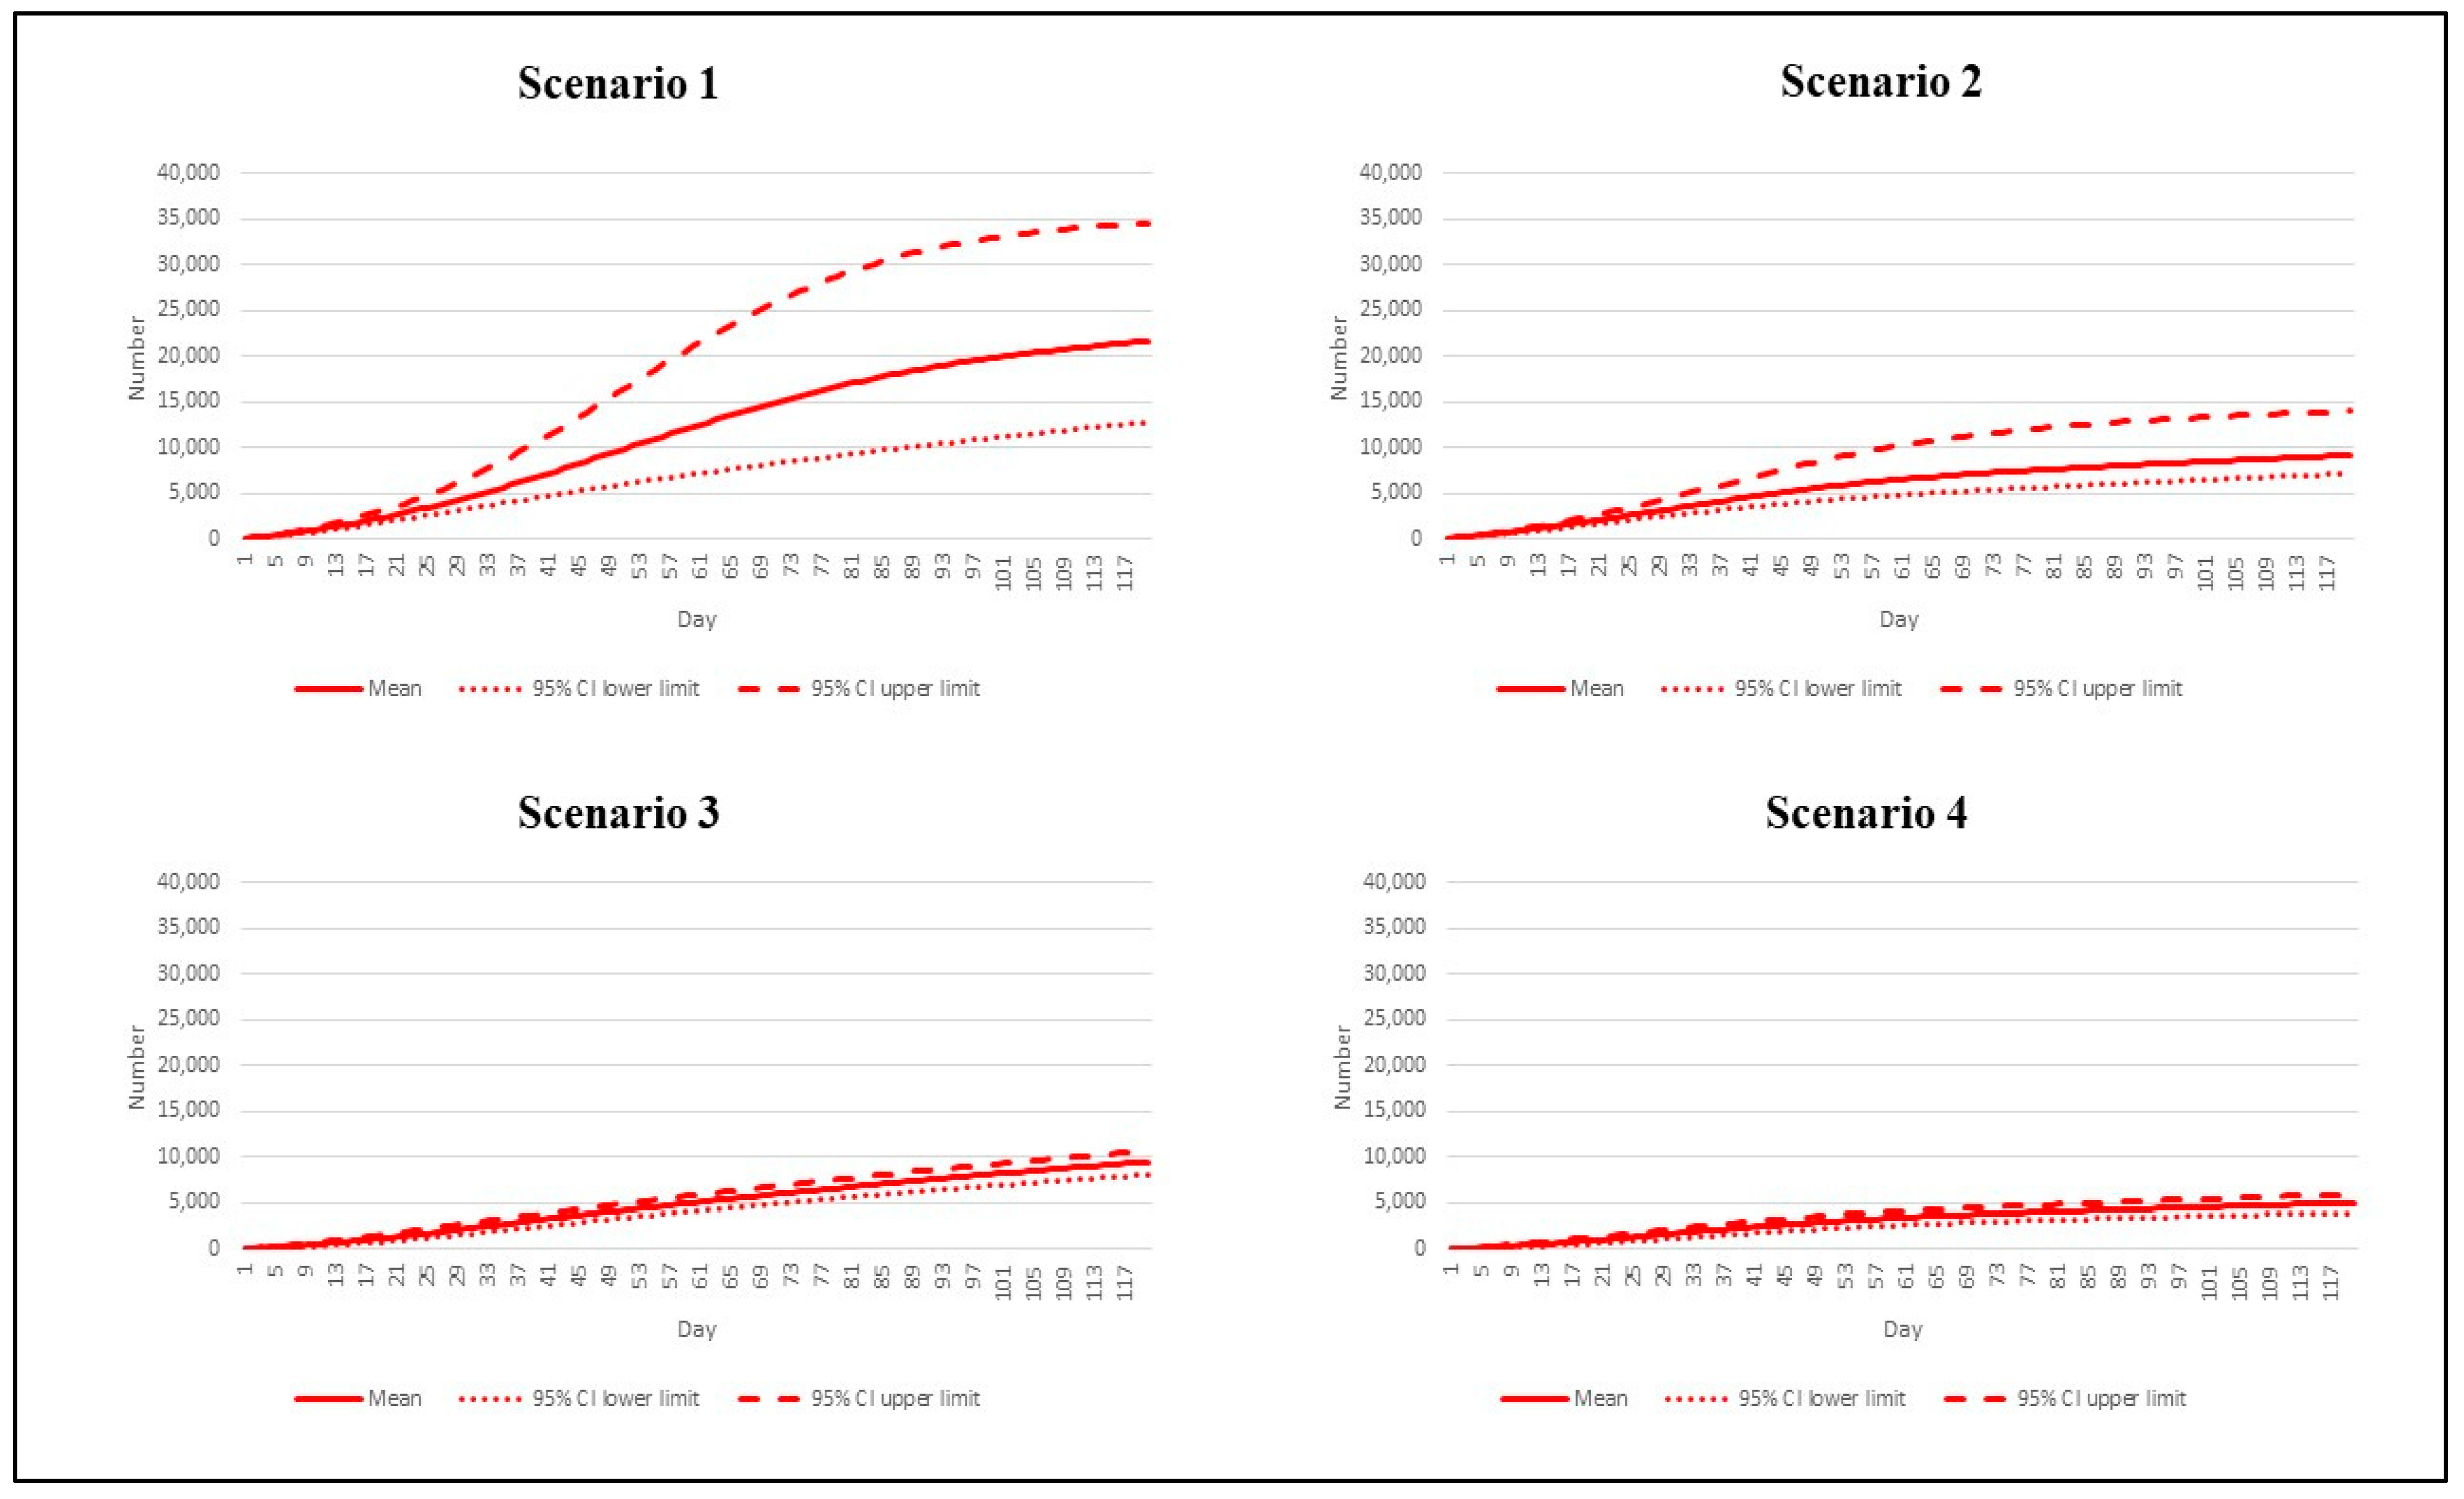
The mean of cumulative incident cases by day 120 accounted for approximately 3.7 million (95% CI: 2,035,674 to 6,401,118). This number was about threefold higher than the mean cumulative cases in scenario 4 (about 1.3 million, 95% CI: 1,016,258 to 1,521,434). The mean cumulative case toll in scenarios 2–3 was between 1.5 million and 2.4 million (Figure 5).
Like other indicators, by day 120, scenario 1 presented the largest mean cumulative deaths at 21,649 (95% CI: 12,812 to 34,566). The mean death toll in scenario 4 was 4,996 (95% CI: 3922–5948), just a quarter of scenario 1’s figure. Scenarios 2–3 showed almost the same volume of cumulative deaths, between 9163 and 9467, by the end of the study period (Figure 6).

4. Discussion

Overall, the results suggest that the advent of the Omicron variant in Thailand may lead to a sharp increase in SARS-CoV-2 transmission. In the pessimistic scenario where the Omicron variant is very highly transmissible and the vaccination rate continues at the current pace, the peak incident cases may far exceed the 2021 Delta wave peak (~50,000 versus 22,000 cases a day). However, daily deaths due to Omicron epidemic may not outstrip the deaths in the Delta wave (~270 versus 300 deaths during the peak).
Our findings are in line with the current Omicron epidemic in numerous countries. The US has just faced a record high of daily new cases. About one million cases hit the US within a day in the beginning week of 2022 as hospitalization records approached 123,000, almost on par with the record high [32]. However, deaths remained fairly stable at about 1400 a day, well below the previous epidemic [32]. The UK also experienced a rapid surge of the people infected with the Omicron variant, bringing the UK total cases during the first week of 2022 to almost 1.3 million, about 30% higher than the week before [33]. The fourth epidemic wave in South Africa, caused by the Omicron variant, exhibited a peak of about 23,000 daily new cases, about one fifth greater than the earlier peak in June 2021 [34].
Concerning policy implication, this research informs us that although with a pessimistic assumption, the death toll may not exceed the prior peak, a large number of cases should not be overlooked because the volume of severe cases could skyrocket in proportion to the case toll. In the worst scenario, the need for ventilators almost reaches 2500 people per day by day 50. Such a demand has already surpassed the nationwide ventilator reserve, which is set at about 2200. Note that the reserve is for all patients needing invasive ventilators, not only COVID-19 cases. During the peak of the Delta wave, the prevalent intubated cases soared to about 1200 a day. With this demand, the Thai health care system was already stretched as most hospitals were in dire lack of intensive care beds and ventilators [35]. Another consideration is that the consumption of invasive ventilators by COVID-19 cases partly means a compromise in the quality of care for other patients [36,37].
This study also affirms the value of vaccinations to fight the Omicron variant. The peak of daily cases in scenario 2, in which we assumed very high transmissibility of the Omicron variant, is approximately 40% lower than the peak in scenario 1. Note that the benefit of vaccination diminishes when comparing scenario 4 with scenario 3 as the force of the epidemic was presumed to be less severe. This finding aligns with the latest evidence from the Canada and the UK, which suggests that despite the immune-escape characteristic of the Omicron variant, the third dose of COVID-19 vaccine provides some protection at least in the immediate term [38,39]. The bottom line is that now Thailand is witnessing vaccine administration at about 320,000 doses a day, still far lower than the maximum capacity of 1,000,000 doses a day, the figure set by the government as a campaign to beat the Delta wave last year [40]. Policy-wise, policy makers should consider the results from this study as part of the input for policy decision-making, especially for health resource planning. While recognizing context difference between countries, the findings from this study are still worth learning in terms of lessons from other nations. Some key lessons include that accelerating vaccine roll-out and maintaining a high degree of social measures can help alleviate the case burden. Additionally, from a technical perspective, academics from other countries could apply a compartmental model in combination with a SD model, as in this study, to estimate the volumes of cases and deaths from COVID-19 in their own setting.
This study is subject to some limitations. First, we did not account for the granular differences in the transmission rate of the Omicron variant across provinces. Moreover, we did not consider the impact of localized interventions. Second, we postulated a constant proportion of severe cases over the course of analysis. This may not be the case as the case fatality rate and the proportion of patients encountering severe conditions may increase during the period of high strain on health care facilities. Third, the analysis was surrounded by numerous uncertainties of the assumptions and the parameters. Knowledge of the Omicron variant, both in virology and in public health, is yet to be confirmed. Moreover, it is possible that new subvariants may emerge as genetic mutation is a common phenomenon of the virus. An obvious example is the advent of sub-lineages BA.4 and BA.5 of the omicron variant, which gained attention in the field of public health after the study was completed. The latest evidence showed moderate immunity escape of sub-lineages BA.5 and BA.5. However, there were no significant differences in terms of observed clinical severity and hospitalization rate between BA.4 and BA.5 and other Omicron sub-lineages [41]. If BA.4 and BA.5 sub-lineages were circulating in the study population, the forecasted case toll would be underestimated. Therefore, regular updating on the basic biological knowledge of the virus should be pursued as this will make the finding more robust and better fit to the current situation. Lastly, like in many other modelling studies, we de-constructed the force of the epidemic into various components, including contact rate, immunization rate, and vaccine effectiveness, to identify public health implications. However, we realized that it is extremely difficult to disentangle the biological characteristics of the virus from the social interventions or to exactly ascribe the epidemic phenomenon to a particular determinant. A clear example is the R, which is not a biological constant of a pathogen as it is also influenced by many other determinants, such as environmental conditions and behaviors of the infectees. Thus, the results should be interpreted with caution.

5. Conclusions

Under the most pessimistic presumption, the Omicron epidemic in Thailand may cause a peak of daily incident cases of about 50,000 by day 73. The peak daily death toll may reach 270 by day 50, corresponding with the peak prevalent intubated cases at about 2200. The acceleration of vaccine rollout will push down daily cases by up to 40% and the death toll by up to 55%. These figures should be used as input for the planning of health care resource allocation, especially intensive-care beds and respiratory ventilators, to meet the high demand of care given the coming Omicron epidemic. A national campaign to expedite vaccination rollout alongside an emphasis on the importance of individuals keeping a high protective guard is recommended.

Supplementary Materials

The following are available online at https://www.mdpi.com/article/10.3390/vaccines10071024/s1, Figure S1: Percentage decrease of contact rate in relation to daily incident cases under the Omicron variant epidemic (base case)—reflecting effectiveness of non-pharmaceutical interventions.

Author Contributions

Conceptualization, R.S. and P.T.; data curation, R.S. and M.P.; formal analysis, R.S., N.N. and M.P.; funding acquisition, R.S., N.N. and N.C.; investigation; R.S., N.N. and M.P.; methodology, R.S. and P.T.; project administration, R.S. and N.C.; resources; R.S., N.N. and N.C.; supervision, R.S. and P.T.; writing—original draft, R.S. and N.C.; writing—review and editing, R.S., N.N. and N.C. All authors have read and agreed to the published version of the manuscript.

Funding

This study is funded by Field Epidemiology Training Program, Division of Epidemiology, Department of Disease Control, Ministry of Public Health, Thailand, in collaboration with Thailand MOPH–U.S.CDC Collaboration (TUC) Cooperative Agreement.

Institutional Review Board Statement

As this study used only secondary data available in the international literature and the database of the DDC and did not involve human participation, ethics approval was not required. However, we strictly conformed with the principles of ethical standards stipulated in the Declaration of Helsinki. The findings were presented in a way to prevent identifying an individual.

Informed Consent Statement

Not applicable.

Data Availability Statement

Not applicable.

Acknowledgments

We are extremely grateful for the support of the DDC staff in terms of advice and data provision. We also thank the MOPH International Health Policy Program for the offer of office space and computational software. The interpretation and conclusions contained in this study are those of the authors alone and do not always reflect the view of the agencies the authors are affiliated with.

Conflicts of Interest

The authors declare that there are no conflict of interest.

References

  1. World Health Organization. Coronavirus Disease (COVID-19); WHO: Geneva, Switzerland, 2021; Available online: https://www.who.int/health-topics/coronavirus#tab=tab_1 (accessed on 23 December 2021).
  2. Mohamadi, M.; Babington-Ashaye, A.; Lefort, A.; Flahault, A. Risks of Infection with SARS-CoV-2 Due to Contaminated Surfaces: A Scoping Review. Int. J. Environ. Res. Public Health 2021, 18, 11019. [Google Scholar] [CrossRef] [PubMed]
  3. Wuhan Municipal Health Commission. Report on Current Pneumonia Epidemic Situation in the City. 2019. Available online: http://wjw.wuhan.gov.cn/front/web/showDetail/2019123108989 (accessed on 23 December 2021). (In Chinese)
  4. World Health Organization. Weekly Epidemiological Update on COVID-19—21 December 2021; WHO: Geneva, Switzerland, 2021; Available online: https://www.who.int/publications/m/item/weekly-epidemiological-update-on-covid-19---21-december-2021 (accessed on 23 December 2021).
  5. Choi, J.Y.; Smith, D.M. SARS-CoV-2 Variants of Concern. Yonsei Med. J. 2021, 62, 961–968. [Google Scholar] [CrossRef] [PubMed]
  6. World Health Organization. Tracking SARS-CoV-2 Variants; WHO: Geneva, Switzerland, 2022; Available online: https://www.who.int/en/activities/tracking-SARS-CoV-2-variants/ (accessed on 3 January 2022).
  7. Chookajorn, T.; Kochakarn, T.; Wilasang, C.; Kotanan, N.; Modchang, C. Southeast Asia is an emerging hotspot for COVID-19. Nat. Med. 2021, 27, 1495–1496. [Google Scholar] [CrossRef] [PubMed]
  8. Novelli, G.; Colona, V.L.; Pandolfi, P.P. A focus on the spread of the delta variant of SARS-CoV-2 in India. Indian J. Med. Res. 2021, 153, 537–541. [Google Scholar] [CrossRef]
  9. Torjesen, I. COVID-19: Omicron may be more transmissible than other variants and partly resistant to existing vaccines, scientists fear. BMJ 2021, 375, n2943. [Google Scholar] [CrossRef]
  10. Karim, S.S.A.; Karim, Q.A. Omicron SARS-CoV-2 variant: A new chapter in the COVID-19 pandemic. Lancet 2021, 398, 2126–2128. [Google Scholar] [CrossRef]
  11. Thakur, V.; Ratho, R.K. OMICRON (B.1.1.529): A new SARS-CoV-2 variant of concern mounting worldwide fear. J. Med. Virol. 2021, 94, 1821–1824. [Google Scholar] [CrossRef]
  12. Rajatanavin, N.; Tuangratananon, T.; Suphanchaimat, R.; Tangcharoensathien, V. Responding to the COVID-19 second wave in Thailand by diversifying and adapting lessons from the first wave. BMJ Glob. Health 2021, 6, e006178. [Google Scholar] [CrossRef]
  13. Uansri, S.; Tuangratananon, T.; Phaiyarom, M.; Rajatanavin, N.; Suphanchaimat, R.; Jaruwanno, W. Predicted Impact of the Lockdown Measure in Response to Coronavirus Disease 2019 (COVID-19) in Greater Bangkok, Thailand, 2021. Int. J. Environ. Res. Public Health 2021, 18, 12816. [Google Scholar] [CrossRef]
  14. Reuters. Thailand Aims to Vaccinate 70% of People by September; Reuters: Bangkok, Thailand, 2021; Available online: https://www.reuters.com/business/healthcare-pharmaceuticals/thailand-aims-vaccinate-70-people-by-september-2021-05-19/ (accessed on 3 January 2022).
  15. Dietz, K. The estimation of the basic reproduction number for infectious diseases. Stat. Methods Med. Res. 1993, 2, 23–41. [Google Scholar] [CrossRef]
  16. Davahli, M.R.; Karwowski, W.; Taiar, R. A system dynamics simulation applied to healthcare: A Systematic Review. Int. J. Environ. Res. Public Health 2020, 17, 5741. [Google Scholar] [CrossRef] [PubMed]
  17. Das, K.; Murthy, B.S.N.; Samad, S.A.; Biswas, M.H.A. Mathematical transmission analysis of SEIR tuberculosis disease model. Sens. Int. 2021, 2, 100120. [Google Scholar] [CrossRef]
  18. Tan, X.; Yuan, L.; Zhou, J.; Zheng, Y.; Yang, F. Modeling the initial transmission dynamics of influenza A H1N1 in Guangdong Province, China. Int. J. Infect. Dis. 2013, 17, e479-e84. [Google Scholar] [CrossRef] [Green Version]
  19. Wang, J.-j.; Reilly, K.H.; Luo, J.; Zang, C.-p.; Wang, N. Dynamic mathematical models of HIV/AIDS transmission in China. Chin. Med. J. 2010, 123, 2120–2127. [Google Scholar] [PubMed]
  20. Department of Disease Control Ministry of Public Health Thailand. Corona Virus Disease (COVID-19): Thailand Situation. 2021. Available online: https://ddc.moph.go.th/viralpneumonia/eng/index.php (accessed on 26 August 2021).
  21. National Health Security Office. NHSO Launches Supported Home and Community Isolation, Ramps up Rapid COVID-19 Tests; NHSO: Bangkok, Thailand, 2011. Available online: https://eng.nhso.go.th/view/1/DescriptionNews/NHSO-launches-supported-home-and-community-isolation-ramps-up-rapid-COVID-19-tests/354/EN-US (accessed on 5 January 2022).
  22. Zhang, X.; Wu, S.; Wu, B.; Yang, Q.; Chen, A.; Li, Y.; Zhang, Y.; Pan, T.; Zhang, H.; He, X. SARS-CoV-2 Omicron strain exhibits potent capabilities for immune evasion and viral entrance. Signal Transduct. Target. Ther. 2021, 6, 430. [Google Scholar] [CrossRef]
  23. Zhang, L.; Li, Q.; Liang, Z.; Li, T.; Liu, S.; Cui, Q.; Nie, J.; Wu, Q.; Qu, X.; Huang, W.; et al. The significant immune escape of pseudotyped SARS-CoV-2 variant Omicron. Emerg. Microbes Infect. 2022, 11, 1–5. [Google Scholar] [CrossRef]
  24. Brauer, F. Compartmental Models in Epidemiology. In Mathematical Epidemiology; Brauer, F., van den Driessche, P., Wu, J., Eds.; Lecture Notes in Mathematic; Springer: Berlin/Heidelberg, Germany, 2008; Volume 1945. [Google Scholar]
  25. Ito, K.; Piantham, C.; Nishiura, H. Relative Instantaneous Reproduction Number of Omicron SARS-CoV-2 variant with respect to the Delta variant in Denmark. J. Med. Virol. 2021, 94, 2265–2268. [Google Scholar] [CrossRef]
  26. Head, E.; van Elsland, S. Omicron Largely Evades Immunity from Past Infection or Two Vaccine Doses; Imperial College: London, UK, 2021; Available online: https://www.imperial.ac.uk/news/232698/omicron-largely-evades-immunity-from-past/ (accessed on 5 January 2022).
  27. Barnard, R.C.; Davies, N.G.; Pearson, C.A.B.; Jit, M.; Edmunds, W.J. Projected epidemiological consequences of the Omicron SARS-CoV-2 variant in England, December 2021 to April 2022. medRxiv 2021. [Google Scholar] [CrossRef]
  28. Our World in Data. COVID-19: Google Mobility Trends; Our World in Data: Oxford, UK, 2021; Available online: https://ourworldindata.org/covid-google-mobility-trends (accessed on 6 January 2022).
  29. National Statistical Office of Thailand. Demographic and Household Statistics; Bangkok Report; 2021. Available online: http://statbbi.nso.go.th/staticreport/page/sector/th/01.aspx (accessed on 15 July 2021).
  30. Hart, W.S.; Miller, E.; Andrews, N.J.; Waight, P.; Maini, P.K.; Funk, S.; Thompson, R.N. Generation time of the Alpha and Delta SARS-CoV-2 variants. medRxiv 2021. [Google Scholar] [CrossRef]
  31. Helmsdal, G.; Hansen, O.K.; Møller, L.F.; Christiansen, D.H.; Petersen, M.S.; Kristiansen, M.F. Omicron outbreak at a private gathering in the Faroe Islands, infecting 21 of 33 triple-vaccinated healthcare workers. medRxiv 2021. [Google Scholar] [CrossRef]
  32. Caspani, M.; Stapleton, S. Omicron Surge Pushes U.S. COVID Hospitalizations toward Record High; Reuters: London, UK, 2022; Available online: https://www.reuters.com/world/us/omicron-pushes-us-covid-hospitalizations-toward-record-high-2022-01-07/ (accessed on 8 January 2022).
  33. UK Health Security Agency. Weekly National Influenza and COVID-19 Surveillance Report: Week 1 Report (Up to Week 52 Data) 6 January 2022; UK Health Security Agency: London, UK, 2022. Available online: https://assets.publishing.service.gov.uk/government/uploads/system/uploads/attachment_data/file/1045027/Weekly_Flu_and_COVID-19_report_w1.pdf (accessed on 8 January 2022).
  34. BBC News. South Africa Says Omicron Wave May Have Peaked; BBC: London, UK, 2022; Available online: https://www.bbc.com/news/world-africa-59832843 (accessed on 8 January 2022).
  35. Aljazeera. Hospitals in Thailand Short of Beds as COVID Cases Soar: Ministry; Aljazeera: Bangkok, Thailand, 2021; Available online: https://www.aljazeera.com/news/2021/7/29/hospitals-in-thailand-short-of-beds-as-covid-cases-soar-ministry (accessed on 9 January 2022).
  36. Barach, P.; Fisher, S.D.; Adams, M.J.; Burstein, G.R.; Brophy, P.D.; Kuo, D.Z.; Lipshultz, S.E. Disruption of healthcare: Will the COVID pandemic worsen non-COVID outcomes and disease outbreaks? Prog. Pediatr. Cardiol. 2020, 59, 101254. [Google Scholar] [CrossRef] [PubMed]
  37. Clerk, A.M. Beware of Neglect of Non-COVID Patients in COVID Era. Indian J. Crit. Care Med. 2021, 25, 837–838. [Google Scholar] [CrossRef] [PubMed]
  38. Buchan, S.A.; Chung, H.; Brown, K.A.; Austin, P.C.; Fell, D.B.; Gubbay, J.; Nasreen, S.; Schwartz, K.L.; Sundaram, M.E.; Tadrous, M.; et al. Effectiveness of COVID-19 vaccines against Omicron or Delta infection. medRxiv 2022. [Google Scholar] [CrossRef]
  39. UK Health Security Agency. SARS-CoV-2 Variants of Concern and Variants under Investigation in England: Technical Briefing: Update on Hospitalisation and Vaccine Effectiveness for Omicron VOC-21NOV-01 (B.1.1.529); UK Health Security Agency: London, UK, 2021. Available online: https://assets.publishing.service.gov.uk/government/uploads/system/uploads/attachment_data/file/1044481/Technical-Briefing-31-Dec-2021-Omicron_severity_update.pdf (accessed on 9 January 2022).
  40. Wipatayotin, A. New Drive to Give 1 m Doses per Day; Bangkok Post: Bangkok, Thailand, 2021; Available online: https://www.bangkokpost.com/thailand/general/2187275/new-drive-to-give-1m-doses-per-day (accessed on 9 January 2022).
  41. Phan, T.; Boes, S.; McCullough, M.; Gribschaw, J.; Marsh, J.W.; Harrison, L.H.; Wells, A. First detection of SARS-CoV-2 Omicron BA.4 variant in Western Pennsylvania, United States. J. Med. Virol. 2022. Epub ahead of print. [Google Scholar] [CrossRef] [PubMed]
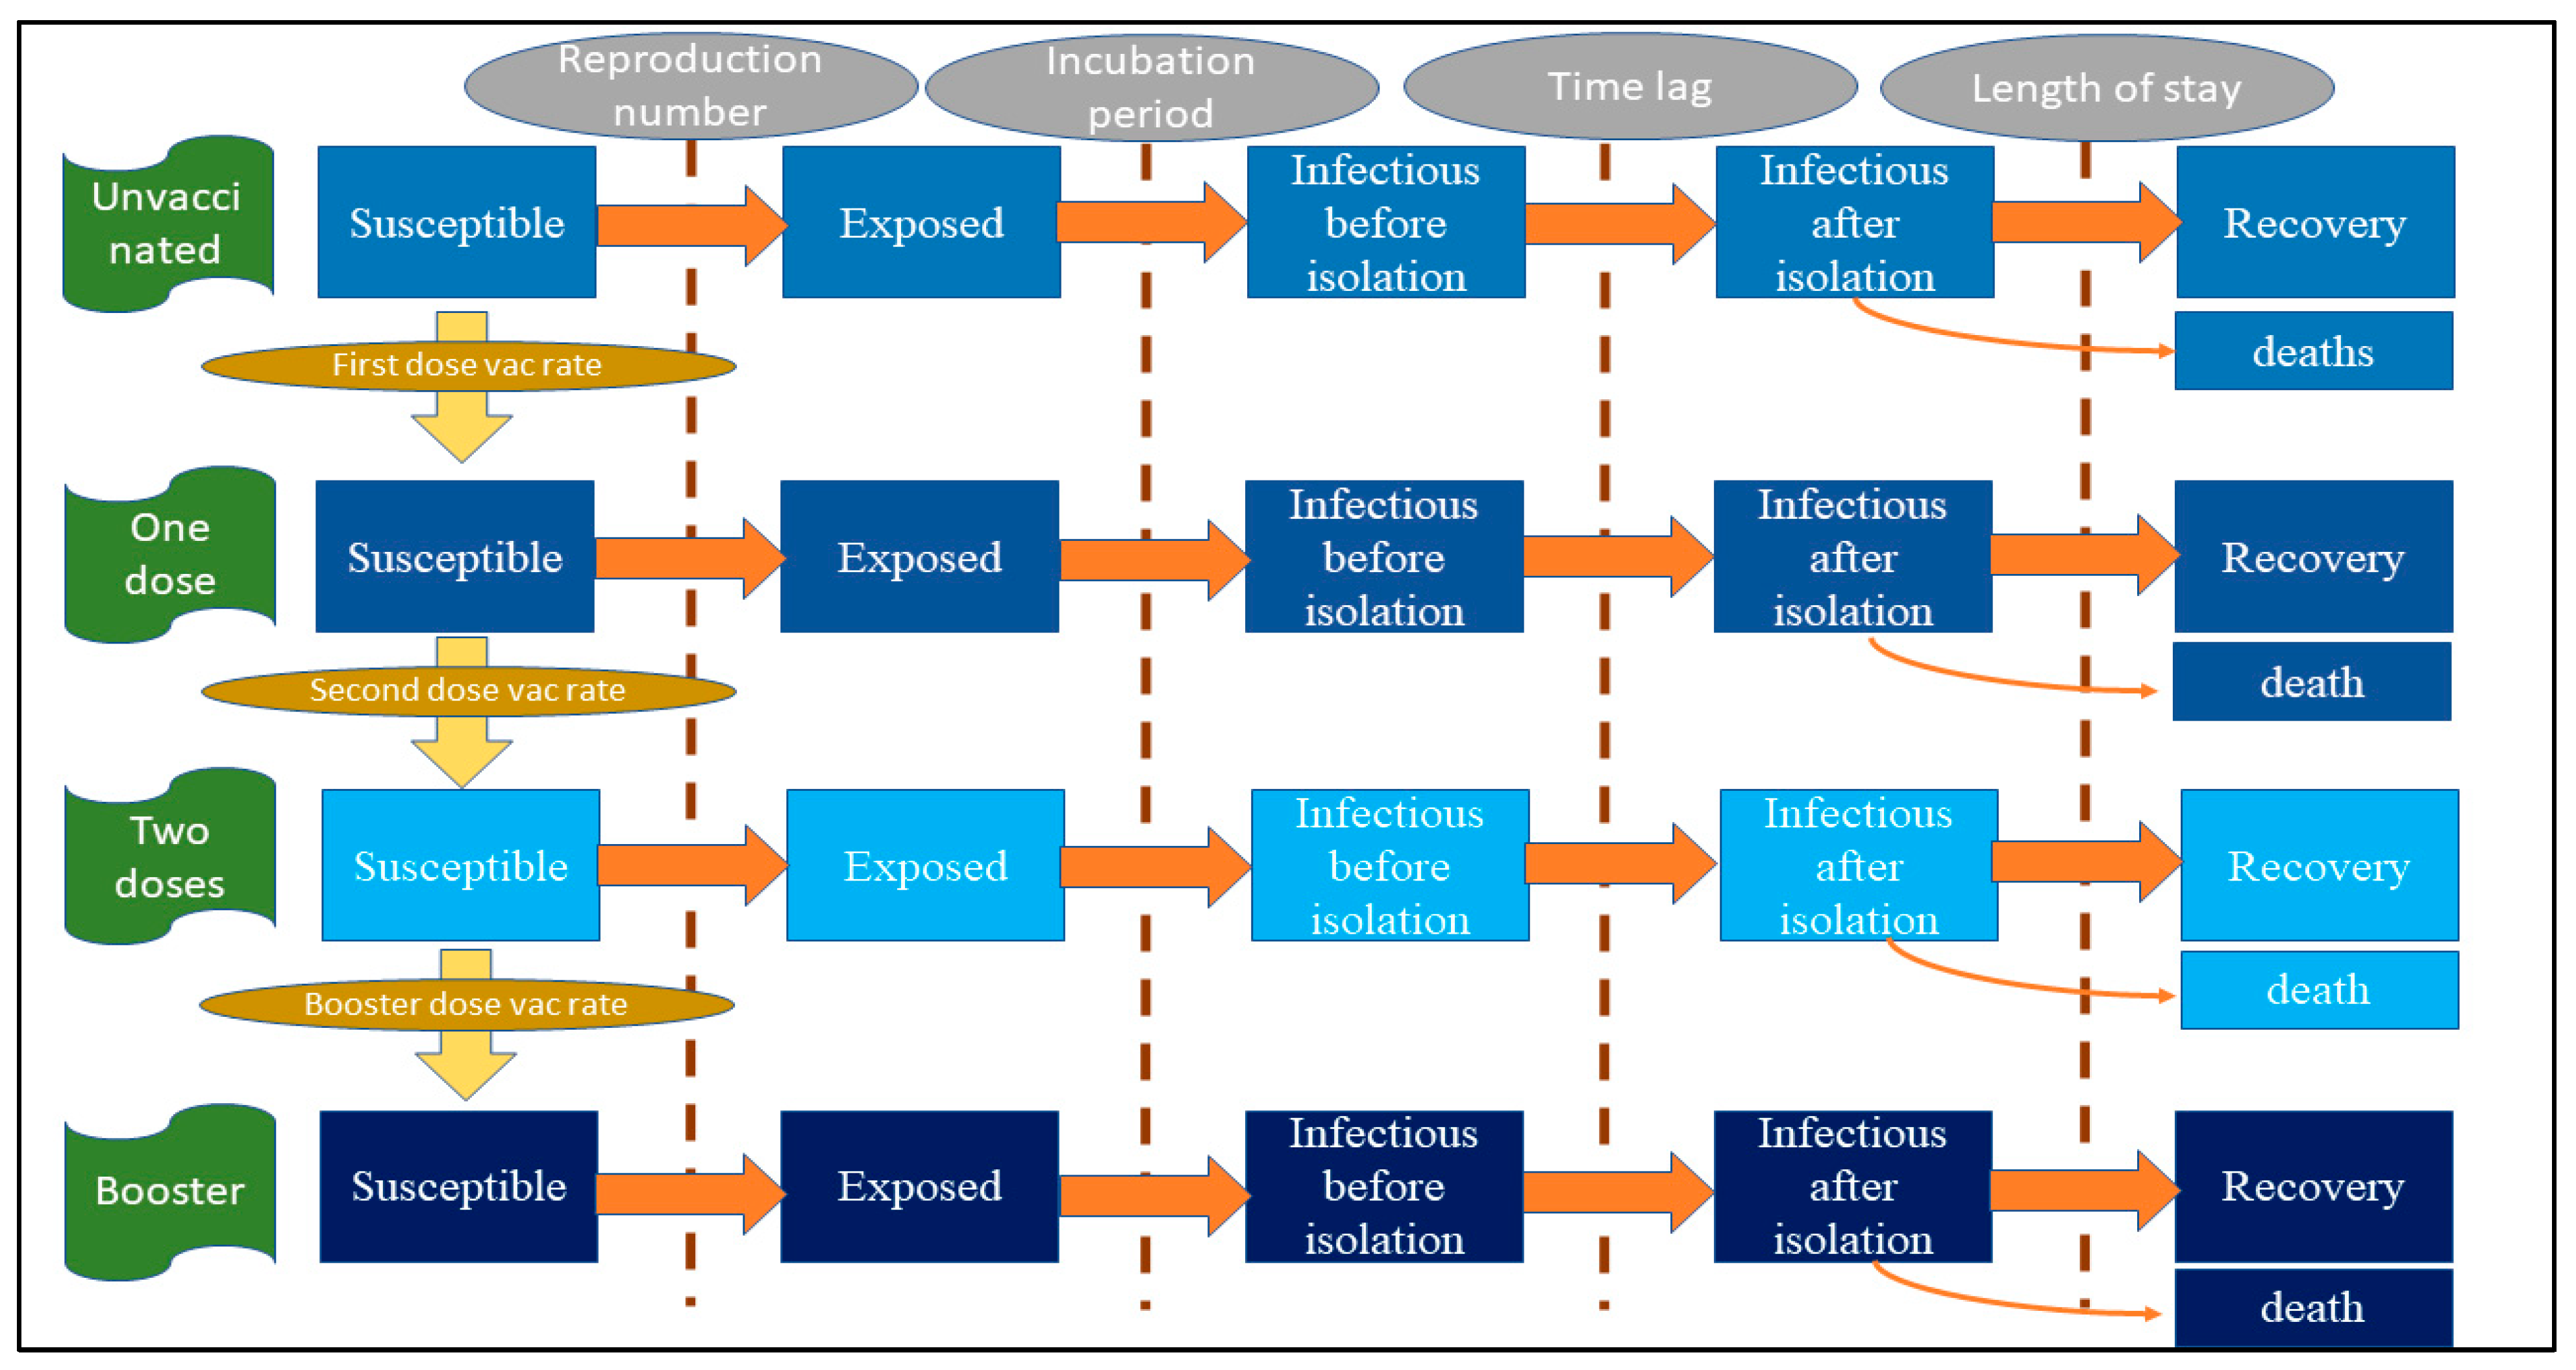
Figure 1. Model framework.
Vaccines 10 01024 g001
Figure 2. The daily incident cases by different epidemic scenarios.
Vaccines 10 01024 g002
Figure 3. Daily deaths by different epidemic scenarios.
Vaccines 10 01024 g003
Figure 4. The prevalent intubated cases by different epidemic scenarios.
Vaccines 10 01024 g004
Figure 5. Cumulative case tolls by different epidemic scenarios.
Vaccines 10 01024 g005
Figure 6. Cumulative death tolls by different epidemic scenarios.
Vaccines 10 01024 g006
Table 1. List of essential parameters.
ParametersUnitValueReference (Note)
Reproduction numberUnitless4.3–7.5Ito et al. [25], Head and van Elsland [26]
(3.1–5.4 times greater than the Delta epidemic in Thailand in 2020)
Population Persons66.2 × 106National Statistical Office of Thailand [29] (assume homogenous mixing)
Mean infectious durationDays4.6Hart et al. [30] (assume gamma distribution with scale parameter of 0.03 and shape parameter of 165.9—same as the Delta variant)
Mean incubation periodDays3.2Helmsdal et al. [31] (assume gamma distribution with scale parameter of 0.01 and shape parameter of 302.7—shorter than the Delta variant)
Time lag from being infected to isolation Days5Model calibration (assume same as the Delta epidemic in Thailand in 2020)
Initial number of infecteesPersons10,000Model calibration (assume fourfold greater than the present incident cases)
Initial proportion of unvaccinated population Unitless0.26Internal database of the Department of Disease Control
Initial proportion of one-dose vaccinees Unitless0.09Internal database of the Department of Disease Control
Initial proportion of two-dose vaccineesUnitless0.58Internal database of the Department of Disease Control
Initial proportion booster-dose vaccineesUnitless0.06Internal database of the Department of Disease Control
First-dose vaccination base rate Persons/day66,200Internal database of the Department of Disease Control (assume equaling the rate of booster dose)
Second-dose vaccination base ratePersons/day198,600Internal database of the Department of Disease Control (the largest rate compared to other doses as the second shot currently being the main policy priority)
Booster-dose vaccination base ratePersons/day66,200Internal database of the Department of Disease Control
Vaccine effectiveness against any infection for one-dose vaccinationUnitless0.17Adapted from Head and van Elsland [26] and internal database of the Department of Disease Control
Vaccine effectiveness against any infection for two-dose vaccinationUnitless0.41Adapted from Head and van Elsland [26] and internal database of the Department of Disease Control
Vaccine effectiveness against any infection for booster-dose vaccinationUnitless0.65Adapted from Head and van Elsland [26] and internal database of the Department of Disease Control
Vaccine effectiveness against severe infection for one-dose vaccinationUnitless0.70Adapted from Head and van Elsland [26] and internal database of the Department of Disease Control
Vaccine effectiveness against severe infection for two-dose vaccinationUnitless0.90Adapted from Head and van Elsland [26] and internal database of the Department of Disease Control
Vaccine effectiveness against severe infection for booster-dose vaccinationUnitless0.95Adapted from Head and van Elsland [26] and internal database of the Department of Disease Control
Proportion of intubated cases to existing active infecteesUnitless0.005Internal database of the Department of Disease Control (assume half of the proportion of the Delta variant)
Ratio of deaths per existing intubated cases Unitless0.03Internal database of the Department of Disease Control (assume same as the ratio of the Delta variant)
Length of stay for non-intubated casesDays10Internal database of the Department of Disease Control
Length of stay for intubated casesDays21Internal database of the Department of Disease Control
Non-pharmaceutical intervention base effectiveness against any infectionUnitlessSee supporting information (Figure S1)Assume being an exponential function with the incident cases
Table 2. The essential formula of the model.
DescriptionFormulaNote
Rate of change from being susceptible to being exposed −β × (1 − κ) × (1 − ve) × S × I1/Pβ = reproduction number/infectious duration, κ = effectiveness of non-pharmaceutical intervention against any infection, ve = effectiveness of vaccine against any infection (varying by vaccine doses), S = susceptible population, I1 = non-isolated infectees, P = total population
Rate of change from being susceptible to being non-isolated infectious −αEα = 1/incubation period, E = exposed population
Rate of change from being non-isolated infectious to being isolated infectious −δI1δ = 1/time lag from non-isolation to isolation, I1 = non-isolated infectious population
Rate of change from being isolated infectious to being recovered −ζI2ζ = 1/length of stay; I2 = isolated infectious population (varying by severity status)
Table 3. Scenarios of interest.
ScenarioReproduction NumberVaccination Rate
17.5Base pace
27.5Speedy pace
34.3Base pace
44.3Speedy pace
Publisher’s Note: MDPI stays neutral with regard to jurisdictional claims in published maps and institutional affiliations.