
Reanalysis of a Randomized Controlled Trial on Promoting Influenza Vaccination in General Practice Waiting Rooms: A Zelen Design

 ,
,  ,
,  , and
, and 
Abstract
:1. Introduction
2. Materials and Methods
3. Results
3.1. Main Outcome
3.2. Secondary Outcomes
4. Discussion
5. Conclusions
Author Contributions
Funding
Institutional Review Board Statement
Informed Consent Statement
Data Availability Statement
Acknowledgments
Conflicts of Interest
References
- Campèse, C.; Bonmarin, I.; Savitch, Y.; Fouillet, A.; Sommen, C.; Lévy-Bruhl, D. Surveillance de la grippe en France, saison 2016–2017/influenza activity in France, season 2016–2017. Bull. Epidemiol. Hebd. 2017, 466–475. [Google Scholar]
- Berkhout, C.; Willefert-Bouche, A.; Chazard, E.; Zgorska-Maynard-Moussa, S.; Favre, J.; Peremans, L.; Ficheur, G.; Van Royen, P. Randomized Controlled Trial on Promoting Influenza Vaccination in General Practice Waiting Rooms. PLoS ONE 2018, 13, e0192155. [Google Scholar] [CrossRef] [PubMed] [Green Version]
- Ryan, J.; Zoellner, Y.; Gradl, B.; Palache, B.; Medema, J. Establishing the Health and Economic Impact of Influenza Vaccination within the European Union 25 Countries. Vaccine 2006, 24, 6812–6822. [Google Scholar] [CrossRef] [PubMed]
- European Centre for Disease Prevention and Control. Seasonal Influenza Vaccination in Europe: Vaccination Recommendations and Coverage Rates in the EU Member States for Eight Influenza Seasons 2007–2008 to 2014–2015; ECDC: Stockholm, Sweden, 2017. [Google Scholar] [CrossRef]
- Kwakkenbos, L.; Imran, M.; McCall, S.J.; McCord, K.A.; Fröbert, O.; Hemkens, L.G.; Zwarenstein, M.; Relton, C.; Rice, D.B.; Langan, S.M.; et al. CONSORT Extension for the Reporting of Randomised Controlled Trials Conducted Using Cohorts and Routinely Collected Data (CONSORT-ROUTINE): Checklist with Explanation and Elaboration. BMJ 2021, 373, n857. [Google Scholar] [CrossRef] [PubMed]
- Berkhout, C.; Zgorska-Meynard-Moussa, S.; Willefert-Bouche, A.; Favre, J.; Peremans, L.; Royen, P.V. Audiovisual Aids in Primary Healthcare Settings’ Waiting Rooms. A Systematic Review. Eur. J. Gen. Pract. 2018, 24, 202–210. [Google Scholar] [CrossRef]
- Santé Publique France Données de Couverture Vaccinale Grippe par Groupe d’âge. Available online: https://www.santepubliquefrance.fr/determinants-de-sante/vaccination/donnees-de-couverture-vaccinale-grippe-par-groupe-d-age (accessed on 1 August 2021).
- Dexter, L.J.; Teare, M.D.; Dexter, M.; Siriwardena, A.N.; Read, R.C. Strategies to Increase Influenza Vaccination Rates: Outcomes of a Nationwide Cross-Sectional Survey of UK General Practice. BMJ Open 2012, 2, e000851. [Google Scholar] [CrossRef] [Green Version]
- Masumoto, K.; Shiozaki, M.; Taishi, N. The Impact of Age on Goal-Framing for Health Messages: The Mediating Effect of Interest in Health and Emotion Regulation. PLoS ONE 2020, 15, e0238989. [Google Scholar] [CrossRef]
- Zelen, M. A New Design for Randomized Clinical Trials. N. Engl. J. Med. 1979, 300, 1242–1245. [Google Scholar] [CrossRef]
- Torgerson, D.J.; Roland, M. What Is Zelen’s Design? BMJ 1998, 316, 606. [Google Scholar] [CrossRef]
- Austin, P.C. A Comparison of the Statistical Power of Different Methods for the Analysis of Cluster Randomization Trials with Binary Outcomes. Stat. Med. 2007, 26, 3550–3565. [Google Scholar] [CrossRef]
- Tuppin, P.; Choukroun, S.; Samson, S.; Weill, A.; Ricordeau, P.; Allemand, H. Vaccination against seasonal influenza in France in 2010 and 2011: Decrease of coverage rates and associated factors. Presse Med. (Paris Fr. 1983) 2012, 41, e568–e576. [Google Scholar] [CrossRef] [PubMed]
- Lumley, T. Survey: Analysis of Complex Survey Samples. Available online: https://cran.r-project.org/web/packages/survey/index.html (accessed on 19 March 2017).
- Barros, A.J.; Hirakata, V.N. Alternatives for Logistic Regression in Cross-Sectional Studies: An Empirical Comparison of Models That Directly Estimate the Prevalence Ratio. BMC Med. Res. Methodol. 2003, 3, 21. [Google Scholar] [CrossRef] [PubMed] [Green Version]
- Verbeke, G.; Fieuws, S.; Lesaffre, E.; Kato, B.S.; Foreman, M.D.; Broos, P.L.O.; Millsen, K. A Comparison of Procedures to Correct for Base-Line Differences in the Analysis of Continuous Longitudinal Data: A Case-Study. J. R. Stat. Soc. Ser. C-Appl. Stat. 2006, 55, 93–101. [Google Scholar] [CrossRef]
- Leppink, J. Analysis of Covariance (ANCOVA) vs. Moderated Regression (MODREG): Why the Interaction Matters. Health Prof. Educ. 2018, 4, 225–232. [Google Scholar] [CrossRef]
- Molenberghs, G.; Verbeke, G. Models for Discrete Longitudinal Data; Springer Science+Business Media, Inc.: New York, NY, USA, 2005; ISBN 978-0-387-25144-8. [Google Scholar] [CrossRef]
- Halekoh, U.; Hojsgaard, S.; Yan, J. The R Package Geepack for Generalized Estimating Equations. J. Stat. Softw. 2006, 15, 1–11. [Google Scholar] [CrossRef] [Green Version]
- Wickham, H. Ggplot2: Elegant Graphics for Data Analysis; Springer: New York, NY, USA, 2009; pp. 1–212. ISBN 978-0-387-98140-6. [Google Scholar] [CrossRef]
- World Health Organization. Fifty-Sixth World Health Assembly. Resolution of the World Health Assembly, WHA56.19: Prevention and Control of Influenza Pandemics and Annual Epidemics; WHO: Geneva, Switzerland, 28 May 2003. [Google Scholar]
- Roca, B.; Herrero, E.; Resino, E.; Torres, V.; Penades, M.; Andreu, C. Impact of Education Program on Influenza Vaccination Rates in Spain. Am. J. Manag. Care 2012, 18, e446–e452. [Google Scholar]
- Li, A.; Chan, Y.-H.; Liew, M.F.; Pandey, R.; Phua, J. Improving Influenza Vaccination Coverage Among Patients With COPD: A Pilot Project. Int. J. Chron. Obstruct. Pulmon. Dis. 2019, 14, 2527–2533. [Google Scholar] [CrossRef] [Green Version]
- Maskell, K.; McDonald, P.; Paudyal, P. Effectiveness of Health Education Materials in General Practice Waiting Rooms: A Cross-Sectional Study. Br. J. Gen. Pract. J. R. Coll. Gen. Pract. 2018, 68, e869–e876. [Google Scholar] [CrossRef] [Green Version]
- Tuppin, P.; Samson, S.; Weill, A.; Ricordeau, P.; Allemand, H. Influenza vaccination coverage in France in 2007–2008: Contribution of vaccination refund data from the general health insurance scheme. Médecine Mal. Infect. 2009, 39, 780–788. [Google Scholar] [CrossRef]
- Jumel, S. Rapport Fait au Nom de la Commission des Affaires Sociales sur la Proposition de loi Pour une Santé Accessible à Tous et Contre la Désertification Médicale; Assemblée Nationale: Paris, France, 2021. [Google Scholar]
- Gehanno, J.-F.; Rollin, L. Influenza vaccination of healthcare personnel. J. Anti-Infect. 2016, 18, 79–84. [Google Scholar] [CrossRef]
- Massin, S.; Pulcini, C.; Launay, O.; Flicoteaux, R.; Sebbah, R.; Paraponaris, A.; Verger, P.; Ventelou, B. Opinions et pratiques d’un panel de médecins généralistes français vis-à-vis de la vaccination. Glob. Health Promot. 2013, 20, 28–32. [Google Scholar] [CrossRef] [PubMed]
- Osterholm, M.T.; Kelley, N.S.; Sommer, A.; Belongia, E.A. Efficacy and Effectiveness of Influenza Vaccines: A Systematic Review and Meta-Analysis. Lancet Infect. Dis. 2012, 12, 36–44. [Google Scholar] [CrossRef]
- Andrew, M.K.; Bowles, S.K.; Pawelec, G.; Haynes, L.; Kuchel, G.A.; McNeil, S.A.; McElhaney, J.E. Influenza Vaccination in Older Adults: Recent Innovations and Practical Applications. Drugs Aging 2019, 36, 29–37. [Google Scholar] [CrossRef]
- Weinberg, G.A.; Szilagyi, P.G. Vaccine Epidemiology: Efficacy, Effectiveness, and the Translational Research Roadmap. J. Infect. Dis. 2010, 201, 1607–1610. [Google Scholar] [CrossRef] [PubMed]


| Characteristics | Category | Intervention Group | Control Group | Zelen Group | P (i-c) adj | P (z-c) adj | P (z-i) adj |
|---|---|---|---|---|---|---|---|
| (n = 3430) | (n = 6620) | (n = 12,974) | |||||
| mean or % [95% CI] | mean or % [95% CI] | mean or % [95% CI] | |||||
| Age | years | 70.3 [68.7; 71.9] | 69.9 [68.9; 70.8] | 69.7 [68.9; 70.5] | 0.687 | 0.751 | 0.524 |
| Gender | male | 44.9% [42.2; 47.5] | 43.7% [42.2; 45.3] | 44.7% [43.4; 45.9] | 0.465 | 0.353 | 0.889 |
| Age ≥ 65 | yes | 76.0% [71.9; 80.0] | 76.0% [73.5; 78.6] | 75.1% [72.7; 77.4] | 0.979 | 0.58 | 0.704 |
| Chronic condition | yes | 74.0 [70.9; 77.1] | 74.7 [72.7; 76.8] | 75.8 [74.3; 77.2] | 0.700 | 0.413 | 0.314 |
| Category | Intervention | Control | Zelen | P (i-c) | P (z-c) | P (z-i) |
|---|---|---|---|---|---|---|
| (n = 3430) | (n = 6620) | (n = 12,974) | ||||
| % [95% CI] | % [95% CI] | % [95% CI] | ||||
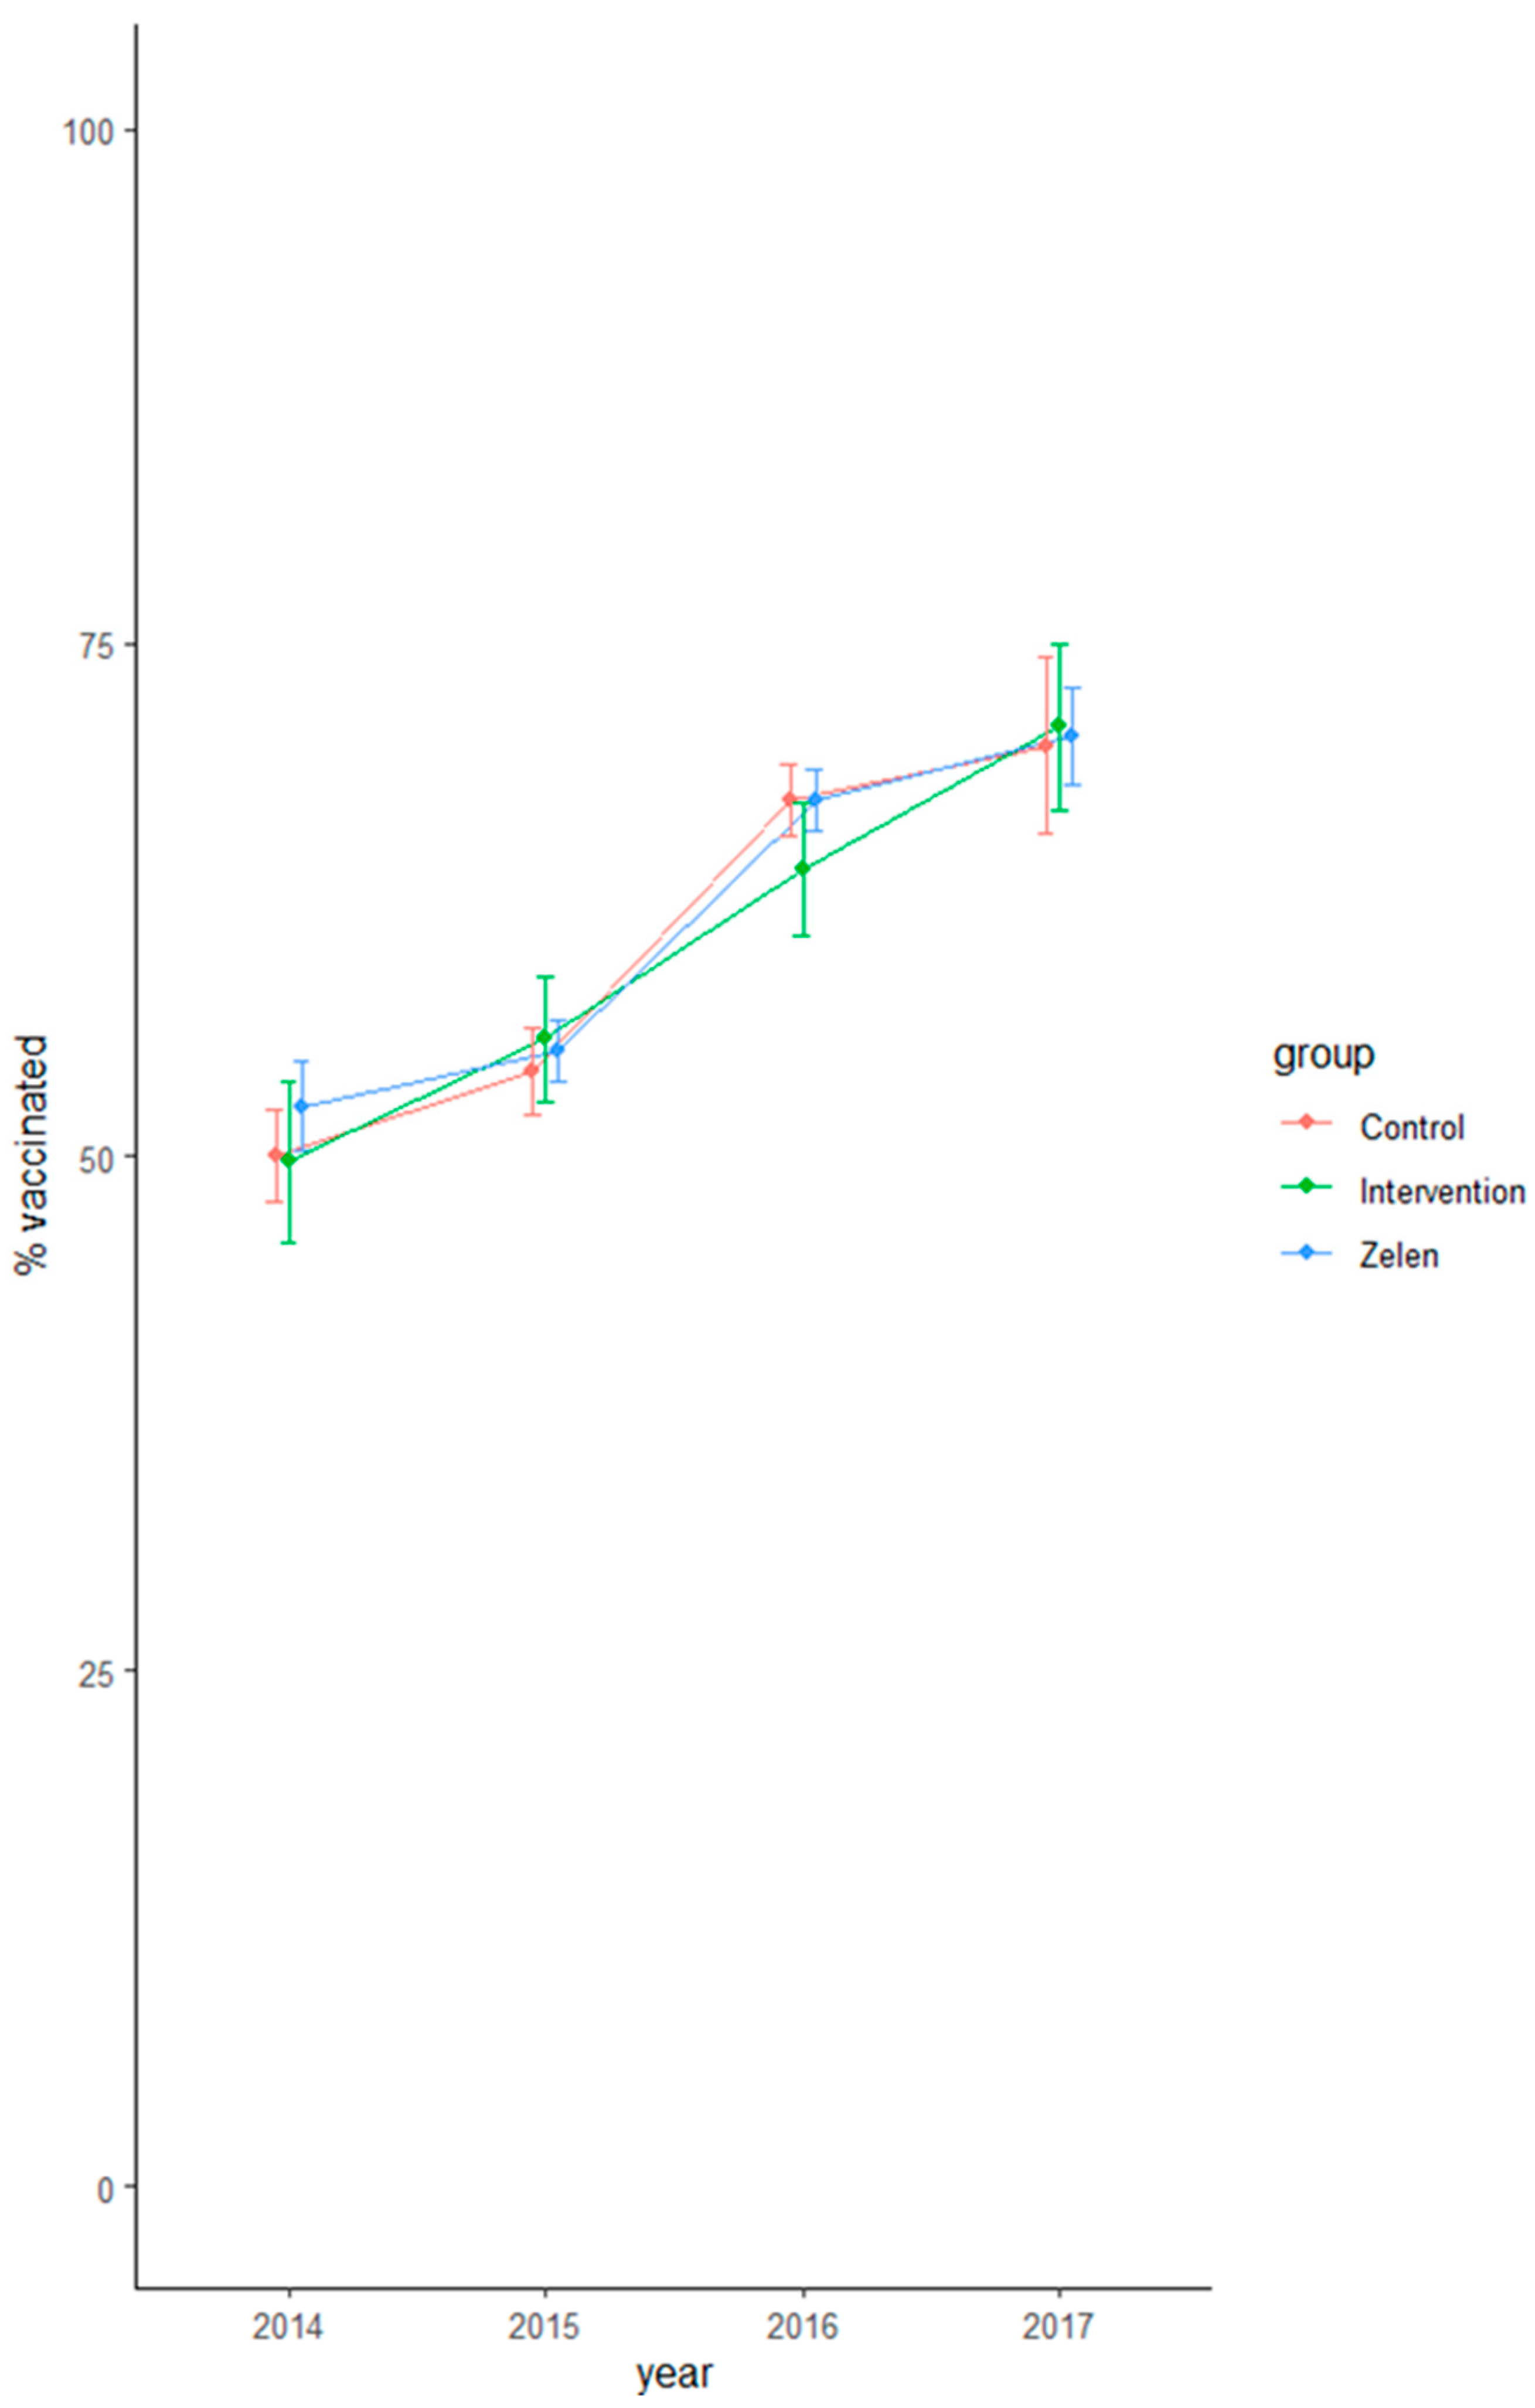
| 2013–2014 (baseline) | 49.8% [45.9; 53.7] | 50.0% [47.8; 52.3] | 52.5% [50.3; 54.7] | 0.904 | 0.131 | 0.241 |
| 2014–2015 (intervention) | 55.7% [52.6; 58.8] | 54.1% [51.0; 56.3] | 55.1% [53.6; 56.7] | 0.408 | 0.444 | 0.748 |
| 2015–2016 | 64.0% [60.7; 67.2] | 67.3% [65.6; 69.1] | 67.4% [65.8; 68.9] | 0.078 | 0.989 | 0.067 |
| 2016–2017 | 70.9% [66.9; 74.9] | 70.0% [65.7; 74.3] | 70.5% [68.1; 72.9] | 0.763 | 0.851 | 0.856 |
| Comparison | Estimate (RR) | 95% CI | p |
|---|---|---|---|
| Intervention vs. Zelen | 1.065 | [1.020; 1.113] | 0.0043 |
| Intervention vs. control | 1.037 | [0.988; 1.087] | 0.141 |
| Control vs. Zelen | 1.029 | [0.995; 1.064] | 0.09943 |
| Characteristic | Estimate (OR) | 95% CI | p |
|---|---|---|---|
| Vaccination in the previous year | 3.50 | [3.28; 3.73] | <0.001 |
| Characteristic | <65 (with chronic condition) | ≥65 (without chronic condition) | ≥65 (with chroniccondition) |
| RR [95% CI] | RR [95% CI] | RR [95% CI] | |
| Age | 1.002 [1.001; 1.004] | 0.996 [0.994; 0.997] | 0.993 [0.992; 0.994] |
| Gender | 1.021 [0.998; 1.045] | 0.948 [0.928; 0.970] | 0.990 [0.976; 1.004] |
| Age Category (Baseline) | n (Baseline) | 2013–2014 (Baseline) | 2014–2015 | 2015–2016 | 2016–2017 |
|---|---|---|---|---|---|
| % [95% CI] | % [95% CI] | % [95% CI] | % [95% CI] | ||
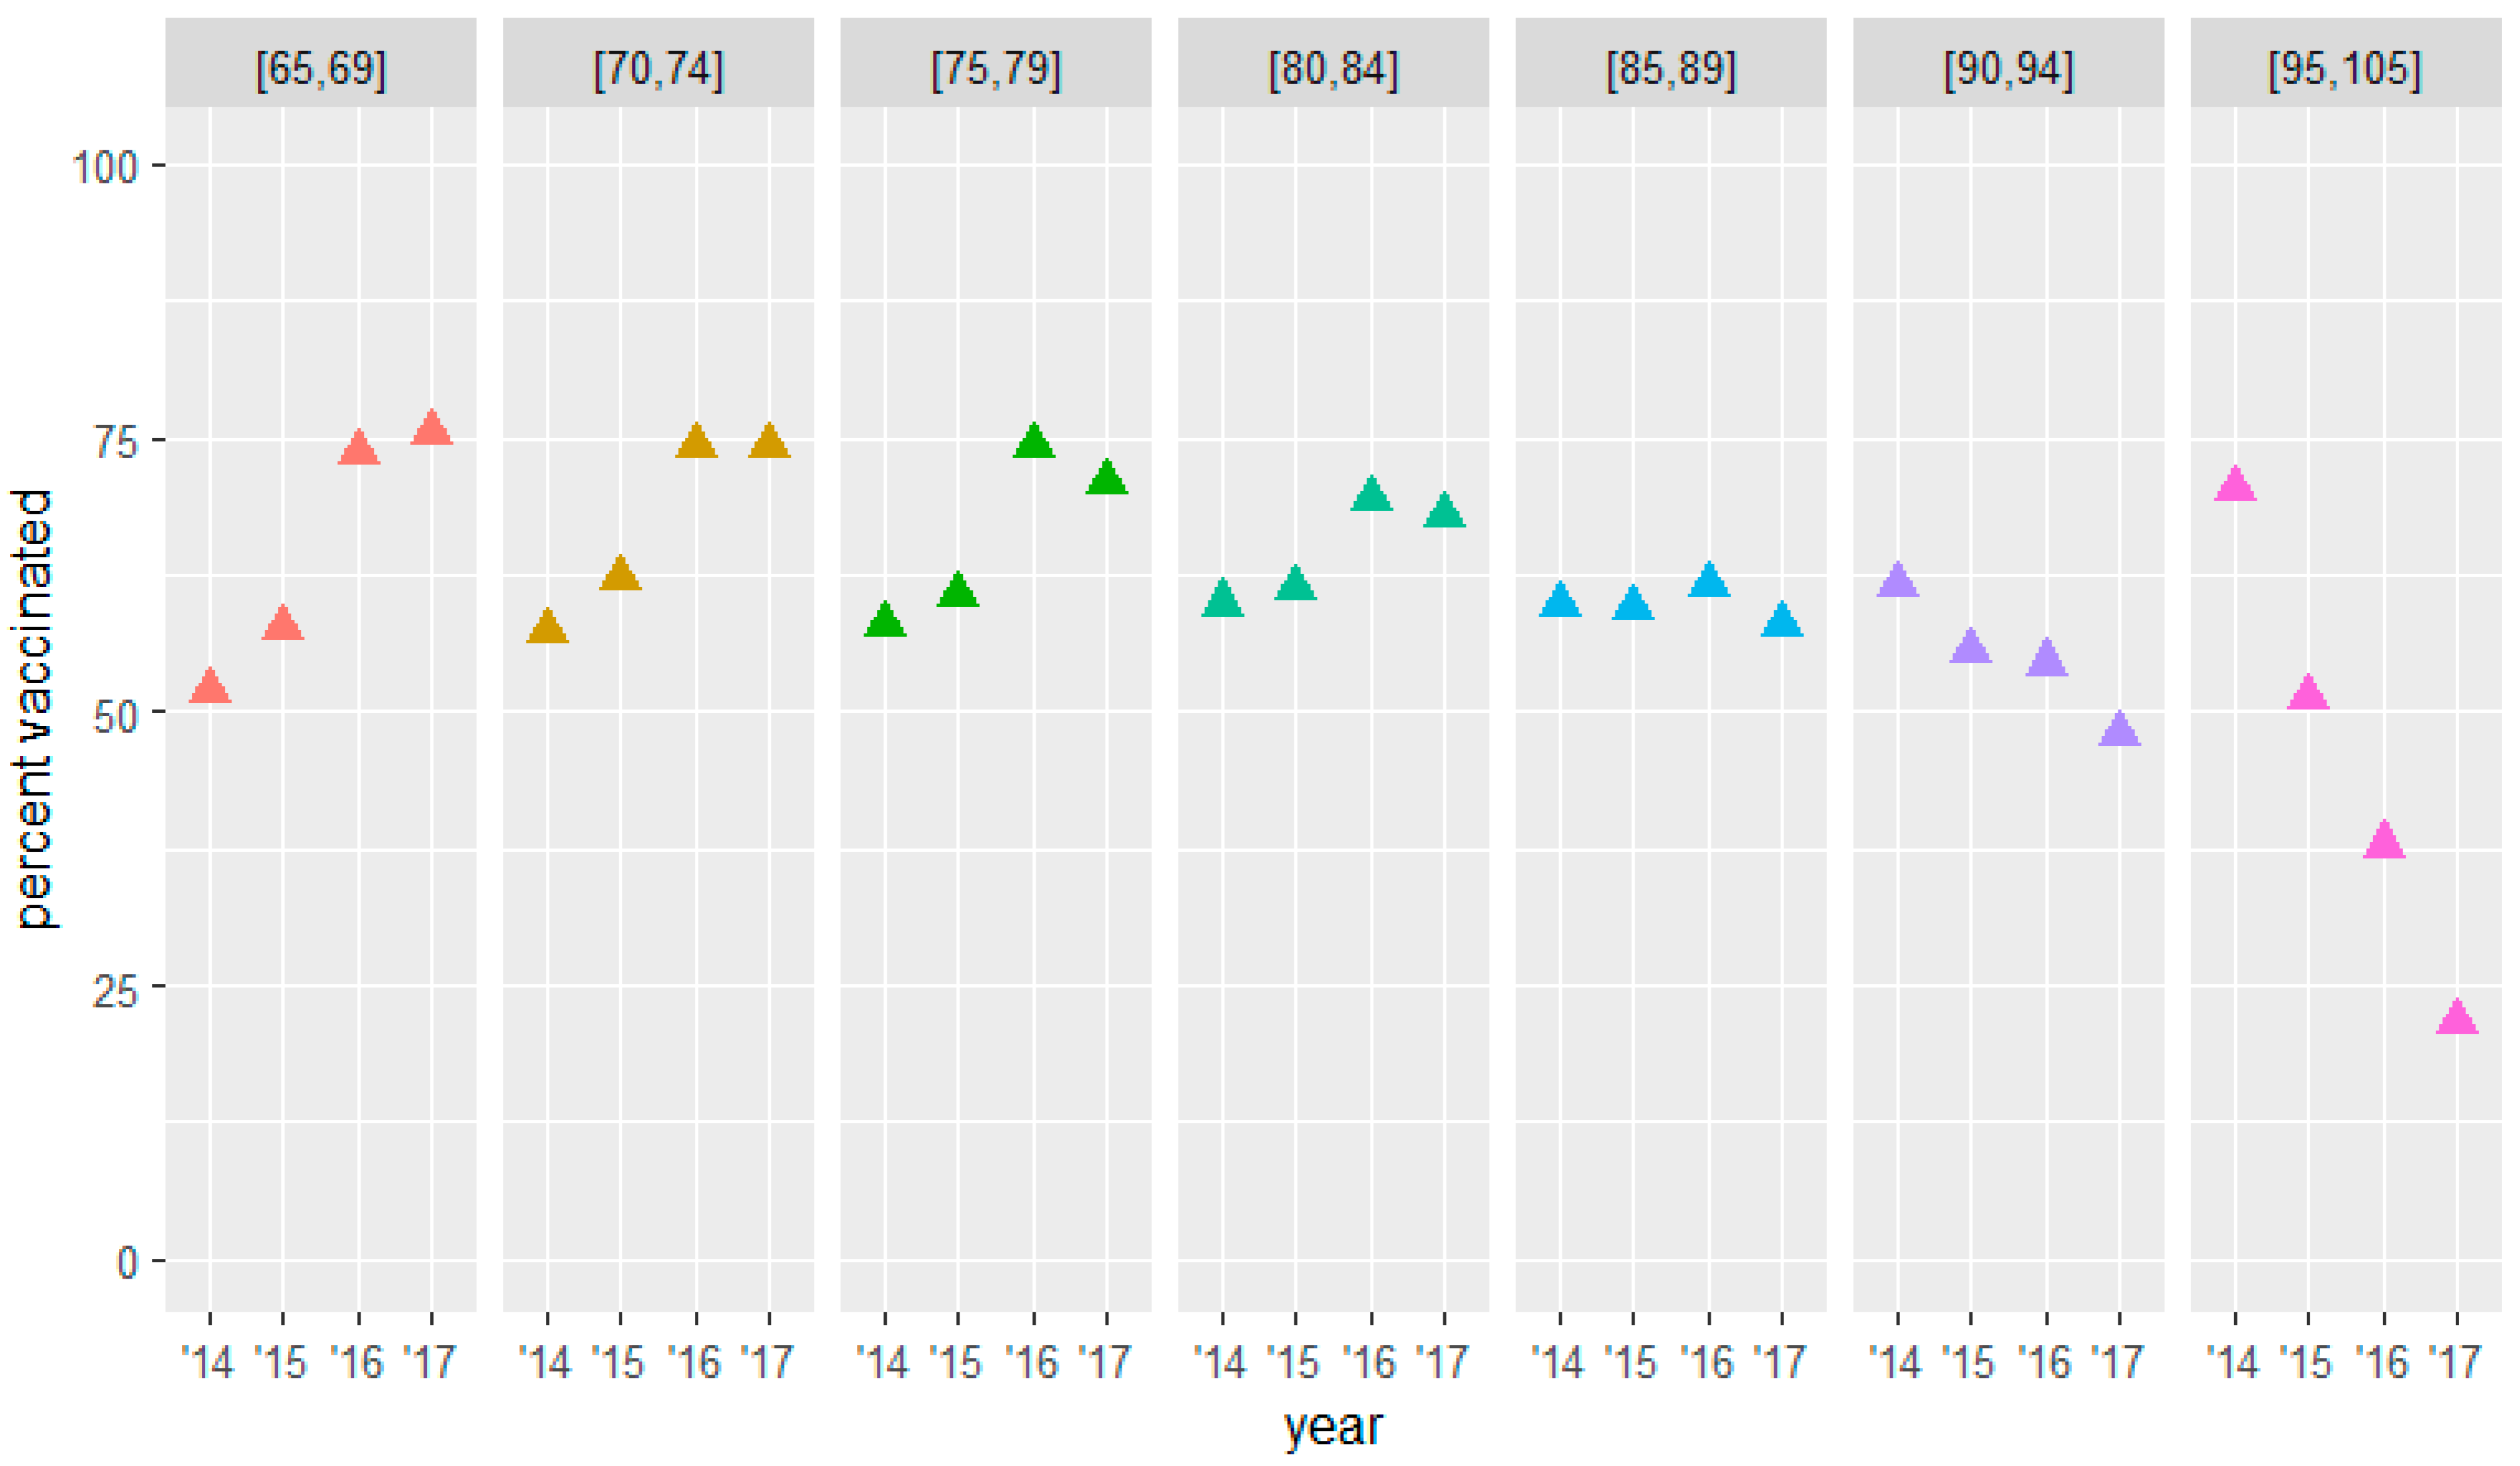
| [65, 69] | 2672 | 51.9 [49.5; 54.4] | 57.7 [55.6; 59.8] | 73.7 [71.7; 75.7] | 75.6 [72.5; 78.7] |
| [70, 74] | 1922 | 57.3 [54.6; 60.1] | 62.3 [59.7; 64.9] | 74.3 [72.2; 76.5] | 74.3 [71.5; 77.1] |
| [75, 79] | 2266 | 58.1 [55.6; 60.5] | 60.6 [58.2; 63.0] | 74.2 [72.1; 76.3] | 71.0 [68.5; 73.5] |
| [80, 84] | 2045 | 59.9 [57.2; 62.6] | 61.2 [58.8; 63.7] | 69.4 [67.0; 71.8] | 67.8 [65.4; 70.3] |
| [85, 89] | 1378 | 59.7 [56.5; 62.9] | 59.6 [56.4; 62.8] | 61.6 [58.8; 64.5] | 57.8 [54.7; 61.0] |
| [90, 94] | 604 | 61.6 [57.7; 65.5] | 55.6 [51.2; 60.0] | 54.5 [49.7; 59.2] | 47.8 [43.5; 52.2] |
| [95, 105] | 74 | 70.3 [58.9; 81.6] | 51.4 [41.6; 61.1] | 37.8 [27.6; 48.0] | 21.6 [11.9; 31.3] |
| Age Category (Baseline) | n (Baseline) | 2013–2014 (Baseline) | 2014–2015 | 2015–2016 | 2016–2017 |
|---|---|---|---|---|---|
| % [95% CI] | % [95% CI] | % [95% CI] | % [95% CI] | ||
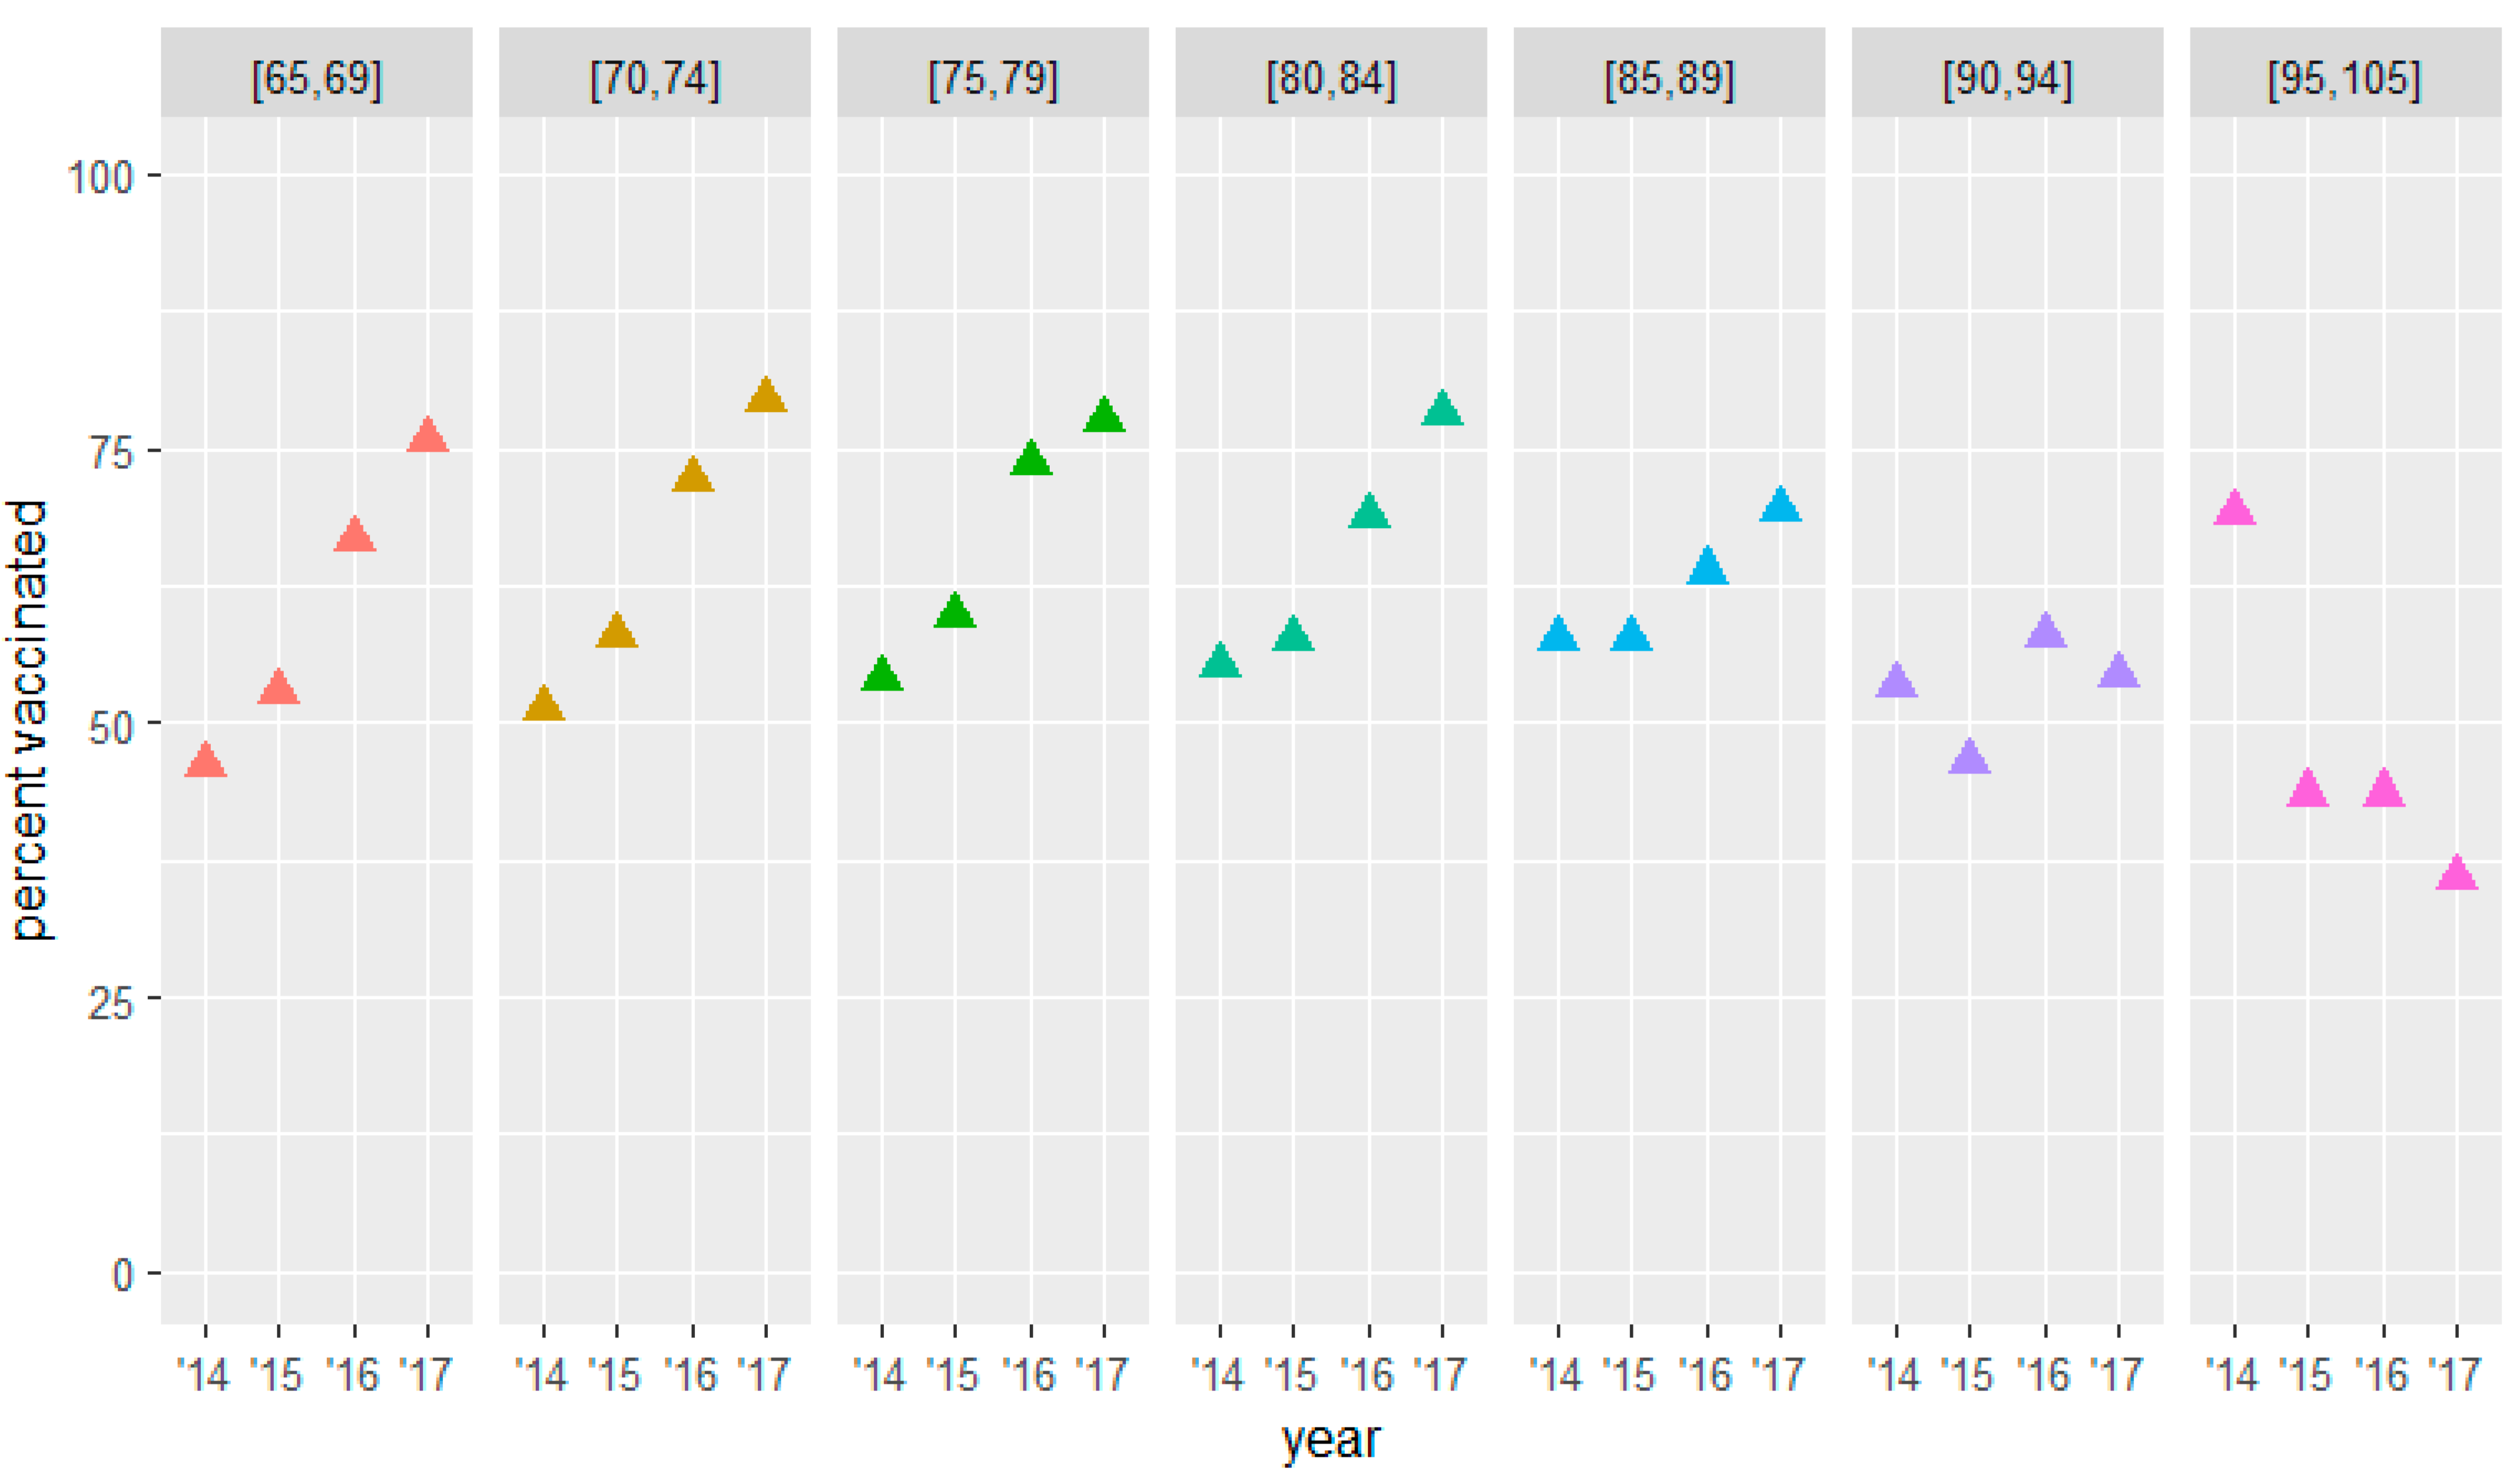
| [65, 69] | 1770 | 46.3 [43.4; 49.1] | 52.7 [50.3; 55.1] | 66.7 [64.2; 69.2] | 75.7 [73.2; 78.2] |
| [70, 74] | 1092 | 51.2 [47.7; 54.7] | 58.1 [55.0; 61.1] | 72.1 [69.0; 75.2] | 79.5 [76.0; 83.0] |
| [75, 79] | 1156 | 54.0 [50.7; 57.2] | 59.7 [56.6; 62.8] | 73.6 [70.8; 76.5] | 77.7 [74.0; 81.3] |
| [80, 84] | 880 | 55.1 [51.1; 59.1] | 57.6 [54.3; 60.9] | 68.8 [65.3; 72.2] | 78.2 [75.0; 81.4] |
| [85, 89] | 542 | 57.6 [53.0; 62.2] | 57.7 [53.2; 62.3] | 63.8 [59.8; 67.9] | 69.4 [65.6; 73.1] |
| [90, 94] | 230 | 53.5 [45.8; 61.1] | 46.5 [41.0; 52.0] | 57.8 [52.2; 63.4] | 54.3 [47.1; 61.6] |
| [95, 105] | 39 | 69.2 [54.6; 83.9] | 43.6 [27.4; 59.8] | 43.6 [29.2; 57.9] | 35.9 [20.3; 51.5] |
| Age Category (Baseline) | n (Baseline) | 2013–2014 (Baseline) | 2014–2015 | 2015–2016 | 2016–2017 |
|---|---|---|---|---|---|
| % [95% CI] | % [95% CI] | % [95% CI] | % [95% CI] | ||
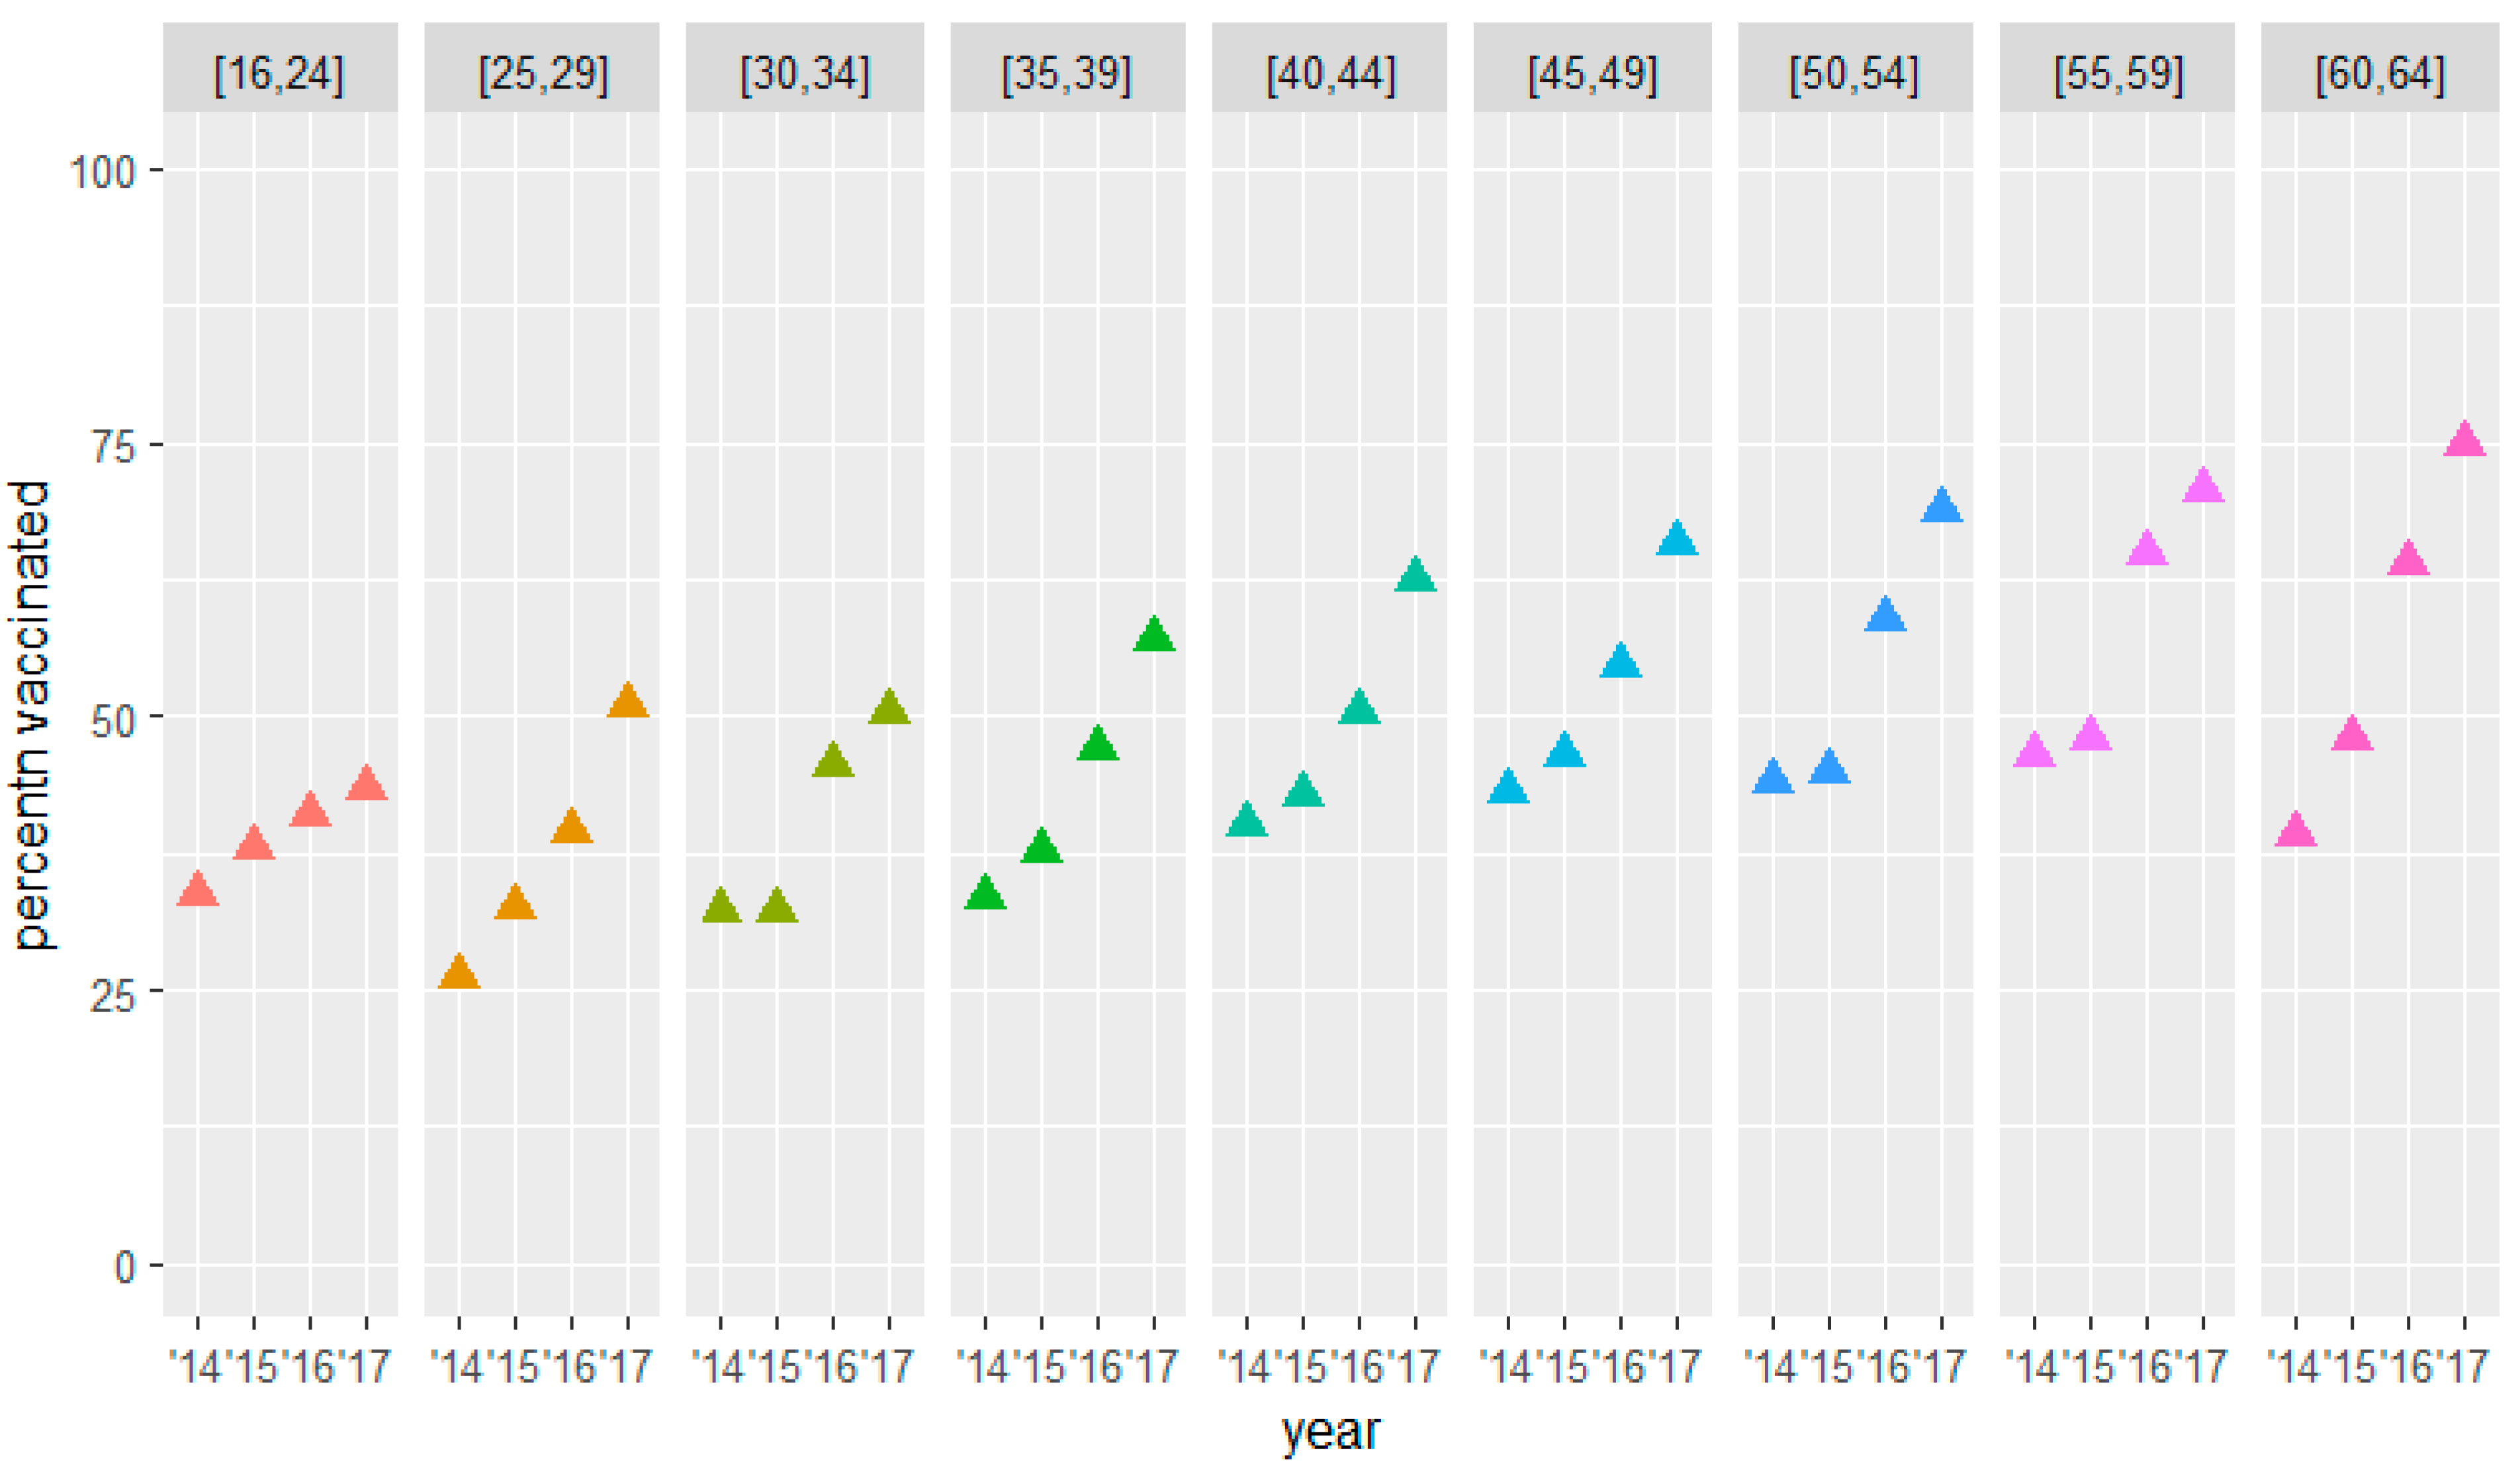
| [16, 24] | 166 | 33.7 [26.2; 41.2] | 38.0 [30.3; 45.6] | 41.0 [33.2; 48.7] | 43.4 [35.8; 51.0] |
| [25, 29] | 175 | 26.3 [19.6; 33.0] | 32.6 [25.7; 39.5] | 39.4 [32.3; 46.6] | 50.9 [43.4; 58.3] |
| [30, 34] | 189 | 32.3 [26.0; 38.5] | 32.3 [25.9; 38.7] | 45.5 [37.7; 53.3] | 50.3 [43.2; 57.3] |
| [35, 39] | 270 | 33.3 [27.4; 39.2] | 37.8 [31.6; 44.0] | 47.0 [40.7; 53.4] | 57.0 [50.2; 63.8] |
| [40, 44] | 385 | 40.0 [34.4; 45.6] | 42.9 [37.7; 48.0] | 50.4 [45.6; 55.2 | 62.6 [57.1; 68.1 |
| [45, 49] | 595 | 43.2 [38.8; 47.6] | 46.6 [42.5; 50.6] | 54.6 [50.7; 58.5] | 65.9 [62.2; 69.5] |
| [50, 54] | 922 | 44.0 [40.7; 47.4] | 45.0 [41.6; 48.4] | 58.9 [55.8; 62.0] | 68.9 [65.7; 72.1] |
| [55, 59] | 1365 | 46.4 [43.1; 49.6] | 47.8 [45.1; 50.6] | 65.0 [62.2; 67.7] | 70.6 [67.4; 73.8] |
| [60, 64] | 2287 | 39.2 [36.9; 41.5] | 47.9 [46.0; 49.8] | 64.1 [61.8; 66.4] | 74.9 [72.1; 77.7] |
Publisher’s Note: MDPI stays neutral with regard to jurisdictional claims in published maps and institutional affiliations. |
© 2022 by the authors. Licensee MDPI, Basel, Switzerland. This article is an open access article distributed under the terms and conditions of the Creative Commons Attribution (CC BY) license (https://creativecommons.org/licenses/by/4.0/).
Share and Cite
Berkhout, C.; De Man, J.; Collins, C.; Willefert-Bouche, A.; Zgorska-Maynard Moussa, S.; Badelon, M.; Peremans, L.; Van Royen, P. Reanalysis of a Randomized Controlled Trial on Promoting Influenza Vaccination in General Practice Waiting Rooms: A Zelen Design. Vaccines 2022, 10, 826. https://doi.org/10.3390/vaccines10050826
Berkhout C, De Man J, Collins C, Willefert-Bouche A, Zgorska-Maynard Moussa S, Badelon M, Peremans L, Van Royen P. Reanalysis of a Randomized Controlled Trial on Promoting Influenza Vaccination in General Practice Waiting Rooms: A Zelen Design. Vaccines. 2022; 10(5):826. https://doi.org/10.3390/vaccines10050826
Chicago/Turabian StyleBerkhout, Christophe, Jeroen De Man, Claire Collins, Amy Willefert-Bouche, Suzanna Zgorska-Maynard Moussa, Margot Badelon, Lieve Peremans, and Paul Van Royen. 2022. "Reanalysis of a Randomized Controlled Trial on Promoting Influenza Vaccination in General Practice Waiting Rooms: A Zelen Design" Vaccines 10, no. 5: 826. https://doi.org/10.3390/vaccines10050826
APA StyleBerkhout, C., De Man, J., Collins, C., Willefert-Bouche, A., Zgorska-Maynard Moussa, S., Badelon, M., Peremans, L., & Van Royen, P. (2022). Reanalysis of a Randomized Controlled Trial on Promoting Influenza Vaccination in General Practice Waiting Rooms: A Zelen Design. Vaccines, 10(5), 826. https://doi.org/10.3390/vaccines10050826