Adeno-Associated Viral Transfer of Glyoxalase-1 Blunts Carbonyl and Oxidative Stresses in Hearts of Type 1 Diabetic Rats

 ,
, 
Abstract

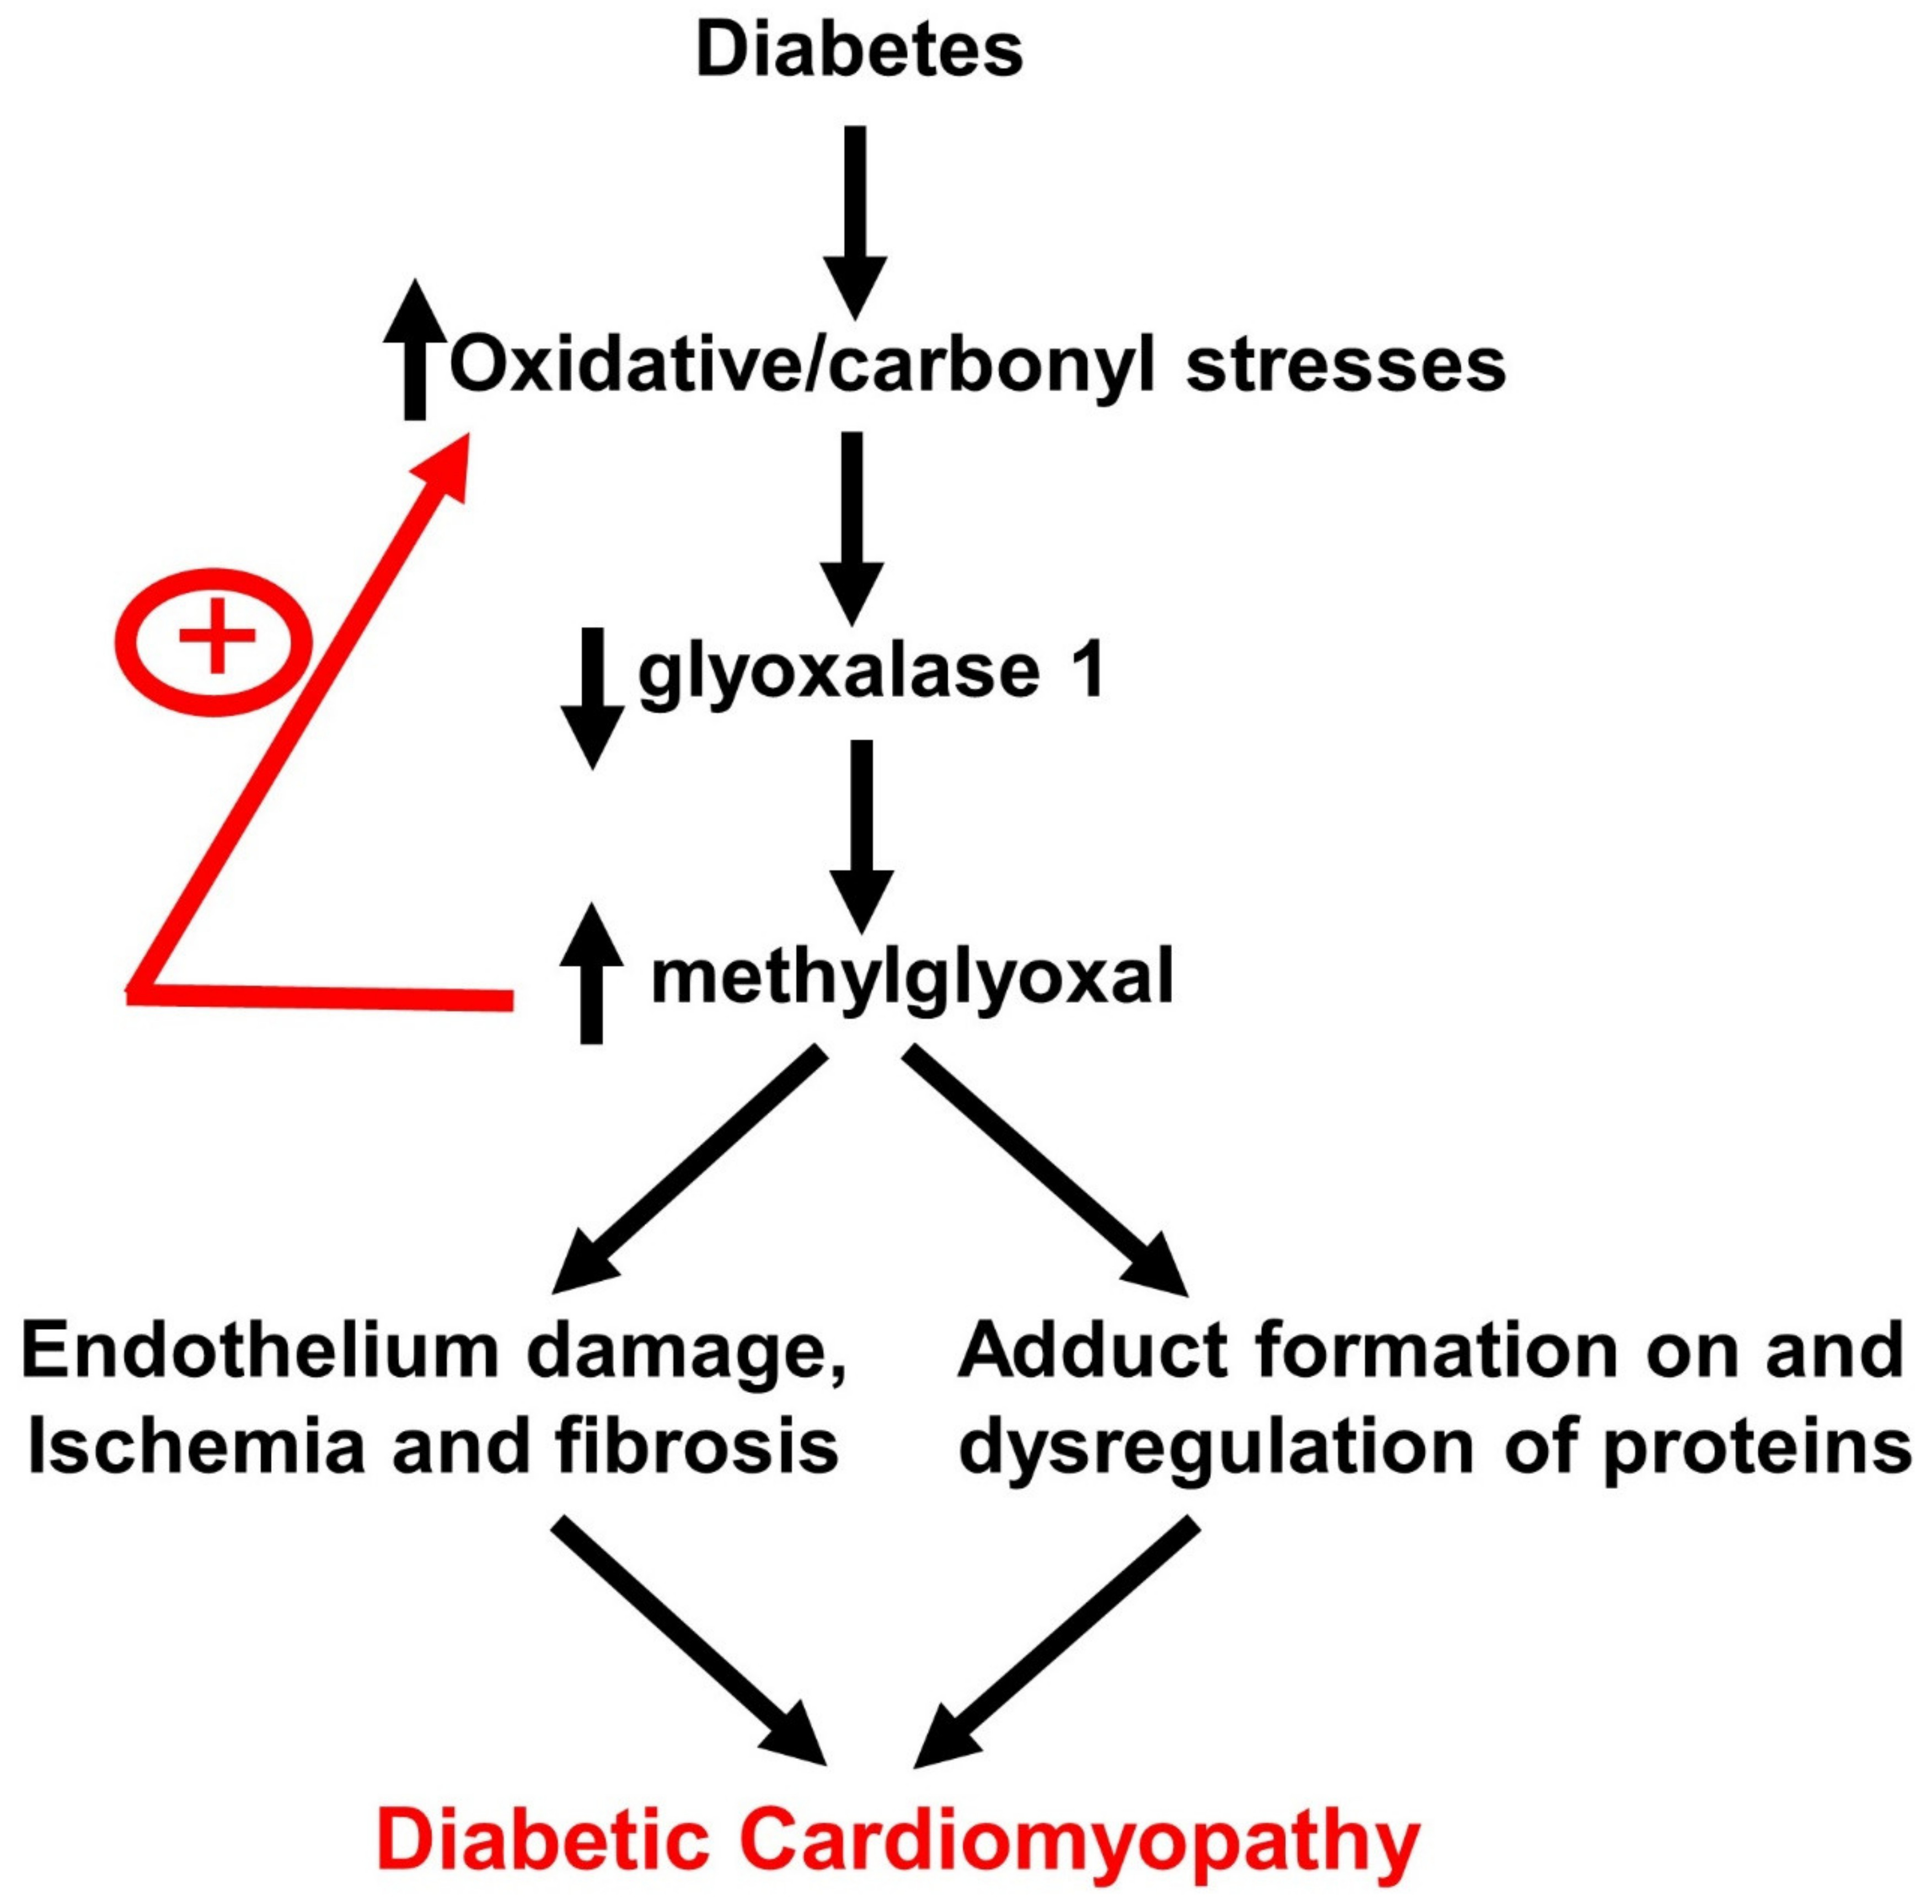
1. Introduction
2. Materials and Methods
2.1. Antibodies and Reagents
2.2. Construction of AAV2/9 Containing Glo1 and eGFP Driven by the Endothelin 1 Promoter
2.3. Induction, Verification, and Treatment of T1DM Rats
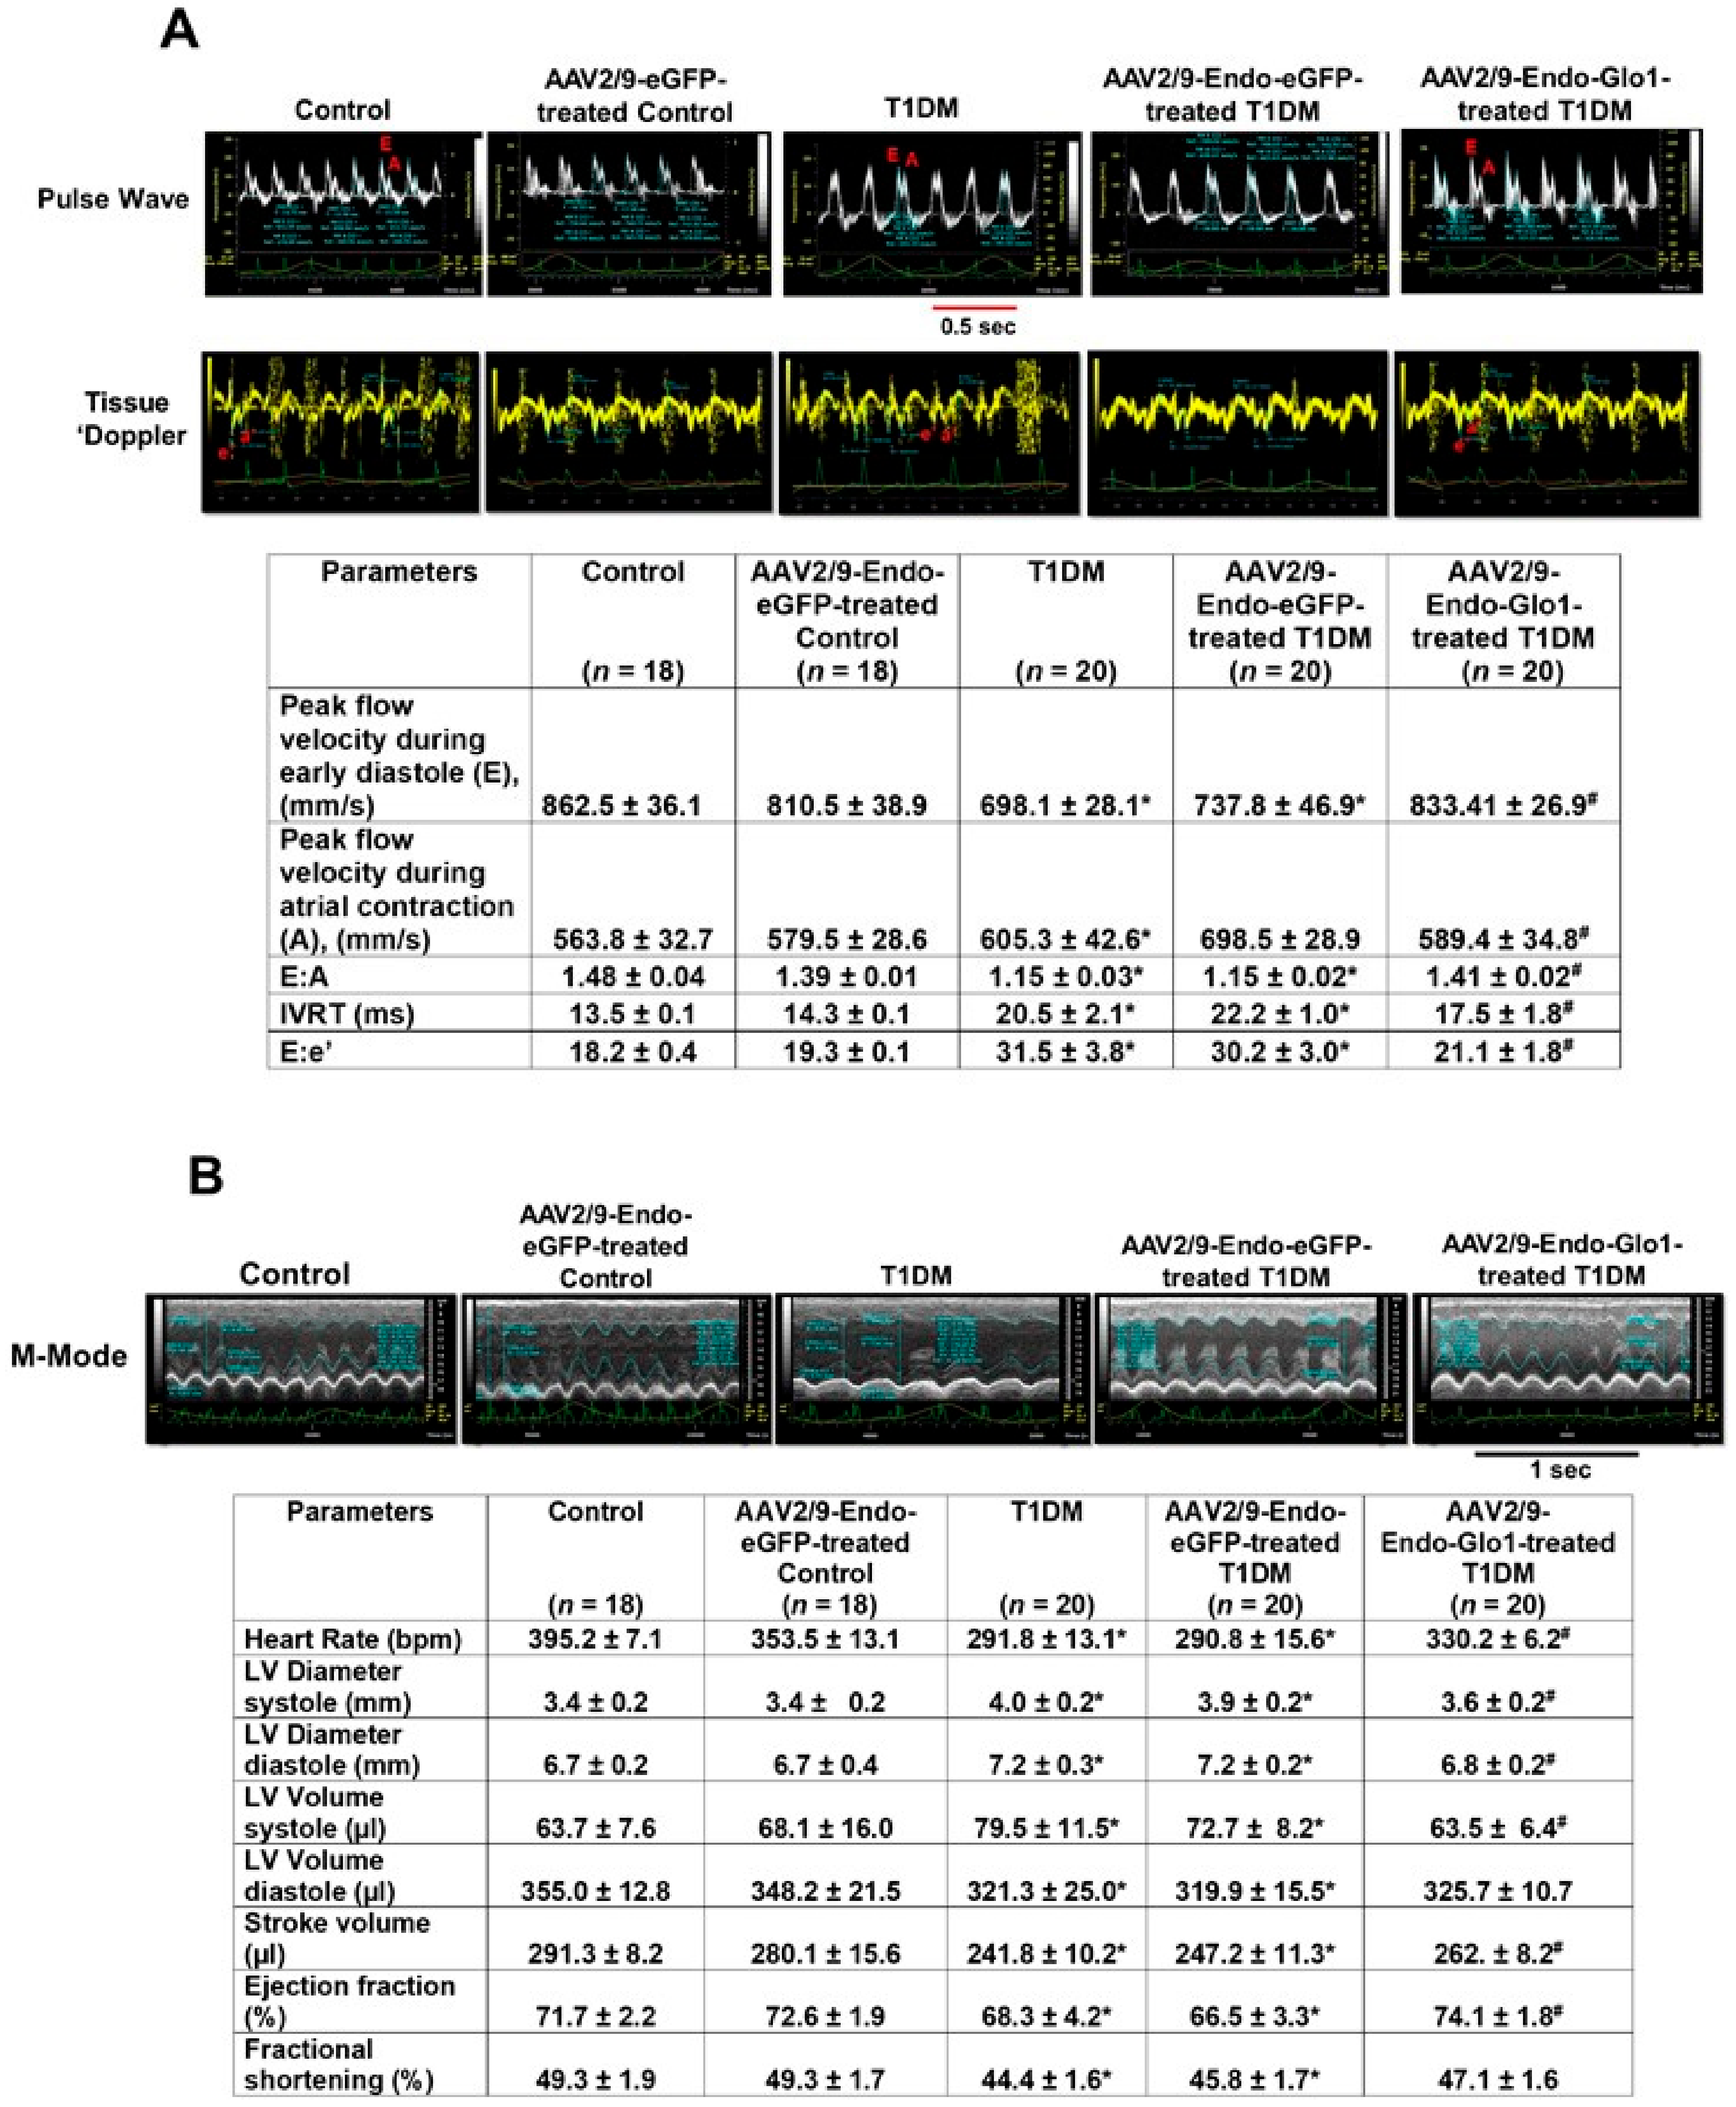
2.4. Assessment of Left Ventricular Function
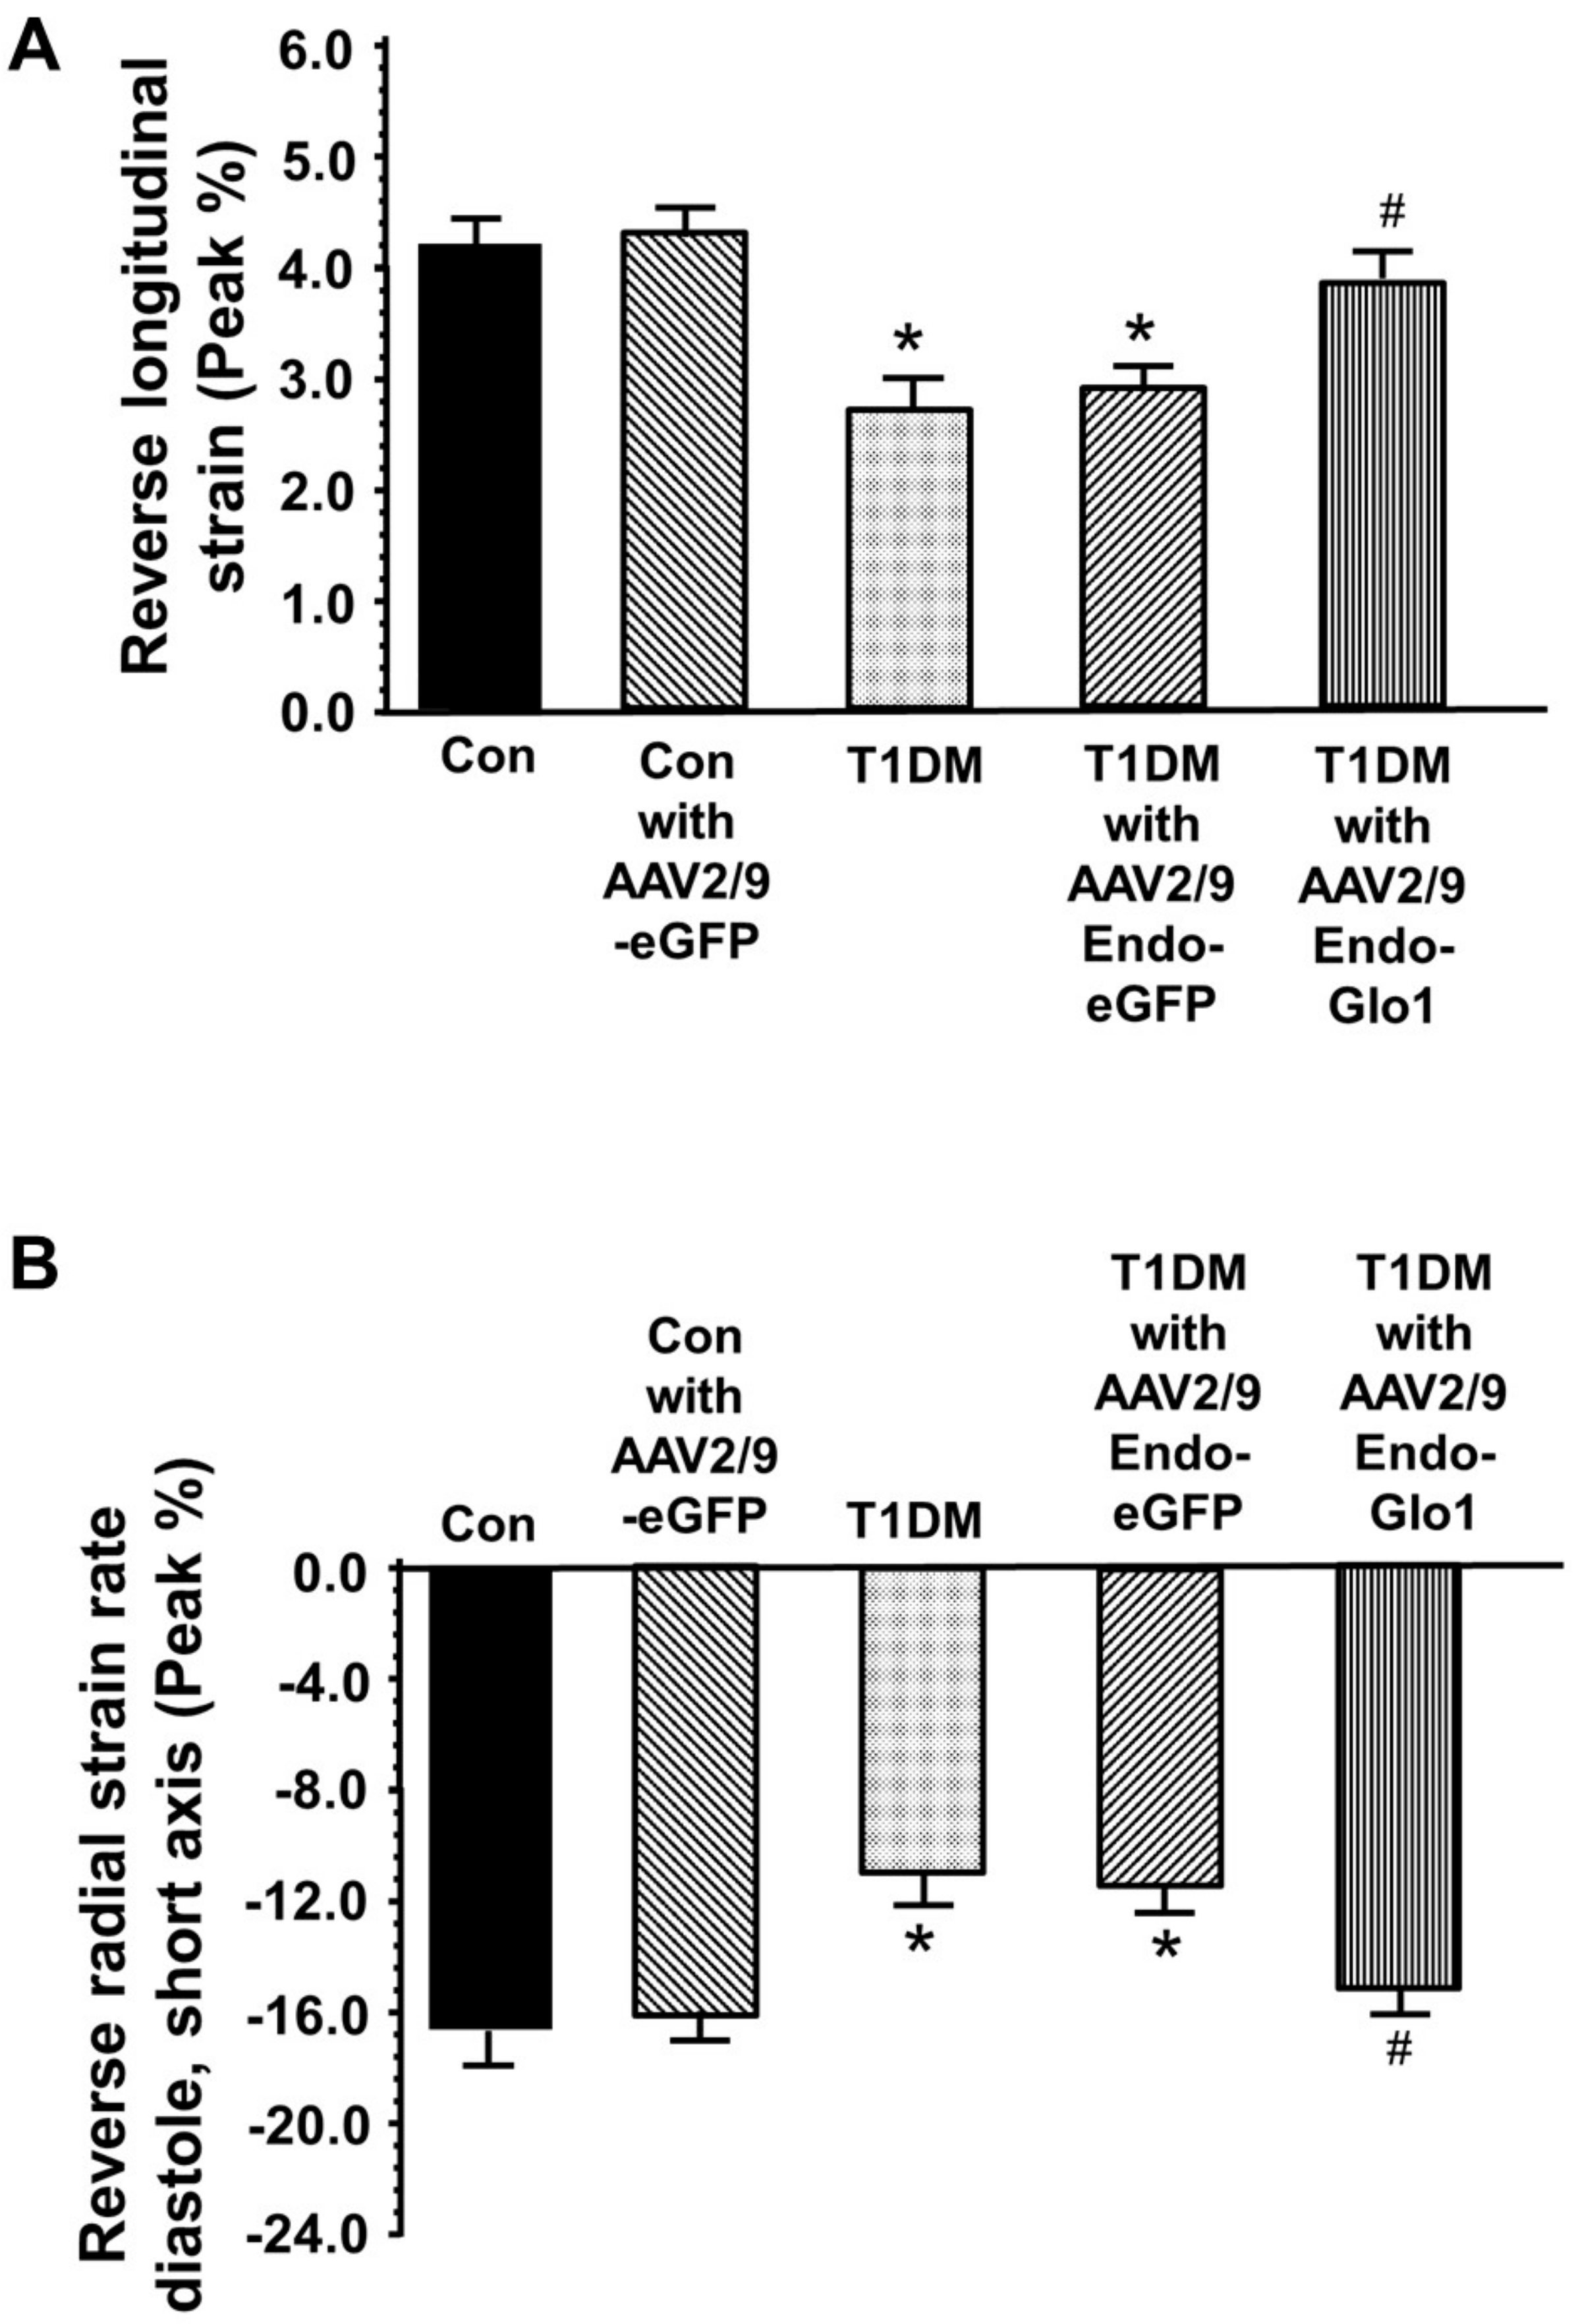
2.5. Assessment of Myocyte Function
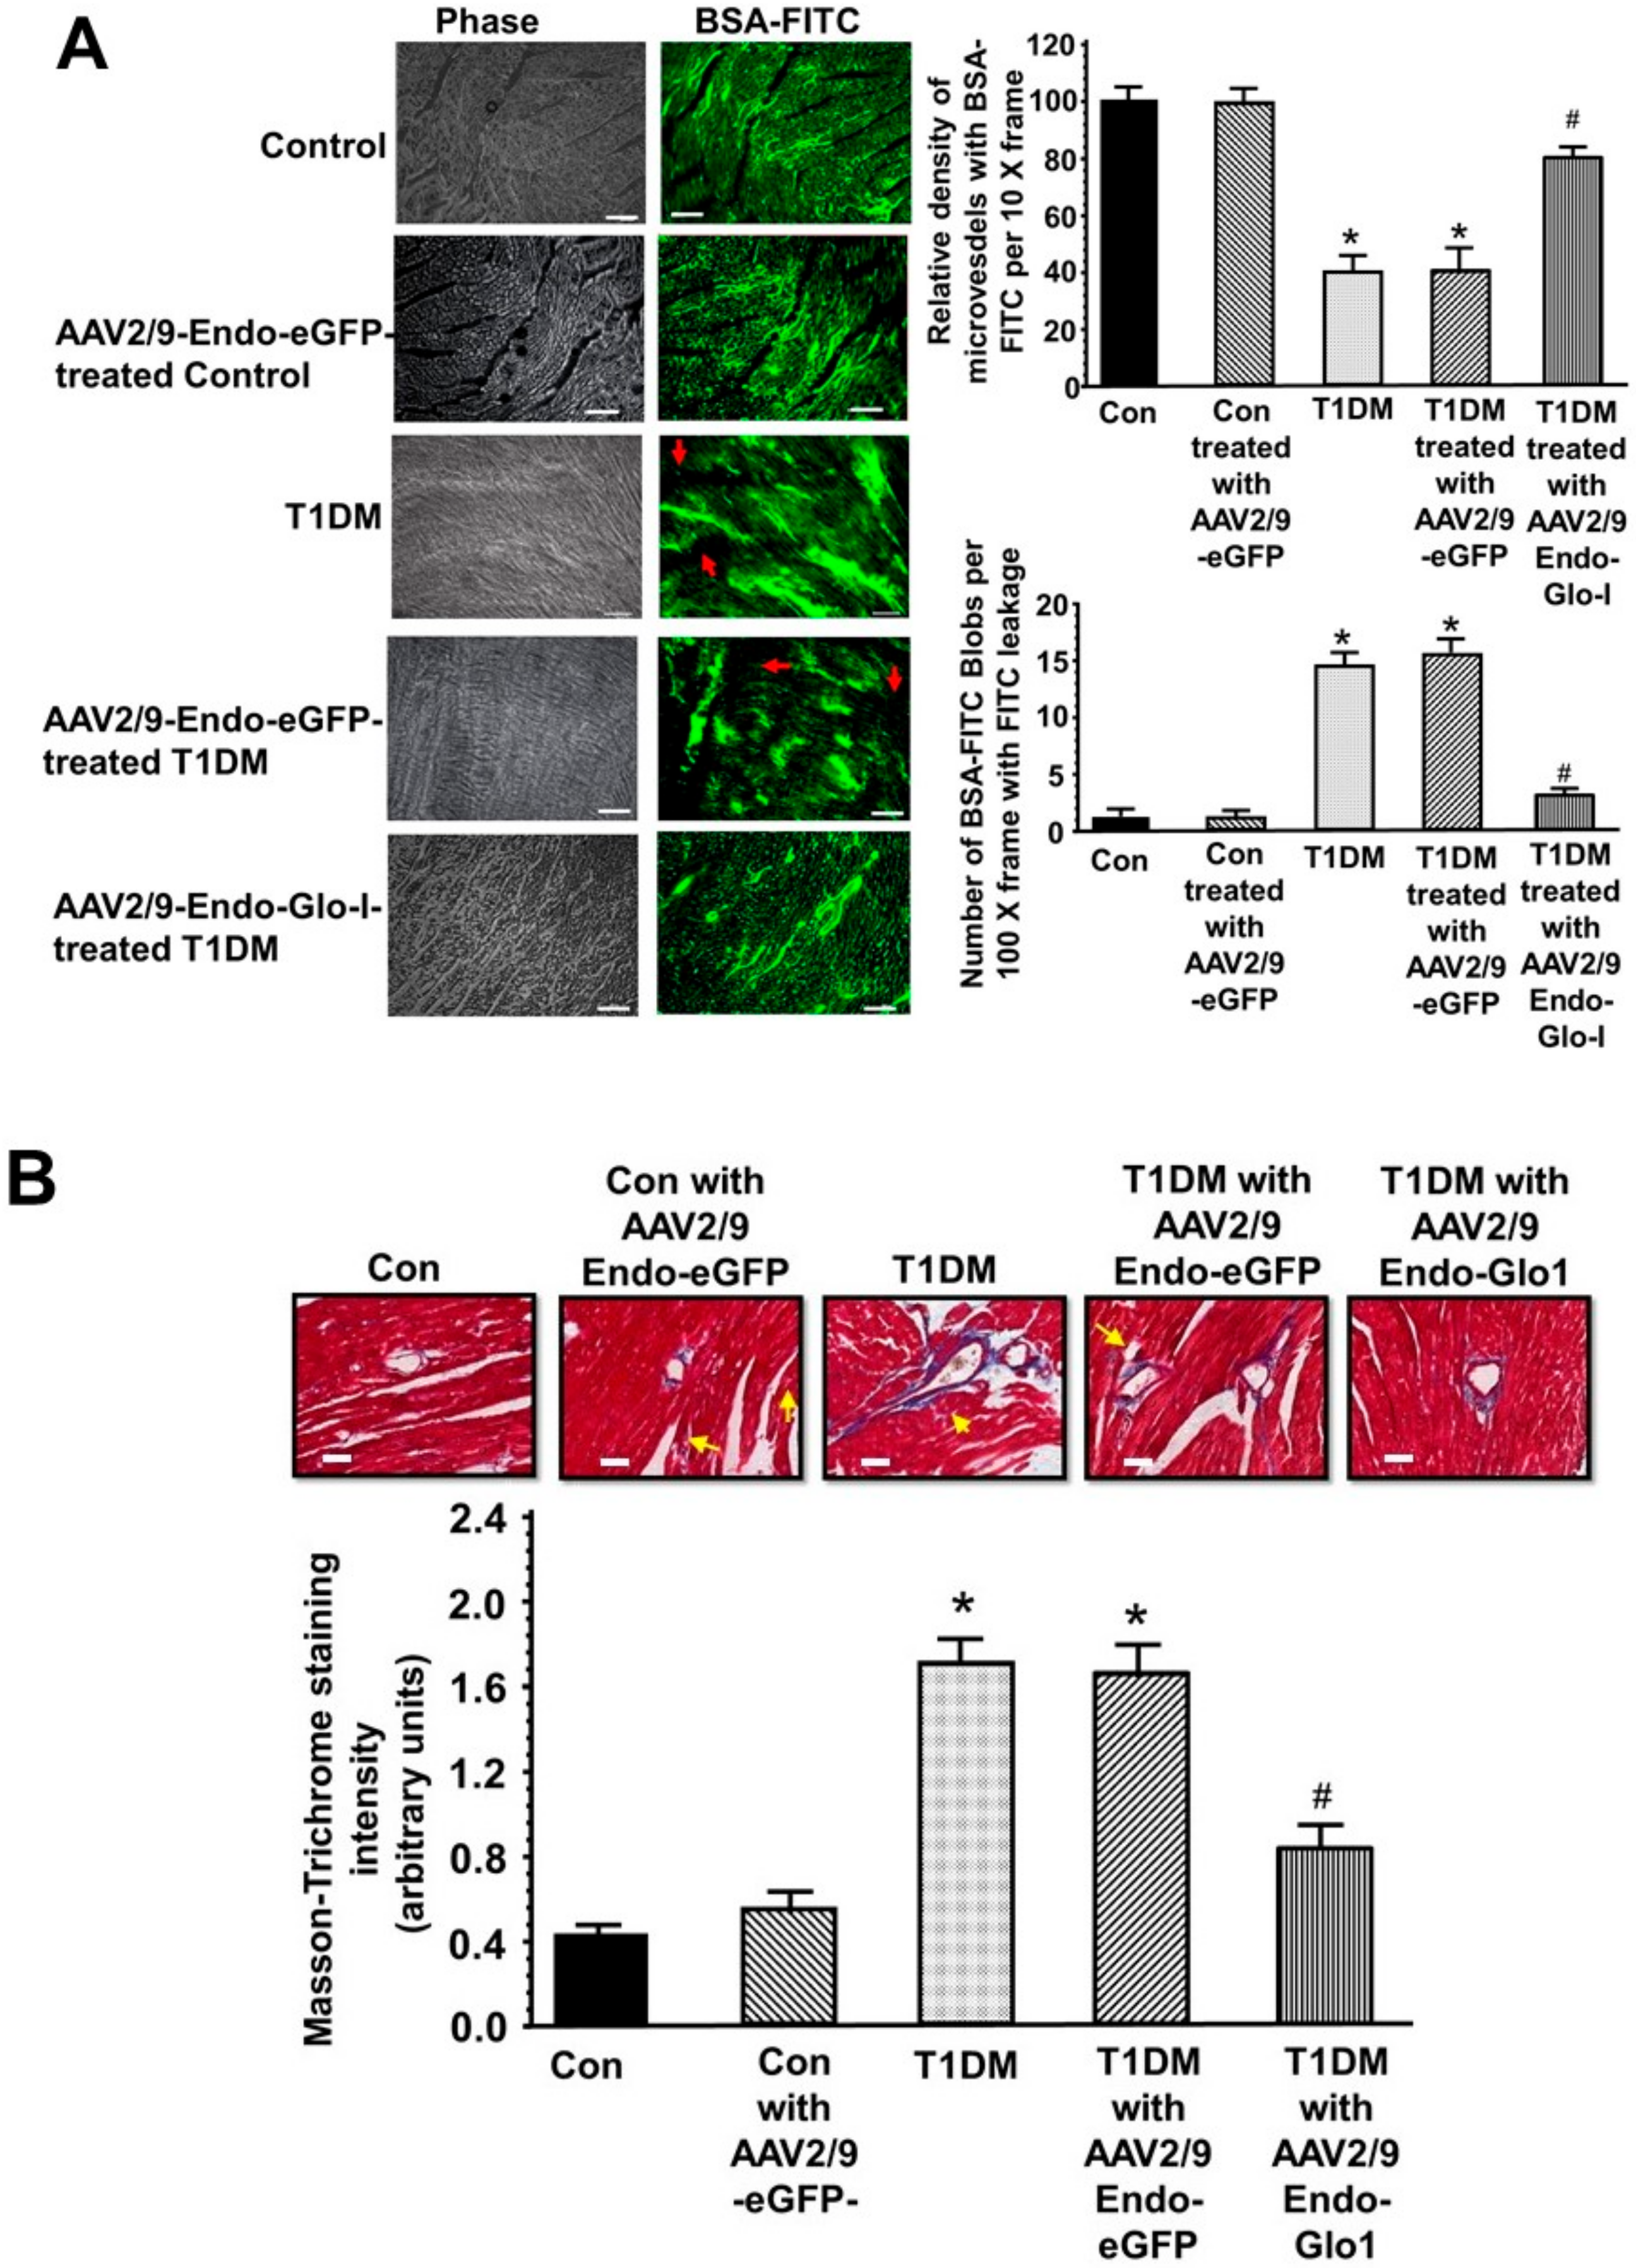
2.6. Histopathological Analyses
2.7. Carbonyl Stress, Oxidative Stress, and Inflammation
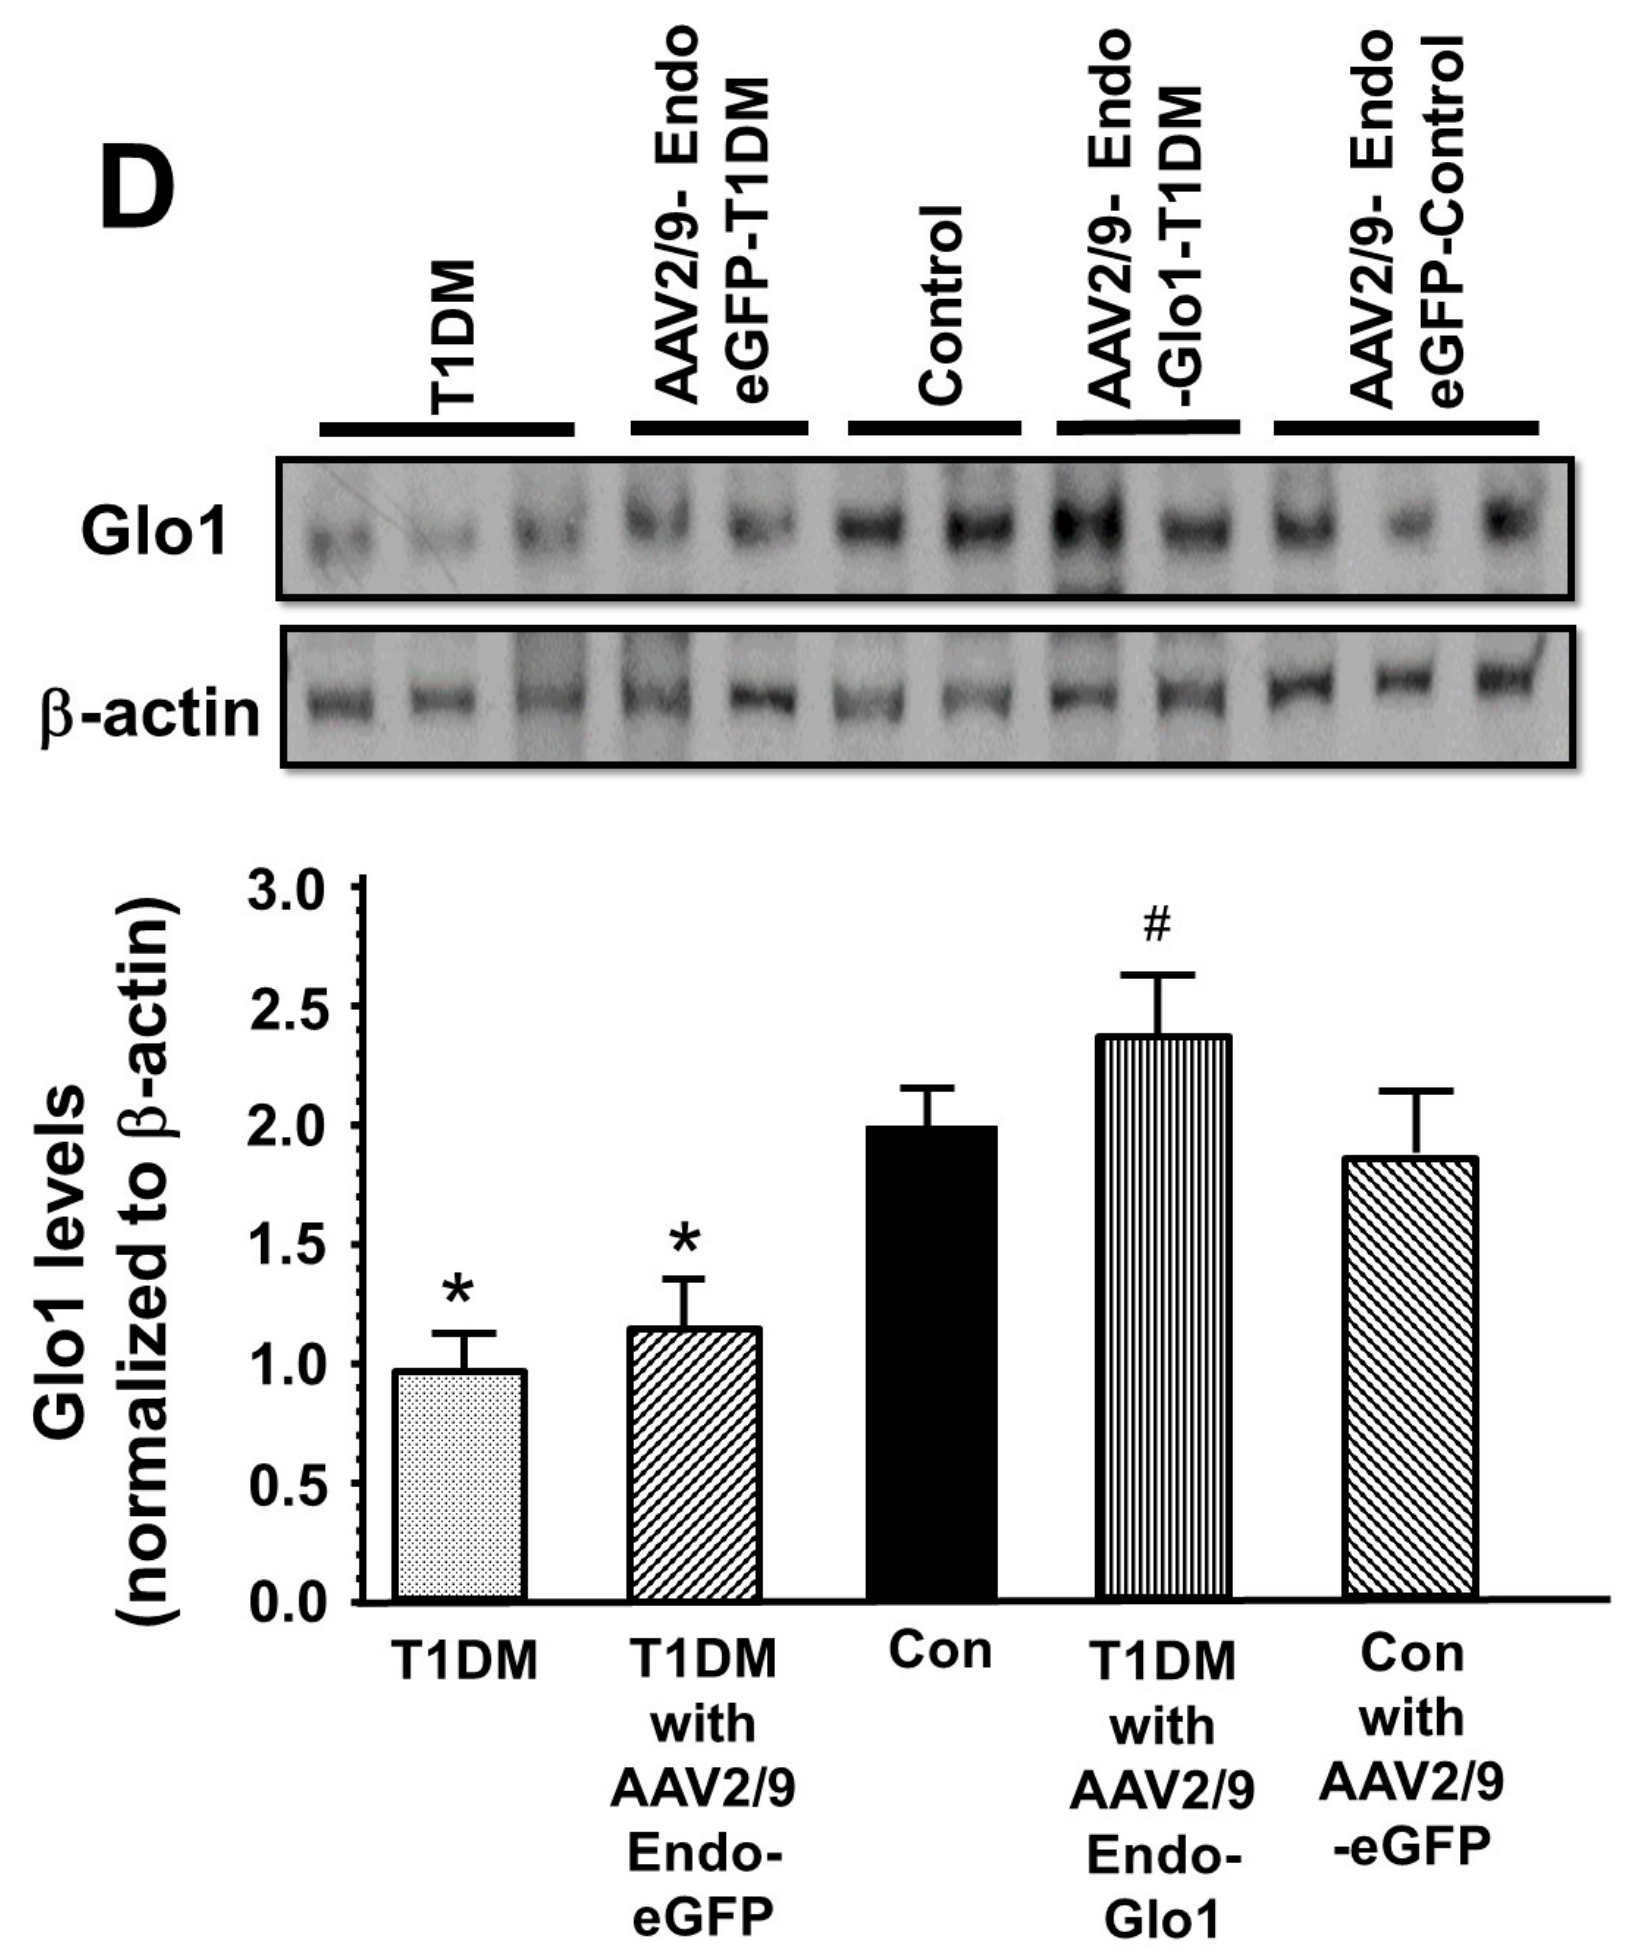
2.8. Glo1 in Ventricular Homogenates
2.9. Methylglyoxal in Sera and Ventricular Homogenates
2.10. Total Thiobarbituric Acid in Sera and Ventricular Homogenates
2.11. Glutathione Levels and Enzymes that Regulate GSH Production
2.12. Statistical Analysis
3. Results
3.1. General Characteristic of Animals
3.2. In Vivo Left Ventricular Function
3.3. Myocyte Function
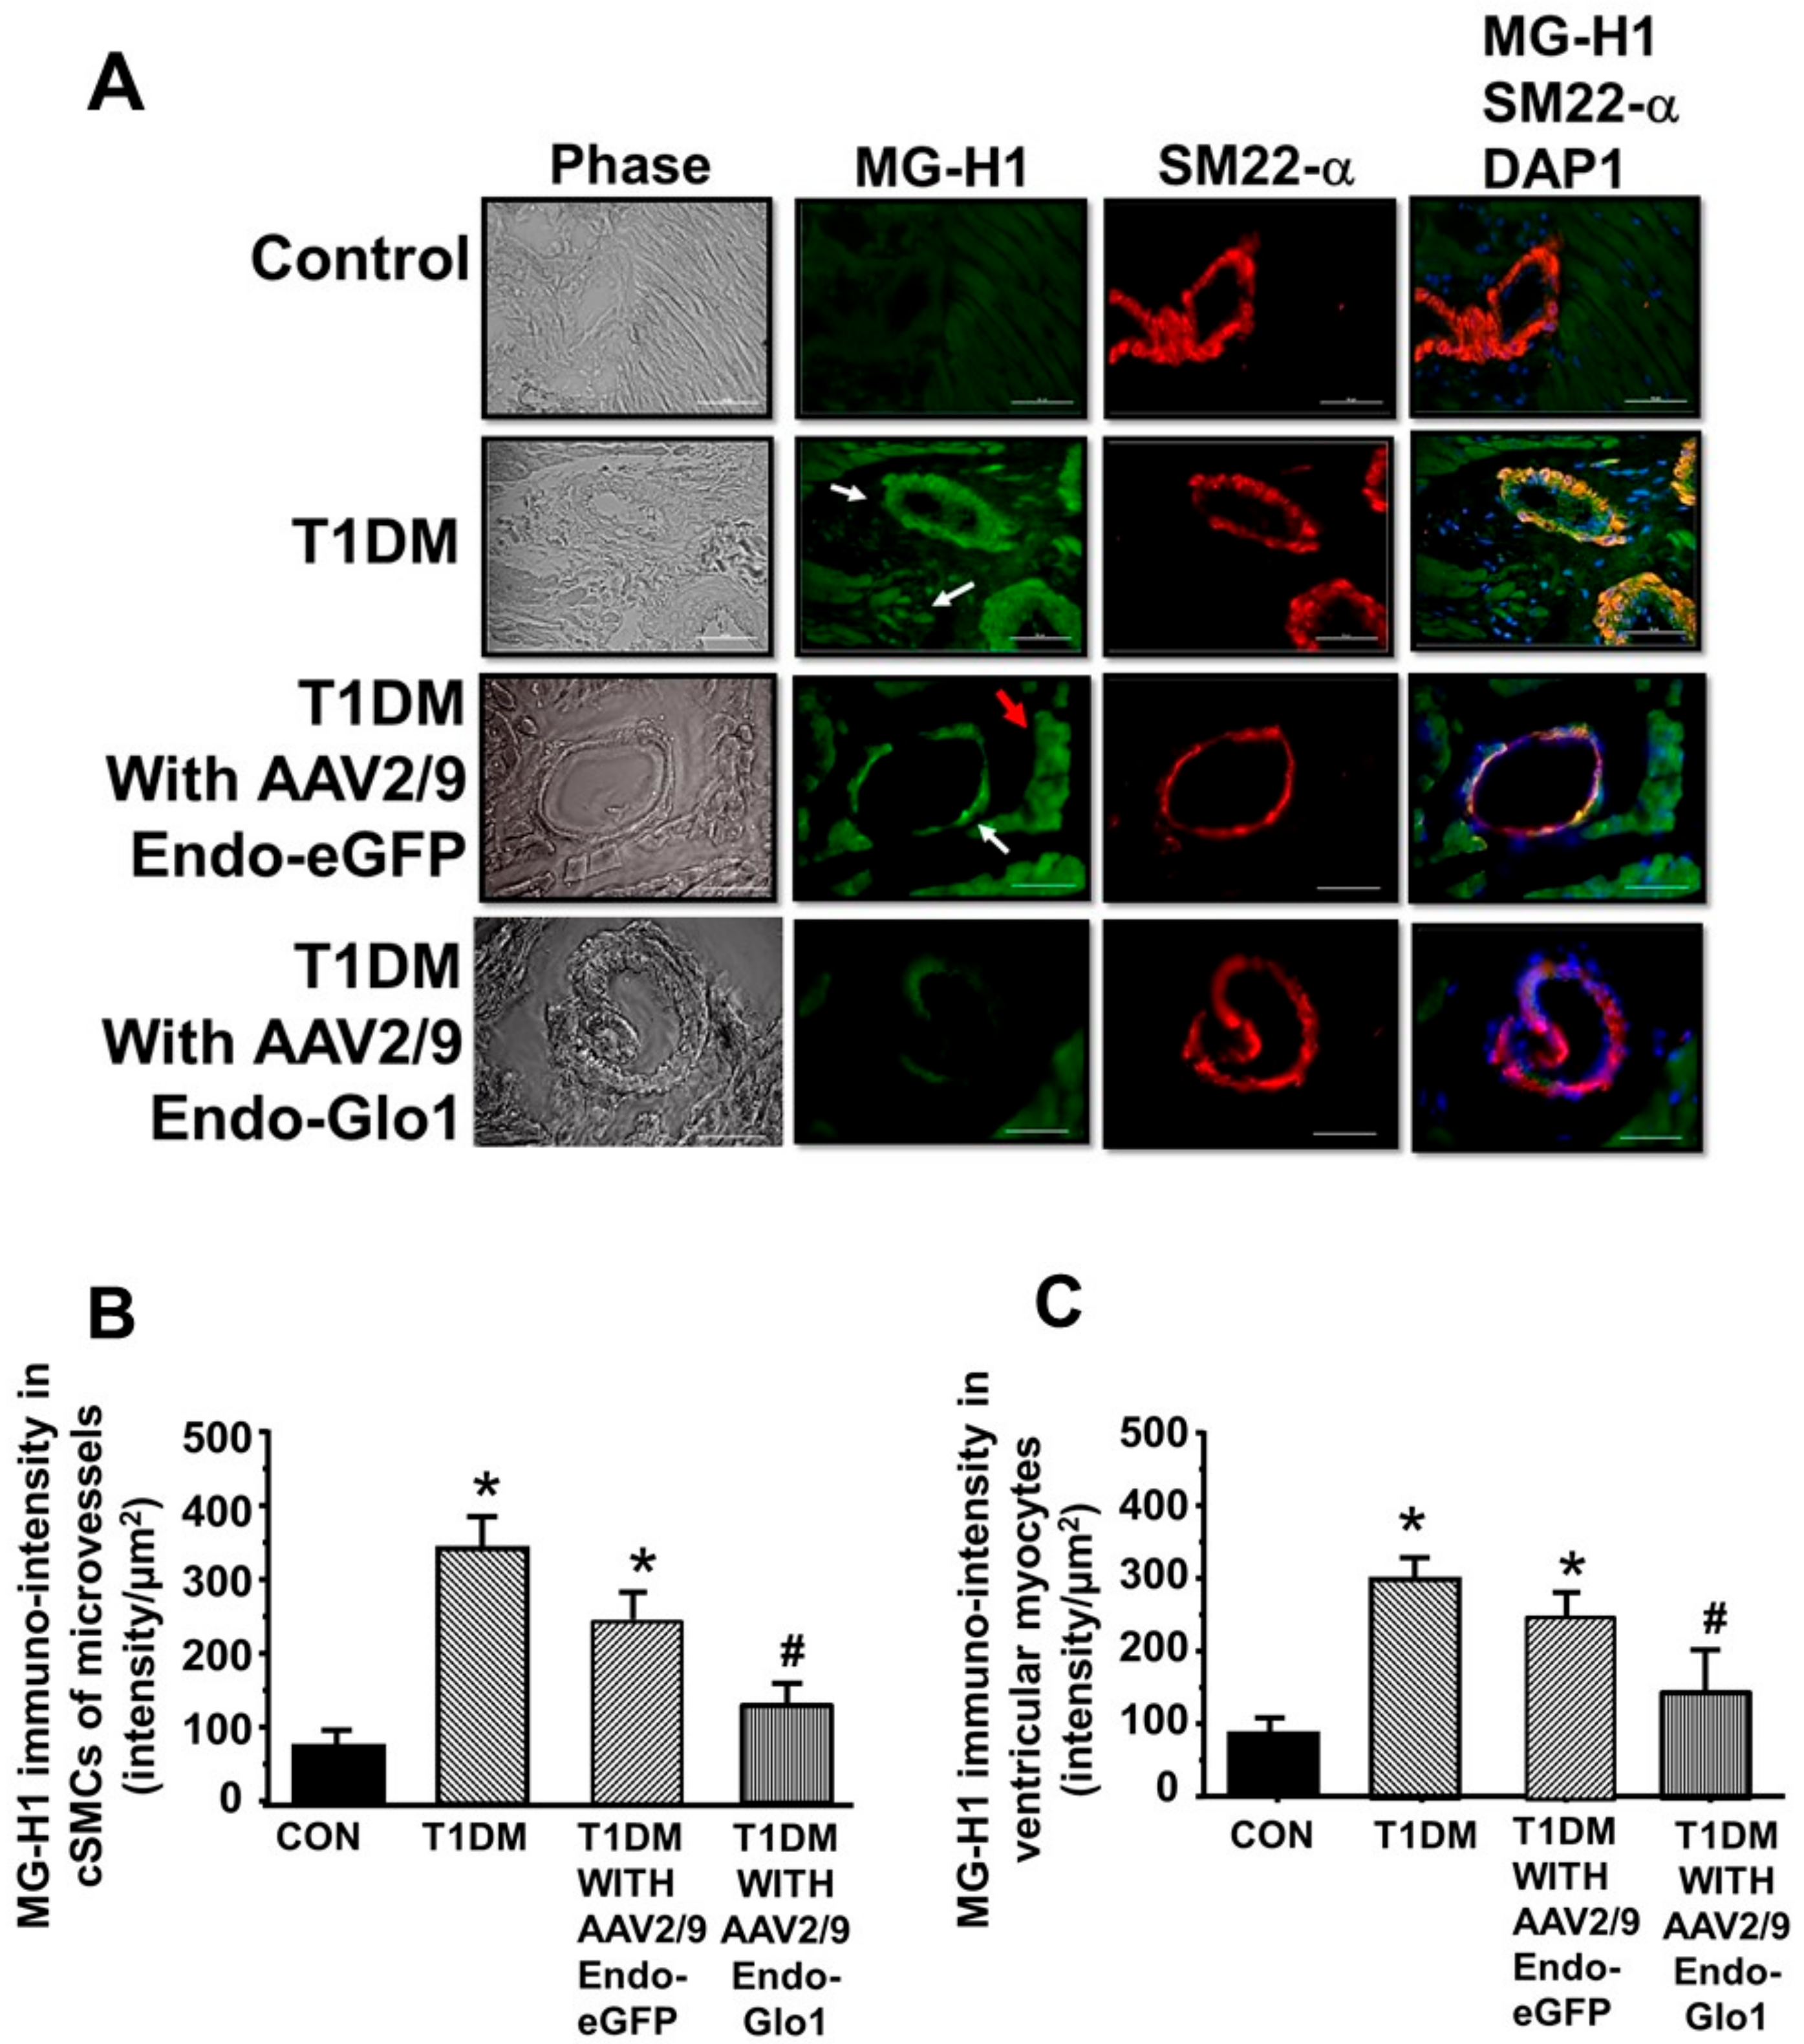
3.4. Histopathological Analyses
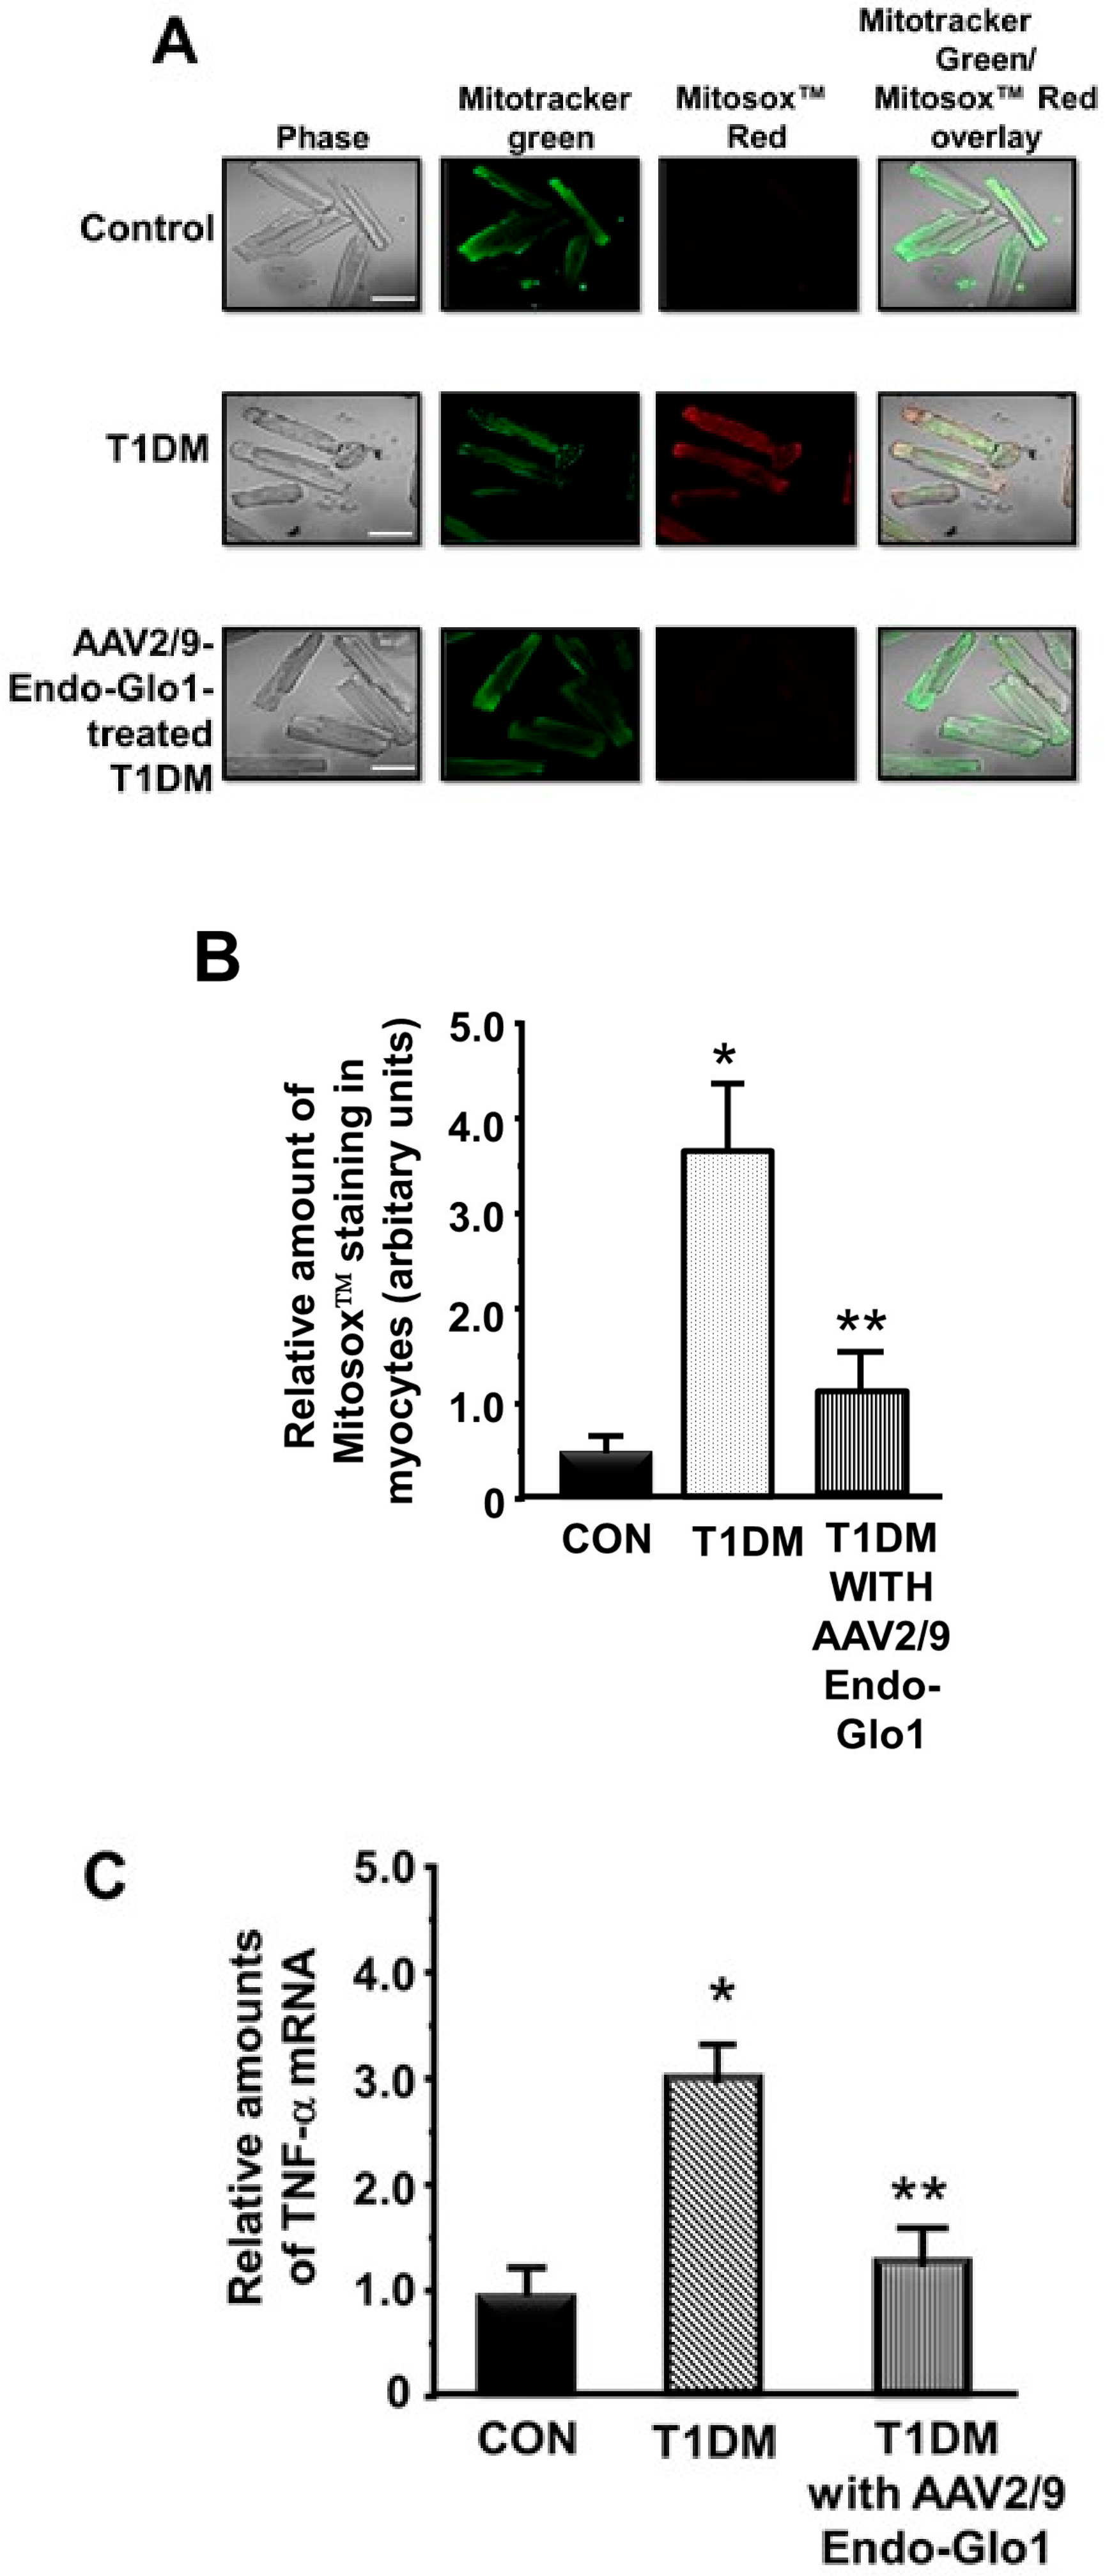
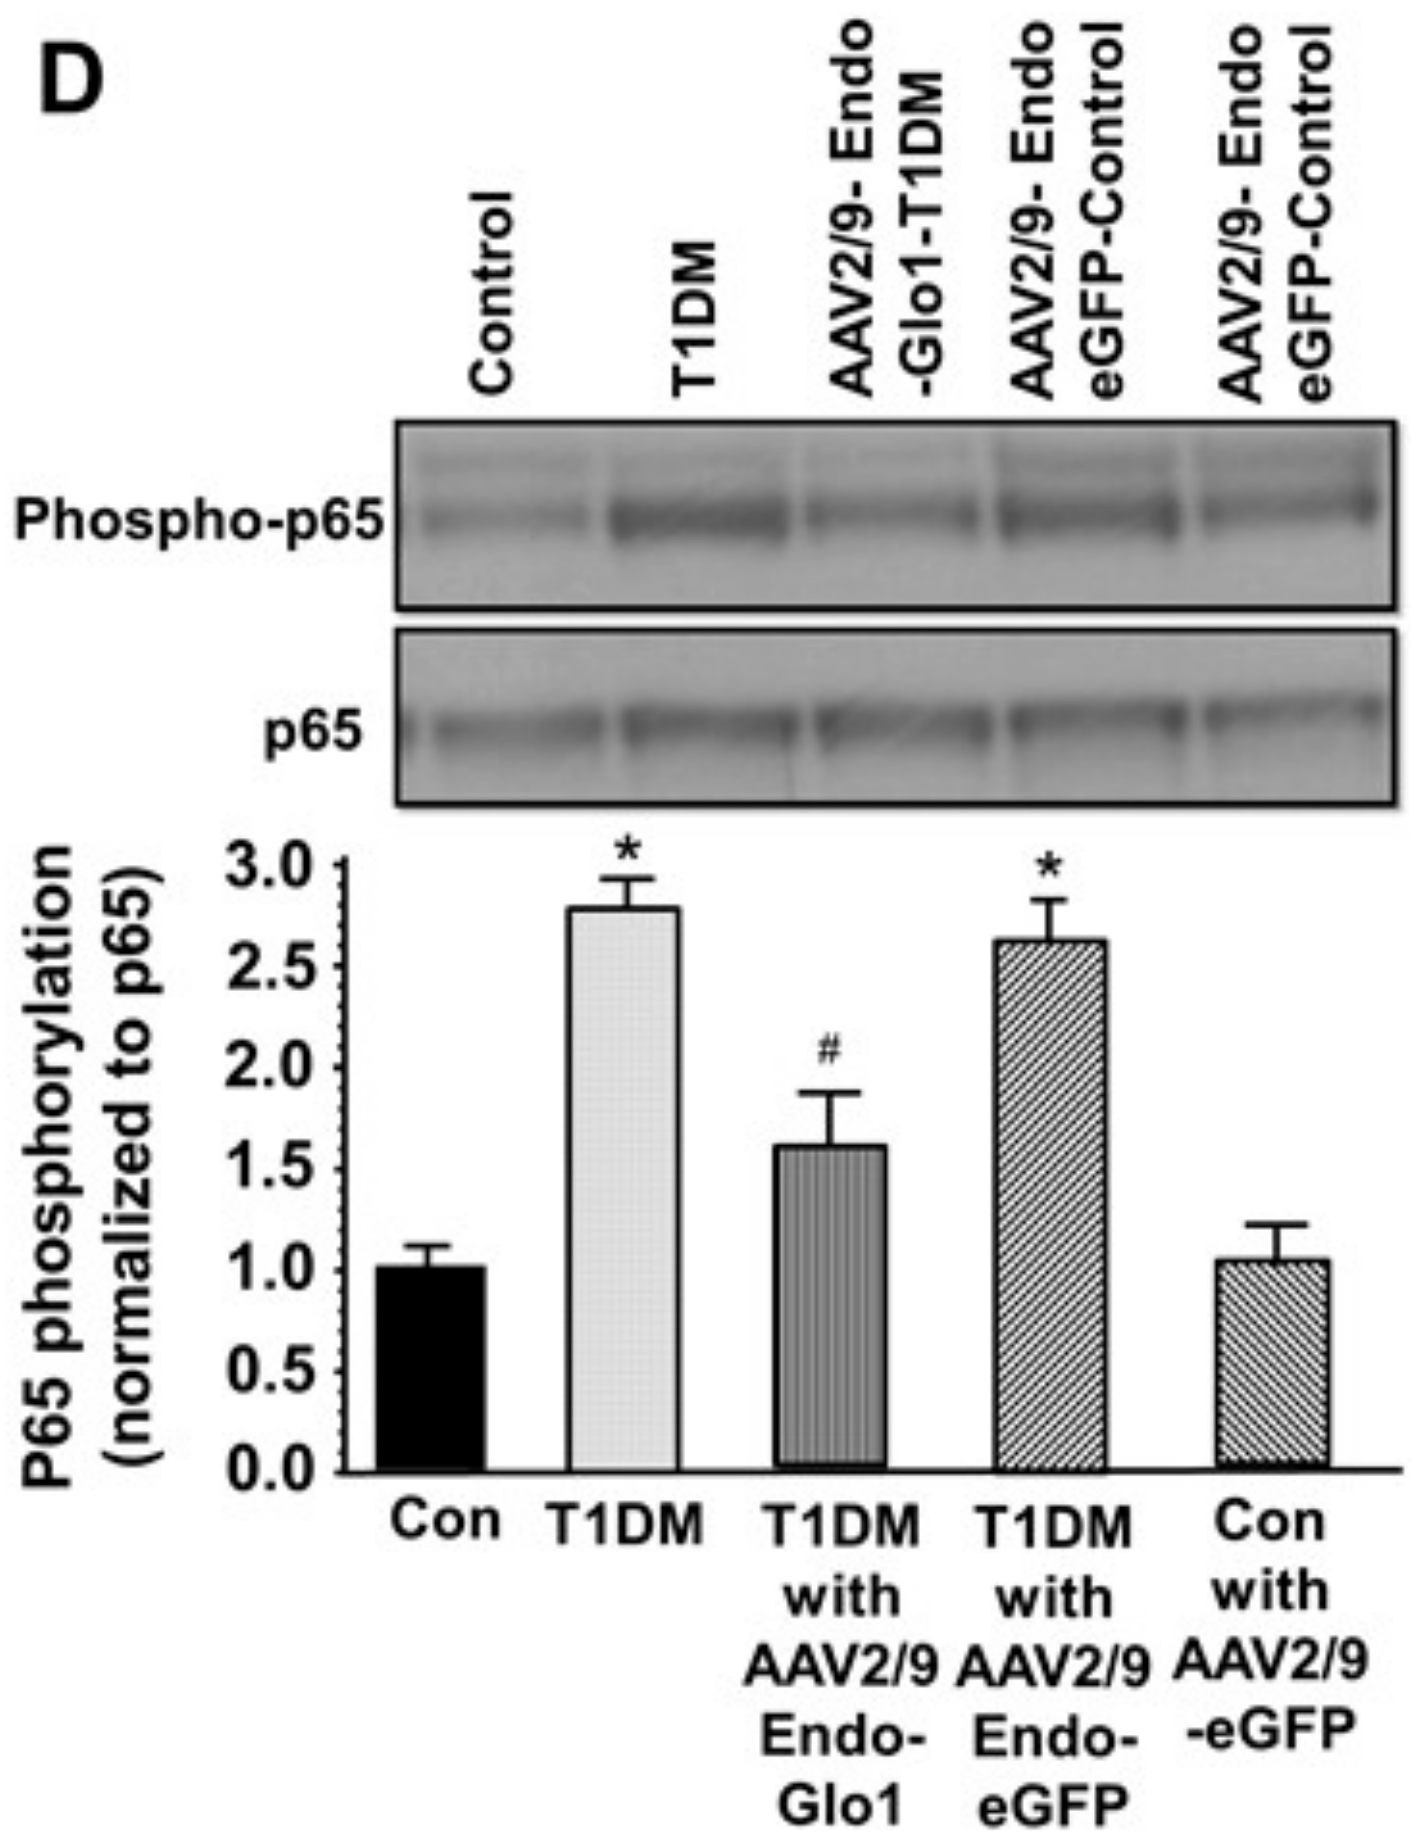
3.5. Oxidative Stress and Inflammation
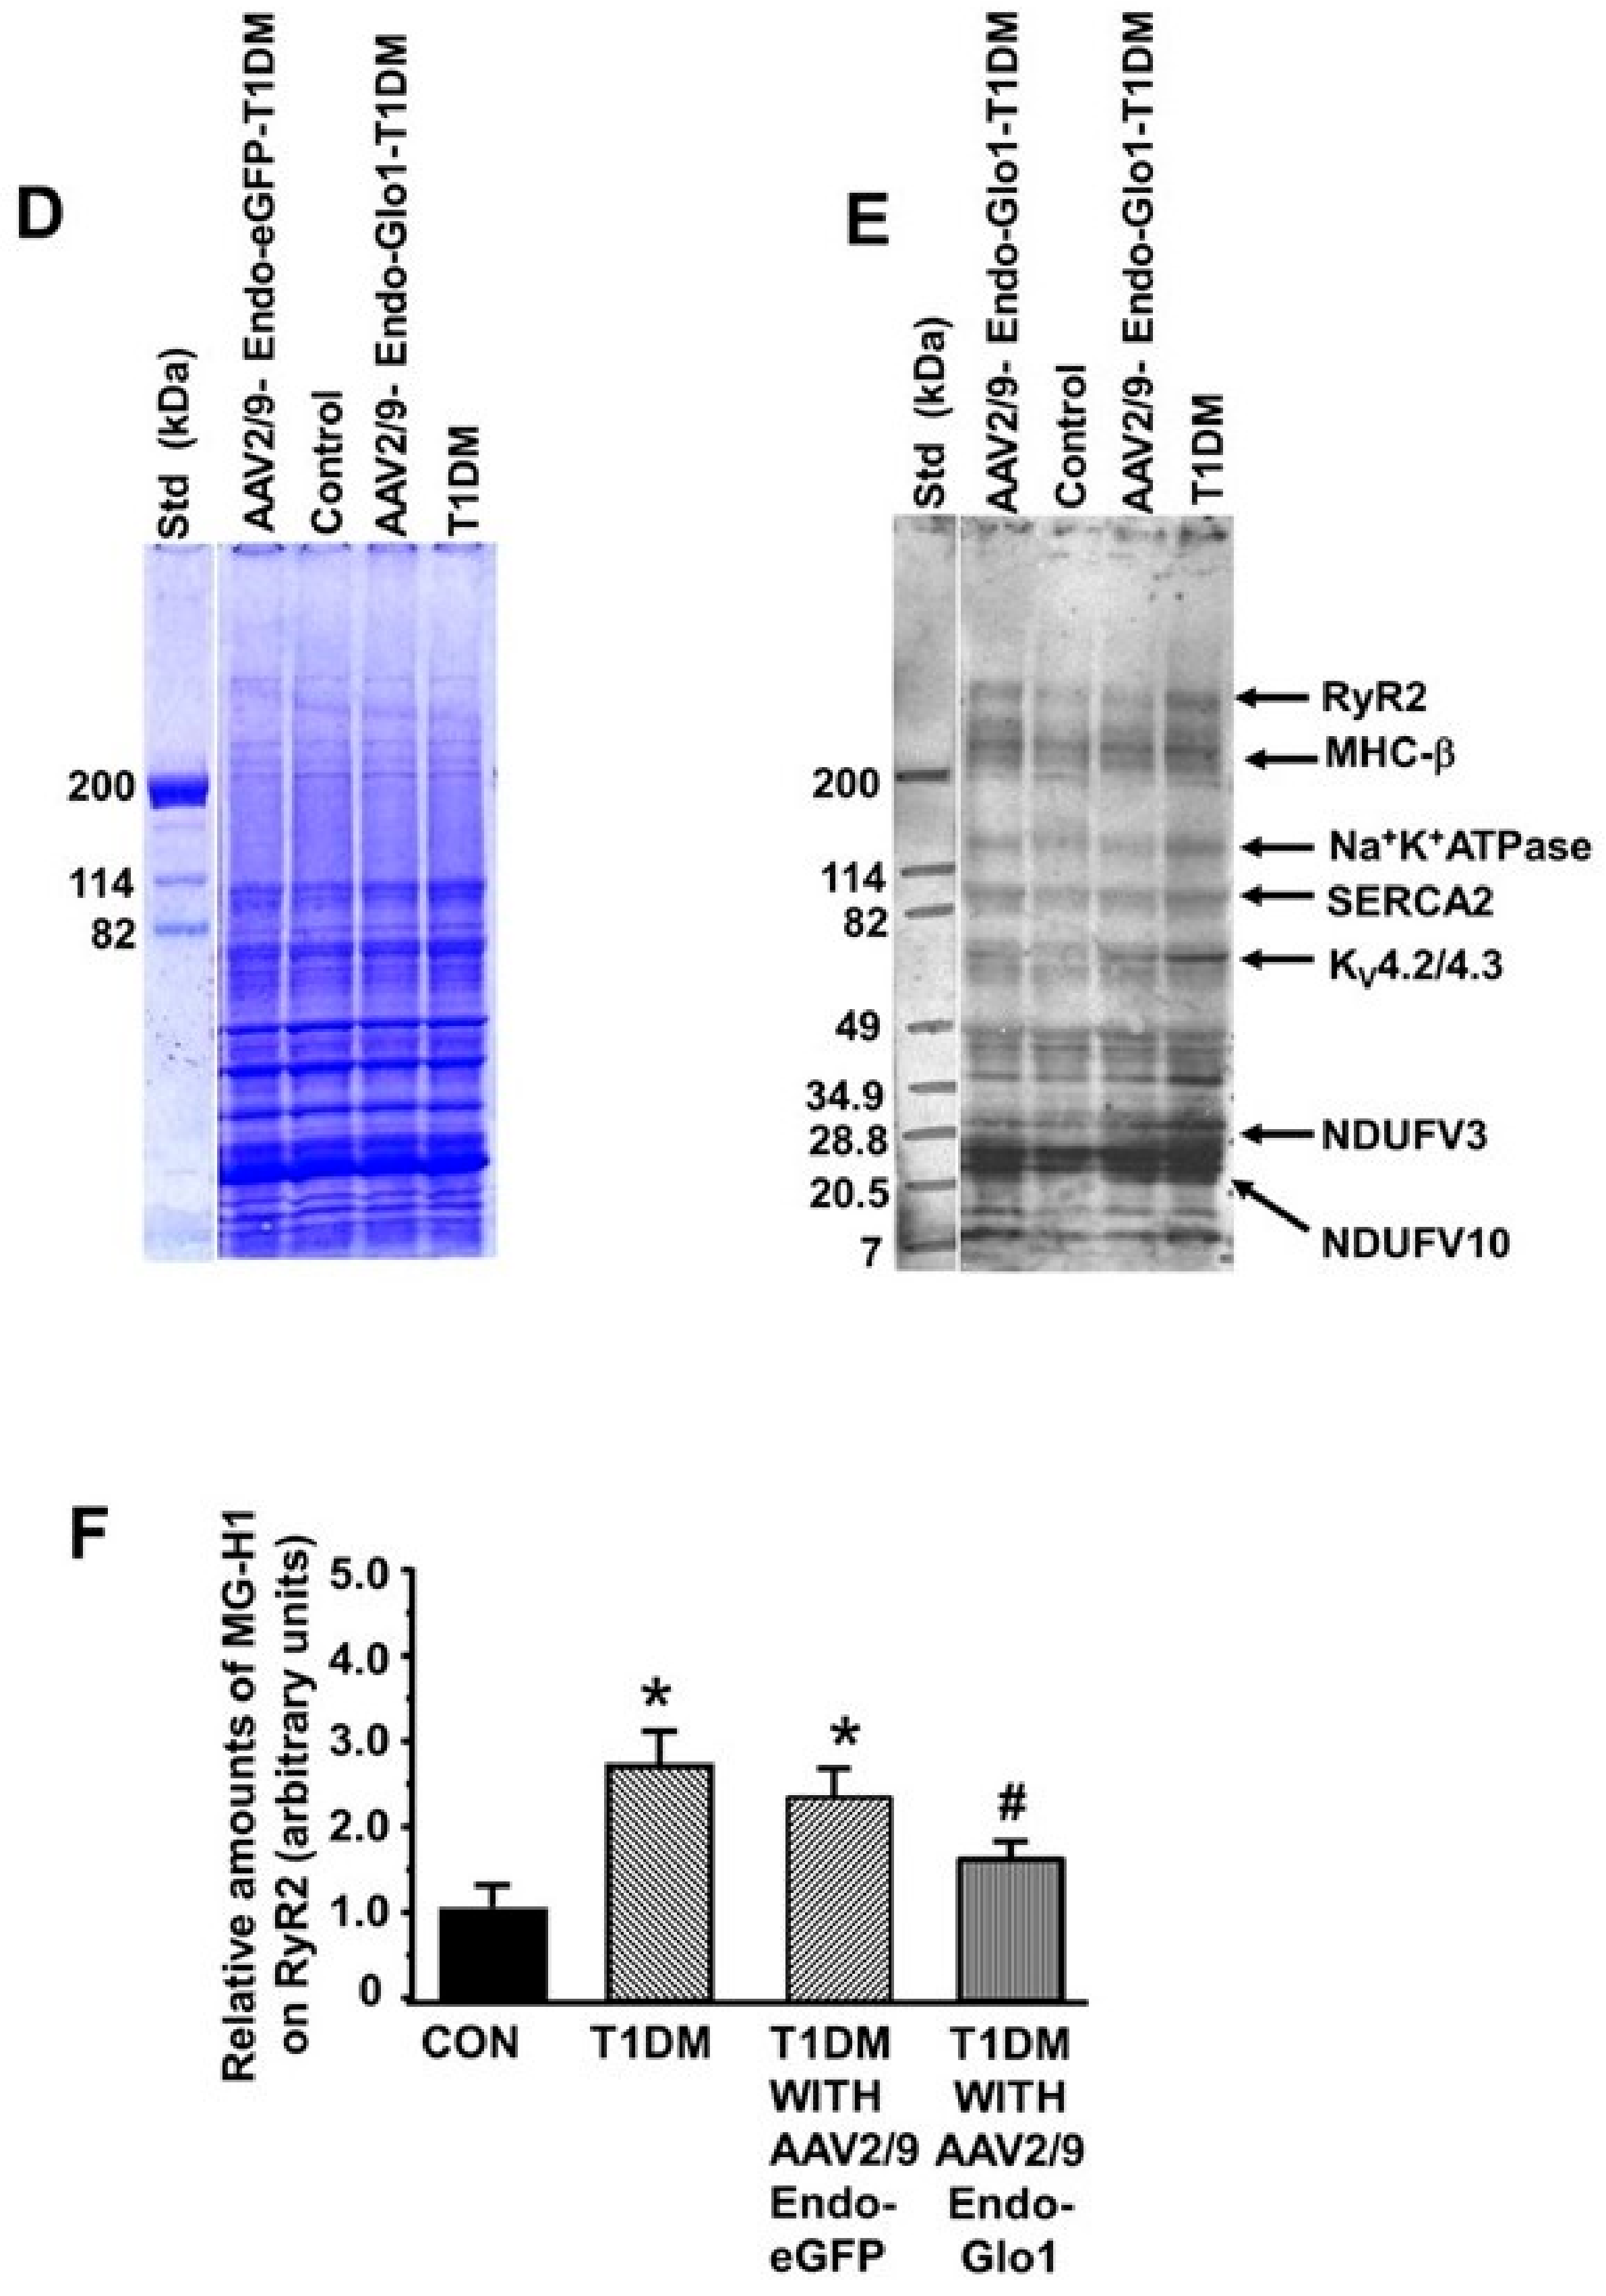
3.6. MG in Ventricular Sera and Homogenates
3.7. Cellular GSH and GSH Regulatory Enzymes Levels
4. Discussion
5. Conclusions
Author Contributions
Funding
Acknowledgments
Conflicts of Interest
References
- Rubler, S.; Dlugash, J.; Yuceoglu, Y.Z.; Kumral, T.; Branwood, A.W.; Grishman, A. New type of cardiomyopathy associated with diabetic glomerulosclerosis. Am. J. Cardiol. 1972, 30, 595–602. [Google Scholar] [CrossRef]
- Yilmaz, S.; Canpolat, U.; Aydogdu, S.; Abboud, H.E. Diabetic Cardiomyopathy; Summary of 41 Years. Korean Circ. J. 2015, 45, 266–272. [Google Scholar] [CrossRef] [PubMed]
- Bugger, H.; Abel, E.D. Molecular mechanisms of diabetic cardiomyopathy. Diabetologia 2014, 57, 660–671. [Google Scholar] [CrossRef] [PubMed]
- Shah, M.S.; Brownlee, M. Molecular and Cellular Mechanisms of Cardiovascular Disorders in Diabetes. Circ. Res. 2016, 118, 1808–1829. [Google Scholar] [CrossRef] [PubMed]
- Joshi, M.; Kotha, S.R.; Malireddy, S.; Selvaraju, V.; Satoskar, A.R.; Palesty, A.; McFadden, D.W.; Parinandi, N.L.; Maulik, N. Conundrum of pathogenesis of diabetic cardiomyopathy: Role of vascular endothelial dysfunction, reactive oxygen species, and mitochondria. Mol. Cell. Biochem. 2014, 386, 233–249. [Google Scholar] [CrossRef]
- Khullar, M.; Al-Shudiefat, A.A.; Ludke, A.; Binepal, G.; Singal, P.K. Oxidative stress: a key contributor to diabetic cardiomyopathy. Can. J. Physiol. Pharmacol. 2010, 88, 233–234. [Google Scholar]
- Gollmer, J.; Zirlik, A.; Bugger, H. Mitochondrial Mechanisms in Diabetic Cardiomyopathy. Diabetes Metab. J. 2020, 44, 33–53. [Google Scholar] [CrossRef]
- Xia, L.; Song, M. Role of Non-coding RNA in Diabetic Cardiomyopathy. Adv. Exp. Med. Biol. 2020, 1229, 181–195. [Google Scholar]
- Flack, J.M.; Hamaty, M.; Staffileno, B.A. Renin-angiotensin-aldosterone-kinin system influences on diabetic vascular disease and cardiomyopathy. Miner. Electrolyte Metab. 1998, 24, 412–422. [Google Scholar] [CrossRef]
- Biswas, S.; Thomas, A.A.; Chakrabarti, S. LncRNAs: Proverbial Genomic “Junk” or Key Epigenetic Regulators During Cardiac Fibrosis in Diabetes? Front. Cardiovasc. Med. 2018, 5, 28. [Google Scholar] [CrossRef]
- Baseler, W.A.; Thapa, D.; Jagannathan, R.; Dabkowski, E.R.; Croston, T.L.; Hollander, J.M. miR-141 as a regulator of the mitochondrial phosphate carrier (Slc25a3) in the type 1 diabetic heart. Am. J. Physiol. Cell Physiol. 2012, 303, C1244–C1251. [Google Scholar] [CrossRef] [PubMed]
- Costantino, S.; Paneni, F.; Luscher, T.F.; Cosentino, F. MicroRNA profiling unveils hyperglycaemic memory in the diabetic heart. Eur. Heart J. 2016, 37, 572–576. [Google Scholar] [CrossRef] [PubMed]
- Duncan, J.G. Mitochondrial dysfunction in diabetic cardiomyopathy. Biochim. Biophys. Acta 2011, 1813, 1351–1359. [Google Scholar] [CrossRef] [PubMed]
- Brouwers, O.; de Vos-Houben, J.M.; Niessen, P.M.; Miyata, T.; van Nieuwenhoven, F.; Janssen, B.J.; Hageman, G.; Stehouwer, C.D.; Schalkwijk, C.G. Mild oxidative damage in the diabetic rat heart is attenuated by glyoxalase-1 overexpression. Int. J. Mol. Sci. 2013, 14, 15724–15739. [Google Scholar] [CrossRef]
- Vulesevic, B.; McNeill, B.; Giacco, F.; Maeda, K.; Blackburn, N.J.; Brownlee, M.; Milne, R.W.; Suuronen, E.J. Methylglyoxal-Induced Endothelial Cell Loss and Inflammation Contribute to the Development of Diabetic Cardiomyopathy. Diabetes 2016, 65, 1699–1713. [Google Scholar] [CrossRef]
- Vulesevic, B.; Milne, R.W.; Suuronen, E.J. Reducing methylglyoxal as a therapeutic target for diabetic heart disease. Biochem. Soc. Trans. 2014, 42, 523–527. [Google Scholar] [CrossRef]
- Shao, C.H.; Tian, C.; Ouyang, S.; Moore, C.J.; Alomar, F.; Nemet, I.; D’Souza, A.; Nagai, R.; Kutty, S.; Rozanski, G.J.; et al. Carbonylation induces heterogeneity in cardiac ryanodine receptor function in diabetes mellitus. Mol. Pharmacol. 2012, 82, 383–399. [Google Scholar] [CrossRef]
- Shao, C.H.; Capek, H.L.; Patel, K.P.; Wang, M.; Tang, K.; DeSouza, C.; Nagai, R.; Mayhan, W.; Periasamy, M.; Bidasee, K.R. Carbonylation contributes to SERCA2a activity loss and diastolic dysfunction in a rat model of type 1 diabetes. Diabetes 2011, 60, 947–959. [Google Scholar] [CrossRef]
- Antognelli, C.; Talesa, V.N. Glyoxalases in Urological Malignancies. Int. J. Mol. Sci. 2018, 19, 415. [Google Scholar] [CrossRef]
- Nigro, C.; Leone, A.; Raciti, G.A.; Longo, M.; Mirra, P.; Formisano, P.; Beguinot, F.; Miele, C. Methylglyoxal-Glyoxalase 1 Balance: The Root of Vascular Damage. Int. J. Mol. Sci. 2017, 18, 188. [Google Scholar] [CrossRef]
- Thornalley, P.J. The glyoxalase system: New developments towards functional characterization of a metabolic pathway fundamental to biological life. Biochem. J. 1990, 269, 1–11. [Google Scholar] [CrossRef] [PubMed]
- Xue, M.; Rabbani, N.; Momiji, H.; Imbasi, P.; Anwar, M.M.; Kitteringham, N.; Park, B.K.; Souma, T.; Moriguchi, T.; Yamamoto, M.; et al. Transcriptional control of glyoxalase 1 by Nrf2 provides a stress-responsive defense against dicarbonyl glycation. Biochem. J. 2012, 443, 213–222. [Google Scholar] [CrossRef] [PubMed]
- Suh, K.S.; Choi, E.M.; Jung, W.W.; Kim, Y.J.; Hong, S.M.; Park, S.Y.; Rhee, S.Y.; Chon, S. Deoxyactein protects pancreatic beta-cells against methylglyoxal-induced oxidative cell damage by the upregulation of mitochondrial biogenesis. Int. J. Mol. Med. 2017, 40, 539–548. [Google Scholar] [CrossRef] [PubMed]
- Alomar, F.; Singh, J.; Jang, H.S.; Rozanski, G.J.; Shao, C.H.; Padanilam, B.J.; Mayhan, W.G.; Bidasee, K.R. Smooth muscle-generated methylglyoxal impairs endothelial cell-mediated vasodilatation of cerebral micro-vessels in type 1 diabetic rats. Br. J. Pharmacol. 2016, 17, 3307–3326. [Google Scholar] [CrossRef] [PubMed]
- Lin, C.C.; Chan, C.M.; Huang, Y.P.; Hsu, S.H.; Huang, C.L.; Tsai, S.J. Methylglyoxal activates NF-kappaB nuclear translocation and induces COX-2 expression via a p38-dependent pathway in synovial cells. Life Sci. 2016, 149, 25–33. [Google Scholar] [CrossRef]
- Li, B.; Liu, S.; Miao, L.; Cai, L. Prevention of diabetic complications by activation of Nrf2: Diabetic cardiomyopathy and nephropathy. Exp. Diabetes Res. 2012, 2012, 216512. [Google Scholar] [CrossRef]
- Snyder, R.O.; Francis, J. Adeno-associated viral vectors for clinical gene transfer studies. Curr. Gene Ther. 2005, 5, 311–321. [Google Scholar] [CrossRef]
- Hammoudi, N.; Ishikawa, K.; Hajjar, R.J. Adeno-associated virus-mediated gene therapy in cardiovascular disease. Curr. Opin. Cardiol. 2015, 30, 228–234. [Google Scholar] [CrossRef]
- Katz, M.G.; Fargnoli, A.S.; Williams, R.D.; Steuerwald, N.M.; Isidro, A.; Ivanina, A.V.; Sokolova, I.M.; Bridges, C.R. Safety and efficacy of high dose adeno-associated virus 9 encoding sarcoplasmic reticulum Ca2+ adenosine triphosphatase delivered by molecular cardiac surgery with recirculating delivery in ovine ischemic cardiomyopathy. J. Thorac. Cardiovasc. Surg. 2014, 148, 1065–1072. [Google Scholar] [CrossRef]
- Bish, L.T.; Morine, K.; Sleeper, M.M.; Sanmiguel, J.; Wu, D.; Gao, G.; Wilson, J.M.; Sweeney, H.L. Adeno-associated virus (AAV) serotype 9 provides global cardiac gene transfer superior to AAV1, AAV6, AAV7, and AAV8 in the mouse and rat. Hum. Gene Ther. 2008, 19, 1359–1368. [Google Scholar] [CrossRef]
- Timiri Shanmugam, P.S.; Dayton, R.D.; Palaniyandi, S.; Abreo, F.; Caldito, G.; Klein, R.L.; Sunavala-Dossabhoy, G. Recombinant AAV9-TLK1B administration ameliorates fractionated radiation-induced xerostomia. Hum. Gene Ther. 2013, 24, 604–612. [Google Scholar] [CrossRef]
- Drunat, S.; Moatti, N.; Demuth, K. Homocysteine decreases endothelin-1 expression by interfering with the AP-1 signaling pathway. Free Radic. Biol. Med. 2002, 33, 659–668. [Google Scholar] [CrossRef]
- Schnelle, M.; Catibog, N.; Zhang, M.; Nabeebaccus, A.A.; Anderson, G.; Richards, D.A.; Sawyer, G.; Zhang, X.; Toischer, K.; Hasenfuss, G.; et al. Echocardiographic evaluation of diastolic function in mouse models of heart disease. J. Mol. Cell. Cardiol. 2018, 114, 20–28. [Google Scholar] [CrossRef] [PubMed]
- Dash, P.K.; Alomar, F.A.; Hackfort, B.T.; Su, H.; Conaway, A.; Poluektova, L.Y.; Gendelman, H.E.; Gorantla, S.; Bidasee, K.R. HIV-1-Associated Left Ventricular Cardiac Dysfunction in Humanized Mice. Sci. Rep. 2020, 10, 9746–9751. [Google Scholar] [CrossRef] [PubMed]
- Moore, C.J.; Shao, C.H.; Nagai, R.; Kutty, S.; Singh, J.; Bidasee, K.R. Malondialdehyde and 4-hydroxynonenal adducts are not formed on cardiac ryanodine receptor (RyR2) and sarco(endo)plasmic reticulum Ca2+-ATPase (SERCA2) in diabetes. Mol. Cell. Biochem. 2013, 376, 121–135. [Google Scholar] [CrossRef] [PubMed]
- Tian, C.; Alomar, F.; Moore, C.J.; Shao, C.H.; Kutty, S.; Singh, J.; Bidasee, K.R. Reactive carbonyl species and their roles in sarcoplasmic reticulum Ca2+ cycling defect in the diabetic heart. Heart Fail. Rev. 2014, 19, 101–112. [Google Scholar] [CrossRef]
- Image Processing and Analysis in Java. Available online: http://rsbweb.nih.gov/ij/ (accessed on 23 March 2020).
- Nemet, I.; Varga-Defterdarovic, L.; Turk, Z. Preparation, and quantification of methylglyoxal in human plasma using reverse-phase high-performance liquid chromatography. Clin. Biochem. 2004, 37, 875–881. [Google Scholar] [CrossRef]
- Qi, W.; Keenan, H.A.; Li, Q.; Ishikado, A.; Kannt, A.; Sadowski, T.; Yorek, M.A.; Wu, I.H.; Lockhart, S.; Coppey, L.J.; et al. Pyruvate kinase M2 activation may protect against the progression of diabetic glomerular pathology and mitochondrial dysfunction. Nat. Med. 2017, 23, 753–762. [Google Scholar] [CrossRef]
- Hasim, S.; Hussin, N.A.; Alomar, F.; Bidasee, K.R.; Nickerson, K.W.; Wilson, M.A. A glutathione-independent glyoxalase of the DJ-1 superfamily plays an important role in managing metabolically generated methylglyoxal in Candida albicans. J. Biol. Chem. 2014, 289, 1662–1674. [Google Scholar] [CrossRef]
- Carlberg, I.; Mannervik, B. Glutathione reductase. Methods Enzymol. 1995, 113, 484–490. [Google Scholar]
- Seelig, G.F.; Meister, A. Glutathione synthesis: γ-glutamylcysteine synthetase from rat kidney. Methods Enzymol. 1995, 113, 379–390. [Google Scholar]
- Bidasee, K.R.; Dincer, U.D.; Besch, H.R., Jr. Ryanodine receptor dysfunction in hearts of streptozotocin-induced diabetic rats. Mol. Pharmacol. 2001, 60, 1356–1364. [Google Scholar] [CrossRef]
- Bidasee, K.R.; Nallani, K.; Besch, H.R., Jr.; Dincer, U.D. Streptozotocin-induced diabetes increases disulfide bond formation on cardiac ryanodine receptor (RyR2). J. Pharmacol. Exp. Ther. 2003, 305, 989–998. [Google Scholar] [CrossRef] [PubMed]
- Gregg, E.W.; Li, Y.; Wang, J.; Burrows, N.R.; Ali, M.K.; Rolka, D.; Williams, D.E.; Geiss, L. Changes in diabetes-related complications in the United States, 1990–2010. N. Engl. J. Med. 2014, 370, 1514–1523. [Google Scholar] [CrossRef] [PubMed]
- Griffith, O.W. Biologic and pharmacologic regulation of mammalian glutathione synthesis. Free Radic. Biol. Med. 1999, 27, 922–935. [Google Scholar] [CrossRef]
- Li, S.; Li, X.; Li, Y.L.; Shao, C.H.; Bidasee, K.R.; Rozanski, G.J. Insulin regulation of glutathione and contractile phenotype in diabetic rat ventricular myocytes. Am. J. Physiol. Heart Circ. Physiol. 2007, 292, H1619–H1629. [Google Scholar] [CrossRef] [PubMed]
- Forman, H.J.; Zhang, H.; Rinna, A. Glutathione: Overview of its protective roles, measurement, and biosynthesis. Mol. Asp. Med. 2009, 30, 1–12. [Google Scholar] [CrossRef]
- Dieter, B.P.; Vella, C.A. A proposed mechanism for exercise attenuated methylglyoxal accumulation: Activation of the ARE-Nrf pathway and increased glutathione biosynthesis. Med. Hypotheses 2013, 81, 813–815. [Google Scholar] [CrossRef]
- Ahmed, N.; Thornalley, P.J.; Dawczynski, J.; Franke, S.; Strobel, J.; Stein, G.; Haik, G.M. Methylglyoxal-derived hydroimidazolone advanced glycation end-products of human lens proteins. Investig. Ophthalmol. Vis. Sci. 2003, 44, 5287–5292. [Google Scholar] [CrossRef]
- Ray, S.; Dutta, S.; Halder, J.; Ray, M. Inhibition of electron flow through complex I of the mitochondrial respiratory chain of Ehrlich ascites carcinoma cells by methylglyoxal. Biochem. J. 1994, 303 (Pt 1), 69–72. [Google Scholar] [CrossRef]
- Wang, H.; Liu, J.; Wu, L. Methylglyoxal-induced mitochondrial dysfunction in vascular smooth muscle cells. Biochem. Pharmacol. 2009, 77, 1709–1716. [Google Scholar] [CrossRef] [PubMed]
- Lominadze, D.; Roberts, A.M.; Tyagi, N.; Moshal, K.S.; Tyagi, S.C. Homocysteine causes cerebrovascular leakage in mice. Am. J. Physiol. Heart Circ. Physiol. 2006, 290, H1206–H1213. [Google Scholar] [CrossRef] [PubMed]


| Measured Parameters | Control (n = 14) | Control Treated withAAV2/9- Endo-eGFP (n = 14) | T1DM (n = 20) | T1DM with AAV2/9-Endo-eGFP (n = 20) | T1DM with AAV2/9-Endo-Glo1 (n = 20) |
|---|---|---|---|---|---|
| Body mass (g) | 389.2 ± 10.2 | 392.3 ± 11.4 | 275.4 ± 15.2 * | 290.4 ± 12.3 * | 320.3 ± 10.3 # |
| Heart weight | 1.2 ± 0.2 | 1.2 ± 0.2 | 1.0 ± 0.3 | 1.0 ± 0.3 | 1.1 ± 0.2 |
| Heart to body weight ratio (mg/g) | 3.1 ± 0.2 | 3.1 ± 0.2 | 3.6 ± 0.2 * | 3.4 ± 0.2 | 3.4 ± 0.2 |
| Blood glucose (mmol) | 5.5 ± 1.6 | 6.3 ± 1.7 | 23.6 ± 4.5 * | 24.1 ± 3.5 | 22.9 ± 3.2 |
| % Glycated hemoglobin | 4.2 ± 0.3 | 4.3 ± 0.4 | 7.6 ± 0.2 * | 7.5 ± 0.3 * | 7.2 ± 0.5 |
| Serum insulin (ng/mL) | 0.9 ± 0.2 | 1.0 ± 0.1 | 0.3 ± 0.1 * | 0.3 ± 0.1 * | 0.6 ± 0.1 # |
| Serum TBARS activity (nmol/mL) | 2.4 ± 0.2 | 2.3 ± 0.03 | 10.9 ± 1.1 * | 11.1 ± 0.8 * | 8.4 ± 1.2 |
| Ventricular TBARS (nmol/mL) | 2.1 ± 0.3 | 2.3 ± 0.3 | 8.2 ± 1.2 * | 8.5 ± 1.0 * | 5.2 ± 0.8 # |
| Serum MG (µM) | 0.3 ± 0.1 | 0.3 ± 0.1 | 1.2 ± 0.2 * | 1.4 ± 0.2 * | 1.2 ± 0.3 |
| Ventricular MG (nmol/g) | 2.0 ± 0.3 | 2.0 ± 0.5 | 8.9 ± 1.7 * | 7.9 ± 2.1 * | 3.8 ± 0.3 # |
| Glo1 activity (µmol/min/100 mg ventricular tissue) | 10.2 ± 1.0 | 11.4 ± 1.0 | 5.1 ± 0.8 * | 6.3 ± 0.6 * | 13.2 ± 1.2 # |
| Parameters Measured | Control (n = 6) | T1DM (n = 6) | AAV2/9-Endo-eGFP-Treated T1DM (n = 6) | AAV2/9- Endo-Glo-I-Treated T1DM (n = 6) |
|---|---|---|---|---|
| GSH:GSSG ratio | 2.4 ± 0.2 | 1.55 ± 0.1 * | 1.6 ± 0.3 * | 2.3 ± 0.3 # |
| γ-glutamylcysteine ligase activity (mU/mg protein) | 470.5 ± 18.1 | 205.2 ± 1.2 * | 210.5 ± 21.2 * | 460.2 ± 20.4 # |
| glutathione reductase activity (mU/mg protein) | 48.1 ± 7.4 | 32.5 ± 8.0 * | 30.5 ± 11.2 * | 45.5 ± 10.1 # |
© 2020 by the authors. Licensee MDPI, Basel, Switzerland. This article is an open access article distributed under the terms and conditions of the Creative Commons Attribution (CC BY) license (http://creativecommons.org/licenses/by/4.0/).
Share and Cite
Alomar, F.A.; Al-Rubaish, A.; Al-Muhanna, F.; Al-Ali, A.K.; McMillan, J.; Singh, J.; Bidasee, K.R. Adeno-Associated Viral Transfer of Glyoxalase-1 Blunts Carbonyl and Oxidative Stresses in Hearts of Type 1 Diabetic Rats. Antioxidants 2020, 9, 592. https://doi.org/10.3390/antiox9070592
Alomar FA, Al-Rubaish A, Al-Muhanna F, Al-Ali AK, McMillan J, Singh J, Bidasee KR. Adeno-Associated Viral Transfer of Glyoxalase-1 Blunts Carbonyl and Oxidative Stresses in Hearts of Type 1 Diabetic Rats. Antioxidants. 2020; 9(7):592. https://doi.org/10.3390/antiox9070592
Chicago/Turabian StyleAlomar, Fadhel A., Abdullah Al-Rubaish, Fahad Al-Muhanna, Amein K. Al-Ali, JoEllyn McMillan, Jaipaul Singh, and Keshore R. Bidasee. 2020. "Adeno-Associated Viral Transfer of Glyoxalase-1 Blunts Carbonyl and Oxidative Stresses in Hearts of Type 1 Diabetic Rats" Antioxidants 9, no. 7: 592. https://doi.org/10.3390/antiox9070592
APA StyleAlomar, F. A., Al-Rubaish, A., Al-Muhanna, F., Al-Ali, A. K., McMillan, J., Singh, J., & Bidasee, K. R. (2020). Adeno-Associated Viral Transfer of Glyoxalase-1 Blunts Carbonyl and Oxidative Stresses in Hearts of Type 1 Diabetic Rats. Antioxidants, 9(7), 592. https://doi.org/10.3390/antiox9070592