Discovery of GLO1 New Related Genes and Pathways by RNA-Seq on A2E-Stressed Retinal Epithelial Cells Could Improve Knowledge on Retinitis Pigmentosa

 ,
,  ,
, 


Abstract
1. Introduction
2. Materials and Methods
2.1. Cell Culture
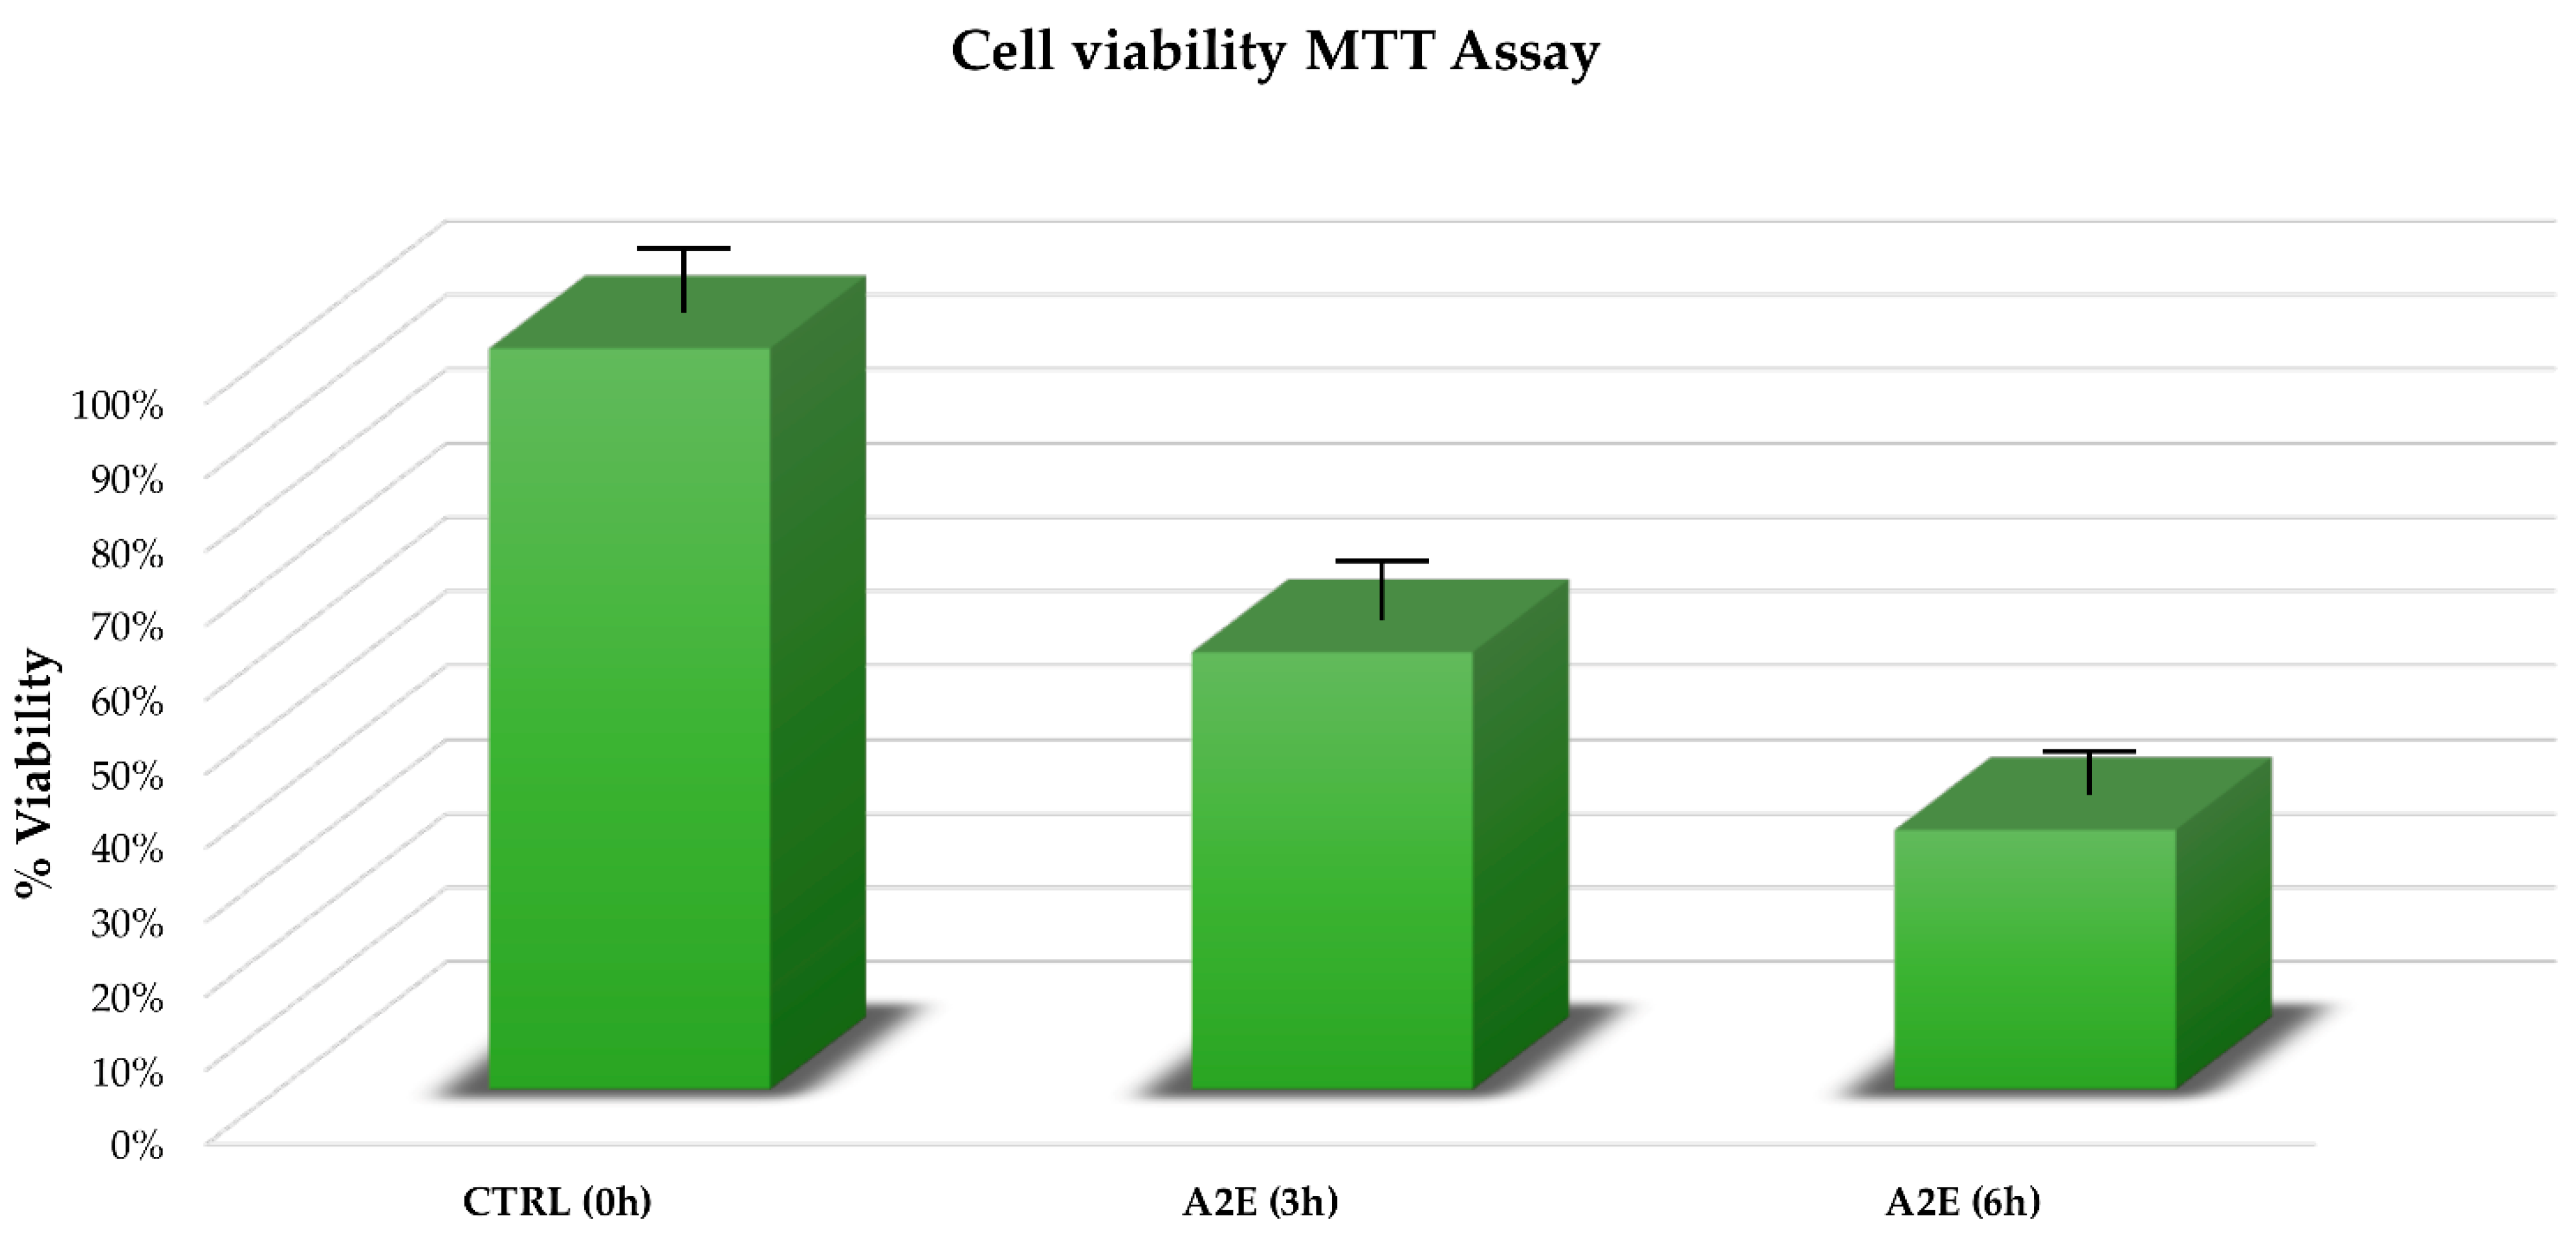
2.2. MTT Assay
2.3. Total RNA Isolation and RNA-Seq Profiling
2.4. Data Analysis
2.5. Quantitative RT-PCR (qRT-PCR) Validation
2.6. Pathway Analysis
3. Results
3.1. A2E Treatment Highlighted a Significant Negative Effect on RPE Cell Viability
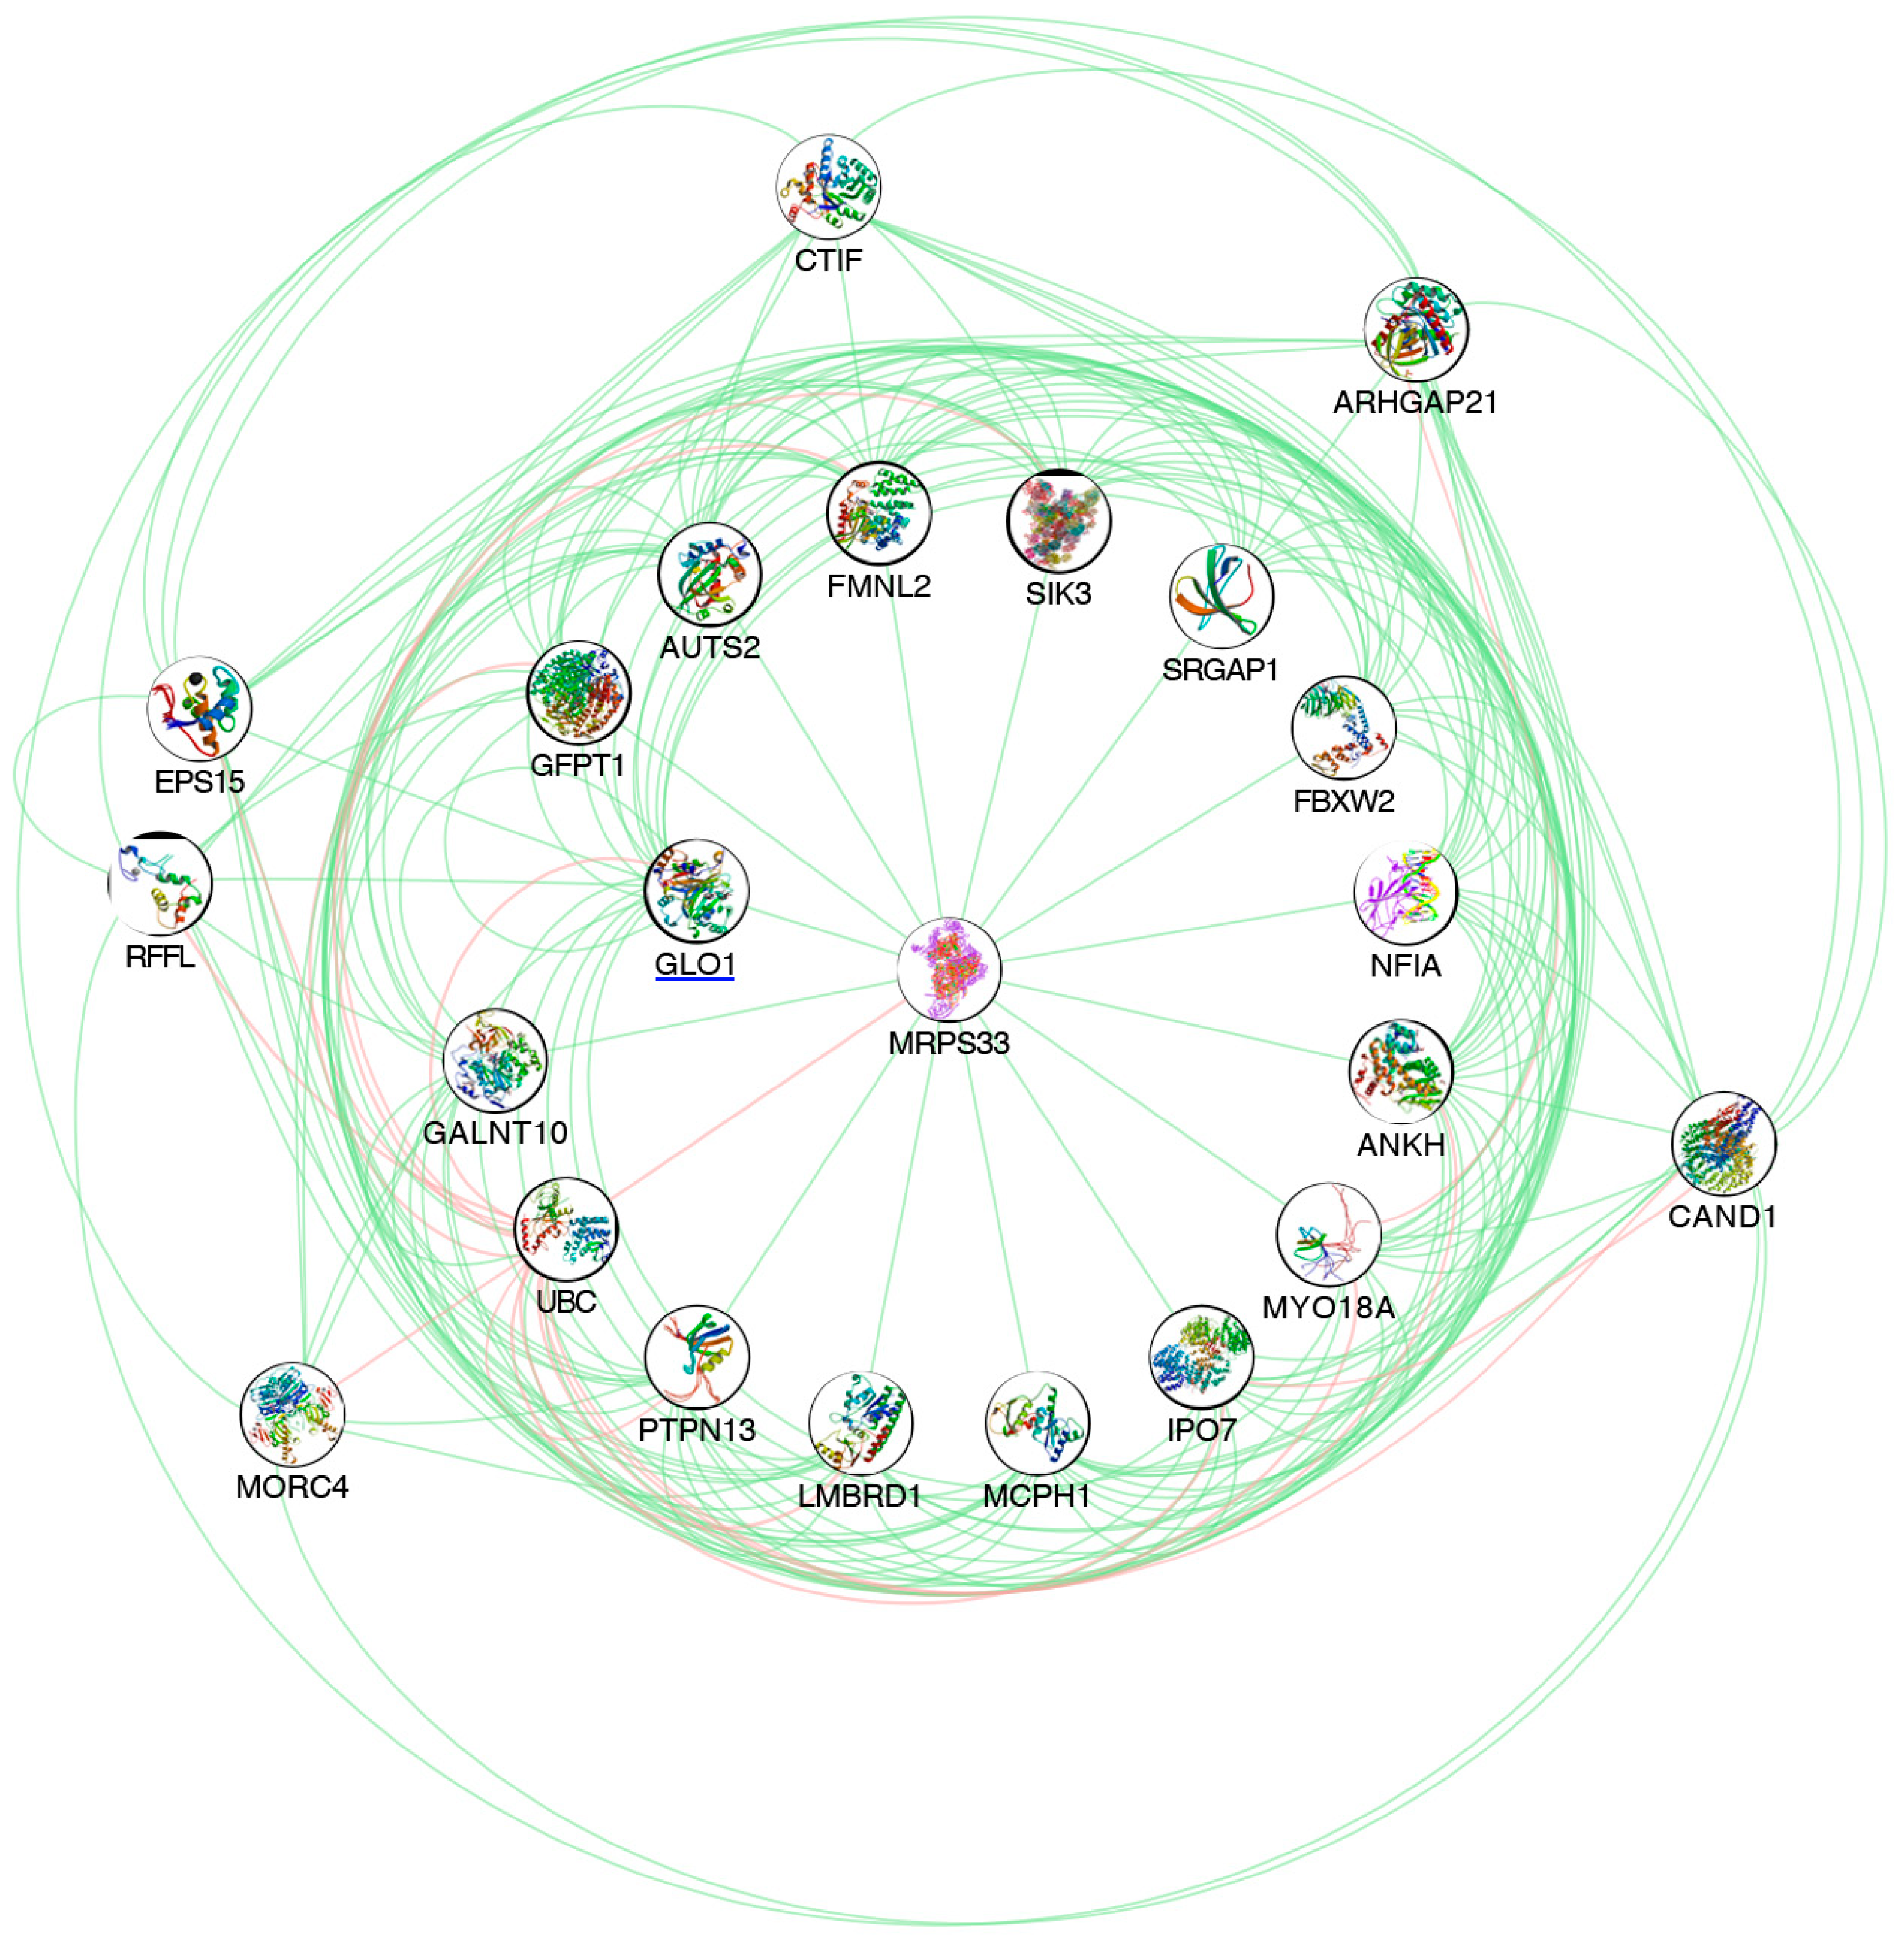
3.2. A2E Treatment Highlighted GLO1 Down-Regulation, as Well as the Most of Its Related Genes
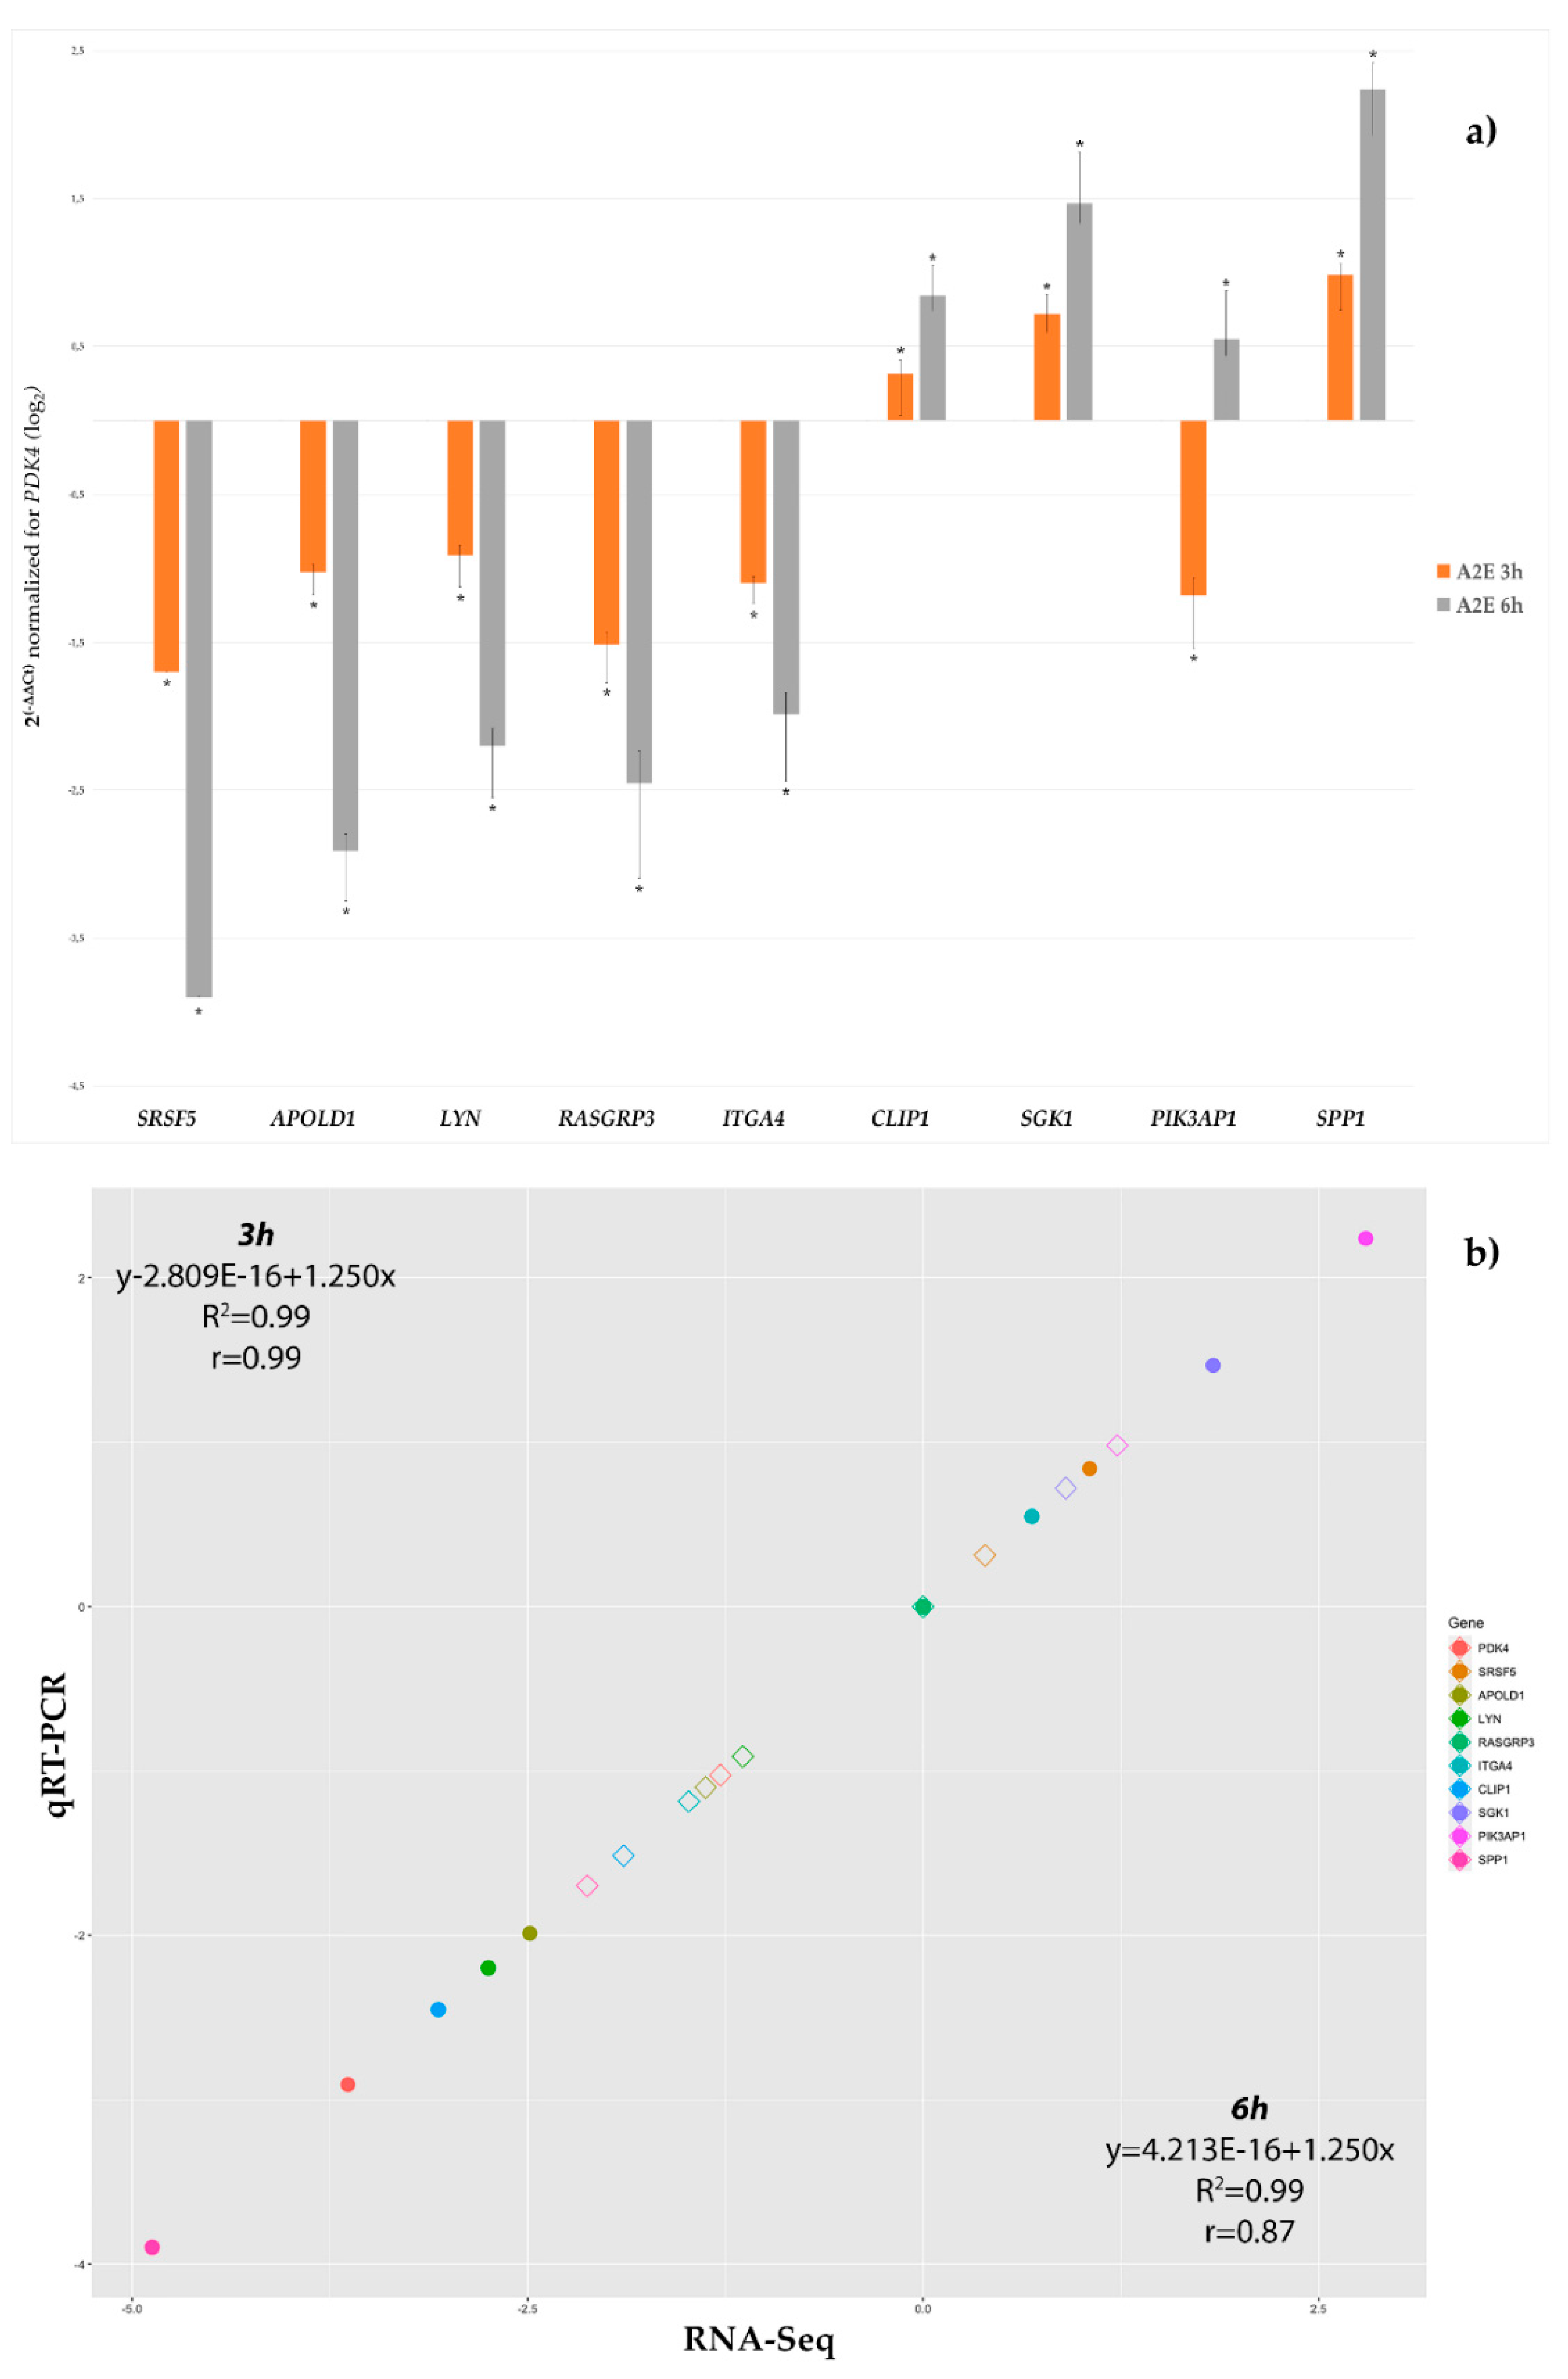
3.3. qRT-PCR Validation
3.4. Glycolysis and UPR Resulted the Most GLO1-Related Dysregulated Pathways Impaired by Induced Oxidative Stress
4. Discussion
5. Conclusions
Supplementary Materials
Author Contributions
Funding
Conflicts of Interest
References
- Sies, H. Oxidative stress: A concept in redox biology and medicine. Redox Biol. 2015, 4, 180–183. [Google Scholar] [CrossRef] [PubMed]
- Li, R.; Jia, Z.; Trush, M.A. Defining ROS in Biology and Medicine. React. Oxyg. Species 2016, 1, 9–21. [Google Scholar] [CrossRef] [PubMed]
- El-Kenawi, A.; Ruffell, B. Inflammation, ROS, and Mutagenesis. Cancer Cell 2017, 32, 727–729. [Google Scholar] [CrossRef] [PubMed]
- Nedic, O.; Rattan, S.I.; Grune, T.; Trougakos, I.P. Molecular effects of advanced glycation end products on cell signalling pathways, ageing and pathophysiology. Free Radic. Res. 2013, 47, 28–38. [Google Scholar] [CrossRef]
- Groener, J.B.; Oikonomou, D.; Cheko, R.; Kender, Z.; Zemva, J.; Kihm, L.; Muckenthaler, M.; Peters, V.; Fleming, T.; Kopf, S.; et al. Methylglyoxal and Advanced Glycation End Products in Patients with Diabetes—What We Know so Far and the Missing Links. Exp. Clin. Endocrinol. Diabetes 2019, 127, 497–504. [Google Scholar] [CrossRef]
- Wautier, M.P.; Guillausseau, P.J.; Wautier, J.L. Activation of the receptor for advanced glycation end products and consequences on health. Diabetes Metab. Syndr. 2017, 11, 305–309. [Google Scholar] [CrossRef]
- Honek, J.F. Glyoxalase biochemistry. Biomol. Concepts 2015, 6, 401–414. [Google Scholar] [CrossRef]
- Maessen, D.E.; Stehouwer, C.D.; Schalkwijk, C.G. The role of methylglyoxal and the glyoxalase system in diabetes and other age-related diseases. Clin. Sci. 2015, 128, 839–861. [Google Scholar] [CrossRef]
- Couto, N.; Wood, J.; Barber, J. The role of glutathione reductase and related enzymes on cellular redox homoeostasis network. Free Radic. Biol. Med. 2016, 95, 27–42. [Google Scholar] [CrossRef]
- Rabbani, N.; Xue, M.; Thornalley, P.J. Methylglyoxal-induced dicarbonyl stress in aging and disease: First steps towards glyoxalase 1-based treatments. Clin. Sci. 2016, 130, 1677–1696. [Google Scholar] [CrossRef]
- Donato, L.; Scimone, C.; Nicocia, G.; Denaro, L.; Robledo, R.; Sidoti, A.; D’Angelo, R. GLO1 gene polymorphisms and their association with retinitis pigmentosa: A case-control study in a Sicilian population. Mol. Biol. Rep. 2018. [Google Scholar] [CrossRef] [PubMed]
- Donato, L.; Scimone, C.; Rinaldi, C.; Aragona, P.; Briuglia, S.; D’Ascola, A.; D’Angelo, R.; Sidoti, A. Stargardt Phenotype Associated With Two ELOVL4 Promoter Variants and ELOVL4 Downregulation: New Possible Perspective to Etiopathogenesis? Investig. Ophthalmol. Vis. Sci. 2018, 59, 843–857. [Google Scholar] [CrossRef] [PubMed]
- Scimone, C.; Donato, L.; Esposito, T.; Rinaldi, C.; D’Angelo, R.; Sidoti, A. A novel RLBP1 gene geographical area-related mutation present in a young patient with retinitis punctata albescens. Hum. Genom. 2017, 11, 18. [Google Scholar] [CrossRef] [PubMed]
- D’Angelo, R.; Donato, L.; Venza, I.; Scimone, C.; Aragona, P.; Sidoti, A. Possible protective role of the ABCA4 gene c.1268A>G missense variant in Stargardt disease and syndromic retinitis pigmentosa in a Sicilian family: Preliminary data. Int. J. Mol. Med. 2017, 39, 1011–1020. [Google Scholar] [CrossRef] [PubMed][Green Version]
- Tsang, S.H.; Sharma, T. Retinitis Pigmentosa (Non-syndromic). Adv. Exp. Med. Biol. 2018, 1085, 125–130. [Google Scholar] [CrossRef]
- Verbakel, S.K.; Van Huet, R.A.C.; Boon, C.J.F.; Den Hollander, A.I.; Collin, R.W.J.; Klaver, C.C.W.; Hoyng, C.B.; Roepman, R.; Klevering, B.J. Non-syndromic retinitis pigmentosa. Prog. Retin. Eye Res. 2018, 66, 157–186. [Google Scholar] [CrossRef]
- Hamel, C. Retinitis pigmentosa. Orphanet J. Rare Dis. 2006, 1, 40. [Google Scholar] [CrossRef]
- Fuhrmann, S.; Zou, C.; Levine, E.M. Retinal pigment epithelium development, plasticity, and tissue homeostasis. Exp. Eye Res. 2014, 123, 141–150. [Google Scholar] [CrossRef]
- Ao, J.; Wood, J.P.; Chidlow, G.; Gillies, M.C.; Casson, R.J. Retinal pigment epithelium in the pathogenesis of age-related macular degeneration and photobiomodulation as a potential therapy? Clin. Exp. Ophthalmol. 2018, 46, 670–686. [Google Scholar] [CrossRef]
- Datta, S.; Cano, M.; Ebrahimi, K.; Wang, L.; Handa, J.T. The impact of oxidative stress and inflammation on RPE degeneration in non-neovascular AMD. Prog. Retin. Eye Res. 2017, 60, 201–218. [Google Scholar] [CrossRef]
- Donato, L.; Scimone, C.; Alibrandi, S.; Rinaldi, C.; Sidoti, A.; D’Angelo, R. Transcriptome Analyses of lncRNAs in A2E-Stressed Retinal Epithelial Cells Unveil Advanced Links between Metabolic Impairments Related to Oxidative Stress and Retinitis Pigmentosa. Antioxidants 2020, 9, 318. [Google Scholar] [CrossRef]
- Kaarniranta, K.; Koskela, A.; Felszeghy, S.; Kivinen, N.; Salminen, A.; Kauppinen, A. Fatty acids and oxidized lipoproteins contribute to autophagy and innate immunity responses upon the degeneration of retinal pigment epithelium and development of age-related macular degeneration. Biochimie 2019, 159, 49–54. [Google Scholar] [CrossRef] [PubMed]
- Lin, C.H.; Wu, M.R.; Huang, W.J.; Chow, D.S.; Hsiao, G.; Cheng, Y.W. Low-Luminance Blue Light-Enhanced Phototoxicity in A2E-Laden RPE Cell Cultures and Rats. Int. J. Mol. Sci. 2019, 20, 1799. [Google Scholar] [CrossRef]
- Donato, L.; D’Angelo, R.; Alibrandi, S.; Rinaldi, C.; Sidoti, A.; Scimone, C. Effects of A2E-Induced Oxidative Stress on Retinal Epithelial Cells: New Insights on Differential Gene Response and Retinal Dystrophies. Antioxidants 2020, 9, 307. [Google Scholar] [CrossRef] [PubMed]
- CLC Genomics Workbench 20.0. Available online: https://digitalinsights.qiagen.com (accessed on 15 April 2020).
- Li, B.; Ruotti, V.; Stewart, R.M.; Thomson, J.A.; Dewey, C.N. RNA-Seq gene expression estimation with read mapping uncertainty. Bioinformatics 2010, 26, 493–500. [Google Scholar] [CrossRef] [PubMed]
- Pereira, M.B.; Wallroth, M.; Jonsson, V.; Kristiansson, E. Comparison of normalization methods for the analysis of metagenomic gene abundance data. BMC Genom. 2018, 19, 274. [Google Scholar] [CrossRef] [PubMed]
- Ritchie, M.E.; Phipson, B.; Wu, D.; Hu, Y.; Law, C.W.; Shi, W.; Smyth, G.K. limma powers differential expression analyses for RNA-sequencing and microarray studies. Nucleic Acids Res. 2015, 43, e47. [Google Scholar] [CrossRef] [PubMed]
- Guo, W.; Tzioutziou, N.; Stephen, G.; Milne, I.; Calixto, C.; Waugh, R.; Brown, J.W.; Zhang, R. 3D RNA-seq—A powerful and flexible tool for rapid and accurate differential expression and alternative splicing analysis of RNA-seq data for biologists. bioRxiv 2019, 656686. [Google Scholar] [CrossRef]
- Ge, Y.; Sealfon, S.C.; Speed, T.P. Some Step-down Procedures Controlling the False Discovery Rate under Dependence. Stat. Sin. 2008, 18, 881–904. [Google Scholar]
- Andersen, C.L.; Jensen, J.L.; Orntoft, T.F. Normalization of real-time quantitative reverse transcription-PCR data: A model-based variance estimation approach to identify genes suited for normalization, applied to bladder and colon cancer data sets. Cancer Res. 2004, 64, 5245–5250. [Google Scholar] [CrossRef]
- Pfaffl, M.W.; Tichopad, A.; Prgomet, C.; Neuvians, T.P. Determination of stable housekeeping genes, differentially regulated target genes and sample integrity: BestKeeper-Excel-based tool using pair-wise correlations. Biotechnol. Lett. 2004, 26, 509–515. [Google Scholar] [CrossRef] [PubMed]
- Silver, N.; Best, S.; Jiang, J.; Thein, S.L. Selection of housekeeping genes for gene expression studies in human reticulocytes using real-time PCR. BMC Mol. Biol. 2006, 7, 33. [Google Scholar] [CrossRef] [PubMed]
- Marabita, F.; de Candia, P.; Torri, A.; Tegner, J.; Abrignani, S.; Rossi, R.L. Normalization of circulating microRNA expression data obtained by quantitative real-time RT-PCR. Brief. Bioinform. 2016, 17, 204–212. [Google Scholar] [CrossRef] [PubMed]
- Bindea, G.; Mlecnik, B.; Hackl, H.; Charoentong, P.; Tosolini, M.; Kirilovsky, A.; Fridman, W.H.; Pages, F.; Trajanoski, Z.; Galon, J. ClueGO: A Cytoscape plug-in to decipher functionally grouped gene ontology and pathway annotation networks. Bioinformatics 2009, 25, 1091–1093. [Google Scholar] [CrossRef]
- Bindea, G.; Galon, J.; Mlecnik, B. CluePedia Cytoscape plugin: Pathway insights using integrated experimental and in silico data. Bioinformatics 2013, 29, 661–663. [Google Scholar] [CrossRef]
- Shannon, P.; Markiel, A.; Ozier, O.; Baliga, N.S.; Wang, J.T.; Ramage, D.; Amin, N.; Schwikowski, B.; Ideker, T. Cytoscape: A software environment for integrated models of biomolecular interaction networks. Genome Res. 2003, 13, 2498–2504. [Google Scholar] [CrossRef]
- Kandarakis, S.A.; Piperi, C.; Topouzis, F.; Papavassiliou, A.G. Emerging role of advanced glycation-end products (AGEs) in the pathobiology of eye diseases. Prog. Retin. Eye Res. 2014, 42, 85–102. [Google Scholar] [CrossRef]
- Aragno, M.; Mastrocola, R. Dietary Sugars and Endogenous Formation of Advanced Glycation Endproducts: Emerging Mechanisms of Disease. Nutrients 2017, 9, 385. [Google Scholar] [CrossRef]
- Xu, J.; Chen, L.J.; Yu, J.; Wang, H.J.; Zhang, F.; Liu, Q.; Wu, J. Involvement of Advanced Glycation End Products in the Pathogenesis of Diabetic Retinopathy. Cell Physiol. Biochem. 2018, 48, 705–717. [Google Scholar] [CrossRef]
- Grigsby, J.G.; Allen, D.M.; Ferrigno, A.S.; Vellanki, S.; Pouw, C.E.; Hejny, W.A.; Tsin, A.T.C. Autocrine and Paracrine Secretion of Vascular Endothelial Growth Factor in the Pre-Hypoxic Diabetic Retina. Curr. Diabetes Rev. 2017, 13, 161–174. [Google Scholar] [CrossRef]
- Chen, M.; Curtis, T.M.; Stitt, A.W. Advanced glycation end products and diabetic retinopathy. Curr. Med. Chem. 2013, 20, 3234–3240. [Google Scholar] [CrossRef]
- Fournet, M.; Bonte, F.; Desmouliere, A. Glycation Damage: A Possible Hub for Major Pathophysiological Disorders and Aging. Aging Dis. 2018, 9, 880–900. [Google Scholar] [CrossRef] [PubMed]
- Lee, H.J.; Howell, S.K.; Sanford, R.J.; Beisswenger, P.J. Methylglyoxal can modify GAPDH activity and structure. Ann. N. Y. Acad. Sci. 2005, 1043, 135–145. [Google Scholar] [CrossRef]
- Schumacher, D.; Morgenstern, J.; Oguchi, Y.; Volk, N.; Kopf, S.; Groener, J.B.; Nawroth, P.P.; Fleming, T.; Freichel, M. Compensatory mechanisms for methylglyoxal detoxification in experimental & clinical diabetes. Mol. Metab. 2018, 18, 143–152. [Google Scholar] [CrossRef] [PubMed]
- Khan, M.A.; Anwar, S.; Aljarbou, A.N.; Al-Orainy, M.; Aldebasi, Y.H.; Islam, S.; Younus, H. Protective effect of thymoquinone on glucose or methylglyoxal-induced glycation of superoxide dismutase. Int. J. Biol. Macromol. 2014, 65, 16–20. [Google Scholar] [CrossRef] [PubMed]
- Senatus, L.M.; Schmidt, A.M. The AGE-RAGE Axis: Implications for Age-Associated Arterial Diseases. Front. Genet. 2017, 8, 187. [Google Scholar] [CrossRef] [PubMed]
- Berner, A.K.; Brouwers, O.; Pringle, R.; Klaassen, I.; Colhoun, L.; McVicar, C.; Brockbank, S.; Curry, J.W.; Miyata, T.; Brownlee, M.; et al. Protection against methylglyoxal-derived AGEs by regulation of glyoxalase 1 prevents retinal neuroglial and vasodegenerative pathology. Diabetologia 2012, 55, 845–854. [Google Scholar] [CrossRef]
- Antognelli, C.; Moretti, S.; Frosini, R.; Puxeddu, E.; Sidoni, A.; Talesa, V.N. Methylglyoxal Acts as a Tumor-Promoting Factor in Anaplastic Thyroid Cancer. Cells 2019, 8, 547. [Google Scholar] [CrossRef]
- Rinaldi, C.; Bramanti, P.; Fama, A.; Scimone, C.; Donato, L.; Antognelli, C.; Alafaci, C.; Tomasello, F.; D’Angelo, R.; Sidoti, A. Glyoxalase I A111e, Paraoxonase 1 Q192r and L55m Polymorphisms in Italian Patients with Sporadic Cerebral Cavernous Malformations: A Pilot Study. J. Biol. Regul. Homeost Agents 2015, 29, 493–500. [Google Scholar]
- Hori, K.; Hoshino, M. Neuronal Migration and AUTS2 Syndrome. Brain Sci. 2017, 7, 54. [Google Scholar] [CrossRef]
- Rosa, L.R.O.; Soares, G.M.; Silveira, L.R.; Boschero, A.C.; Barbosa-Sampaio, H.C.L. ARHGAP21 as a master regulator of multiple cellular processes. J. Cell Physiol. 2018, 233, 8477–8481. [Google Scholar] [CrossRef] [PubMed]
- Kuchay, S.; Duan, S.; Schenkein, E.; Peschiaroli, A.; Saraf, A.; Florens, L.; Washburn, M.P.; Pagano, M. FBXL2- and PTPL1-mediated degradation of p110-free p85beta regulatory subunit controls the PI(3)K signalling cascade. Nat. Cell Biol. 2013, 15, 472–480. [Google Scholar] [CrossRef] [PubMed]
- Villa, F.; Deak, M.; Bloomberg, G.B.; Alessi, D.R.; van Aalten, D.M. Crystal structure of the PTPL1/FAP-1 human tyrosine phosphatase mutated in colorectal cancer: Evidence for a second phosphotyrosine substrate recognition pocket. J. Biol. Chem. 2005, 280, 8180–8187. [Google Scholar] [CrossRef] [PubMed]
- Kaur, H.; Xu, N.; Doycheva, D.M.; Malaguit, J.; Tang, J.; Zhang, J.H. Recombinant Slit2 attenuates neuronal apoptosis via the Robo1-srGAP1 pathway in a rat model of neonatal HIE. Neuropharmacology 2019, 158, 107727. [Google Scholar] [CrossRef] [PubMed]
- Liang, X.; Kiru, S.; Gomez, G.A.; Yap, A.S. Regulated recruitment of SRGAP1 modulates RhoA signaling for contractility during epithelial junction maturation. Cytoskeleton 2018, 75, 61–69. [Google Scholar] [CrossRef] [PubMed]
- Kage, F.; Steffen, A.; Ellinger, A.; Ranftler, C.; Gehre, C.; Brakebusch, C.; Pavelka, M.; Stradal, T.; Rottner, K. FMNL2 and -3 regulate Golgi architecture and anterograde transport downstream of Cdc42. Sci. Rep. 2017, 7, 9791. [Google Scholar] [CrossRef] [PubMed]
- Burdett, L.G.; Osborne, C.A. Enterolith with a stingray spine nidus in an Atlantic bottlenose dolphin (Tursiops truncatus). J. Wildl. Dis. 2010, 46, 311–315. [Google Scholar] [CrossRef][Green Version]
- Getty, A.; Kovacs, A.D.; Lengyel-Nelson, T.; Cardillo, A.; Hof, C.; Chan, C.H.; Pearce, D.A. Osmotic stress changes the expression and subcellular localization of the Batten disease protein CLN3. PLoS ONE 2013, 8, e66203. [Google Scholar] [CrossRef]
- Buschman, M.D.; Field, S.J. MYO18A: An unusual myosin. Adv. Biol. Regul. 2018, 67, 84–92. [Google Scholar] [CrossRef]
- Van Gils, M.; Nollet, L.; Verly, E.; Deianova, N.; Vanakker, O.M. Cellular signaling in pseudoxanthoma elasticum: An update. Cell. Signal. 2019, 55, 119–129. [Google Scholar] [CrossRef]
- Khanobdee, K.; Kolberg, J.B.; Dunlevy, J.R. Nuclear and plasma membrane localization of SH3BP4 in retinal pigment epithelial cells. Mol. Vis. 2004, 10, 933–942. [Google Scholar] [PubMed]
- Majumdar, A.; Ramagiri, S.; Rikhy, R. Drosophila homologue of Eps15 is essential for synaptic vesicle recycling. Exp. Cell Res. 2006, 312, 2288–2298. [Google Scholar] [CrossRef] [PubMed]
- Gan, X.; Wang, C.; Patel, M.; Kreutz, B.; Zhou, M.; Kozasa, T.; Wu, D. Different Raf protein kinases mediate different signaling pathways to stimulate E3 ligase RFFL gene expression in cell migration regulation. J. Biol. Chem. 2013, 288, 33978–33984. [Google Scholar] [CrossRef] [PubMed]
- Sakai, R.; Fukuda, R.; Unida, S.; Aki, M.; Ono, Y.; Endo, A.; Kusumi, S.; Koga, D.; Fukushima, T.; Komada, M.; et al. The integral function of the endocytic recycling compartment is regulated by RFFL-mediated ubiquitylation of Rab11 effectors. J. Cell Sci. 2019, 132. [Google Scholar] [CrossRef]
- Yang, F.; Xu, J.; Li, H.; Tan, M.; Xiong, X.; Sun, Y. FBXW2 suppresses migration and invasion of lung cancer cells via promoting beta-catenin ubiquitylation and degradation. Nat. Commun. 2019, 10, 1382. [Google Scholar] [CrossRef] [PubMed]
- Kajiho, H.; Yamamoto, Y.; Sakisaka, T. CAND1 regulates lunapark for the proper tubular network of the endoplasmic reticulum. Sci. Rep. 2019, 9, 13152. [Google Scholar] [CrossRef]
- Vallee, A.; Lecarpentier, Y.; Guillevin, R.; Vallee, J.N. Aerobic Glycolysis Hypothesis through WNT/Beta-Catenin Pathway in Exudative Age-Related Macular Degeneration. J. Mol. Neurosci. 2017, 62, 368–379. [Google Scholar] [CrossRef]
- Estevez-Garcia, I.O.; Cordoba-Gonzalez, V.; Lara-Padilla, E.; Fuentes-Toledo, A.; Falfan-Valencia, R.; Campos-Rodriguez, R.; Abarca-Rojano, E. Glucose and glutamine metabolism control by APC and SCF during the G1-to-S phase transition of the cell cycle. J. Physiol. Biochem. 2014, 70, 569–581. [Google Scholar] [CrossRef]
- Tudzarova, S.; Colombo, S.L.; Stoeber, K.; Carcamo, S.; Williams, G.H.; Moncada, S. Two ubiquitin ligases, APC/C-Cdh1 and SKP1-CUL1-F (SCF)-beta-TrCP, sequentially regulate glycolysis during the cell cycle. Proc. Natl. Acad. Sci. USA 2011, 108, 5278–5283. [Google Scholar] [CrossRef]
- Bauche, S.; Vellieux, G.; Sternberg, D.; Fontenille, M.J.; De Bruyckere, E.; Davoine, C.S.; Brochier, G.; Messeant, J.; Wolf, L.; Fardeau, M.; et al. Mutations in GFPT1-related congenital myasthenic syndromes are associated with synaptic morphological defects and underlie a tubular aggregate myopathy with synaptopathy. J. Neurol. 2017, 264, 1791–1803. [Google Scholar] [CrossRef]
- Elbein, S.C.; Zheng, H.; Jia, Y.; Chu, W.; Cooper, J.J.; Hale, T.; Zhang, Z. Molecular screening of the human glutamine-fructose-6-phosphate amidotransferase 1 (GFPT1) gene and association studies with diabetes and diabetic nephropathy. Mol. Genet. Metab. 2004, 82, 321–328. [Google Scholar] [CrossRef] [PubMed]
- Nelson, P.A.; Sutcliffe, J.G.; Thomas, E.A. A new UDP-GalNAc:polypeptide N-acetylgalactosaminyltransferase mRNA exhibits predominant expression in the hypothalamus, thalamus and amygdala of mouse forebrain. Brain Res. Gene Expr. Patterns 2002, 1, 95–99. [Google Scholar] [CrossRef]
- Zhao, L.; Feng, Z.; Zou, X.; Cao, K.; Xu, J.; Liu, J. Aging leads to elevation of O-GlcNAcylation and disruption of mitochondrial homeostasis in retina. Oxid. Med. Cell. Longev. 2014, 2014, 425705. [Google Scholar] [CrossRef] [PubMed]
- Uebi, T.; Itoh, Y.; Hatano, O.; Kumagai, A.; Sanosaka, M.; Sasaki, T.; Sasagawa, S.; Doi, J.; Tatsumi, K.; Mitamura, K.; et al. Involvement of SIK3 in glucose and lipid homeostasis in mice. PLoS ONE 2012, 7, e37803. [Google Scholar] [CrossRef]
- Chong, C.M.; Zheng, W. Artemisinin protects human retinal pigment epithelial cells from hydrogen peroxide-induced oxidative damage through activation of ERK/CREB signaling. Redox Biol. 2016, 9, 50–56. [Google Scholar] [CrossRef]
- Kriete, A.; Bosl, W.J.; Booker, G. Rule-based cell systems model of aging using feedback loop motifs mediated by stress responses. PLoS Comput. Biol. 2010, 6, e1000820. [Google Scholar] [CrossRef]
- Golomb, L.; Bublik, D.R.; Wilder, S.; Nevo, R.; Kiss, V.; Grabusic, K.; Volarevic, S.; Oren, M. Importin 7 and exportin 1 link c-Myc and p53 to regulation of ribosomal biogenesis. Mol. Cell 2012, 45, 222–232. [Google Scholar] [CrossRef]
- Cavdar Koc, E.; Burkhart, W.; Blackburn, K.; Moseley, A.; Spremulli, L.L. The small subunit of the mammalian mitochondrial ribosome. Identification of the full complement of ribosomal proteins present. J. Biol. Chem. 2001, 276, 19363–19374. [Google Scholar] [CrossRef]
- Yang, Z.; Zhuang, Q.; Hu, G.; Geng, S. MORC4 is a novel breast cancer oncogene regulated by miR-193b-3p. J. Cell. Biochem. 2019, 120, 4634–4643. [Google Scholar] [CrossRef]
- Liu, X.; Zong, W.; Li, T.; Wang, Y.; Xu, X.; Zhou, Z.W.; Wang, Z.Q. The E3 ubiquitin ligase APC/C(C)(dh1) degrades MCPH1 after MCPH1-betaTrCP2-Cdc25A-mediated mitotic entry to ensure neurogenesis. EMBO J. 2017, 36, 3666–3681. [Google Scholar] [CrossRef]
- Clark, B.S.; Stein-O’Brien, G.L.; Shiau, F.; Cannon, G.H.; Davis-Marcisak, E.; Sherman, T.; Santiago, C.P.; Hoang, T.V.; Rajaii, F.; James-Esposito, R.E.; et al. Single-Cell RNA-Seq Analysis of Retinal Development Identifies NFI Factors as Regulating Mitotic Exit and Late-Born Cell Specification. Neuron 2019, 102, 1111–1126. [Google Scholar] [CrossRef]
- Park, Y.; Park, J.; Kim, Y.K. Crosstalk between translation and the aggresome-autophagy pathway. Autophagy 2018, 14, 1079–1081. [Google Scholar] [CrossRef] [PubMed]
- Kawaguchi, K.; Okamoto, T.; Morita, M.; Imanaka, T. Translocation of the ABC transporter ABCD4 from the endoplasmic reticulum to lysosomes requires the escort protein LMBD1. Sci. Rep. 2016, 6, 30183. [Google Scholar] [CrossRef] [PubMed]
- Kinoshita, Y.; Nogami, K.; Jomura, R.; Akanuma, S.I.; Abe, H.; Inouye, M.; Kubo, Y.; Hosoya, K.I. Investigation of Receptor-Mediated Cyanocobalamin (Vitamin B12) Transport across the Inner Blood-Retinal Barrier Using Fluorescence-Labeled Cyanocobalamin. Mol. Pharm. 2018, 15, 3583–3594. [Google Scholar] [CrossRef] [PubMed]


| Name | Chr | Region | Database Object Name | Identifier | Due to Time (h)—Log Fold Change | Due to Time (h)—BH p-Value | 3 vs. 0—Log Fold Change | 3 vs. 0—BH p-Value | 6 vs. 0—Log Fold Change | 6 vs. 0—BH p-Value | 6 vs. 3—Log Fold Change | 6 vs. 3—BH p-Value |
|---|---|---|---|---|---|---|---|---|---|---|---|---|
| GLO1 | 6 | complement(38675925..38703141) | Lactoylglutathione lyase | ENSG00000124767 | −1.087494 | 0 | −1.0874939 | 0 | −0.92481018 | 0 | 0.16268372 | 0.034387327 |
| MRPS33 | 7 | complement(141002610..141015228) | Mitochondrial ribosomal protein S33 | ENSG00000090263 | −0.954493 | 1.0895 × 10⁻¹⁵ | −0.9335623 | 1.054 × 10⁻¹⁰ | −0.95449333 | 1.2368 × 10⁻¹¹ | −0.020931 | 0.009901671 |
| PTPN13 | 4 | 86594315..86815171 | Tyrosine-protein phosphatase non-receptor type 13 | ENSG00000163629 | −0.92721 | 4.0112 × 10⁻¹⁰ | −0.5780328 | 0.0001813 | −0.92721027 | 7.3951 × 10⁻¹⁰ | −0.34917745 | 0.015625045 |
| MCPH1 | 8 | 6406592..6648504 | Microcephalin | ENSG00000147316 | −0.893484 | 2.2186 × 10⁻⁹ | −0.893484 | 2.92 × 10⁻⁷ | −0.78536604 | 2.4954 × 10⁻⁶ | 0.10811791 | 0.007924506 |
| EPS15 | 1 | complement(51354263..51519328) | Epidermal growth factor receptor substrate 15 | ENSG00000085832 | −0.82938 | 0 | −0.6739735 | 4.728 × 10⁻¹² | −0.82938046 | 0 | −0.15540699 | 0.046473925 |
| FMNL2 | 2 | 152335237..152649834 | Formin-like protein 2 | ENSG00000157827 | −0.80498 | 0 | −0.7772127 | 0 | −0.80497977 | 0 | −0.02776711 | 0.009594194 |
| CAND1 | 12 | 67269281..67319951 | Cullin-associated NEDD8-dissociated protein 1 | ENSG00000111530 | −0.794639 | 0 | −0.6755685 | 0 | −0.79463931 | 0 | −0.11907082 | 0.053230752 |
| GFPT1 | 2 | complement(69319769..69387254) | Glutamine--fructose-6-phosphate aminotransferase [isomerizing] 1 | ENSG00000198380 | −0.744662 | 0 | −0.7446622 | 0 | −0.52883644 | 2.4312×10⁻⁹ | 0.21582578 | 0.012956862 |
| LMBRD1 | 6 | complement(69675802..69797111) | Probable lysosomal cobalamin transporter | ENSG00000168216 | −0.709512 | 7.9331 × 10⁻⁷ | −0.4893819 | 0.0012063 | −0.70951157 | 8.9901 × 10⁻⁷ | −0.22012963 | 0.047374267 |
| MORC4 | X | complement(106813871..107000244) | MORC family CW-type zinc finger protein 4 | ENSG00000133131 | −0.709235 | 8.711 × 10⁻¹² | −0.7092347 | 1.593 × 10⁻⁹ | −0.57854773 | 2.7887 × 10⁻⁷ | 0.13068696 | 0.006919989 |
| ARHGAP21 | 10 | complement(24583609..24723668) | Rho GTPase-activating protein 21 | ENSG00000107863 | −0.528969 | 1.1901 × 10⁻⁹ | −0.1276221 | 0.0259878 | −0.52896918 | 4.8337 × 10⁻¹⁰ | −0.40134704 | 5.73978 × 10⁻⁵ |
| IPO7 | 11 | 9384622..9448126 | Importin-7 | ENSG00000205339 | −0.5203 | 8.0463 × 10⁻¹¹ | −0.5203005 | 2.589 × 10⁻¹¹ | −0.28468508 | 0.00038239 | 0.23561538 | 0.020201474 |
| UBC | 12 | complement(124911604..124917368) | Ubiquitin C | ENSG00000150991 | −0.510574 | 1.0118 × 10⁻¹² | −0.2873309 | 8.702 × 10⁻⁵ | −0.51057377 | 1.9955 × 10⁻¹³ | −0.22324287 | 0.009893577 |
| NFIA | 1 | 60865259..61462793 | Nuclear factor 1 | ENSG00000162599 | −0.482997 | 0.00653888 | −0.0816926 | 0.0077167 | −0.4829973 | 0.00283079 | −0.40130466 | 0.058384899 |
| MYO18A | 17 | complement(29071124..29180412) | Unconventional myosin-XVIIIa | ENSG00000196535 | −0.475018 | 1.0417 × 10⁻⁷ | 0.30763414 | 0.0003741 | −0.1673843 | 0.05367559 | −0.47501844 | 2.43279 × 10⁻⁷ |
| SIK3 | 11 | complement(116843402..117098437) | Serine/threonine-protein kinase SIK3 | ENSG00000160584 | −0.469217 | 0.00033548 | 0.18183347 | 0.0175837 | −0.28738387 | 0.01721478 | −0.46921734 | 0.000380934 |
| FBXW2 | 9 | complement(120751978..120793412) | F-box/WD repeat-containing protein 2 | ENSG00000119402 | −0.351676 | 0.00050796 | −0.115775 | 0.0361107 | −0.35167614 | 0.00013619 | −0.23590112 | 0.053634393 |
| SRGAP1 | 12 | 63844293..64162221 | SLIT-ROBO Rho GTPase activating protein 1, isoform CRA_a | ENSG00000196935 | −0.262089 | 0.01446499 | 0.10500568 | 0.055908 | −0.157083 | 0.0295634 | −0.26208869 | 0.012864577 |
| CTIF | 18 | 48539046..48863217 | CBP80/20-dependent translation initiation factor | ENSG00000134030 | −0.147184 | 0.02306249 | −0.1005342 | 0.0369055 | −0.14718379 | 0.01161386 | −0.0466496 | 0.007818362 |
| RFFL | 17 | complement(35005990..35089319) | E3 ubiquitin-protein ligase rififylin | ENSG00000092871 | −0.057893 | 0.00947048 | −0.0578935 | 0.0084203 | −0.0173127 | 0.00967554 | 0.04058077 | 0.009880382 |
| GALNT10 | 5 | 154190730..154420984 | Polypeptide N-acetylgalactosaminyltransferase | ENSG00000164574 | 0.1096478 | 0.04460188 | 0.07807127 | 0.0511209 | 0.10964776 | 0.02592625 | 0.03157648 | 0.008772447 |
| AUTS2 | 7 | 69598919..70793068 | Autism susceptibility gene 2 protein | ENSG00000158321 | 0.365981 | 0.00121048 | 0.36598102 | 0.0011642 | 0.29948291 | 0.00847909 | −0.06649811 | 0.007682531 |
| ANKH | 5 | complement(14704804..14871778) | Progressive ankylosis protein homolog | ENSG00000154122 | 0.5642544 | 8.6562 × 10⁻⁵ | 0.51466818 | 0.0008733 | 0.5642544 | 0.00013675 | 0.04958622 | 0.009202232 |
| Gene Symbol | Gene ID (ENSEMBL) | Primer Forward (5′ → 3′) | Primer Reverse (5′ → 3′) | Length (bp) | TM (°C) |
|---|---|---|---|---|---|
| CLIP1 | ENSG00000130779 | TGGCGTGGAGTTAGATGAGC | GGTGTAGTGGAAGGGAAGCC | 138 | 62 |
| SRSF5 | ENSG00000100650 | CCCGTGCCTGAGAAGAGC | TGCCACTGTCAACTGATCTGG | 115 | 62 |
| APOLD1 | ENSG00000178878 | GGACCAGATGCGAGAGATCC | CACGTGAGCCAAAGAAGACG | 146 | 62 |
| LYN | ENSG00000254087 | AGTCTGATGTGTGGTCCTTTGG | GCTCATCTGGGCAGTTCTCC | 147 | 62.5 |
| RASGRP3 | ENSG00000152689 | ACTGTGCGGGATTTCTCTGG | CCCATGACCACTGCTCAAGG | 146 | 62.5 |
| ITGA4 | ENSG00000115232 | GAAAGAATCCCGGCCAGACG | GGCTGTCTGGAAAGTGTGACC | 124 | 63.5 |
| PDK4 | ENSG00000004799 | TTTCTACTCGGATGCTGATGAACC | GCATCTTGGACCACTGCTACC | 121 | 63 |
| SGK1 | ENSG00000118515 | AAATGTGAGTGGGCCCAACG | CTTGACGCTGGCTGTGACG | 115 | 63.5 |
| PIK3AP1 | ENSG00000155629 | GAAGCTGGGCATTGTCAACG | CTCTCTGTCTTCGGGTGATGC | 143 | 63 |
| SPP1 | ENSG00000118785 | CCGAGGTGATAGTGTGGTTTATGG | GGTGATGTCCTCGTCTGTAGC | 97 | 63 |
| Function | Group Genes |
| Asparagine N-linked glycosylation | ANK2|ANKRD28|CANX|CMAS|GBF1|GFPT1|GNPDA2|MAN1A2|MAN2A1|NAPG|NUS1|PGM3|SEC13|SEC23IP|ST6GALNAC5|TMED9|TUBA1C|UBC |
| Clathrin recruits PIK3C2A | EPS15|ITSN1|PIK3C2A|SCARB2|UBC |
| Glycolysis | AGL|ALDOA|ALDOC|ANK2|ANKRD28|BPGM|CAND1|CANX|CMAS|EP300|GALK2|GBF1|GFPT1|GLO1|GNPDA2|HOGA1|HOOK3|HSP90AA1|HSPA14|IGBP1|INSIG1|KIF22|KLHL12|MAN1A2|MAN2A1|MYO18A|NAPG|NUDT16|NUP107|NUS1|PGAM1|PGM3|PGP|PNP|PTGES3|RNASE4|SCARB2|SEC13|SEC23IP|SLC4A4|ST6GALNAC5|TMED9|TUBA1C|UBC|XRCC5 |
| Glyoxylate and dicarboxylate metabolism | GLO1|GRHPR|HOGA1|MCEE|PGP |
| Golgi vesicle budding | ANKRD28|GBF1|INSIG1|KLHL12|MBTPS1|MYO18A|RNASE4|SCARB1|SEC13|SEC23IP|SP1|TMED9 |
| Rho GTPase cycle | ARHGAP21|ARHGEF12|ARHGEF2|DLC1|FAM13A|ITSN1|RHOBTB1|SRGAP1 |
| SMURFs ubiquitinate RUNX3 | BMPR1B|EP300|FOS|GTF2H1|HTRA1|IFI16|IKBKG|INO80|MAPK7|MNAT1|NFRKB|RBL1|SMURF2|SP1|TGFBR3|UBC|XRCC5 |
| Synthesis of PIPs at the plasma membrane | C1D|DLC1|EFNA5|FOS|KANK1|PIK3C2A|PIK3R1|PIP5K1B|PTPN13|RCC2|SBF2|UBC |
| Ubiquitin mediated proteolysis | CDC27|CUL7|RHOBTB1|SMURF2|UBC|UBE2E3|UBE2O|UBE2W |
| Unfolded Protein Response (UPR) | CUL7|EXOSC8|GFPT1|MBTPS1|SRPRB |
| Chromosomal region | ANTXR1|ASXL1|CCT4|CDC27|CEP152|DLC1|FMNL2|HSP90AA1|KIF22|KNTC1|NABP1|NDC80|NUF2|NUP107|PTGES3|RAD21|RCC2|SEC13|SKA1|SKA3|SSNA1|TAOK1|TBPL1|TEAD1|TERF2IP|THOC3|TINF2|TUBA1C|UBC|XRCC5|ZNF276|ZWILCH |
| Establishment of mitotic spindle orientation | ARHGEF2|ASXL1|MCPH1|NDC80 |
| Regulation of lamellipodium organization | AUTS2|CD44|KANK1|NAA25 |
| Translational termination | ANXA2|MRPS11|MRPS33|MRPS6|N6AMT1|RPS12|TXNDC5 |
| Function | Unclustered Gene |
| Transcription factors | MORC4, NFIA |
| Ubiquitin protein ligase activity | FBXW2, RFLL |
| Positive regulation of mTOR signaling | SIK3 |
| Nuclear import of proteins | IPO7 |
| Translation initiation | CTIF |
| Catalysis of mucin-type oligosaccharides | GALNT10 |
| PPi transport regulation | ANKH |
© 2020 by the authors. Licensee MDPI, Basel, Switzerland. This article is an open access article distributed under the terms and conditions of the Creative Commons Attribution (CC BY) license (http://creativecommons.org/licenses/by/4.0/).
Share and Cite
Donato, L.; Scimone, C.; Alibrandi, S.; Nicocia, G.; Rinaldi, C.; Sidoti, A.; D’Angelo, R. Discovery of GLO1 New Related Genes and Pathways by RNA-Seq on A2E-Stressed Retinal Epithelial Cells Could Improve Knowledge on Retinitis Pigmentosa. Antioxidants 2020, 9, 416. https://doi.org/10.3390/antiox9050416
Donato L, Scimone C, Alibrandi S, Nicocia G, Rinaldi C, Sidoti A, D’Angelo R. Discovery of GLO1 New Related Genes and Pathways by RNA-Seq on A2E-Stressed Retinal Epithelial Cells Could Improve Knowledge on Retinitis Pigmentosa. Antioxidants. 2020; 9(5):416. https://doi.org/10.3390/antiox9050416
Chicago/Turabian StyleDonato, Luigi, Concetta Scimone, Simona Alibrandi, Giacomo Nicocia, Carmela Rinaldi, Antonina Sidoti, and Rosalia D’Angelo. 2020. "Discovery of GLO1 New Related Genes and Pathways by RNA-Seq on A2E-Stressed Retinal Epithelial Cells Could Improve Knowledge on Retinitis Pigmentosa" Antioxidants 9, no. 5: 416. https://doi.org/10.3390/antiox9050416
APA StyleDonato, L., Scimone, C., Alibrandi, S., Nicocia, G., Rinaldi, C., Sidoti, A., & D’Angelo, R. (2020). Discovery of GLO1 New Related Genes and Pathways by RNA-Seq on A2E-Stressed Retinal Epithelial Cells Could Improve Knowledge on Retinitis Pigmentosa. Antioxidants, 9(5), 416. https://doi.org/10.3390/antiox9050416