AOP1, a New Live Cell Assay for the Direct and Quantitative Measure of Intracellular Antioxidant Effects

Abstract
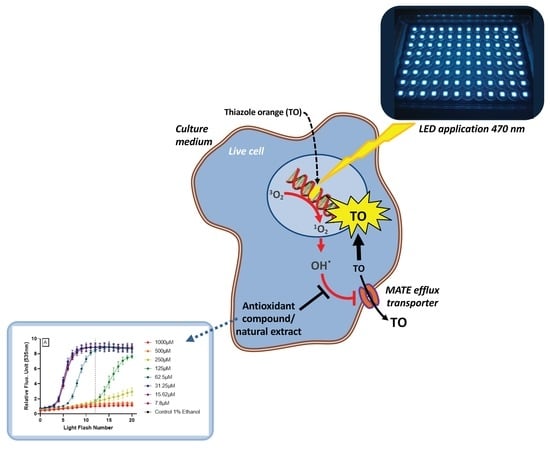
1. Introduction
2. Materials and Methods
2.1. Materials and Reagents
2.2. Cell Culture
2.3. AOP1 Assay Experimental Protocol
2.4. Dose Response Post-Analysis
2.5. EC50 and Determination Coefficient (R2) Evaluation
3. Results
3.1. AOP1 Assay Optimization
3.2. Demonstration of Intracellular Antioxidant Effect Using AOP1 Protocol
- -
- Firstly, data obtained for the first 12 light flashes needed to reach the plateau in control conditions were normalized using the following equation: NFU% = [(RFUFNx − RFUFN0)/(RFUFN12 − RFUFN0)] × 100 with RFU = relative fluorescent unit, FNx = flash number x and NFU% = normalized fluorescence unit. Normalized profiles are depicted in Figure 2B.
- -
- Secondly, the CAI was calculated by integrating all NFU values following the equation CAI = 1000 − 1000 × (AUCx/AUCcontrol) where AUCx = 0∫12 NFUFNx and AUCcontrol = 0∫12 NFUFNcontrol. An AUC describing the CAI is given in Figure 2B (orange surface) in the case of resveratrol 62.5 μM treatment.
3.3. AOP1 Dose-Response Profiles Obtained for 15 Classical Antioxidant Compounds
3.4. Generalization of AOP1 Assay Protocol to Other Human Cell Lines
3.5. AOP1 Assay Application to Commercially-Available Products Claiming Antioxidant Properties
3.6. Ability of AOP1 Assay to Measure Pro-Oxidative Effects
4. Discussion
4.1. Adaptation of LUCS Protocol to Measure Antioxidant Activity Inside Cells:
4.2. Antioxidants Known as Hydroxyl Radical Scavengers Abolish AOP1 Fluorescence Increase:
4.3. AOP1 Allows to Differentiate Hydrophilic from Hydrophobic Antioxidants:
4.4. Detection of Dual Pro-Oxidant/Antioxidant Effects by AOP1:
4.5. Benefits of AOP1 Assay:
Supplementary Materials
Author Contributions
Funding
Acknowledgments
Conflicts of Interest
References
- Holmström, K.M.; Finkel, T. Cellular mechanisms and physiological consequences of redox-dependent signalling. Nat. Rev. Mol. Cell Biol. 2014, 15, 411–421. [Google Scholar] [CrossRef] [PubMed]
- Serino, A.; Salazar, G. Protective Role of Polyphenols against Vascular Inflammation, Aging and Cardiovascular Disease. Nutrients 2018, 11, 53. [Google Scholar] [CrossRef] [PubMed]
- Sies, H.; Berndt, C.; Jones, D.P. Oxidative Stress. Annu. Rev. Biochem. 2017, 86, 715–748. [Google Scholar] [CrossRef] [PubMed]
- Rampon, C.; Volovitch, M.; Joliot, A.; Vriz, S. Hydrogen Peroxide and Redox Regulation of Developments. Antioxidants 2018, 7, 159. [Google Scholar] [CrossRef]
- Products, N.A.A.; Turck, D.; Bresson, J.; Burlingame, B.; Dean, T.; Fairweather-Tait, S.; Heinonen, M.; Hirsch-Ernst, K.I.; Mangelsdorf, I.; McArdle, H.J.; et al. Guidance for the scientific requirements for health claims related to antioxidants, oxidative damage and cardiovascular health. EFSA J. 2018, 16, 5136. [Google Scholar] [CrossRef]
- Granato, D.; Shahidi, F.; Wrolstad, R.; Kilmartin, P.; Melton, L.D.; Hidalgo, F.J.; Miyashita, K.; van Camp, J.; Alasalvar, C.; Ismail, A.B.; et al. Antioxidant activity, total phenolics and flavonoids contents: Should we ban in vitro screening methods? Food Chem. 2018, 264, 471–475. [Google Scholar] [CrossRef]
- Hartung, T. Food for thought... on animal tests. ALTEX 2008, 3–9. [Google Scholar] [CrossRef]
- Regulation (EC) No 1223/2009 of the European Parliament and of the Council of 30 November 2009 on cosmetic products. Official Journal European Union, 22 December 2009; Volume L342, 60.
- López-Alarcón, C.; Denicola, A. Evaluating the antioxidant capacity of natural products: A review on chemical and cellular-based assays. Anal. Chim. Acta 2013, 763, 1–10. [Google Scholar] [CrossRef]
- Cheli, F.; Baldi, A. Nutrition-Based Health: Cell-Based Bioassays for Food Antioxidant Activity Evaluation. J. Food Sci. 2011, 76, R197–R205. [Google Scholar] [CrossRef]
- Maghzal, G.J.; Krause, K.-H.; Stocker, R.; Jaquet, V. Detection of reactive oxygen species derived from the family of NOX NADPH oxidases. Free Radic. Biol. Med. 2012, 53, 1903–1918. [Google Scholar] [CrossRef]
- Erard, M.; Dupré-Crochet, S.; Nüße, O. Biosensors for spatiotemporal detection of reactive oxygen species in cells and tissues. Am. J. Physiol.-Regul. Integr. Comp. Physiol. 2018, 314, R667–R683. [Google Scholar] [CrossRef] [PubMed]
- Dooley, C.T.; Dore, T.M.; Hanson, G.T.; Jackson, W.C.; Remington, S.J.; Tsien, R.Y. Imaging Dynamic Redox Changes in Mammalian Cells with Green Fluorescent Protein Indicators. J. Biol. Chem. 2004, 279, 22284–22293. [Google Scholar] [CrossRef] [PubMed]
- Macdonald, M.; Murray, I.; Axelsen, P. Mass spectrometric analysis demonstrates that BODIPY 581/591 C11 overestimates and inhibits oxidative lipid damage. Free Radic. Biol. Med. 2007, 42, 1392–1397. [Google Scholar] [CrossRef] [PubMed]
- Zielonka, J.; Kalyanaraman, B. Hydroethidine- and MitoSOX-derived red fluorescence is not a reliable indicator of intracellular superoxide formation: Another inconvenient truth. Free Radic. Biol. Med. 2010, 48, 983–1001. [Google Scholar] [CrossRef] [PubMed]
- Liao, P.-C.; Franco-Iborra, S.; Yang, Y.; Pon, L.A. Live cell imaging of mitochondrial redox state in mammalian cells and yeast. In Methods in Cell Biology; Elsevier: Amsterdam, The Netherlands, 2020; Volume 155, pp. 295–315. ISBN 978-0-12-820228-9. [Google Scholar]
- Choi, H.; Yang, Z.; Weisshaar, J.C. Single-cell, real-time detection of oxidative stress induced in Escherichia coli by the antimicrobial peptide CM15. Proc. Natl. Acad. Sci. USA 2015, 112, E303–E310. [Google Scholar] [CrossRef]
- Kalyanaraman, B.; Darley-Usmar, V.; Davies, K.J.A.; Dennery, P.A.; Forman, H.J.; Grisham, M.B.; Mann, G.E.; Moore, K.; Roberts, L.J.; Ischiropoulos, H. Measuring reactive oxygen and nitrogen species with fluorescent probes: Challenges and limitations. Free Radic. Biol. Med. 2012, 52, 1–6. [Google Scholar] [CrossRef]
- Stevenson, D.; Wokosin, D.; Girkin, J.; Grant, M.H. Measurement of the intracellular distribution of reduced glutathione in cultured rat hepatocytes using monochlorobimane and confocal laser scanning microscopy. Toxicol. Vitr. 2002, 16, 609–619. [Google Scholar] [CrossRef]
- Kellett, M.E.; Greenspan, P.; Pegg, R.B. Modification of the cellular antioxidant activity (CAA) assay to study phenolic antioxidants in a Caco-2 cell line. Food Chem. 2018, 244, 359–363. [Google Scholar] [CrossRef]
- Wolfe, K.L.; Liu, R.H. Cellular Antioxidant Activity (CAA) Assay for Assessing Antioxidants, Foods, and Dietary Supplements. J. Agric. Food Chem. 2007, 55, 8896–8907. [Google Scholar] [CrossRef]
- Wolfe, K.L.; Kang, X.; He, X.; Dong, M.; Zhang, Q.; Liu, R.H. Cellular Antioxidant Activity of Common Fruits. J. Agric. Food Chem. 2008, 56, 8418–8426. [Google Scholar] [CrossRef]
- Song, W.; Derito, C.M.; Liu, M.K.; He, X.; Dong, M.; Liu, R.H. Cellular Antioxidant Activity of Common Vegetables. J. Agric. Food Chem. 2010, 58, 6621–6629. [Google Scholar] [CrossRef] [PubMed]
- Derick, S.; Gironde, C.; Perio, P.; Reybier, K.; Nepveu, F.; Jauneau, A.; Furger, C. LUCS (Light-Up Cell System), a universal high throughput assay for homeostasis evaluation in live cells. Sci. Rep. 2017, 7, 18069. [Google Scholar] [CrossRef] [PubMed]
- Gironde, C.; Dufour, C.; Furger, C. Use of LUCS (Light-Up Cell System) as an alternative live cell method to predict human acute oral toxicity. Toxicol. Rep. 2020, 7, 403–412. [Google Scholar] [CrossRef] [PubMed]
- Bernatoniene, J.; Kopustinskiene, D. The Role of Catechins in Cellular Responses to Oxidative Stress. Molecules 2018, 23, 965. [Google Scholar] [CrossRef] [PubMed]
- Wilms, L.C.; Kleinjans, J.C.S.; Moonen, E.J.C.; Briedé, J.J. Discriminative protection against hydroxyl and superoxide anion radicals by quercetin in human leucocytes in vitro. Toxicol. Vitr. 2008, 22, 301–307. [Google Scholar] [CrossRef]
- Nanjo, F.; Mori, M.; Goto, K.; Hara, Y. Radical Scavenging Activity of Tea Catechins and Their Related Compounds. Biosci. Biotechnol. Biochem. 1999, 63, 1621–1623. [Google Scholar] [CrossRef]
- Lu, M.; Fang, J.-G.; Liu, Z.-L.; Wu, L.-M. Effects of resveratrol and its analogs on scavenging hydroxyl radicals: Evaluation by EPR spin trapping method. Appl. Magn. Reson. 2002, 22, 475–481. [Google Scholar] [CrossRef]
- Iuga, C.; Alvarez-Idaboy, J.R.; Russo, N. Antioxidant Activity of trans -Resveratrol toward Hydroxyl and Hydroperoxyl Radicals: A Quantum Chemical and Computational Kinetics Study. J. Org. Chem. 2012, 77, 3868–3877. [Google Scholar] [CrossRef]
- Niki, E. Role of vitamin E as a lipid-soluble peroxyl radical scavenger: In vitro and in vivo evidence. Free Radic. Biol. Med. 2014, 66, 3–12. [Google Scholar] [CrossRef]
- Brainina, K.; Stozhko, N.; Vidrevich, M. Antioxidants: Terminology, Methods, and Future Considerations. Antioxidants 2019, 8, 297. [Google Scholar] [CrossRef]
- Alberto, M.E.; Russo, N.; Grand, A.; Galano, A. A physicochemical examination of the free radical scavenging activity of Trolox: Mechanism, kinetics and influence of the environment. Phys. Chem. Chem. Phys. 2013, 15, 4642. [Google Scholar] [CrossRef] [PubMed]
- Goto, S.; Kogure, K.; Abe, K.; Kimata, Y.; Kitahama, K.; Yamashita, E.; Terada, H. Efficient radical trapping at the surface and inside the phospholipid membrane is responsible for highly potent antiperoxidative activity of the carotenoid astaxanthin. Biochim. Biophys. Acta (BBA)—Biomembr. 2001, 1512, 251–258. [Google Scholar] [CrossRef]
- Kogure, K. Novel Antioxidative Activity of Astaxanthin and Its Synergistic Effect with Vitamin E. J. Nutr. Sci. Vitaminol. 2019, 65, S109–S112. [Google Scholar] [CrossRef] [PubMed]
- Klotz, L.-O.; Hou, X.; Jacob, C. 1,4-Naphthoquinones: From Oxidative Damage to Cellular and Inter-Cellular Signaling. Molecules 2014, 19, 14902–14918. [Google Scholar] [CrossRef]
- Loor, G.; Kondapalli, J.; Schriewer, J.M.; Chandel, N.S.; Vanden Hoek, T.L.; Schumacker, P.T. Menadione triggers cell death through ROS-dependent mechanisms involving PARP activation without requiring apoptosis. Free Radic. Biol. Med. 2010, 49, 1925–1936. [Google Scholar] [CrossRef]
- Oztopcu-Vatan, P.; Sayitoglu, M.; Gunindi, M.; Inan, E. Cytotoxic and apoptotic effects of menadione on rat hepatocellular carcinoma cells. Cytotechnology 2015, 67, 1003–1009. [Google Scholar] [CrossRef][Green Version]
- Ishii, T.; Itoh, K.; Takahashi, S.; Sato, H.; Yanagawa, T.; Katoh, Y.; Bannai, S.; Yamamoto, M. Transcription Factor Nrf2 Coordinately Regulates a Group of Oxidative Stress-inducible Genes in Macrophages. J. Biol. Chem. 2000, 275, 16023–16029. [Google Scholar] [CrossRef]
- Rosen, G.M.; Freeman, B.A. Detection of superoxide generated by endothelial cells. Proc. Natl. Acad. Sci. USA 1984, 81, 7269–7273. [Google Scholar] [CrossRef]
- Kahl, R. Synthetic antioxidants: Biochemical actions and interference with radiation, toxic compounds, chemical mutagens and chemical carcinogens. Toxicology 1984, 33, 185–228. [Google Scholar] [CrossRef]
- Butylated Hydroxyanisole, 14th Report on Carcinogens. U.S. Department of Health and Human Services. Available online: https://ntp.niehs.nih.gov/whatwestudy/assessments/cancer/roc/index.html?utm_source=direct&utm_medium=prod&utm_campaign=ntpgolinks&utm_term=roc (accessed on 1 April 2020).
- Lanigan, R.S.; Yamarik, T. Final Report on the Safety Assessment of BHT. Int. J. Toxicol. 2002, 21, 19–94. [Google Scholar] [CrossRef]
- 2 Final Report on the Safety Assessment of Butylated Hydroxyanisole. J. Am. Coll. Toxicol. 1984, 3, 83–146. [CrossRef]
- Babich, H. Butylated hydroxytoluene (BHT): A review. Environ. Res. 1982, 29, 1–29. [Google Scholar] [CrossRef]
- Williams, G.M.; Iatropoulos, M.J.; Whysner, J. Safety Assessment of Butylated Hydroxyanisole and Butylated Hydroxytoluene as Antioxidant Food Additives. Food Chem. Toxicol. 1999, 37, 1027–1038. [Google Scholar] [CrossRef]
- EU. Commission Implementing Regulation (EU) 2017/962 of 7 June 2017 suspending the authorisation of ethoxyquin as a feed additive for all animal species and categories. Available online: http://data.europa.eu/eli/reg_impl/2017/962/oj (accessed on 27 May 2020).
- Błaszczyk, A.; Augustyniak, A.; Skolimowski, J. Ethoxyquin: An Antioxidant Used in Animal Feed. Int. J. Food Sci. 2013, 2013, 1–12. [Google Scholar] [CrossRef] [PubMed]
- Thimmulappa, R.K.; Mai, K.H.; Srisuma, S.; Kensler, T.W.; Yamamoto, M.; Biswal, S. Identification of Nrf2-regulated Genes Induced by the Chemopreventive Agent Sulforaphane by Oligonucleotide Microarray. Cancer Res. 2002, 62, 5196. [Google Scholar] [PubMed]
- Fahey, J.W.; Talalay, P. Antioxidant Functions of Sulforaphane: A Potent Inducer of Phase II Detoxication Enzymes. Food Chem. Toxicol. 1999, 37, 973–979. [Google Scholar] [CrossRef]
- Zhang, Y.; Kensler, T.W.; Cho, C.G.; Posner, G.H.; Talalay, P. Anticarcinogenic activities of sulforaphane and structurally related synthetic norbornyl isothiocyanates. Proc. Natl. Acad. Sci. USA 1994, 91, 3147–3150. [Google Scholar] [CrossRef]
- Chen, X.; Zhong, Z.; Xu, Z.; Chen, L.; Wang, Y. 2′,7′-Dichlorodihydrofluorescein as a fluorescent probe for reactive oxygen species measurement: Forty years of application and controversy. Free Radic. Res. 2010, 44, 587–604. [Google Scholar] [CrossRef]
- Yazdani, M. Concerns in the application of fluorescent probes DCDHF-DA, DHR 123 and DHE to measure reactive oxygen species in vitro. Toxicol. Vitr. 2015, 30, 578–582. [Google Scholar] [CrossRef]
- Royall, J.A.; Ischiropoulos, H. Evaluation of 2′,7′-Dichlorofluorescin and Dihydrorhodamine 123 as Fluorescent Probes for Intracellular H2O2 in Cultured Endothelial Cells. Arch. Biochem. Biophys. 1993, 302, 348–355. [Google Scholar] [CrossRef]
- Karunakaran, V.; Pérez Lustres, J.L.; Zhao, L.; Ernsting, N.P.; Seitz, O. Large Dynamic Stokes Shift of DNA Intercalation Dye Thiazole Orange has Contribution from a High-Frequency Mode. J. Am. Chem. Soc. 2006, 128, 2954–2962. [Google Scholar] [CrossRef] [PubMed]
- Vigliante, I.; Mannino, G.; Maffei, M.E. OxiCyan®, a phytocomplex of bilberry (Vaccinium myrtillus) and spirulina (Spirulina platensis), exerts both direct antioxidant activity and modulation of ARE/Nrf2 pathway in HepG2 cells. J. Funct. Foods 2019, 61, 103508. [Google Scholar] [CrossRef]


| EC50 (µM) | R2 | LogP | |
|---|---|---|---|
| Epigallocatechin gallate | 7.09 | 0.953 | 0.00 |
| Quercetin | 23.66 | 0.985 | 1.48 |
| BHA | 31.54 | 0.941 | 3.30 |
| BHT | 34.25 | 0.971 | 5.30 |
| Ethoxyquin | 42.06 | 0.992 | 3.10 |
| Resveratrol | 64.66 | 0.984 | 3.10 |
| Trolox | 138.50 | 0.966 | 2.80 |
| Catechin | 555.70 | 0.990 | 0.40 |
| Epicatechin | 624.70 | 0.960 | 0.40 |
| EUK134 | 979.00 | 0.877 | ND |
| Sulforaphane | ND | ND | 1.40 |
| α-Tocopherol | ND | ND | 10.70 |
| Vitamin E acetate | ND | ND | 10.30 |
| Astaxanthin | ND | ND | 10.30 |
| γ-Tocopherol | ND | ND | 10.30 |
| EC50 (µM) | R2 | |
|---|---|---|
| HepG2 | 23.66 | 0.985 |
| CaCo2 | 5.02 | 0.999 |
| SH-SY5Y | 5.92 | 0.998 |
| HaCaT | 2.14 | 0.999 |
| EC50 (%) | R2 | |
|---|---|---|
| Polyphenol Mix | 1.62 | 0.992 |
| Blueberry juice | 0.52 | 0.999 |
© 2020 by the authors. Licensee MDPI, Basel, Switzerland. This article is an open access article distributed under the terms and conditions of the Creative Commons Attribution (CC BY) license (http://creativecommons.org/licenses/by/4.0/).
Share and Cite
Gironde, C.; Rigal, M.; Dufour, C.; Furger, C. AOP1, a New Live Cell Assay for the Direct and Quantitative Measure of Intracellular Antioxidant Effects. Antioxidants 2020, 9, 471. https://doi.org/10.3390/antiox9060471
Gironde C, Rigal M, Dufour C, Furger C. AOP1, a New Live Cell Assay for the Direct and Quantitative Measure of Intracellular Antioxidant Effects. Antioxidants. 2020; 9(6):471. https://doi.org/10.3390/antiox9060471
Chicago/Turabian StyleGironde, Camille, Mylène Rigal, Cécile Dufour, and Christophe Furger. 2020. "AOP1, a New Live Cell Assay for the Direct and Quantitative Measure of Intracellular Antioxidant Effects" Antioxidants 9, no. 6: 471. https://doi.org/10.3390/antiox9060471
APA StyleGironde, C., Rigal, M., Dufour, C., & Furger, C. (2020). AOP1, a New Live Cell Assay for the Direct and Quantitative Measure of Intracellular Antioxidant Effects. Antioxidants, 9(6), 471. https://doi.org/10.3390/antiox9060471