Prediction of Antioxidant Activity of Cherry Fruits from UAS Multispectral Imagery Using Machine Learning


 ,
,  , ,
, ,
Abstract
1. Introduction
2. Materials and Methods
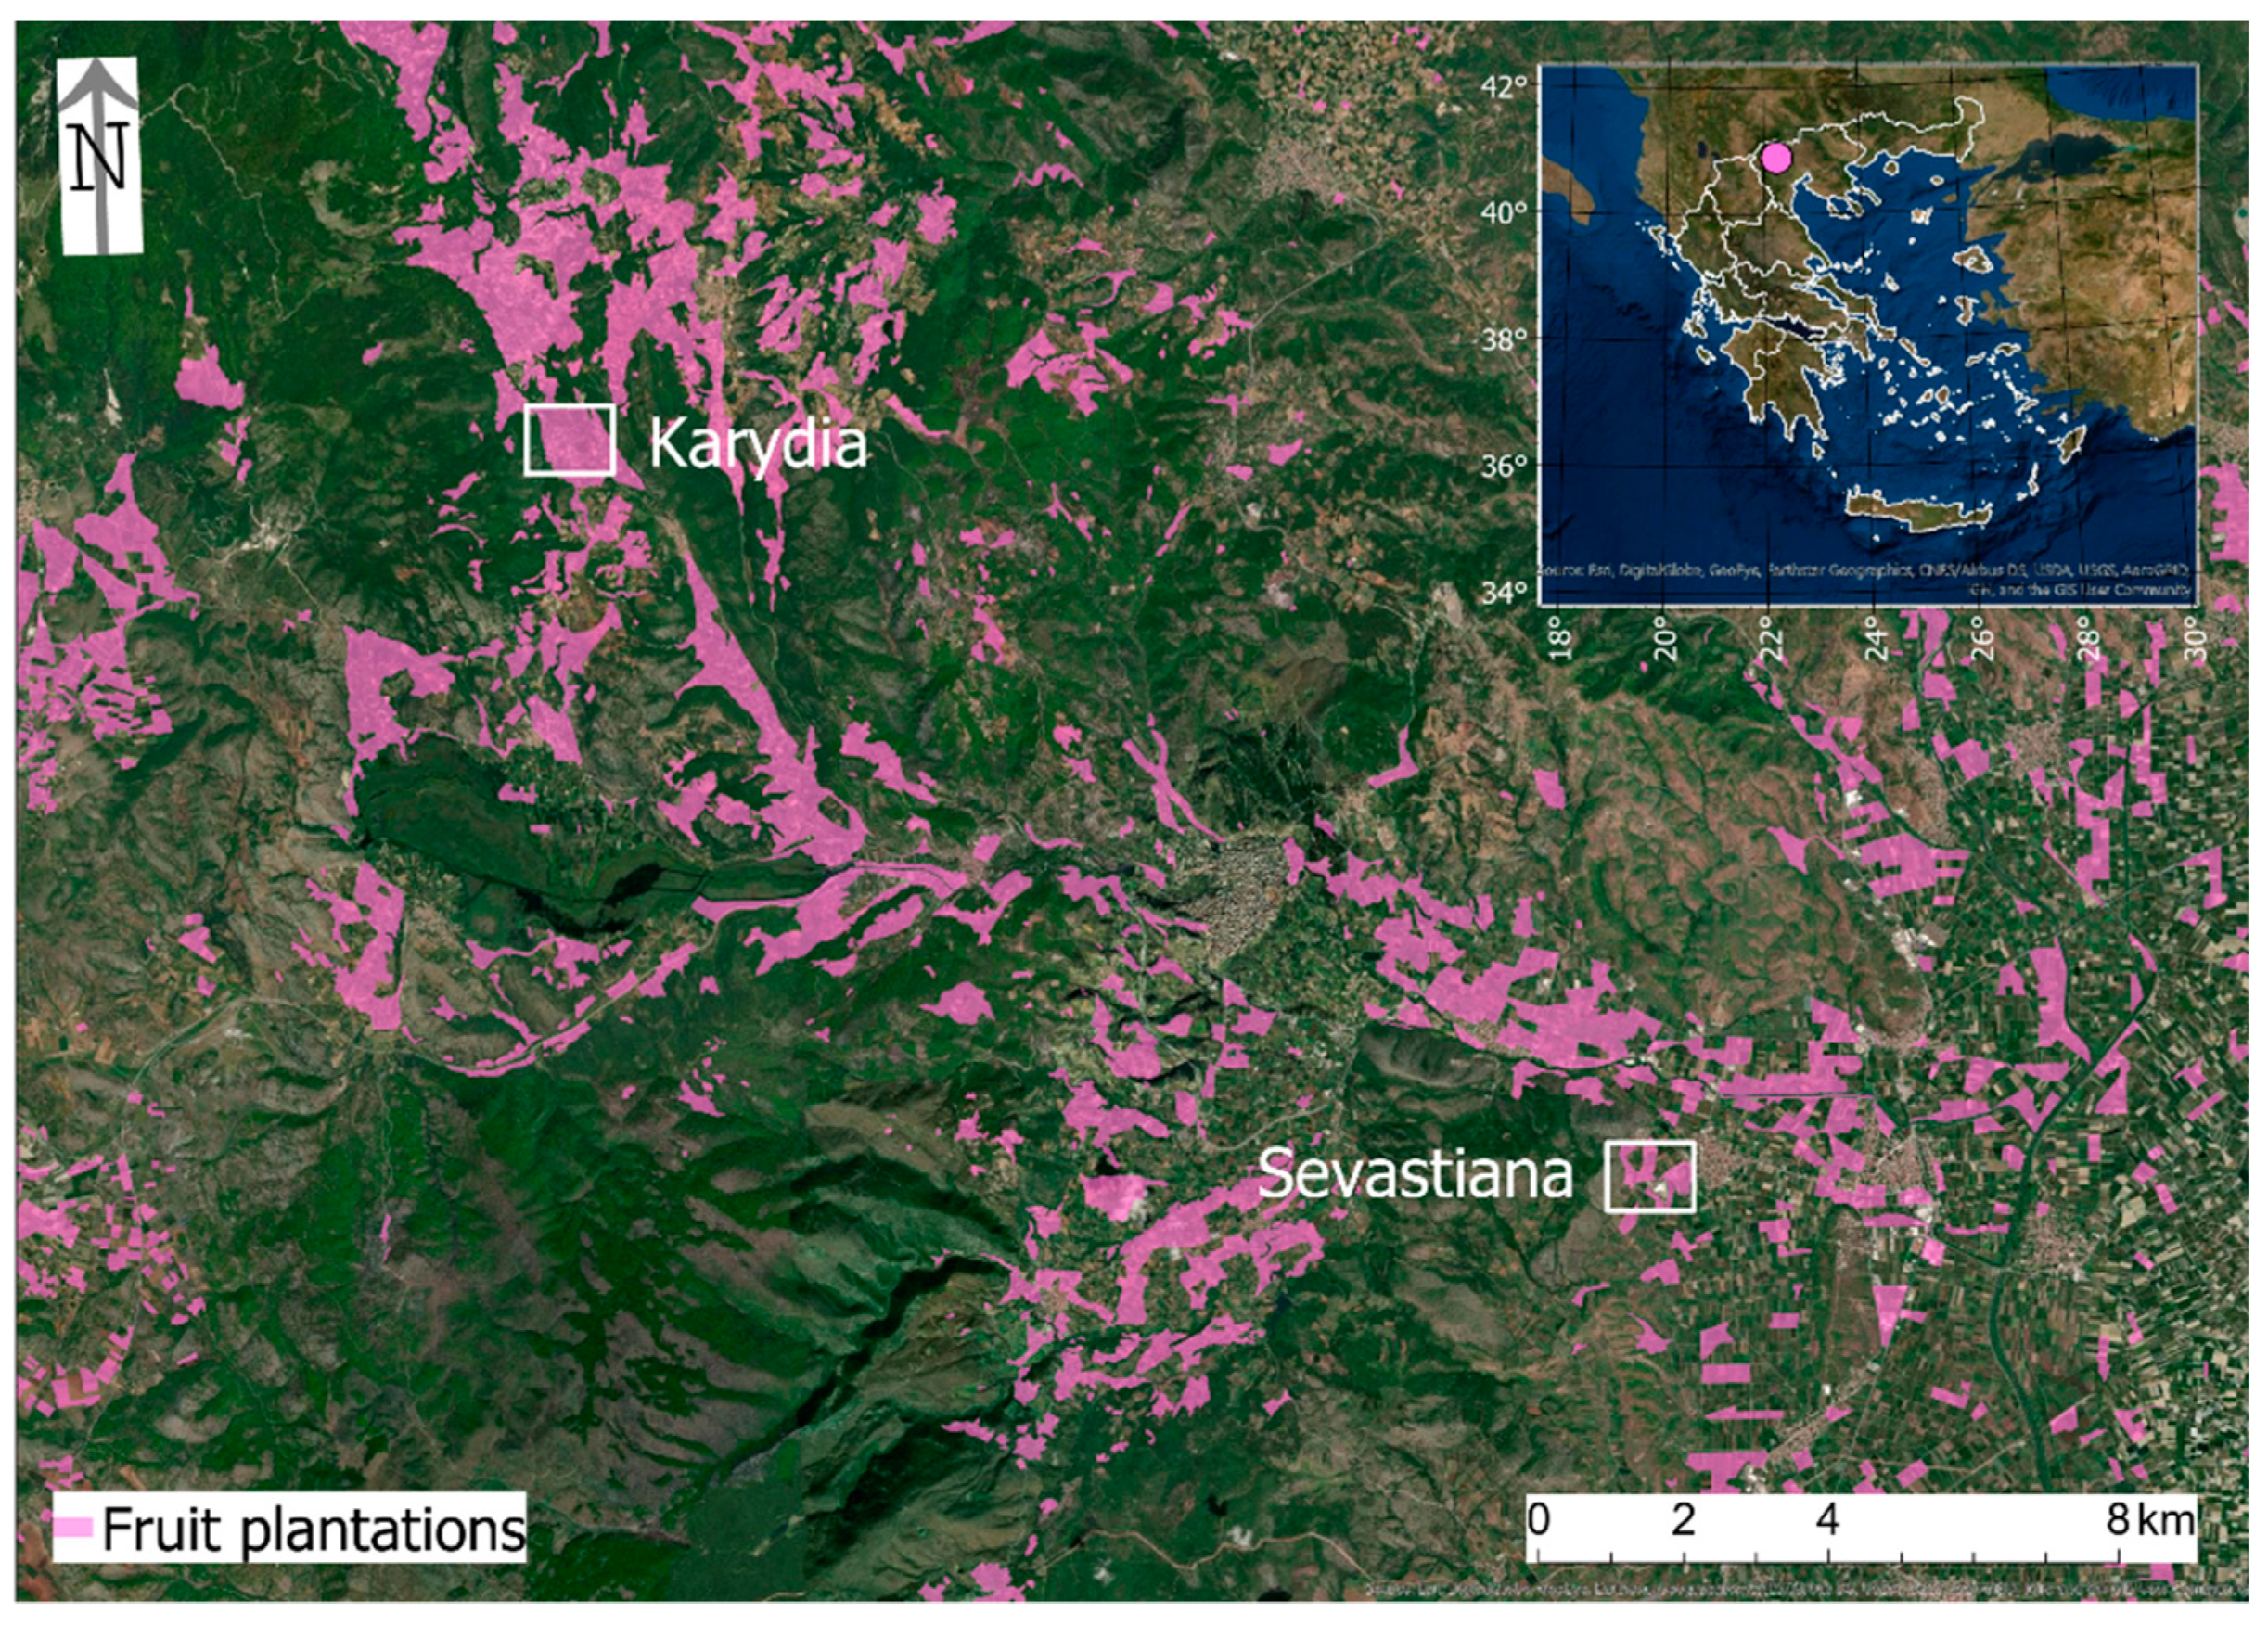
2.1. Study Area
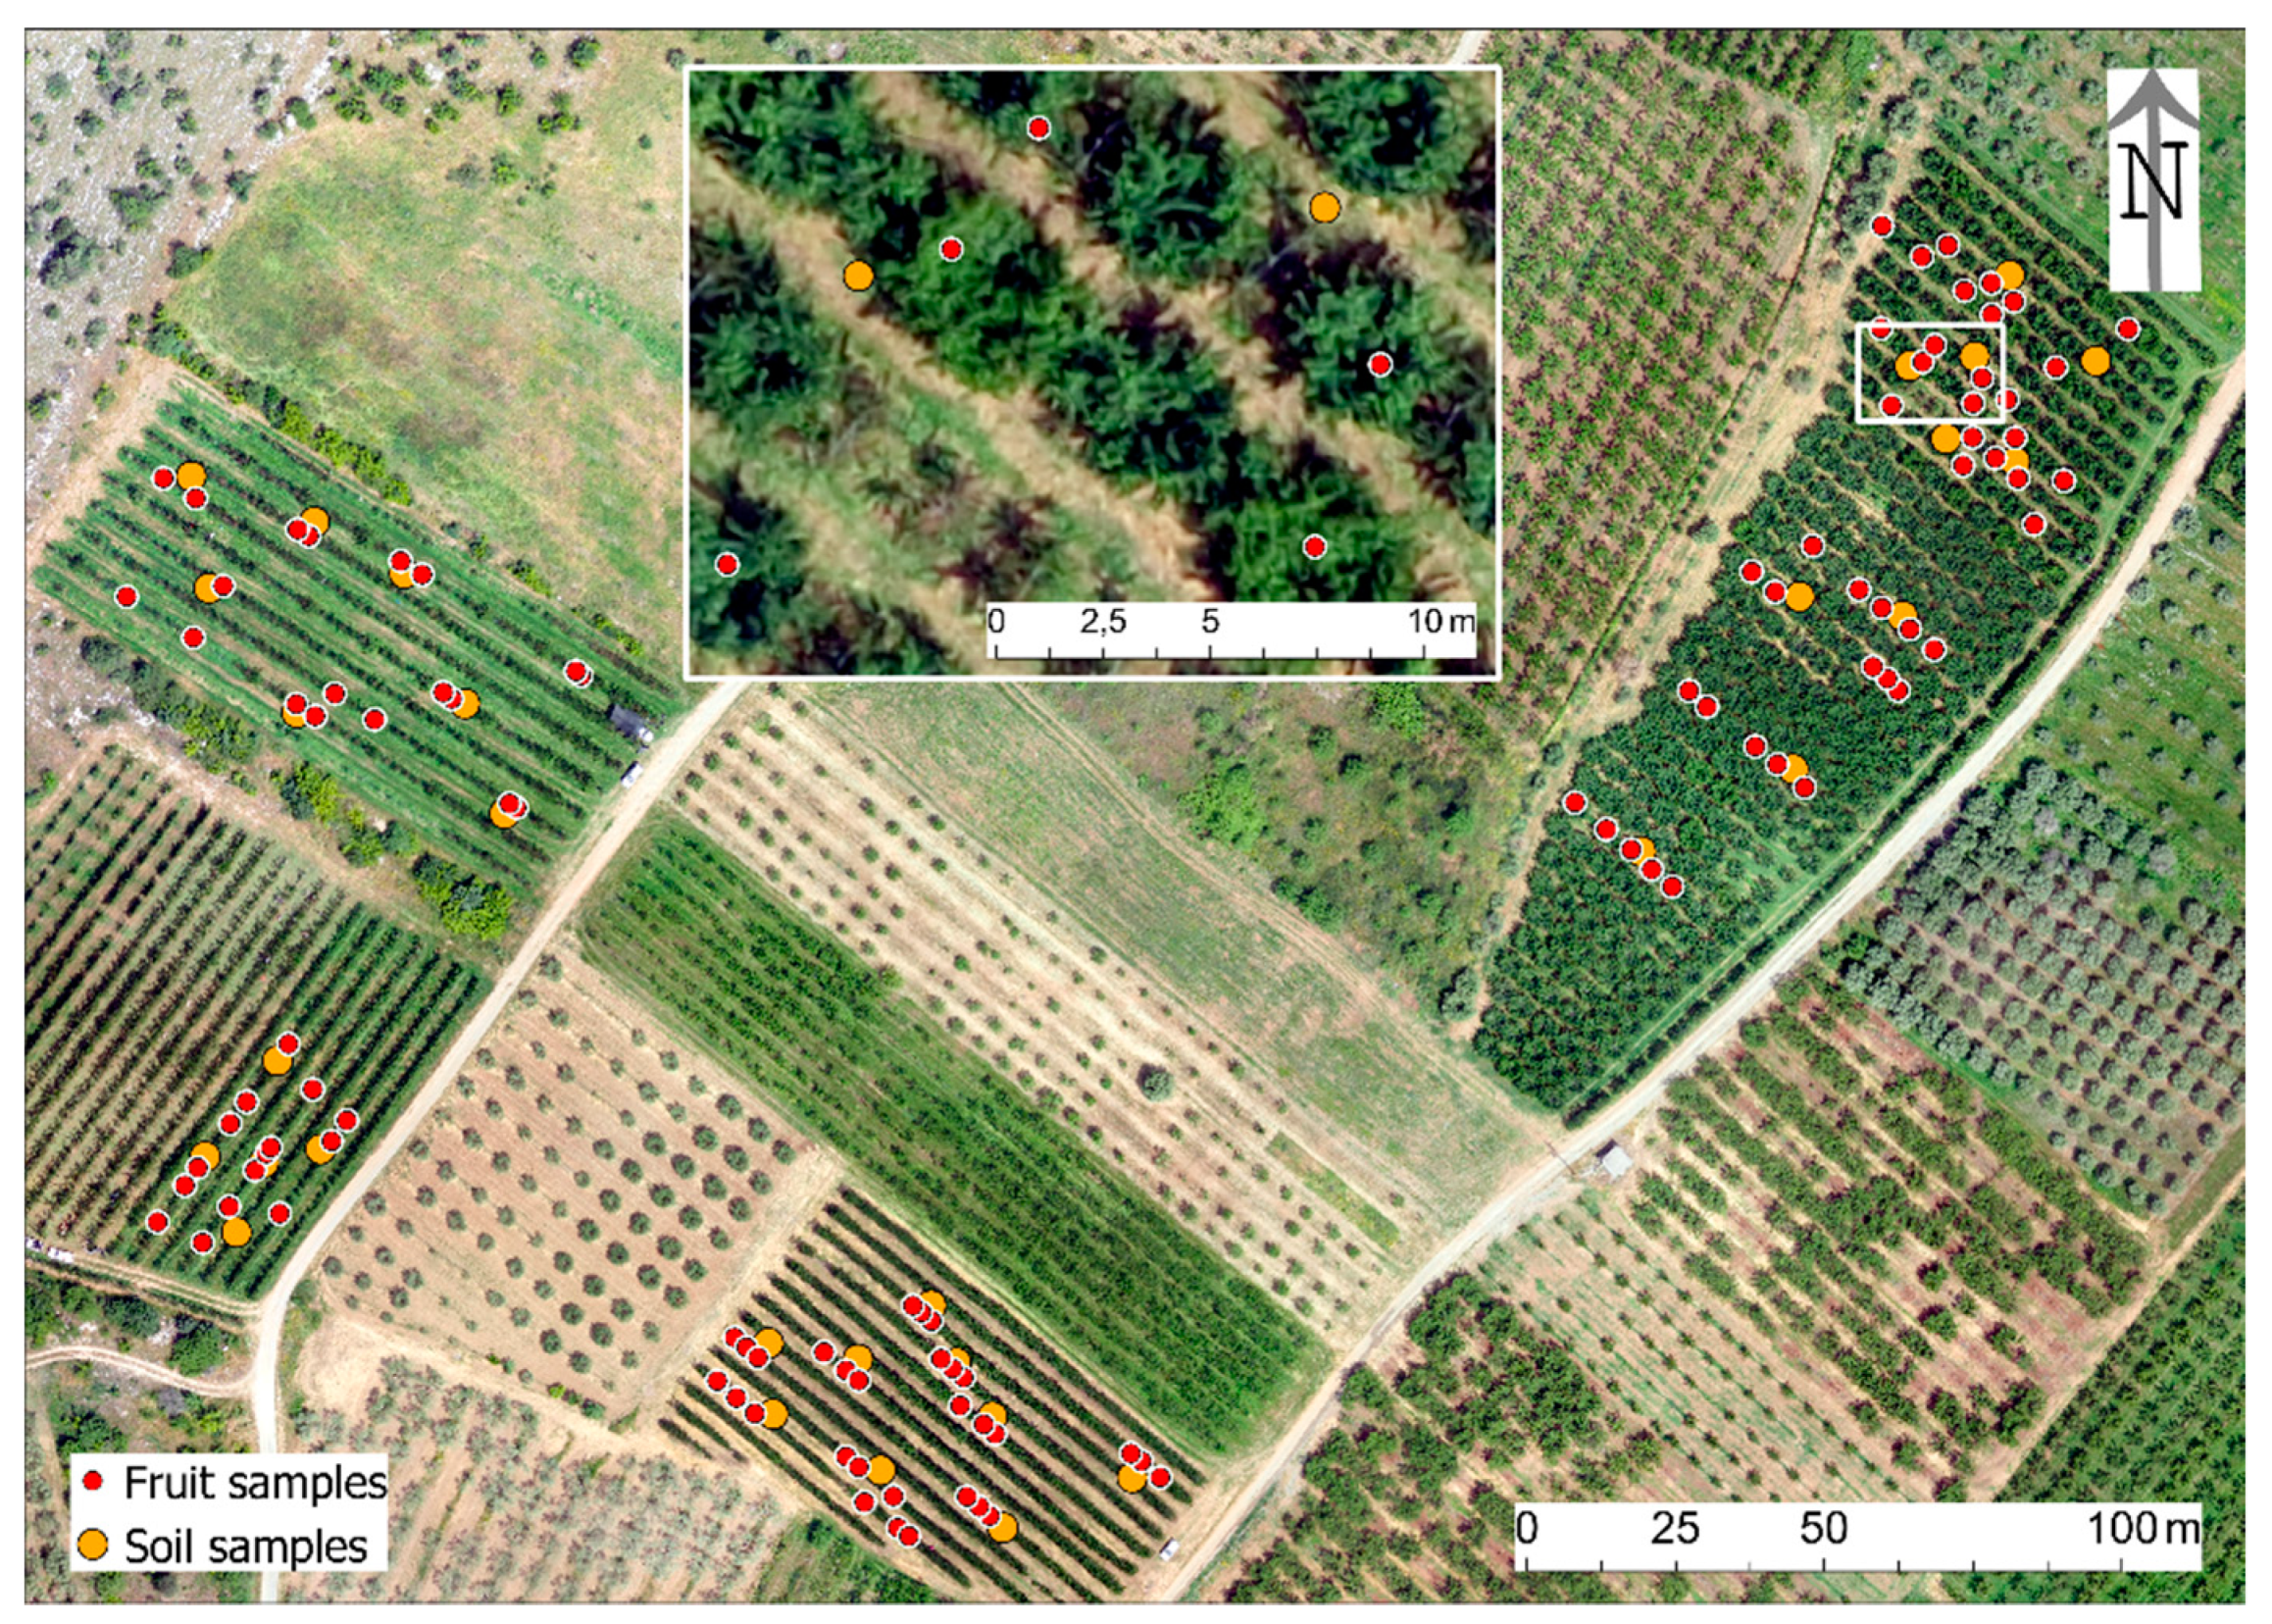
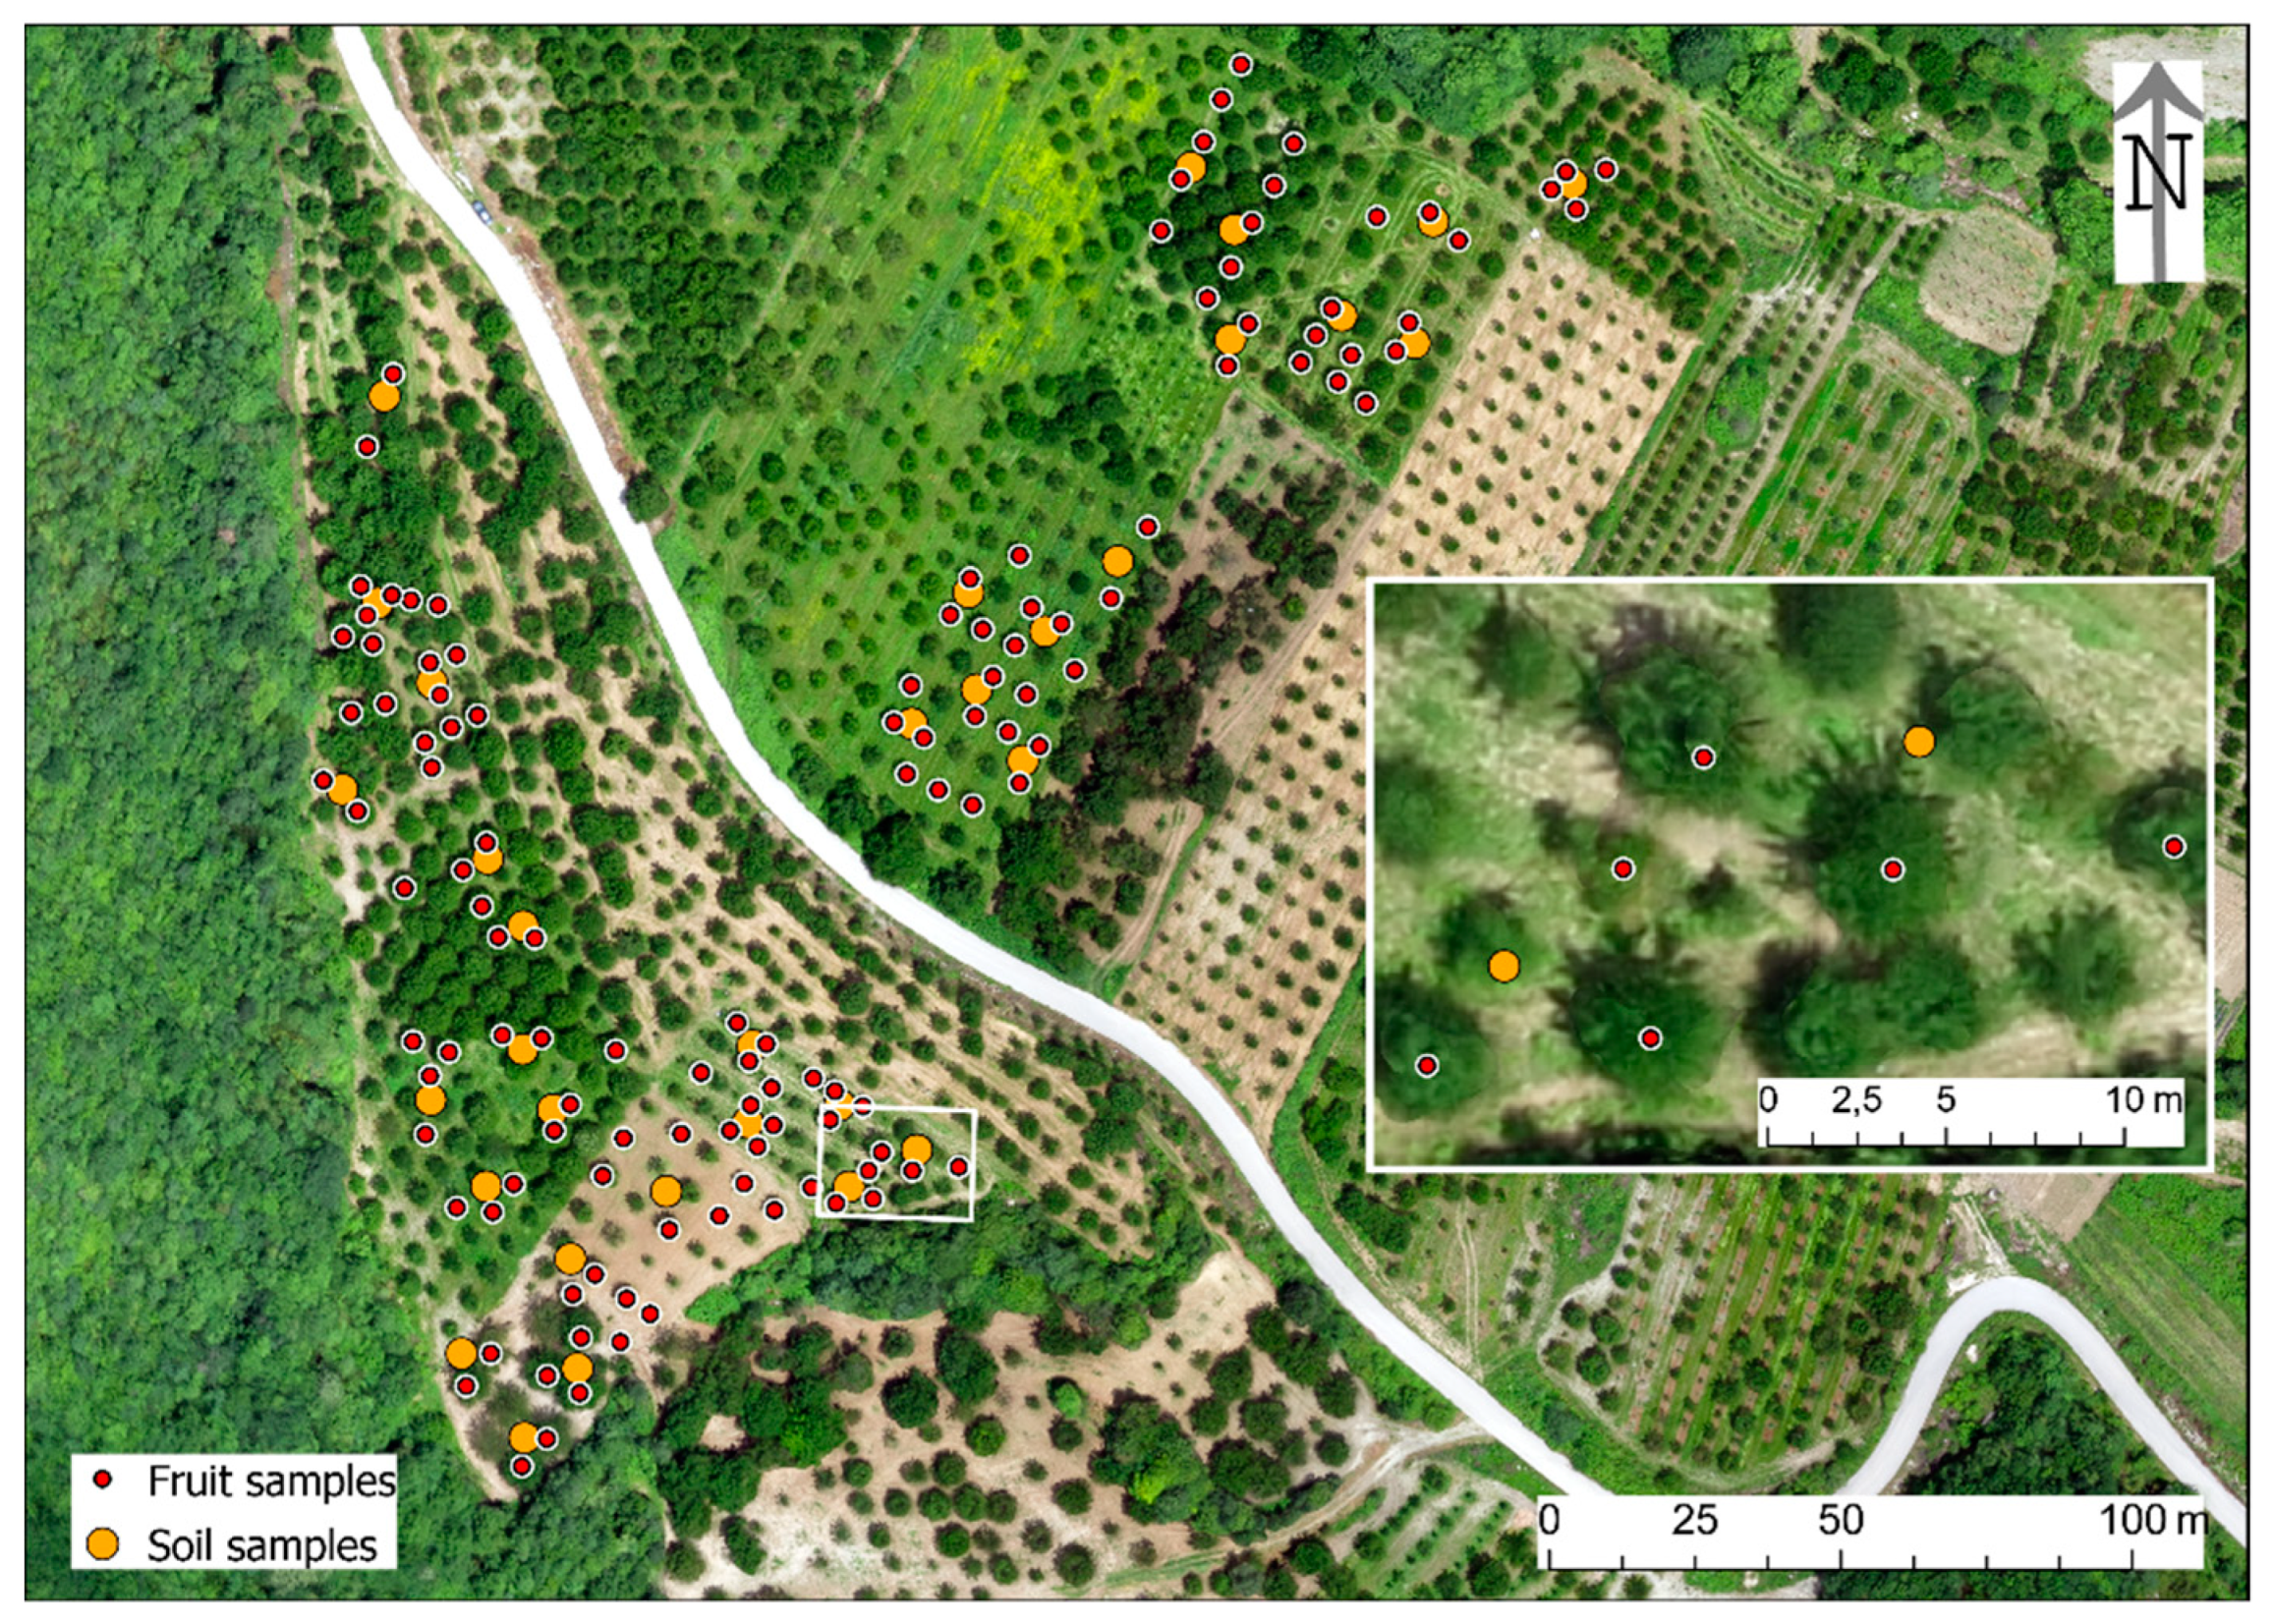
2.2. Experimental Design
2.3. Data Set Preparation
2.3.1. Image Data
- A modified ‘multiSPEC 4C’ camera, with four lenses, capturing at the following wavelengths; 510 nm, 660 nm, 710 nm and 790 nm (modification concerned changing wavelength of the first band to 510 nm from 550 and wavelength of the third band to 710 nm from 735 nm).
- A ‘Parrot SEQUOIA’ camera (Parrot Drones SA, Paris, France), with five lenses, capturing at the following wavelengths; 550 nm, 660 nm, 735 nm and 790 nm.
- A Canon S 110 camera, with a single lens, capturing RGB images.
2.3.2. Fruit Samples
2.3.3. Soil Samples
2.3.4. Terrain and Climatic Data
2.4. Machine Learning
3. Results
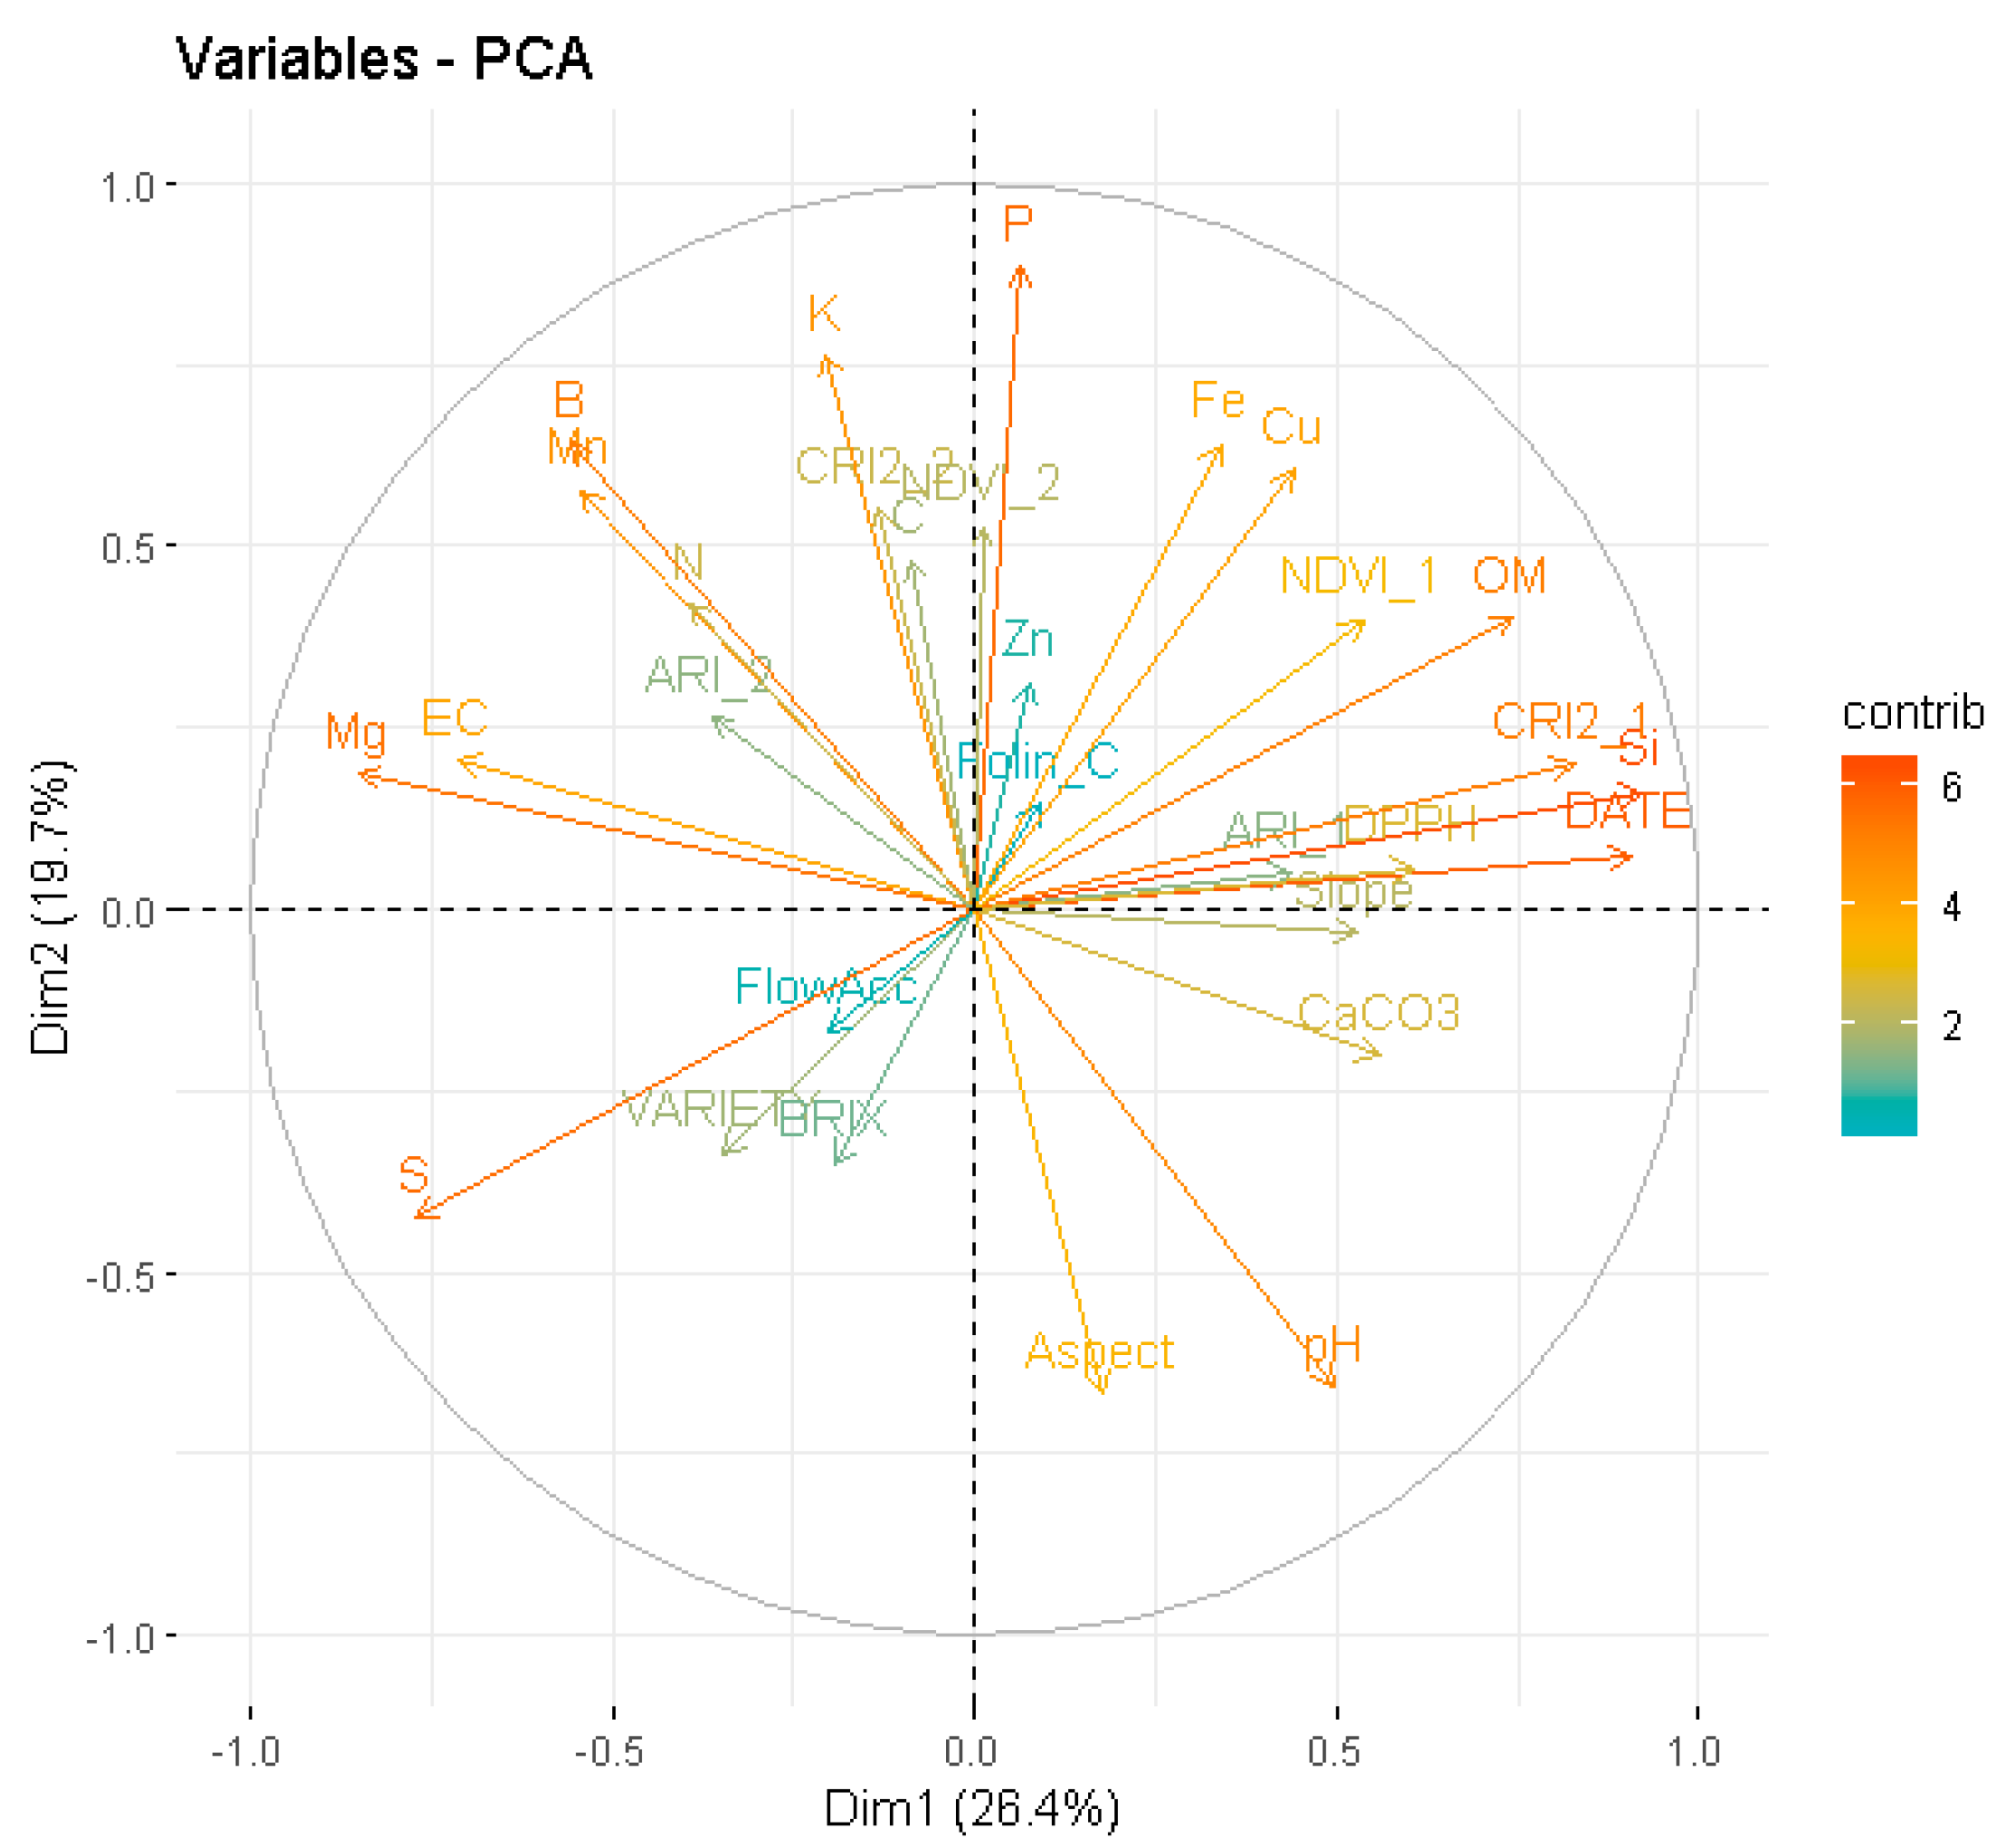
3.1. Geodatabase
3.2. Modelling
4. Discussion
5. Conclusions
Author Contributions
Funding
Acknowledgments
Conflicts of Interest
References
- Kazantzis, K.; Marnasidis, S.S. Updated Guide of Cherry Cropping; Greek Agricultural Organization Demeter: Naousa, Greek, 2013. (In Greek) [Google Scholar]
- Rushforth, K. Trees of Britain and Europe; Collins: New York, NY, USA, 1999; ISBN 0-00-220013-9. [Google Scholar]
- Gonçalves, A.; Bento, C.; Jesus, F.; Alves, G.; Silva, L. Sweet Cherry Phenolic Compounds: Identification, Characterization, and Health Benefits. In Studies in Natural Products Chemistry; Elsevier: Cambridge, MA, USA, 2018; Volume 59, pp. 31–78. [Google Scholar] [CrossRef]
- Commisso, M.; Bianconi, M.; Di Carlo, F.; Poletti, S.; Bulgarini, A.; Munari, F.; Negri, S.; Stocchero, M.; Ceoldo, S.; Avesani, L.; et al. Multi-Approach Metabolomics Analysis and Artificial Simplified Phytocomplexes Reveal Cultivar-Dependent Synergy between Polyphenols and Ascorbic Acid in Fruits of the Sweet Cherry (Prunus avium L.). PLoS ONE 2017, 12, e0180889. [Google Scholar] [CrossRef]
- Serradilla, M.; Hernández, A.; López Corrales, M.; Ruiz-Moyano Seco de Herrera, S.; Córdoba, M.; Martín, A. Composition of the Cherry (Prunus avium L. and Prunus cerasus L.; Rosaceae). In Nutritional Composition of Fruit Cultivars; Academic Press: Cambridge, MA, USA, 2015; pp. 127–147. [Google Scholar] [CrossRef]
- Pandey, K.B.; Rizvi, S.I. Plant Polyphenols as Dietary Antioxidants in Human Health and Disease. Oxid. Med. Cell. Longev. 2009, 2, 270–278. [Google Scholar] [CrossRef] [PubMed]
- Vinson, J.; Liang, X.; Proch, J.; Hontz, B.; Dancel, J.; Sandone, N. Polyphenol Antioxidants in Citrus Juices: In Vitro and in Vivo Studies Relevant to Heart Disease. Adv. Exp. Med. Biol. 2002, 505, 113–122. [Google Scholar] [CrossRef] [PubMed]
- Vinson, J.A.; Su, X.; Zubik, L.; Bose, P. Phenol Antioxidant Quantity and Quality in Foods: Fruits. J. Agric. Food Chem. 2001, 49, 5315–5321. [Google Scholar] [CrossRef]
- Tipoe, G.; Leung, T.-M.; Hung, M.-W.; Fung, M.-L. Green Tea Polyphenols as an Anti-Oxidant and Anti-Inflammatory Agent for Cardiovascular Protection. Cardiovasc. Hematol. Disord. Drug Targets 2007, 7, 135–144. [Google Scholar] [CrossRef] [PubMed]
- Nichols, J.A.; Katiyar, S.K. Skin Photoprotection by Natural Polyphenols: Anti-Inflammatory, Antioxidant and DNA Repair Mechanisms. Arch. Dermatol. Res. 2010, 302, 71–83. [Google Scholar] [CrossRef] [PubMed]
- Zern, T.L.; Fernandez, M.L. Cardioprotective Effects of Dietary Polyphenols. J. Nutr. 2005, 135, 2291–2294. [Google Scholar] [CrossRef] [PubMed]
- Castillo-Pichardo, L.; Martínez-Montemayor, M.M.; Martínez, J.E.; Wall, K.M.; Cubano, L.A.; Dharmawardhane, S. Inhibition of Mammary Tumor Growth and Metastases to Bone and Liver by Dietary Grape Polyphenols. Clin. Exp. Metastasis 2009, 26, 505–516. [Google Scholar] [CrossRef]
- Kelley, D.S.; Adkins, Y.; Laugero, K.D. A Review of the Health Benefits of Cherries. Nutrients 2018, 10, 368. [Google Scholar] [CrossRef]
- Stevenson, D.; Hurst, R. Polyphenolic Phytochemicals - Just Antioxidants or Much More? Cell. Mol. Life Sci. 2007, 64, 2900–2916. [Google Scholar] [CrossRef]
- Aquilano, K.; Baldelli, S.; Rotilio, G.; Ciriolo, M. Role of Nitric Oxide Synthases in Parkinson’s Disease: A Review on the Antioxidant and Anti-Inflammatory Activity of Polyphenols. Neurochem. Res. 2008, 33, 2416–2426. [Google Scholar] [CrossRef] [PubMed]
- Vinson, J.; Zubik, L.; Bose, P.; Samman, N.; Proch, J. Dried Fruits: Excellent in Vitro and in Vivo Antioxidants. J. Am. Coll. Nutr. 2005, 24, 44–50. [Google Scholar] [CrossRef] [PubMed]
- McCune, L.M.; Kubota, C.; Stendell-Hollis, N.R.; Thomson, C.A. Cherries and Health: A Review. Crit. Rev. Food Sci. Nutr. 2010, 51, 1–12. [Google Scholar] [CrossRef] [PubMed]
- Garrido, M.; Espino, J.; Toribio-Delgado, A.; Cubero, J.; Maynar-Mariño, J.; Barriga, C.; Paredes, S.; Rodríguez, A. A Jerte Valley Cherry-Based Product as a Supply of Tryptophan. Int. J. Tryptophan Res. 2012, 5, 9–14. [Google Scholar] [CrossRef]
- Cubero, J.; Toribio, F.; Garrido, M.; Hernández, M.; Maynar, J.; Barriga, C.; Rodríguez, A. Assays of the Amino Acid Tryptophan in Cherries by HPLC-Fluorescence. Food Anal. Methods 2010, 3, 36–39. [Google Scholar] [CrossRef]
- Yoo, K.; Al-Farsi, M.; Lee, H.; Yoon, H.; Lee, C. Antiproliferative Effects of Cherry Juice and Wine in Chinese Hamster Lung Fibroblast Cells and Their Phenolic Constituents and Antioxidant Activities. Food Chem. 2010, 123, 734–740. [Google Scholar] [CrossRef]
- Chockchaisawasdee, S.; Golding, J.B.; Vuong, Q.V.; Papoutsis, K.; Stathopoulos, C.E. Sweet Cherry: Composition, Postharvest Preservation, Processing and Trends for Its Future Use. Trends Food Sci. Technol. 2016, 55, 72–83. [Google Scholar] [CrossRef]
- Desnoues, E.; Gibon, Y.; Baldazzi, V.; Signoret, V.; Génard, M.; Quilot-Turion, B. Profiling Sugar Metabolism during Fruit Development in a Peach Progeny with Different Fructose-to-Glucose Ratios. BMC Plant Biol. 2014, 14, 336. [Google Scholar] [CrossRef]
- De Oliveira, L.A.; da Silva, E.C.; de Carlos, L.A.; Maciel, G.M. Phosphate and Potassium Fertilization on Agronomic and Physico-Chemical Characteristics and Bioactive Compounds of Eggplant. Rev. Bras. Eng. Agrícola Ambient. 2019, 23, 291–296. [Google Scholar] [CrossRef]
- Aschonitis, V.; Karydas, G.C.; Iatrou, M.; Mourelatos, S.; Metaxa, I.; Tziachris, P.; Iatrou, G. An Integrated Approach to Assessing the Soil Quality and Nutritional Status of Large and Long-Term Cultivated Rice Agro-Ecosystems. Agriculture 2019, 9, 80. [Google Scholar] [CrossRef]
- Battude, M.; Al Bitar, A.; Morin, D.; Cros, J.; Huc, M.; Marais Sicre, C.; Le Dantec, V.; Demarez, V. Estimating Maize Biomass and Yield over Large Areas Using High Spatial and Temporal Resolution Sentinel-2 like Remote Sensing Data. Remote Sens. Environ. 2016, 184, 668–681. [Google Scholar] [CrossRef]
- Rahman, M.; Robson, A. A Novel Approach for Sugarcane Yield Prediction Using Landsat Time Series Imagery: A Case Study on Bundaberg Region. Adv. Remote Sens. 2016, 5, 93–102. [Google Scholar] [CrossRef]
- Robson, A.; Rahman, M.M.; Falzon, G.; Verma, N.; Johansen, K.; Robinson, N.; Lakshmanan, P.; Salter, B.; Skocaj, D. Evaluating Remote Sensing Technologies for Improved Yield Forecasting and for the Measurement of Foliar Nitrogen Concentration in Sugarcane. Int. Sugar J. 2016, 38, 89–100. [Google Scholar]
- Ye, X.-J.; Sakai, K.; Asada, S.-I.; Sasao, A. Inter-Relationships between Canopy Features and Fruit Yield in Citrus as Detected by Airborne Multispectral Imagery. Trans. ASABE Am. Soc. Agric. Biol. Eng. 2008, 51, 739–751. [Google Scholar] [CrossRef]
- Ye, X.-J.; Sakai, K.; Manago, M.; Asada, S.; Sasao, A. Prediction of Citrus Yield from Airborne Hyperspectral Imagery. Precis. Agric. 2007, 8, 111–125. [Google Scholar] [CrossRef]
- Iatrou, G.; Mourelatos, S.; Gewehr, S.; Kalaitzopoulou, S.; Iatrou, M.; Zartaloudis, Z. Using Multispectral Imaging to Improve Berry Harvest for Wine Making Grapes. Cienc. Tec. Vitivinic. 2017, 32. [Google Scholar] [CrossRef]
- Lamb, D.W.; Weedon, M.M.; Bramley, R.G.V. Using Remote Sensing to Predict Grape Phenolics and Colour at Harvest in a Cabernet Sauvignon Vineyard: Timing Observations against Vine Phenology and Optimising Image Resolution. Aust. J. Grape Wine Res. 2004, 10, 46–54. [Google Scholar] [CrossRef]
- Giménez, M.J.; Valverde, J.M.; Valero, D.; Guillén, F.; Martínez-Romero, D.; Serrano, M.; Castillo, S. Quality and Antioxidant Properties on Sweet Cherries as Affected by Preharvest Salicylic and Acetylsalicylic Acids Treatments. Food Chem. 2014, 160, 226–232. [Google Scholar] [CrossRef]
- Hassan, N.; Numata, S.; Hosaka, T.; Hashim, M. Remote Detection of Flowering Somei Yoshino (Prunus×yedoensis) in an Urban Park Using IKONOS Imagery: Comparison of Hard and Soft Classifiers. J. Appl. Remote Sens. 2015, 9, 1–10. [Google Scholar] [CrossRef]
- Karydas, C.; Gewehr, S.; Iatrou, M.; Iatrou, G.; Mourelatos, S. Olive Plantation Mapping on a Sub-Tree Scale with Object-Based Image Analysis of Multispectral UAV Data; Operational Potential in Tree Stress Monitoring. J. Imaging 2017, 3, 57. [Google Scholar] [CrossRef]
- Iatrou, G.; Mourelatos, S.; Zartaloudis, Z.; Iatrou, M.; Gewehr, S.; Kalaitzopoulou, S. Remote Sensing for the Management of Verticillium Wilt of Olive. Fresenius Environ. Bull. 2016, 25, 3622–3628. [Google Scholar]
- Heimler, D.; Romani, A.; Ieri, F. Plant Polyphenol Content, Soil Fertilization and Agricultural Management: A Review. Eur. Food Res. Technol. 2017, 243. [Google Scholar] [CrossRef]
- Delgado, R.; Martín, P.; Alamo-Sanza, M.; González, M.R. Changes in the Phenolic Composition of Grape Berries during Ripening in Relation to Vineyard Nitrogen and Potassium Fertilisation Rates. J. Sci. Food Agric. 2004, 84, 623–630. [Google Scholar] [CrossRef]
- Zhou, C.; Zhu, Y.; Luo, Y.-B. Effects of Sulfur Fertilization on the Accumulation of Health-Promoting Phytochemicals in Radish Sprouts. J. Agric. Food Chem. 2013, 61. [Google Scholar] [CrossRef] [PubMed]
- Merzlyak, M.N.; Gitelson, A.A.; Chivkunova, O.B.; Rakitin, V.Y.U. Non-Destructive Optical Detection of Pigment Changes during Leaf Senescence and Fruit Ripening. Physiol. Plant. 1999, 106, 135–141. [Google Scholar] [CrossRef]
- Zartaloudis, Z.; Savvidis, G.; Savvidis, K.; Iatrou, M.; Glavenas, D. Early and Timely Detection of Verticillium Dahliae in Olive Growing Using Remote Sensing. In XVII Simposio Cientifico-Tecnico (Jaen, Spain: Expoliva); Expoliva: Jaen, Spain, 2015. [Google Scholar]
- Peñuelas, J.; Gamon, J.A.; Fredeen, A.L.; Merino, J.; Field, C.B. Reflectance Indices Associated with Physiological Changes in Nitrogen- and Water-Limited Sunflower Leaves. Remote Sens. Environ. 1994, 48, 135–146. [Google Scholar] [CrossRef]
- Middleton, E.M.; Huemmrich, K.F.; Cheng, Y.-B.; Margolis, H. Spectral Bioindicators of Photosynthetic Efficiency and Vegetation Stress. Hyperspectral Remote Sens. Veg. 2011, 265–288. [Google Scholar] [CrossRef]
- Alchanatis, V.; Cohen, Y. Spectral and Spatial Methods of Hyperspectral Image Analysis for Estimation of Biophysical and Biochemical Properties of Agricultural Crops. In Hypespectral Remote Sensing of Vegetation; Thenkabail, P., Lyon, G., Huete, A., Eds.; CRC Press: Boca Raton, FL, USA, 2012; pp. 289–307. [Google Scholar]
- Zarco-Tejada, P.J.; Diaz-Varela, R.; Angileri, V.; Loudjani, P. Tree Height Quantification Using Very High Resolution Imagery Acquired from an Unmanned Aerial Vehicle (UAV) and Automatic 3D Photo-Reconstruction Methods. Eur. J. Agron. 2014, 55, 89–99. [Google Scholar] [CrossRef]
- Gitelson, A.A.; Zur, Y.; Chivkunova, O.B.; Merzlyak, M.N. Assessing Carotenoid Content in Plant Leaves with Reflectance Spectroscopy. Photochem. Photobiol. 2002, 75, 272–281. [Google Scholar] [CrossRef]
- Gitelson, A. Nondestructive Estimation of Foliar Pigment (Chlorophylls, Carotenoids, and Anthocyanins) Contents. In Hyperspectral Remote Sensing of Vegetation; CRC Press: Boca Raton, FL, USA, 2011; pp. 141–166. [Google Scholar] [CrossRef]
- Singleton, V.L.; Orthofer, R.; Lamuela-Raventós, R.M. Analysis of Total Phenols and Other Oxidation Substrates and Antioxidants by Means of Folin-Ciocalteu Reagent. In Oxidants and Antioxidants Part A; Academic Press: Cambridge, MA, USA, 1999; Volume 299, pp. 152–178. [Google Scholar] [CrossRef]
- Veskoukis, A.S.; Kyparos, A.; Nikolaidis, M.G.; Stagos, D.; Aligiannis, N.; Halabalaki, M.; Chronis, K.; Goutzourelas, N.; Skaltsounis, L.; Kouretas, D. The Antioxidant Effects of a Polyphenol-Rich Grape Pomace Extract In Vitro Do Not Correspond In Vivo Using Exercise as an Oxidant Stimulus. Oxid. Med. Cell. Longev. 2012, 2012. [Google Scholar] [CrossRef]
- Cano, A.; Hernández-Ruíz, J.; García-Cánovas, F.; Acosta, M.; Arnao, M.B. An End-Point Method for Estimation of the Total Antioxidant Activity in Plant Material. Phytochem. Anal. 1998, 9, 196–202. [Google Scholar] [CrossRef]
- Mitcham, B.; Cantwell, M.; Kader, A. Methods for Determining Quality of Fresh Commodities. Perish. Handl. Newsl. 1996, 85, 1–5. [Google Scholar]
- Karydas, C.; Gitas, I.; Koutsogiannaki, E.; Lydakis Simantiris, N.; Silleos, G. Evaluation of Spatial Interpolation Techniques for Mapping Agricultural Topsoil Properties in Crete. EARSeL eProceedings 2009, 8, 26–39. [Google Scholar]
- Mckinney, W. Data Structures for Statistical Computing in Python. In Proceedings of the 9th Python in Science Conference, Scipy.org Austin, Austin, TX, USA, 28–30 June 2010. [Google Scholar]
- Stacklies, W.; Redestig, H.; Scholz, M.; Walther, D.; Selbig, J. PcaMethods—A Bioconductor Package Providing PCA Methods for Incomplete Data. Bioinformatics 2007, 23, 1164–1167. [Google Scholar] [CrossRef]
- Husson, F.; Josse, J.; Lê, S. FactoMineR: An R Package for Multivariate Analysis. J. Stat. Softw. 2008, 25. [Google Scholar] [CrossRef]
- Kassambara, A.; Mundt, F. Factoextra: Extract and Visualize the Results of Multivariate Data Analyses. R Package Version 1.0.5. 2017. Available online: https://CRAN.R-project.org/package=factoextra (accessed on 20 January 2020).
- Imdad Ullah, M.; Muhammad, A.; Altaf, S. Mctest: An R Package for Detection of Collinearity among Regressors. R J. 2016, 8, 499–509. [Google Scholar] [CrossRef]
- Van Rossum, G.; Drake, F.L. Python Tutorial. History 2010, 42, 1–122. [Google Scholar] [CrossRef]
- Chen, T.; Guestrin, C. XGBoost: A Scalable Tree Boosting System. In Proceedings of the 22nd ACM SIGKDD International Conference on Knowledge Discovery and Data Mining (KDD ’16), San Francisco, CA, USA, 13–17 August 2016; ACM: New York, NY, USA, 2016; pp. 785–794. [Google Scholar] [CrossRef]
- Brownlee, J. XGBoost with Python, Gradient Boosted Trees with XGBoost and Scikit-Learn; Machine Learning Mastery: Vermont, Australia, 2018. [Google Scholar]
- Breiman, L. Random Forests. Mach. Learn. 2001, 45, 5–32. [Google Scholar] [CrossRef]
- Varoquaux, G.; Buitinck, L.; Louppe, G.; Grisel, O.; Pedregosa, F.; Mueller, A. Scikit-Learn. GetMobile Mob. Comput. Commun. 2015, 19, 29–33. [Google Scholar] [CrossRef]
- Wang, S.; Meng, B. Dynamic Modeling Method Based on Support Vector Machine. Procedia Environ. Sci. 2011, 11, 531–537. [Google Scholar] [CrossRef]
- Kapp, M.; Sabourin, R.; Maupin, P. A Dynamic Model Selection Strategy for Support Vector Machine Classifiers. Appl. Soft Comput. 2012, 12, 2550–2565. [Google Scholar] [CrossRef]
- Yilmaz, I.; Kaynar, O. Multiple Regression, ANN (RBF, MLP) and ANFIS Models for Prediction of Swell Potential of Clayey Soils. Expert Syst. Appl. 2011, 38, 5958–5966. [Google Scholar] [CrossRef]
- Corrado, G.S.; Abadi, M.; Agarwal, A.; Barham, P.; Brevdo, E.; Chen, Z.; Citro, C.; Davis, A.; Dean, J.; Devin, M.; et al. Fixational Instability and Natural Image Statistics: Implications for Early Visual Representations. Netw. Comput. Neural Syst. 2015, 16, 121–138. [Google Scholar] [CrossRef]
- Juhos, K.; Szabó, S.; Ladányi, M. Influence of Soil Properties on Crop Yield: A Multivariate Statistical Approach. Int. Agrophys. 2015, 29, 433–440. [Google Scholar] [CrossRef]
- Liu, X.; Ardo, S.; Bunning, M.; Parry, J.; Zhou, K.; Stushnoff, C.; Stoniker, F.; Yu, L.; Kendall, P. Total Phenolic Content and DPPH Radical Scavenging Activity of Lettuce (Lactuca sativa L.) Grown in Colorado. LWT-Food Sci. Technol. 2007, 40, 552–557. [Google Scholar] [CrossRef]
- Aryal, S.; Baniya, M.K.; Danekhu, K.; Kunwar, P.; Gurung, R.; Koirala, N. Total Phenolic Content, Flavonoid Content and Antioxidant Potential of Wild Vegetables from Western Nepal. Plants 2019, 8, 96. [Google Scholar] [CrossRef]
- Heckman, J.R. Soil Fertility Test Interpretation. Phosphorus, Potassium, Magnesium, and Calcium; Extension, R.N.C., Ed.; Rutgers Cooperative Extension: New Brunswick, NJ, USA, 2006. [Google Scholar]
- Lugasi, A. Natural Antioxidants Chemistry, Health Effects, and Applications. Food/Nahrung 1997, 41, 321. [Google Scholar] [CrossRef]
- Zargoosh, Z.; Ghavam, M.; Bacchetta, G.; Tavili, A. Effects of Ecological Factors on the Antioxidant Potential and Total Phenol Content of Scrophularia Striata Boiss. Sci. Rep. 2019, 9. [Google Scholar] [CrossRef]
- Jaakola, L.; Hohtola, A. Effect of Latitude on Flavonoid Biosynthesis in Plants. Plant. Cell Environ. 2010, 33, 1239–1247. [Google Scholar] [CrossRef]
- Saadatmad, L.; Gorbani, M.; Niakan, M. Investigation of Changes of the Most Important Substances Secondary Efects and Antioxidant Activity of Diferent Organs of Elaeagnus angustifolia L., in Diferent Sites of Khorasan Razavi Province. J. Med. Plants 2013, 1, 58–67. [Google Scholar]
- Khalsi Ahvazi, L.; Heshmati, G.; Zofan, P.; Akbarlo, M. Phenolic, Total Favonoid and Antioxidant Activity of Medicinal Plant in Forage in Diferent Stages of Growth in Four Habitats of the Northeast of Khuzestan Province. J. Ecoph. Med. Plants 2016, 4, 33–46. [Google Scholar]
- Zlatić, N.M.; Stanković, M.S. Variability of Secondary Metabolites of the Species Cichorium intybus L. from Different Habitats. Plants 2017, 6, 38. [Google Scholar] [CrossRef] [PubMed]
- Yang, L.; Wen, K.-S.; Ruan, X.; Zhao, Y.-X.; Wei, F.; Wang, Q. Response of Plant Secondary Metabolites to Environmental Factors. Molecules 2018, 23, 762. [Google Scholar] [CrossRef] [PubMed]
- Peterson, L.A.; Newman, R.C. Influence of Soil PH on the Availability of Added Boron1. Soil Sci. Soc. Am. J. 1976, 40, 280–282. [Google Scholar] [CrossRef]


| Year | Site | Fields | Area (ha) | Fruit Samples | Soil Samples | Images 1 |
|---|---|---|---|---|---|---|
| 2018 | Sevastiana | 4 | 1.54 | 108 | 31 | 5 |
| Karydia | 8 | 1.87 | 123 | 33 | 4 | |
| Total | 12 | 3.41 | 231 | 64 | 9 | |
| 2019 | Sevastiana | 4 | 1.54 | 18 | 10 | 2 |
| Karydia | 8 | 1.87 | 31 | 9 | 3 | |
| Total | 12 | 3.41 | 49 | 19 | 5 |
| Sites | Variety | Date of Sample Collection | ||||||||
|---|---|---|---|---|---|---|---|---|---|---|
| 28/4 | 4/5 | 9/5 | 16/5 | 23/5 | 25/5 | 29/5 | 5/6 | 13/6 | ||
| Sevastiana | Lapins | √ | √ | √ | √ | √ | ||||
| Sabrina | √ | √ | √ | |||||||
| Early Lory | √ | √ | ||||||||
| Canada Giant | √ | √ | √ | √ | √ | |||||
| Sweet Early | √ | √ | √ | |||||||
| Karydia | Ferrovia | √ | √ | √ | √ | |||||
| Hedelfinger | √ | √ | √ | √ | ||||||
| Germersdorfer | √ | √ | √ | √ | ||||||
| Bakirtzeika | √ | √ | √ | √ | ||||||
| Sites | Variety | Date of Sample Collection | |||||
|---|---|---|---|---|---|---|---|
| 10/5 | 21/5 | 9/5 | 30/5 | 7/6 | 21/6 | ||
| Sevastiana | Lapins | √ | √ | √ | |||
| Sabrina | √ | √ | |||||
| Canada Giant | √ | √ | √ | ||||
| Karydia | Ferrovia | √ | √ | √ | |||
| Hedelfinger | √ | √ | √ | ||||
| Germersdorfer | √ | √ | √ | ||||
| Bakirtzeika | √ | √ | √ | ||||
| Variable | Correlation for DPPH | Correlation for FCR | ||
|---|---|---|---|---|
| Pearson’s r | p-Value | Pearson’s r | p-Value | |
| FCR | −0.400 | 0.000 * | ||
| BRIX | 0.116 | 0.080 | −0.493 | 0.000 * |
| VARIETY | −0.162 | 0.014 * | −0.162 | 0.014 * |
| DATE | 0.678 | 0.000 * | −0.081 | 0.223 |
| B | −0.253 | 0.000 * | 0.017 | 0.796 |
| C | 0.028 | 0.676 | 0.024 | 0.721 |
| CaCO3 | 0.214 | 0.001 * | 0.115 | 0.082 |
| Cu | 0.241 | 0.000 * | 0.138 | 0.035 * |
| EC | −0.369 | 0.000 * | −0.124 | 0.060 |
| Fe | 0.221 | 0.000 * | 0.097 | 0.142 |
| K | 0.017 | 0.798 | 0.008 | 0.899 |
| Mg | −0.465 | 0.000 * | −0.058 | 0.381 |
| Mn | −0.311 | 0.000 * | 0.064 | 0.335 |
| N | −0.126 | 0.055 | −0.054 | 0.412 |
| OM | 0.42 | 0.000 * | 0.173 | 0.009 * |
| P | 0.128 | 0.050 * | 0.092 | 0.161 |
| pH | 0.262 | 0.000 * | −0.049 | 0.455 |
| S | −0.503 | 0.000 * | −0.161 | 0.015 * |
| Si | 0.545 | 0.000 * | 0.165 | 0.012 * |
| Zn | 0.069 | 0.29 | 0.058 | 0.384 |
| FlowAcc | −0.125 | 0.058 | −0.032 | 0.632 |
| Aspect | 0.071 | 0.286 | −0.016 | 0.812 |
| Elevation | 0.568 | 0.000 * | 0.042 | 0.027 * |
| Slope | 0.303 | 0.000 * | −0.170 | 0.529 |
| m_temp | −0.210 | 0.000 * | −0.167 | 0.010 * |
| h_temp | −0.293 | 0.000 * | −0.049 | 0.011* |
| l_temp | −0.157 | 0.017 * | −0.133 | 0.462 |
| rain | 0.038 | 0.569 | −0.133 | 0.045 * |
| wind_sp | −0.564 | 0.000 * | −0.042 | 0.523 |
| wind_dir | −0.289 | 0.000 * | −0.164 | 0.013 * |
| ARI_1 | 0.208 | 0.002 * | −0.042 | 0.523 |
| ARI_2 | −0.224 | 0.000 * | −0.124 | 0.060 |
| CRI2_1 | 0.451 | 0.000 * | 0.086 | 0.192 |
| CRI2_2 | −0.045 | 0.495 | 0.065 | 0.329 |
| NDVI_1 | 0.311 | 0.000 * | 0.032 | 0.630 |
| NDVI_2 | 0.039 | 0.551 | 0.085 | 0.198 |
| L_N | −0.325 | 0.020 | −0.195 | 0.169 |
| L_P | −0.007 | 0.961 | −0.234 | 0.098 |
| L_K | −0.189 | 0.184 | 0.416 | 0.002 * |
| L_Ca | 0.043 | 0.765 | 0.234 | 0.098 |
| L_Mg | −0.050 | 0.716 | −0.246 | 0.081 |
| L_B | −0.416 | 0.002 | 0.052 | 0.716 |
| L_Mn | −0.222 | 0.117 | −0.170 | 0.233 |
| L_Zn | −0.212 | 0.117 | −0.356 | 0.010 * |
| L_Fe | −0.211 | 0.137 | −0.438 | 0.001 * |
| L_Cu | 0.074 | 0.605 | −0.407 | 0.003 * |
© 2020 by the authors. Licensee MDPI, Basel, Switzerland. This article is an open access article distributed under the terms and conditions of the Creative Commons Attribution (CC BY) license (http://creativecommons.org/licenses/by/4.0/).
Share and Cite
Karydas, C.; Iatrou, M.; Kouretas, D.; Patouna, A.; Iatrou, G.; Lazos, N.; Gewehr, S.; Tseni, X.; Tekos, F.; Zartaloudis, Z.; et al. Prediction of Antioxidant Activity of Cherry Fruits from UAS Multispectral Imagery Using Machine Learning. Antioxidants 2020, 9, 156. https://doi.org/10.3390/antiox9020156
Karydas C, Iatrou M, Kouretas D, Patouna A, Iatrou G, Lazos N, Gewehr S, Tseni X, Tekos F, Zartaloudis Z, et al. Prediction of Antioxidant Activity of Cherry Fruits from UAS Multispectral Imagery Using Machine Learning. Antioxidants. 2020; 9(2):156. https://doi.org/10.3390/antiox9020156
Chicago/Turabian StyleKarydas, Christos, Miltiadis Iatrou, Dimitrios Kouretas, Anastasia Patouna, George Iatrou, Nikolaos Lazos, Sandra Gewehr, Xanthi Tseni, Fotis Tekos, Zois Zartaloudis, and et al. 2020. "Prediction of Antioxidant Activity of Cherry Fruits from UAS Multispectral Imagery Using Machine Learning" Antioxidants 9, no. 2: 156. https://doi.org/10.3390/antiox9020156
APA StyleKarydas, C., Iatrou, M., Kouretas, D., Patouna, A., Iatrou, G., Lazos, N., Gewehr, S., Tseni, X., Tekos, F., Zartaloudis, Z., Mainos, E., & Mourelatos, S. (2020). Prediction of Antioxidant Activity of Cherry Fruits from UAS Multispectral Imagery Using Machine Learning. Antioxidants, 9(2), 156. https://doi.org/10.3390/antiox9020156