Complex Evaluation of Antioxidant Capacity of Milk Thistle Dietary Supplements

 ,
, 
 ,
,  and
and 
Abstract
:1. Introduction
2. Materials and Methods
2.1. Analytical Standards and Chemicals
2.2. Samples and Standards Preparation
2.3. Quantitative Analysis of Silymarin Flavonoid/Flavonolignans by U-HPLC-HRMS/MS
2.4. Antioxidant Activity Determinations
2.4.1. ABTS Radical Scavenging Assay
2.4.2. Oxygen Radical Absorption Capacity (ORAC)
2.4.3. DPPH Radical Scavenging Assay
2.4.4. Cellular Antioxidant Activity (CAA) Assay
2.5. Targeted Screening of Antioxidants by U-HPLC-HRMS/MS
2.6. Statistical Analysis and Correlation
3. Results
3.1. Silymarin Content and Composition
3.2. Antioxidant Activity of Milk Thistle-Based Dietary Supplements
3.2.1. ABTS Radical Scavenging Activity
3.2.2. Oxygen Radical Absorption Capacity
3.2.3. DPPH Radical Scavenging Activity
3.2.4. Cellular Antioxidant Capacity
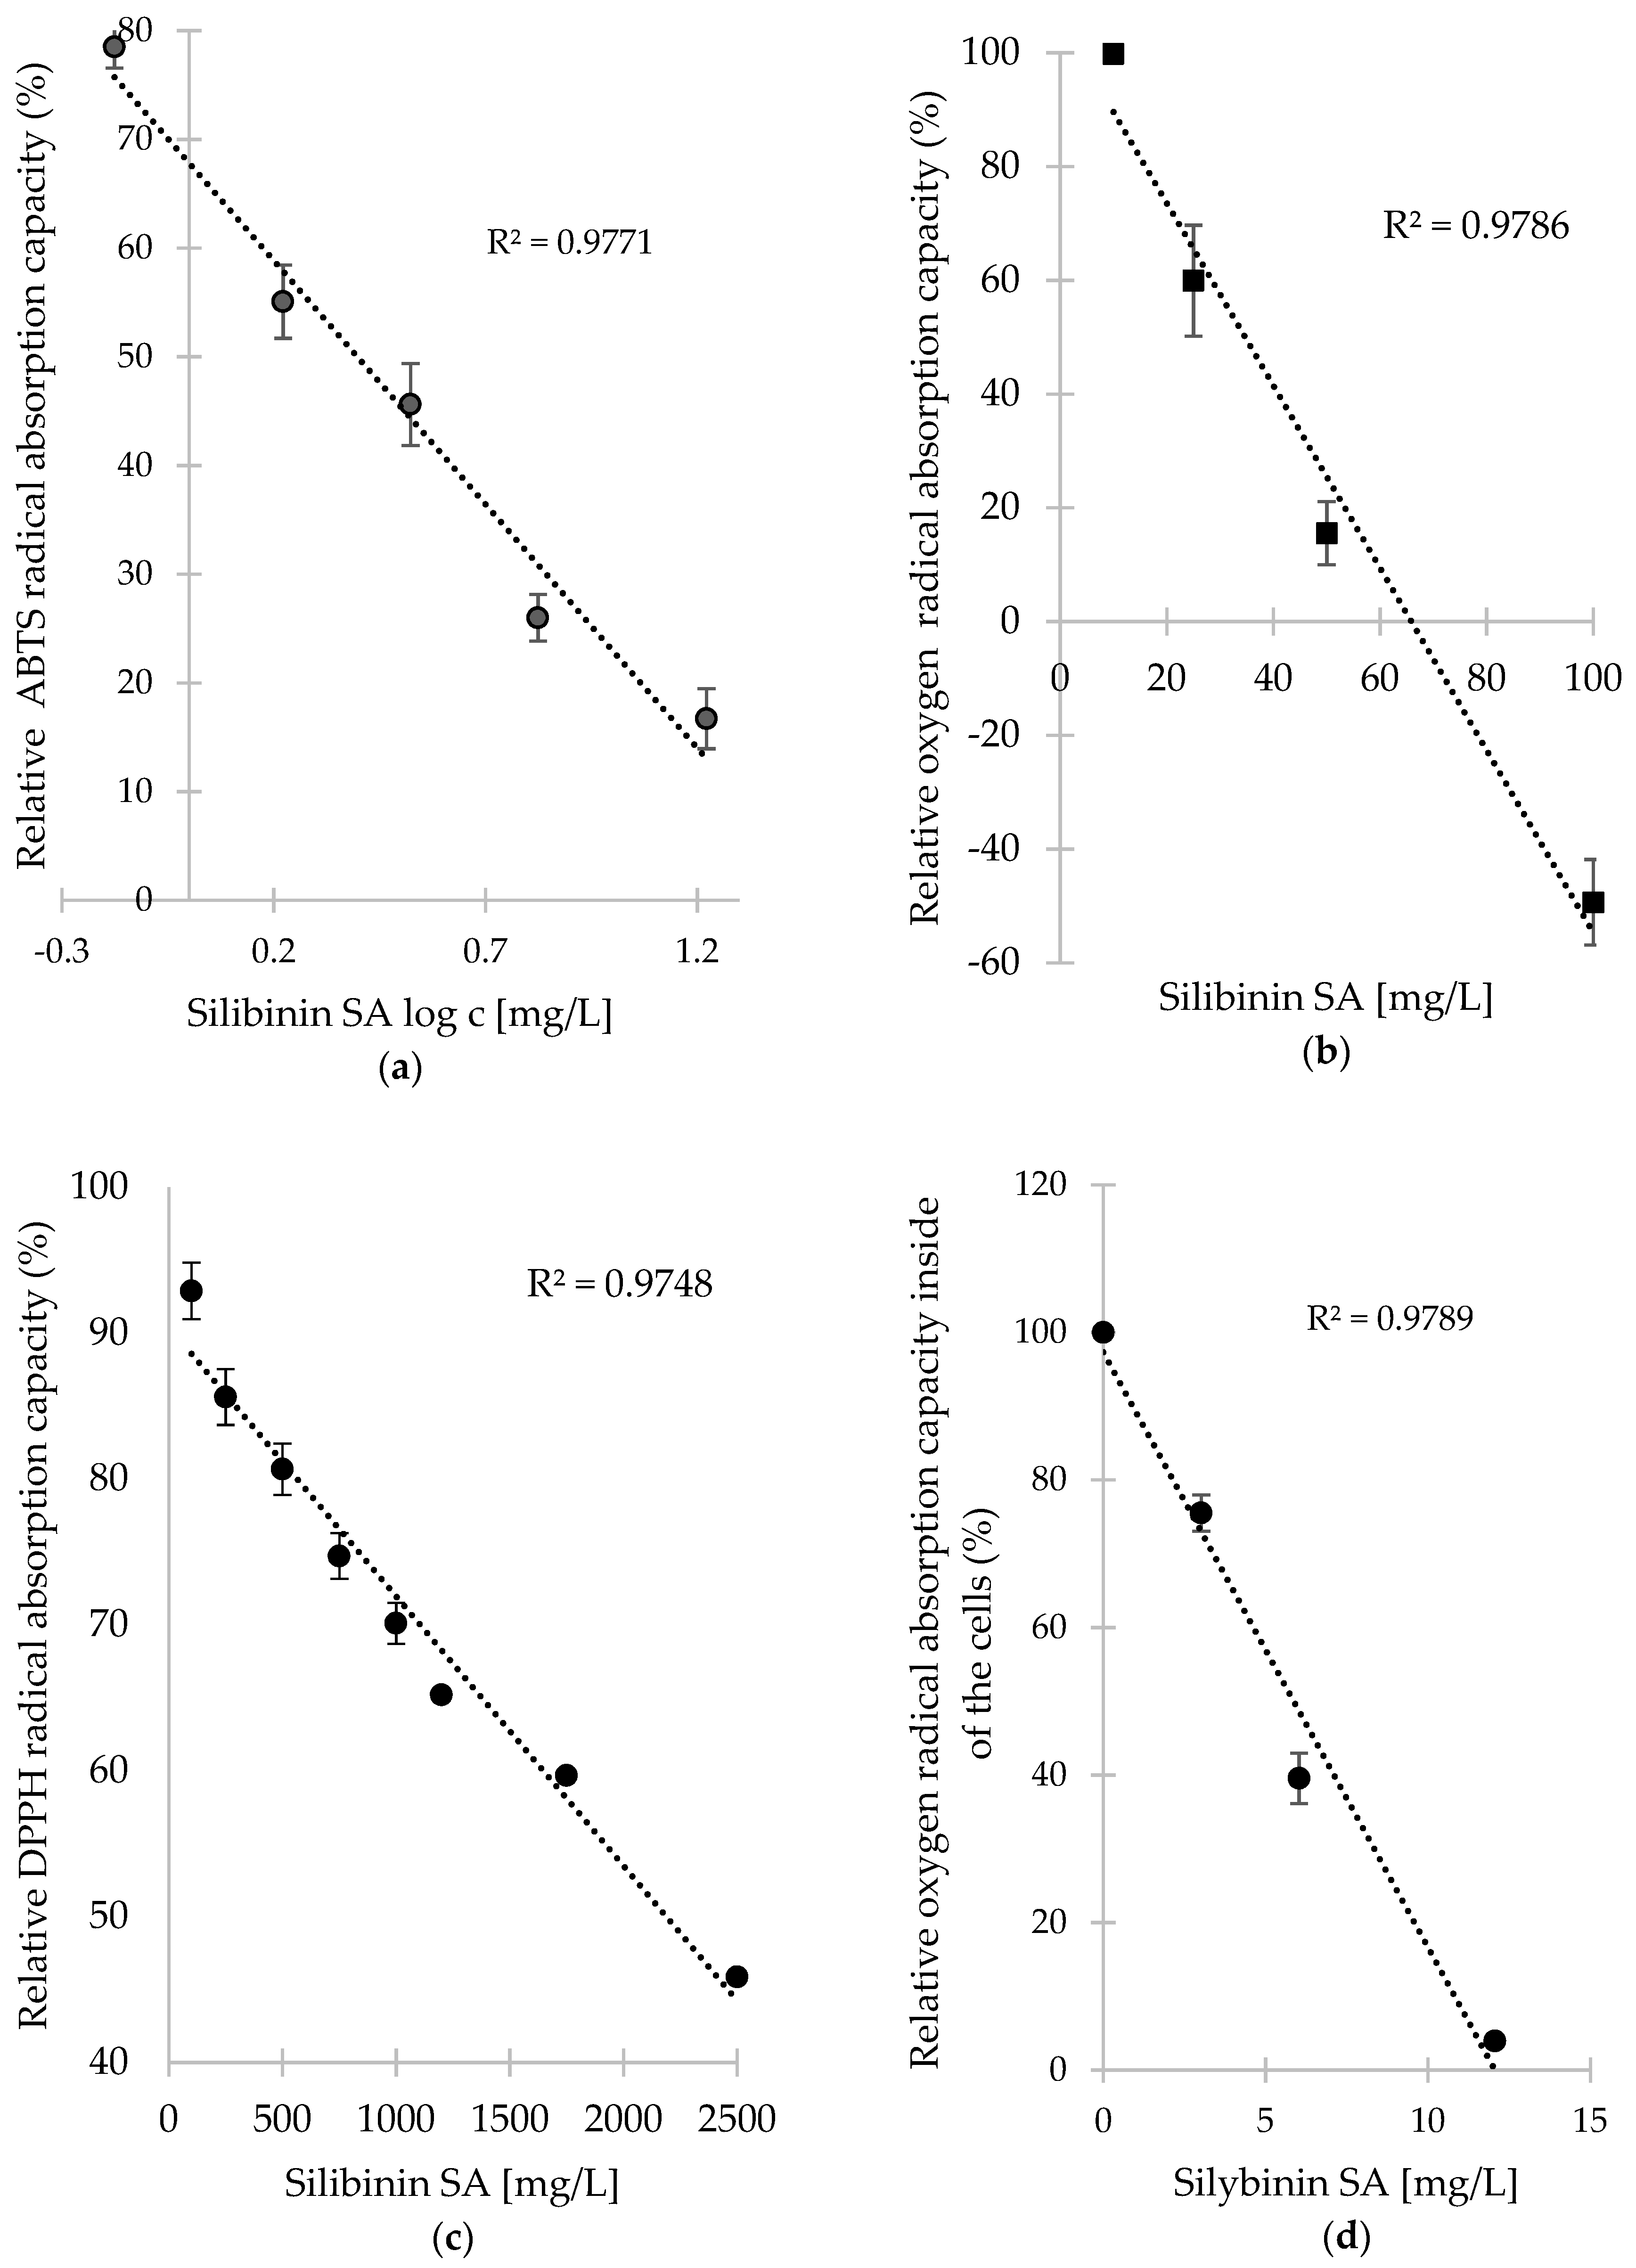
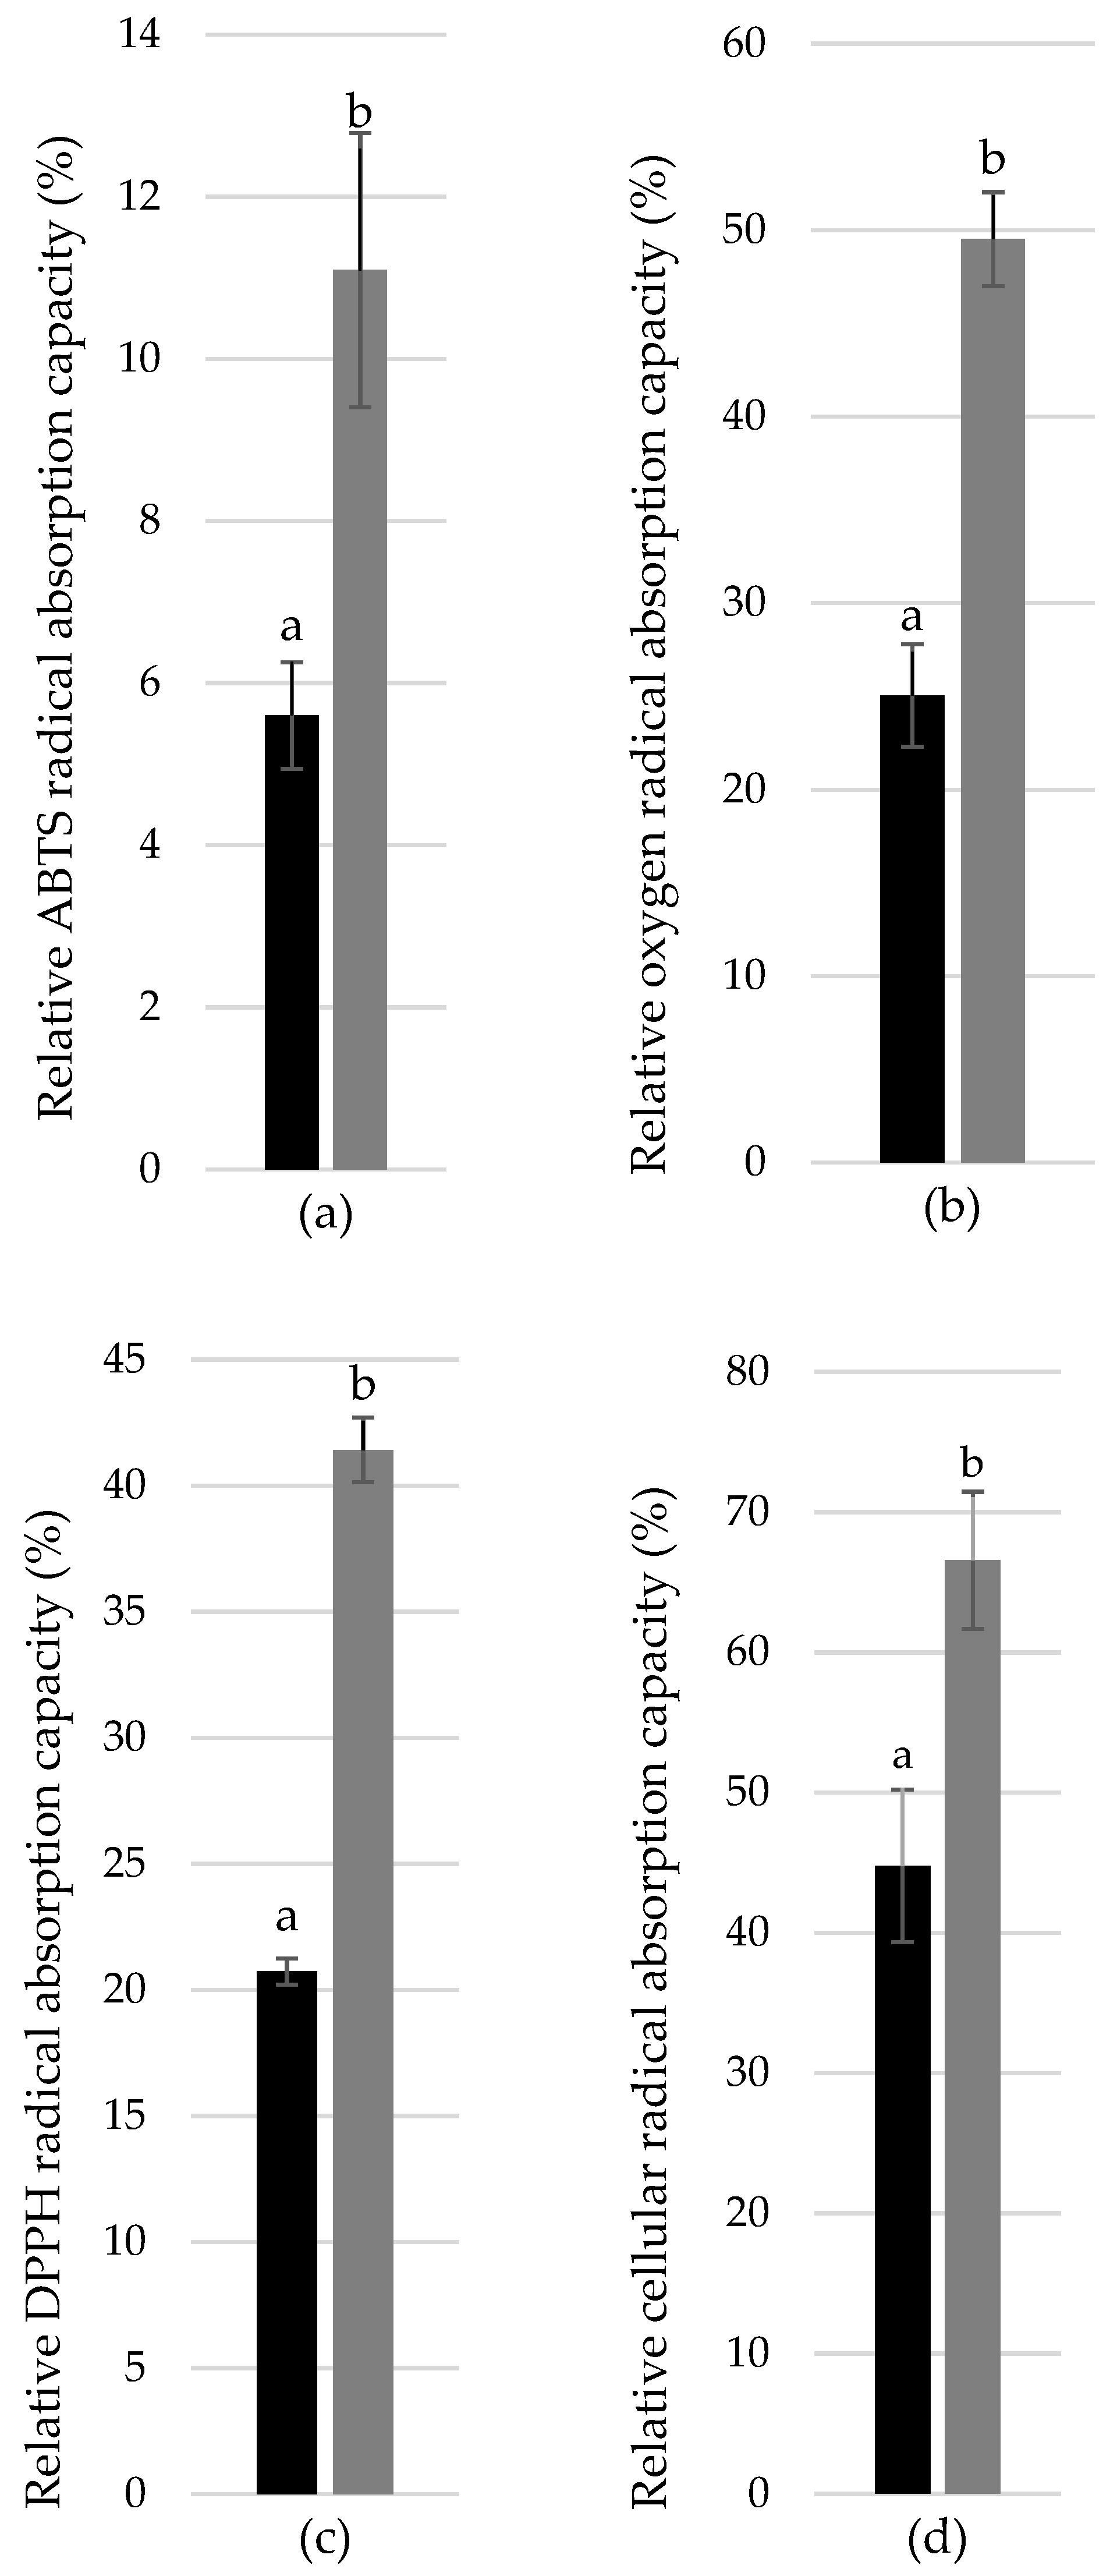
3.3. Comparison of Commercially Available Silymarin SA with Artificially Prepared Mixture of Flavonoid/Flavonolignans Mimicking its Composition
3.4. Characterization of Non-Silymarin Antioxidants Occurring in Milk-Thistle-Based Dietary Supplements
3.5. Correlation of Antioxidant Activity with Particular Antioxidants
4. Discussion
Supplementary Materials
Author Contributions
Funding
Acknowledgments
Conflicts of Interest
Abbreviations
| AAPH | 2,2′-azo-bis-(2-methylpropionamidine) dihydrochloride |
| ABTS | 2,2’-azino-bis-(3-ethylbenzothiazoline-6-sulphonic acid) |
| DPPH | 2,2-diphenyl-1-picrylhydrazyl |
| DCFH-DA | 2′,7′-dichlorofluorescin diacetate |
| CAA | cellular antioxidant activity |
| EMEM | Eagle’s Minimum Essential Medium |
| FBS | fetal bovine serum |
| HepG2 | human hepatocellular adenocarcinoma |
| HRMS/MS | high resolution tandem mass spectrometry |
| ORAC | oxygen radical absorption capacity |
| PBS | phosphate buffered saline |
| PTFE | polytetrafluoroethylene |
| SA | Sigma-Aldrich |
| U-HPLC | ultra-high performance liquid chromatography |
| U-HPLC-HRMS/MS | ultra-high performance liquid chromatography high-resolution tandem mass spectrometry |
References
- Moon, J.-K.; Shibamoto, T. Antioxidant assays for plant and food components. J. Agric. Food Chem. 2009, 57, 1655–1666. [Google Scholar] [CrossRef] [PubMed]
- Alves, C.Q.; David, J.M.; David, J.P.; Bahia, M.V.; Aguiar, R.M. Methods for determination of in vitro antioxidant activity for extracts and organic compounds. J. Food Sci. Tech. Mysore 2010, 33, 2202–2210. [Google Scholar] [CrossRef]
- Kim, N.-C.; Graf, T.N.; Sparacino, C.M.; Wani, M.C.; Wall, M.E. Complete isolation and characterization of silybins and isosilybins from milk thistle (Silybum marianum). Org. Biomol. Chem. 2003, 1, 1684–1689. [Google Scholar] [CrossRef] [PubMed]
- Skottová, N.; Vecera, R.; Urbanek, K.; Vana, P.; Walterová, D.; Cvak, L. Effects of polyphenolic fraction of silymarin on lipoprotein profile in rats fed cholesterol-rich diets. Pharmacol. Res. 2003, 47, 17–26. [Google Scholar] [CrossRef]
- Fried, M.W.; Navarro, V.J.; Afdhal, N.; Belle, S.H.; Wahed, A.S.; Hawke, R.L.; Doo, E.; Meyers, C.M.; Reddy, K.R. Effect of silymarin (milk thistle) on liver disease in patients with chronic hepatitis c unsuccessfully treated with interferon therapy: A randomized controlled trial. JAMA 2012, 308, 274–282. [Google Scholar] [CrossRef] [PubMed]
- Abenavoli, L.M.; Capasso, R.; Milic, N.; Capasso, F. Milk thistle in liver diseases: Past, present, future. Phytother. Res. 2010, 24, 1423–1432. [Google Scholar] [CrossRef] [PubMed]
- Seeff, L.B.; Curto, T.M.; Szabo, G.; Everson, G.T.; Bonkovsky, H.L.; Dienstag, J.L.; Shiffman, M.L.; Lindsay, K.L.; Lok, A.S.; Di Bisceglie, A.M.; et al. Herbal product use by persons enrolled in the hepatitis c antiviral long-term treatment against cirrhosis (halt-c) trial. Hepatology 2008, 47, 605–612. [Google Scholar] [CrossRef] [PubMed]
- Féher, J.; Lengyel, G. Silymarin in the prevention and treatment of liver diseases and primary liver cancer. Curr. Pharm. Biotechnol. 2012, 13, 210–217. [Google Scholar] [CrossRef]
- Zhong, S.; Fan, Y.; Yan, Q.; Fan, X.; Wu, B.; Han, Y.; Zhang, Y.; Chen, Y.; Zhang, H.; Niu, J. The therapeutic effect of silymarin in the treatment of nonalcoholic fatty disease: A meta-analysis (prisma) of randomized control trials. Medicine 2017, 96, e9061. [Google Scholar] [CrossRef]
- Ferenci, P.; Scherzer, T.M.; Kerschner, H.; Rutter, K.; Beinhardt, S.; Hofer, H.; Schöniger–Hekele, M.; Holzmann, H.; Steindl–Munda, P. Silibinin is a potent antiviral agent in patients with chronic hepatitis c not responding to pegylated interferon/ribavirin therapy. Gastroenterology 2008, 135, 1561–1567. [Google Scholar] [CrossRef]
- De Avelar, C.R.; Pereira, E.M.; Costa, P.R.; De Jesus, R.P.; De Oliveira, L.P.M. Effect of silymarin on biochemical indicators in patients with liver disease: Systematic review with meta-analysis. World J. Gastroenterol. 2017, 23, 5004–5017. [Google Scholar] [CrossRef] [PubMed]
- Yang, Z.; Zhuang, L.; Lu, Y.; Xu, Q.; Chen, X. Effects and tolerance of silymarin (milk thistle) in chronic hepatitis C virus infection patients: a meta-analysis of randomized controlled trials. BioMed. Res. Int. 2014, 2014, 9. [Google Scholar] [CrossRef] [PubMed]
- Lee, V.; Goyal, A.; Hsu, C.C.; Jacobson, J.S.; Rodriguez, R.D.; Siegel, A.B. Dietary supplement use among patients with hepatocellular carcinoma. Integr. Cancer Ther. 2015, 14, 35–41. [Google Scholar] [CrossRef] [PubMed]
- Simanek, V.; Křen, V.; Ulrichová, J.; Vicar, J.; Cvak, L. Silymarin: What is in the name…? An appeal for a change of editorial policy. Hepatology 2000, 32, 442–444. [Google Scholar] [CrossRef] [PubMed]
- Fenclova, M.; Novakova, A.; Viktorova, J.; Jonatova, P.; Dzuman, Z.; Ruml, T.; Kren, V.; Hajslova, J.; Vitek, L.; Stranska-Zachariasova, M. Poor chemical and microbiological quality of the commercial milk thistle-based dietary supplements may account for their reported unsatisfactory and non-reproducible clinical outcomes. Sci. Rep. 2019, 9. [Google Scholar] [CrossRef] [PubMed]
- Zheleva-Dimitrova, D.; Nedialkov, P.; Kitanov, G. Radical scavenging and antioxidant activities of methanolic extracts from Hypericum species growing in Bulgaria. Pharmacogn. Mag. 2010, 6, 74–78. [Google Scholar] [CrossRef]
- Zulueta, A.; Esteve, M.J.; Frígola, A. ORAC and TEAC assays comparison to measure the antioxidant capacity of food products. Food Chem. 2009, 114, 310–316. [Google Scholar] [CrossRef]
- Pyrzynska, K.; Pękal, A. Application of free radical diphenylpicrylhydrazyl (DPPH) to estimate the antioxidant capacity of food samples. Anal. Methods 2013, 5, 4288–4295. [Google Scholar] [CrossRef]
- Liu, S.; Huang, H. Assessments of antioxidant effect of black tea extract and its rationals by erythrocyte haemolysis assay, plasma oxidation assay and cellular antioxidant activity (CAA) assay. J. Funct. Foods 2015, 18, 1095–1105. [Google Scholar] [CrossRef]
- Dixit, N.; Baboota, S.; Kohli, K.; Ahmad, S.; Ali, J. Silymarin: A review of pharmacological aspects and bioavailability enhancement approaches. Indian J. Pharmacol. 2007, 39, 172–179. [Google Scholar] [CrossRef]
- Anthony, K.P.; Saleh, M.A. Free radical scavenging and antioxidant activities of silymarin components. Antioxidants 2013, 2, 398–407. [Google Scholar] [CrossRef] [PubMed]
- Barnes, P.M.; Bloom, B.; Nahin, R.L. Complementary and alternative medicine use among adults and children: United States, 2007. Natl. Health Stat. Rep. 2008, 12, 1–23. [Google Scholar]
- Smith, T.; Kawa, K.; Eckl, V.; Morton, C.; Stredney, R. Herbal supplement sales in us increase 7.7% in 2016 consumer preferences shifting toward ingredients with general wellness benefits, driving growth of adaptogens and digestive health products. Am. Bot. C 2017, 115, 56–65. [Google Scholar]
- Chambers, C.S.; Holečková, V.; Petrásková, L.; Biedermann, D.; Valentová, K.; Buchta, M.; Křen, V. The silymarin composition… and why does it matter??? Food Res. Int. 2017, 100, 339–353. [Google Scholar] [CrossRef] [PubMed]
- Anthony, K.; Saleh, M.A. Chemical profiling and antioxidant activity of commercial milk thistle food supplements. J. Chem. Pharm. Res. 2012, 4, 4440–4450. [Google Scholar]
- Fibigr, J.; Šatínský, D.; Solich, P. A new approach to the rapid separation of isomeric compounds in a Silybum marianum extract using UHPLC core-shell column with F5 stationary phase. J. Pharm. Biomed. Anal. 2017, 134, 203–213. [Google Scholar] [CrossRef] [PubMed]
- Filippopoulou, K.; Papaevgeniou, N.; Lefaki, M.; Paraskevopoulou, A.; Biedermann, D.; Křen, V.; Chondrogianni, N. 2,3-Dehydrosilybin A/B as a pro-longevity and anti-aggregation compound. Free. Radic. Biol. Med. 2017, 103, 256–267. [Google Scholar] [CrossRef] [PubMed]
- Šuk, J.; Jašprová, J.; Biedermann, D.; Petrásková, L.; Valentová, K.; Křen, V.; Muchová, L.; Vítek, L. Isolated silymarin flavonoids increase systemic and hepatic bilirubin concentrations and lower lipoperoxidation in mice. Oxid. Med. Cell. Longev. 2019, 2019, 12. [Google Scholar] [CrossRef] [PubMed]
- Biedermann, D.; Buchta, M.; Holečková, V.; Sedlák, D.; Valentová, K.; Cvačka, J.; Bednárová, L.; Křenková, A.; Kuzma, M.; Škuta, C.; et al. Silychristin: Skeletal alterations and biological activities. J. Nat. Prod. 2016, 79, 3086–3092. [Google Scholar] [CrossRef] [PubMed]
- Hammouda, F.M.; Ismail, S.I.; Hassan, N.M.; Zaki, A.K.; Kamel, A.; Rimpler, H. Evaluation of the silymarin content in Silybum marianum (L.) Gaertn. Cultivated under different agricultural conditions. Phytother. Res. 1993, 7, 90–91. [Google Scholar] [CrossRef]
- Lobo, V.; Patil, A.; Phatak, A.; Chandra, N. Free radicals, antioxidants and functional foods: Impact on human health. Pharmacogn. Rev. 2010, 4, 118–126. [Google Scholar] [CrossRef] [PubMed]
- Amorati, R.; Valgimigli, L. Advantages and limitations of common testing methods for antioxidants. Free. Radic. Res. 2015, 49, 633–649. [Google Scholar] [CrossRef] [PubMed]
- Miguel-Chávez, R.S. Phenolic antioxidant capacity: A review of the state of the art. In Phenolic Compounds—Biological Activity; Soto-Hernandez, M., Palma-Tenango, M., Garcia-Mateos, M.R., Eds.; IntechOpen Limited: London, UK, 2017. [Google Scholar]
- Köksal, E.; Gulcin, I.; Beyza, S.; Sarikaya, Ö.; Bursal, E. In vitro antioxidant activity of silymarin. J. Enzym. Inhib. Med. Chem. 2009, 24, 395–405. [Google Scholar] [CrossRef] [PubMed]
- Sharifi, R.; Pasalar, P.; Kamalinejad, M.; Dehpour, A.R.; Tavangar, S.M.; Paknejad, M.; Mehrabani Natanzi, M.; Nourbakhsh, M.; Ahmadi Ashtiani, H.R.; Akbari, M.; et al. The effect of silymarin (Silybum marianum) on human skin fibroblasts in an in vitro wound healing model. Pharm. Biol. 2013, 51, 298–303. [Google Scholar] [CrossRef] [PubMed]
- Thaipong, K.; Boonprakob, U.; Crosby, K.; Cisneros-Zevallos, L.; Byrne, D.H. Comparison of ABTS, DPPH, FRAP, and ORAC assays for estimating antioxidant activity from guava fruit extracts. J. Food Compos. Anal. 2006, 19, 669–675. [Google Scholar] [CrossRef]
- Lucas-Abellán, C.; Mercader-Ros, M.T.; Zafrilla, M.P.; Gabaldon, J.A.; Núñez-Delicado, E. Comparative study of different methods to measure antioxidant activity of resveratrol in the presence of cyclodextrins. Food Chem. Toxicol. 2011, 49, 1255–1260. [Google Scholar] [CrossRef]
- Blasa, M.; Angelino, D.; Gennari, L.; Ninfali, P. The cellular antioxidant activity in red blood cells (CAA-RBC): A new approach to bioavailability and synergy of phytochemicals and botanical extracts. Food Chem. 2011, 125, 685–691. [Google Scholar] [CrossRef]
- Panche, A.N.; Diwan, A.D.; Chandra, S.R. Flavonoids: An overview. J. Nutr. Sci. 2016, 5, e47. [Google Scholar] [CrossRef]


| No. | Milk Thistle Extract | Other Components of Preparation |
|---|---|---|
| 1 | Milk thistle extract (Silybum marianum—seed) 250 mg in 1 capsule—standardized to contain 70% silymarin | Schizandra chinensis extract—100 mg in 1 capsule |
| 2 | Milk thistle extract (Silybum marianum—seed) standardized to contain 80% of silymarin complex, 250 mg of silymarin in 1 capsule | |
| 3 | Milk thistle standardized extract (Silybum marianum—seed), 100 mg of silymarin in 1 capsule (note: % of silymarin not possible to calculate) | |
| 4 | Milk thistle powder (Silybum marianum—freeze-grinded seeds)—390 mg in 1 capsule standardized to contain a minimum of 1.5% silymarin | |
| 5 | Milk thistle extract (Silybum marianum—seed), 150 mg in 1 capsule (note: % of silymarin not possible to calculate) | Cordyceps sinensis extract—50 mg in 1 capsule, Scutellaria baicalensis extract—50mg in one capsule |
| 6 | Silymarin from milk thistle standardized extract (Silybum marianum—seed), 100 mg of silymarin in 2 capsules 1 | |
| 7 | Milk thistle extract (Silybum marianum—seed), 175 mg in 1 capsule—standardized to contain a minimum of 80% Silymarin | |
| 8 | Milk thistle seed extract (Silybum marianum) 140 mg in 1 capsule—silymarin (by UV) 98 mg (i.e., 70% of silymarin) 2 | |
| 9 | Milk thistle seed extract (Silybum marianum) 140 mg in 1 capsule—silymarin (by UV) 98 mg (i.e., 70% of silymarin) 2 | |
| 10 | Milk thistle extract (Silybum marianum—seed) 250 mg in 1 capsule—a 4:1 extract, equivalent to 1000 mg of milk thistle seed (note: % of silymarin not possible to calculate) | |
| 11 | Milk thistle extract (Silybum marianum-seed) 525 mg in 3 capsules—standardized to contain 80% silymarin, 420 mg | |
| 12 | Milk thistle extract (Silybum marianum—seed) 525 mg in 3 capsules—standardized to contain 80% silymarin, 420 mg | |
| 13 | Milk thistle extract (Silybum marianum—seed) 175 mg in 1 capsule—standardized to contain 80% silymarin, 140 mg | |
| 14 | Milk thistle extract (Silybum marianum—seed) 175 mg in 1 capsule—standardized to contain 80% silymarin, 140 mg | |
| 15 | Milk thistle extract (Silybum marianum—seed) 175 mg in 1 capsule—standardized to contain 80% silymarin, 140 mg | |
| 16 | Milk thistle extract (Silybum marianum—seed) 250 mg in 1 capsule—a 4:1 extract, equivalent to 1000 mg whole herb (note: % of silymarin not possible to calculate) | |
| 17 | Milk thistle seed extract 175 mg in 1 capsule—standardized to 80% silymarin (140 mg) | Cnicus benedictus (stem, leaf, flower) 120 mg in 1 capsule |
| 18 | Milk thistle seed extract 175 mg in 1 capsule—standardized to 80% silymarin (140 mg) | Cnicus benedictus (stem, leaf, flower) 120 mg in 1 capsule |
| 19 | Milk thistle seed extract 175 mg in 1 capsule—standardized to 80% silymarin (140 mg) | Cnicus benedictus (stem, leaf, flower) 120 mg in 1 capsule |
| 20 | Milk thistle extract (Silybum marianum—seed) 240 mg in 2 capsules—standardized to contain 80% silymarin, 192 mg | 3 |
| 21 | Milk thistle extract (Silybum marianum—seed) 240 mg in 2 capsules—standardized to contain 80% silymarin, 192 mg | 3 |
| 22 | Milk thistle extract (Silybum marianum—seed) 240 mg in 2 capsules—standardized to contain 80% silymarin, 192 mg | 3 |
| 23 | Milk thistle extract (Silybum marianum—seed) 240 mg in 2 capsules—standardized to contain 80% silymarin, 192 mg | 3 |
| 24 | Milk thistle extract (Silybum marianum—seed) 175 mg in 1 capsule—standardized to contain 80% silymarin, 140 mg | |
| 25 | Milk thistle extract (Silybum marianum—seed) 175 mg in 1 capsule—standardized to contain 80% silymarin, 140 mg | |
| 26 | Milk thistle extract (Silybum marianum—seed) 250 mg in 1 capsule—standardized to contain a minimum of 80% silymarin |
| Compound | Summary Formula | MW [g/mol] | Concentration [mg/g] |
|---|---|---|---|
| Taxifolin | C15H12O7 | 304.25 | 25.3 ± 0.8 |
| Silychristin | C25H22O10 | 482.44 | 110 ± 3.4 |
| Silydianin | C25H22O10 | 32.0 ± 0.9 | |
| Silybin A | C25H22O10 | 113 ± 3.1 | |
| Silybin B | C25H22O10 | 133 ± 3.9 | |
| Isosilybin A | C25H22O10 | 67.4 ± 2.4 | |
| Isosilybin B | C25H22O10 | 26.1 ± 1.1 | |
| 2,3-Dehydrosilybin | C25H20O10 | 480.43 | 5.0 ± 0.3 |
| SILYMARIN (sum of constituents) | 51,182 ± 2764 | ||
| Silymarin content in commercial preparation (%) | 51.2 ± 2.8 | ||
| Formula No. | Taxifolin C15H12O7 | Silychristin C25H22O10 | Silydianin C25H22O10 | Silybin A C25H22O10 | Silybin B C25H22O10 | Isosilybin A C25H22O10 | Isosilybin B C25H22O10 | 2,3-dehydrosilybin C25H20O10 | SILYMARIN—Sum of Constituents |
|---|---|---|---|---|---|---|---|---|---|
| 1 | 6.7 ± 0.2 g,h | 49.7 ± 1.5 m,n | 13.4 ± 0.4 g,h | 89.4 ± 2.4 o | 110.7 ± 3.2 n | 24.0 ± 0.9 k | 8.0 ± 0.3 l | 0.9 ± 0.0 c,d | 302.8 ± 16.4 q |
| 2 | 4.3 ± 0.1 e | 39.8 ± 1.2 i,j | 13.3 ± 0.4 g,h | 17.3 ± 0.5 c,d | 29.0 ± 0.8 d | 18.0 ± 0.6 h,i | 6.6 ± 0.3 h,i,j,k | 1.3 ± 0.1 h,i | 129.5 ± 7.0 e,f,g |
| 3 | 2.0 ± 0.0 c | 12.2 ± 0.1 c | 4.7 ± 0.1 c | 21.6 ± 0.1 d,e | 5.2 ± 0.2 c | 5.5 ± 0.0 b | 0.5 ± 0.0 b | 0.5 ± 0.0b | 69.8 ± 3.8 c,d |
| 4 | 0.5 ± 0.1 a | 3.7 ± 0.1 c | 2.0 ± 0.1 b | 4.4 ± 0.6 a,b | 21.5 ± 0.6 a | 1.4 ± 0.2 a | 1.9 ± 0.1 a | 0.1 ± 0.0 a | 17.8 ± 1.0 a,b |
| 5 | 0.1 ± 0.0 a | 1.0 ± 0.0 a | 0.6 ± 0.0 a | 1.1 ± 0.0 a | 1.9 ± 0.1 a | 0.5 ± 0.0 a | 0.2 ± 0.0 a | 0.1 ± 0.0a | 5.4 ± 0.3 a |
| 6 | 1.2 ± 0.0 b | 9.2 ± 0.3 c | 4.3 ± 0.1 c | 13.4 ± 0.4 c | 13.8 ± 0.4 b | 4.3 ± 0.2 b | 1.7 ± 0.1 b | 0.4 ± 0.0 b | 48.5 ± 2.6 b,c |
| 7 | 3.0 ± 0.1 d | 17.5 ± 0.5 d | 8.2 ± 0.2 e | 28.1 ± 0.8 f,g | 32.0 ± 0.9 d,e | 8.2 ± 0.3 c | 3.0 ± 0.1 c | 0.9 ± 0.0 c,d | 100.9 ± 5.4 d,e |
| 8 | 5.3 ± 0.2 f | 35.9 ± 1.1 g,h | 14.0 ± 0.4 h | 59.1 ± 1.6 k | 73.2 ± 2.1 j | 17.7 ± 0.6 h,i | 8.0 ± 0.3 l | 2.4 ± 0.1 l | 215.5 ± 11.6 m,n,o |
| 9 | 7.0 ± 0.2 h | 40.6 ± 1.3 i,j,k | 12.6 ± 0.4 g | 70.7 ± 1.9 m,n | 84.6 ± 2.5 l,m | 19.1 ± 0.7 i,j | 6.9 ± 0.3 i,j,k | 1.2 ± 0.1 h,i | 242.7 ± 13.1 o,p |
| 10 | 0.4 ± 0.0 a | 4.1 ± 0.1 a,b | 0.6 ± 0.0 a | 6.6 ± 0.2 b | 6.0 ± 0.2 a | 1.8 ± 0.1 a | 0.8 ± 0.0 a | 0.5 ± 0.0 b | 20.8 ± 1.1 a,b |
| 11 | 5.1 ± 0.0 f | 31.8 ± 1.0 e,f | 9.7 ± 0.3 f | 46.6 ± 1.3 i | 58.4 ± 1.7 h,i | 13.9 ± 0.5 d,e,f | 4.9 ± 0.2 d,e | 1.0 ± 0.1 d,e,f | 171.4 ± 9.4 h,i,j,k |
| 12 | 7.9 ± 0.3 i,j | 38.2 ± 1.2 g,h,i | 6.2 ± 0.2 d | 27.8 ± 0.8 f,g | 38.6 ± 1.1 f | 15.5 ± 0.6 e,g | 4.8 ± 0.2 d | 1.9 ± 0.1 k | 140.8 ± 7.6 f,g,h |
| 13 | 4.8 ± 0.2 e,f | 31.5 ± 1.0 e,f | 8.8 ± 0.2 e,f | 18.8 ± 0.5 d | 27.2 ± 0.8 d | 13.4 ± 0.5 d | 5.3 ± 0.2 d,e,f | 1.2 ± 0.1 g,h,i | 111.1 ± 6.0 e,f |
| 14 | 9.0 ± 0.3 k | 38.1 ± 1.2 g,h,i | 13.3 ± 0.4 g,h | 25.1 ± 0.7 e,f | 37.2 ± 1.1 e,f | 16.2 ± 0.6 g,h | 6.0 ± 0.3 f,g,h | 1.3 ± 0.1 h,i | 146.3 ± 7.9 g,h,i |
| 15 | 8.6 ± 0.3 j,k | 38.0 ± 1.2 g,h,i | 12.3 ± 0.3 g | 42.2 ± 1.1 h | 54.0 ± 1.6 g,h | 15.5 ± 0.6 e,f,g | 5.7 ± 0.2 e,f,g | 1.2 ± 0.1 g,h,i | 177.5 ± 9.6 i,j,k |
| 16 | 0.6 ± 0.0 a,b | 4.9 ± 0.2 b | 1.7 ± 0.0 a,b | 6.6 ± 0.2 b | 6.8 ± 0.2 a | 2.3 ± 0.1 a | 0.9 ± 0.0 a | 0.4 ± 0.0 b | 24.2 ± 1.3 a,b |
| 17 | 11.0 ± 0.4 m,n | 66.8 ± 2.1 p | 34.8 ± 1.0 l | 105.5 ± 2.8 p | 130.2 ± 3.8 o | 30.9 ± 1.1 m | 11.7 ± 0.5 o | 1.6 ± 0.1 j | 392.5 ± 21.2 s |
| 18 | 12.9 ± 0.4 p | 58.8 ± 1.8 o | 27.4 ± 0.8 k | 92.4 ± 2.5 o | 111.3 ± 3.2 n | 27.7 ± 1.0 l | 10.3 ± 0.4 n | 1.5 ± 0.1 j | 342.4 ± 18.5 r |
| 19 | 9.9 ± 0.3 l | 60.3 ± 1.9 o | 36.2 ± 1.0 m | 93.2 ± 2.5 o | 114.1 ± 3.3 n | 30.1 ± 1.1 m | 7.1 ± 0.3 i,j,k | 1.9 ± 0.1 k | 352.7 ± 19.0 r |
| 20 | 6.1 ± 0.2 g | 44.2 ± 1.4 k,l | 21.6 ± 0.6 j | 41.3 ± 1.1 h | 60.0 ± 1.7 i | 20.1 ± 0.7 j | 8.9 ± 0.4 m | 1.4 ± 0.1 i | 203.6 ± 11.0 l,m,n |
| 21 | 10.7 ± 0.3 m | 42.8 ± 1.3 j,k | 12.1 ± 0.3 g | 69.0 ± 1.9 m | 81.8 ± 2.4 k,l | 18.7 ± 0.7 ij | 6.3 ± 0.3 g,h,i | 0.8 ± 0.0 c,d | 242.3 ± 13.1 o,p |
| 22 | 11.6 ± 0.4 n,o | 46.6 ± 1.4 l,m | 13.1 ± 0.4 g,h | 74.0 ± 2.0 n | 87.8 ± 2.5 m | 20.0 ± 0.7 j | 7.3 ± 0.3 k,l | 0.9 ± 0.0 c,d,e | 261.3 ± 14.1 p |
| 23 | 12.2 ± 0.4 o,p | 51.6 ± 1.6 n | 15.9 ± 0.4 i | 31.4 ± 0.8 g | 52.9 ± 1.5 g,h | 20.4 ± 0.7 j | 7.2 ± 0.3 j,k | 1.6 ± 0.1 j | 193.2 ± 10.4 k,l,m |
| 24 | 8.8 ± 0.3 k | 34.5 ± 1.1 f,g | 9.9 ± 0.3 f | 52.0 ± 1.4 j | 62.9 ± 1.8 i | 13.6 ± 0.5 d,f | 5.1 ± 0.2 d,e | 0.8 ± 0.0 c | 187.5 ± 10.1 k,l,m |
| 25 | 7.7 ± 0.2 i | 30.5 ± 0.9 e | 12.1 ± 0.3 g | 41.5 ± 1.1 h | 50.9 ± 1.5 g | 12.8 ± 0.5 d | 5.0 ± 0.2 d,e | 0.9 ± 0.0 c,d | 161.4 ± 8.7 g,h,i,j |
| 26 | 9.3 ± 0.3 k,l | 39.6 ± 1.2 h,i,j | 15.3 ± 0.4 i | 64.2 ± 1.7 l | 76.4 ± 2.2 j,k | 17.5 ± 0.6 h,i | 6.4 ± 0.3 g,h,i,j | 1.1 ± 0.1 e,f,g | 230.0 ± 12.4 n,o,p |
| Sample No. | EC50 [mg/L] | |||
|---|---|---|---|---|
| ABTS | ORAC | DPPH | CAA | |
| 1 | 8.5 ± 0.5 a | 43.3 ± 3.2 f,g | 120.8 ± 6.9 c,d | >25.0 |
| 2 | 17.4 ± 2.2 b | 30.7 ± 3.0 e | 73.0 ± 2.8 b | >25.0 |
| 3 | 8.7 ± 0.9 a | 90.8 ± 6.4 i | 9.7 ± 2.3 a | 11.3 ± 0.2 a |
| 4 | >66.7 | >200.0 | >166.7 | >25.0 |
| 5 | >66.7 | >200.0 | >166.7 | >25.0 |
| 6 | >66.7 | 122.8 ± 14.7 j | >166.7 | >25.0 |
| 7 | 38.7 ± 2.3 h | 56.9 ± 1.3 h | >166.7 | >25.0 |
| 8 | 18.7 ± 2.0 b | 53.8 ± 0.7 g,h | 108.3 ± 7.0 c | 21.2 ± 3.6 b,c,d,e,f |
| 9 | 20.4 ± 1.2 b,d | 30.5 ± 3.3 e | 58.7 ± 15.2 b | 24.3 ± 4.0 d,e,f |
| 10 | >66.7 | >200.0 | >166.7 | >25.0 |
| 11 | 25.7 ± 1.8 d,e,f | 31.0 ± 3.3 e | >166.7 | 21.8 ± 2.9 c,d,e,f |
| 12 | 27.6 ± 3.0 e,f,g | 26.9 ± 0.7 c,d,e | 130.4 ± 9.2 c,d | 27.3 ± 2.6 f |
| 13 | 32.3 ± 2.8 g | 33.8 ± 5.1 e,f | > 166.7 | >25.0 |
| 14 | 27.9 ± 3.1 e,f,g | 28.8 ± 0.1 d,e | 128.3 ± 15.0 c,d | 13.5 ± 1.7 a,b,c |
| 15 | 48.4 ± 0.7 i | 53.5 ± 0.7 g,h | > 166.7 | 21.7 ± 3.5 c,d,e,f |
| 16 | >66.7 | >200.0 | >166.7 | >25.0 |
| 17 | 12.0 ± 0.3 a,c | 13.9 ± 0.5 a,b | 51.0 ± 1.4 b | 12.5 ± 0.7 a |
| 18 | 9.9 ± 0.3 a | 16.7 ± 2.4 a,b,c,d | 106.9 ± 3.0 c | 16.9 ± 2.3 a,b,c,d |
| 19 | 10.3 ± 0.7 a | 16.2 ± 2.0 a,b,c | 131.4 ± 10.5 c,d | 17.9 ± 0.7 a,b,c,d,e |
| 20 | 20.9 ± 2.8 b,d | 12.6 ± 1.2 a | 143.4 ± 3.0 d | 16.7 ± 0.8 a,b,c,d |
| 21 | 17.5 ± 1.9 b,c | 24.8 ± 0.6 b,c,d,e | 128.4 ± 2.9 c,d | 18.5 ± 3.0 a,b,c,d,e |
| 22 | 18.0 ± 1.8 b | 27.4 ± 1.0 c,d,e | 125.4 ± 9.8 c,d | 26.4 ± 2.1 e,f |
| 23 | 20.7 ± 1.1 b,d | 28.7 ± 0.1 d,e | 145.9 ± 9.0 d | 18.4 ± 0.8 a,b,c,d,e |
| 24 | 23.5 ± 1.8 b,d,e | 59.6 ± 4.5 h | 206.5 ± 1.1 f | 22.8 ± 3.6 d,e,f |
| 25 | 31.2 ± 2.4 f,g | 44.2 ± 3.6 f,g | 116.0 ± 7.8 c,d | >25.0 |
| 26 | 17.7 ± 1.5 b,c | 25.8 ± 0.6 c,d,e | 181.5 ± 2.7 e | 12.9 ± 1.4 a,b |
| Silymarin SA | 12.8 ± 2.6 | 11.0 ± 0.1 | >166.7 | 18.5 ± 3.7 |
| Silymarin mimicking mixture of flavonoid/flavonolignans | 1.7 ± 0.3 | 23.4 ± 2.7 | >166.7 | >25.0 |
| Quercetin | >1.7 | 5.6 ± 0.1 | 4.5 ± 0.1 | 1.0 ± 0.0 |
| Trolox | >6.7 | >200.0 | 5.1 ± 0.1 | 0.7 ± 0.1 |
| Silibinin SA | 9.1 ± 0.9 | 19.2 ± 2.2 | >166.7 | >25.0 |
| Assay | Silymarin Constituents | ||||||||
|---|---|---|---|---|---|---|---|---|---|
| taxifolin | silychristin | silydianin | silybin A | silybin B | isosilybin A | isosilybin B | 2,3-dehydrosilybin | Sum of Silymarin Constituents | |
| ABTS | 0.159 | 0.402 | 0.453 a | 0.530 a | 0.527 a | 0.493 a | 0.417 | 0.087 | 0.520 a |
| ORAC | 0.685 a | 0.813 a | 0.617 a | 0.497 a | 0.571 a | 0.774 a | 0.745 a | 0.553a | 0.652 a |
| DPPH | 0.472 a | 0.219 | 0.014 | 0.092 | 0.110 | 0.127 | 0.093 | 0.160 | 0.133 |
| CAA | 0.055 | 0.054 | 0.366 | 0.058 | 0.062 | 0.111 | 0.144 | 0.139 | 0.098 |
© 2019 by the authors. Licensee MDPI, Basel, Switzerland. This article is an open access article distributed under the terms and conditions of the Creative Commons Attribution (CC BY) license (http://creativecommons.org/licenses/by/4.0/).
Share and Cite
Viktorova, J.; Stranska-Zachariasova, M.; Fenclova, M.; Vitek, L.; Hajslova, J.; Kren, V.; Ruml, T. Complex Evaluation of Antioxidant Capacity of Milk Thistle Dietary Supplements. Antioxidants 2019, 8, 317. https://doi.org/10.3390/antiox8080317
Viktorova J, Stranska-Zachariasova M, Fenclova M, Vitek L, Hajslova J, Kren V, Ruml T. Complex Evaluation of Antioxidant Capacity of Milk Thistle Dietary Supplements. Antioxidants. 2019; 8(8):317. https://doi.org/10.3390/antiox8080317
Chicago/Turabian StyleViktorova, Jitka, Milena Stranska-Zachariasova, Marie Fenclova, Libor Vitek, Jana Hajslova, Vladimir Kren, and Tomas Ruml. 2019. "Complex Evaluation of Antioxidant Capacity of Milk Thistle Dietary Supplements" Antioxidants 8, no. 8: 317. https://doi.org/10.3390/antiox8080317
APA StyleViktorova, J., Stranska-Zachariasova, M., Fenclova, M., Vitek, L., Hajslova, J., Kren, V., & Ruml, T. (2019). Complex Evaluation of Antioxidant Capacity of Milk Thistle Dietary Supplements. Antioxidants, 8(8), 317. https://doi.org/10.3390/antiox8080317