Chronic Oxidative Stress Promotes Molecular Changes Associated with Epithelial Mesenchymal Transition, NRF2, and Breast Cancer Stem Cell Phenotype

 ,
,  ,
,  ,
,
Abstract
1. Introduction
2. Materials and Methods
2.1. Cell Line and Medium
2.2. Collagen Coating
2.3. Cell Seeding and HNE Treatment
2.4. Cell Viability—MTT Assay
2.5. Cell Proliferation—3H-thymidine Incorporation Assay (3HT)
2.6. Flow Cytometry Analyses of Putative Breast Cancer Stem Cell Phenotypes
2.7. Immunocytochemical Analyses of Hormone Receptors
2.8. Real-Time Quantitative PCR (qRT-PCR) Analyses of EMT Markers
2.9. ROS and Antioxidant Measurements
2.10. Western Blot
2.11. Statistical Analysis
3. Results
3.1. Effects of Single and Multiple Treatments of HNE on SUM159 Cells Growth
3.2. Flow Cytometry Analyses for Putative Breast Cancer Stem Cell Phenotypes
3.3. Expression of Hormone Receptors
3.4. Antioxidants and ROS
3.5. EMT Markers
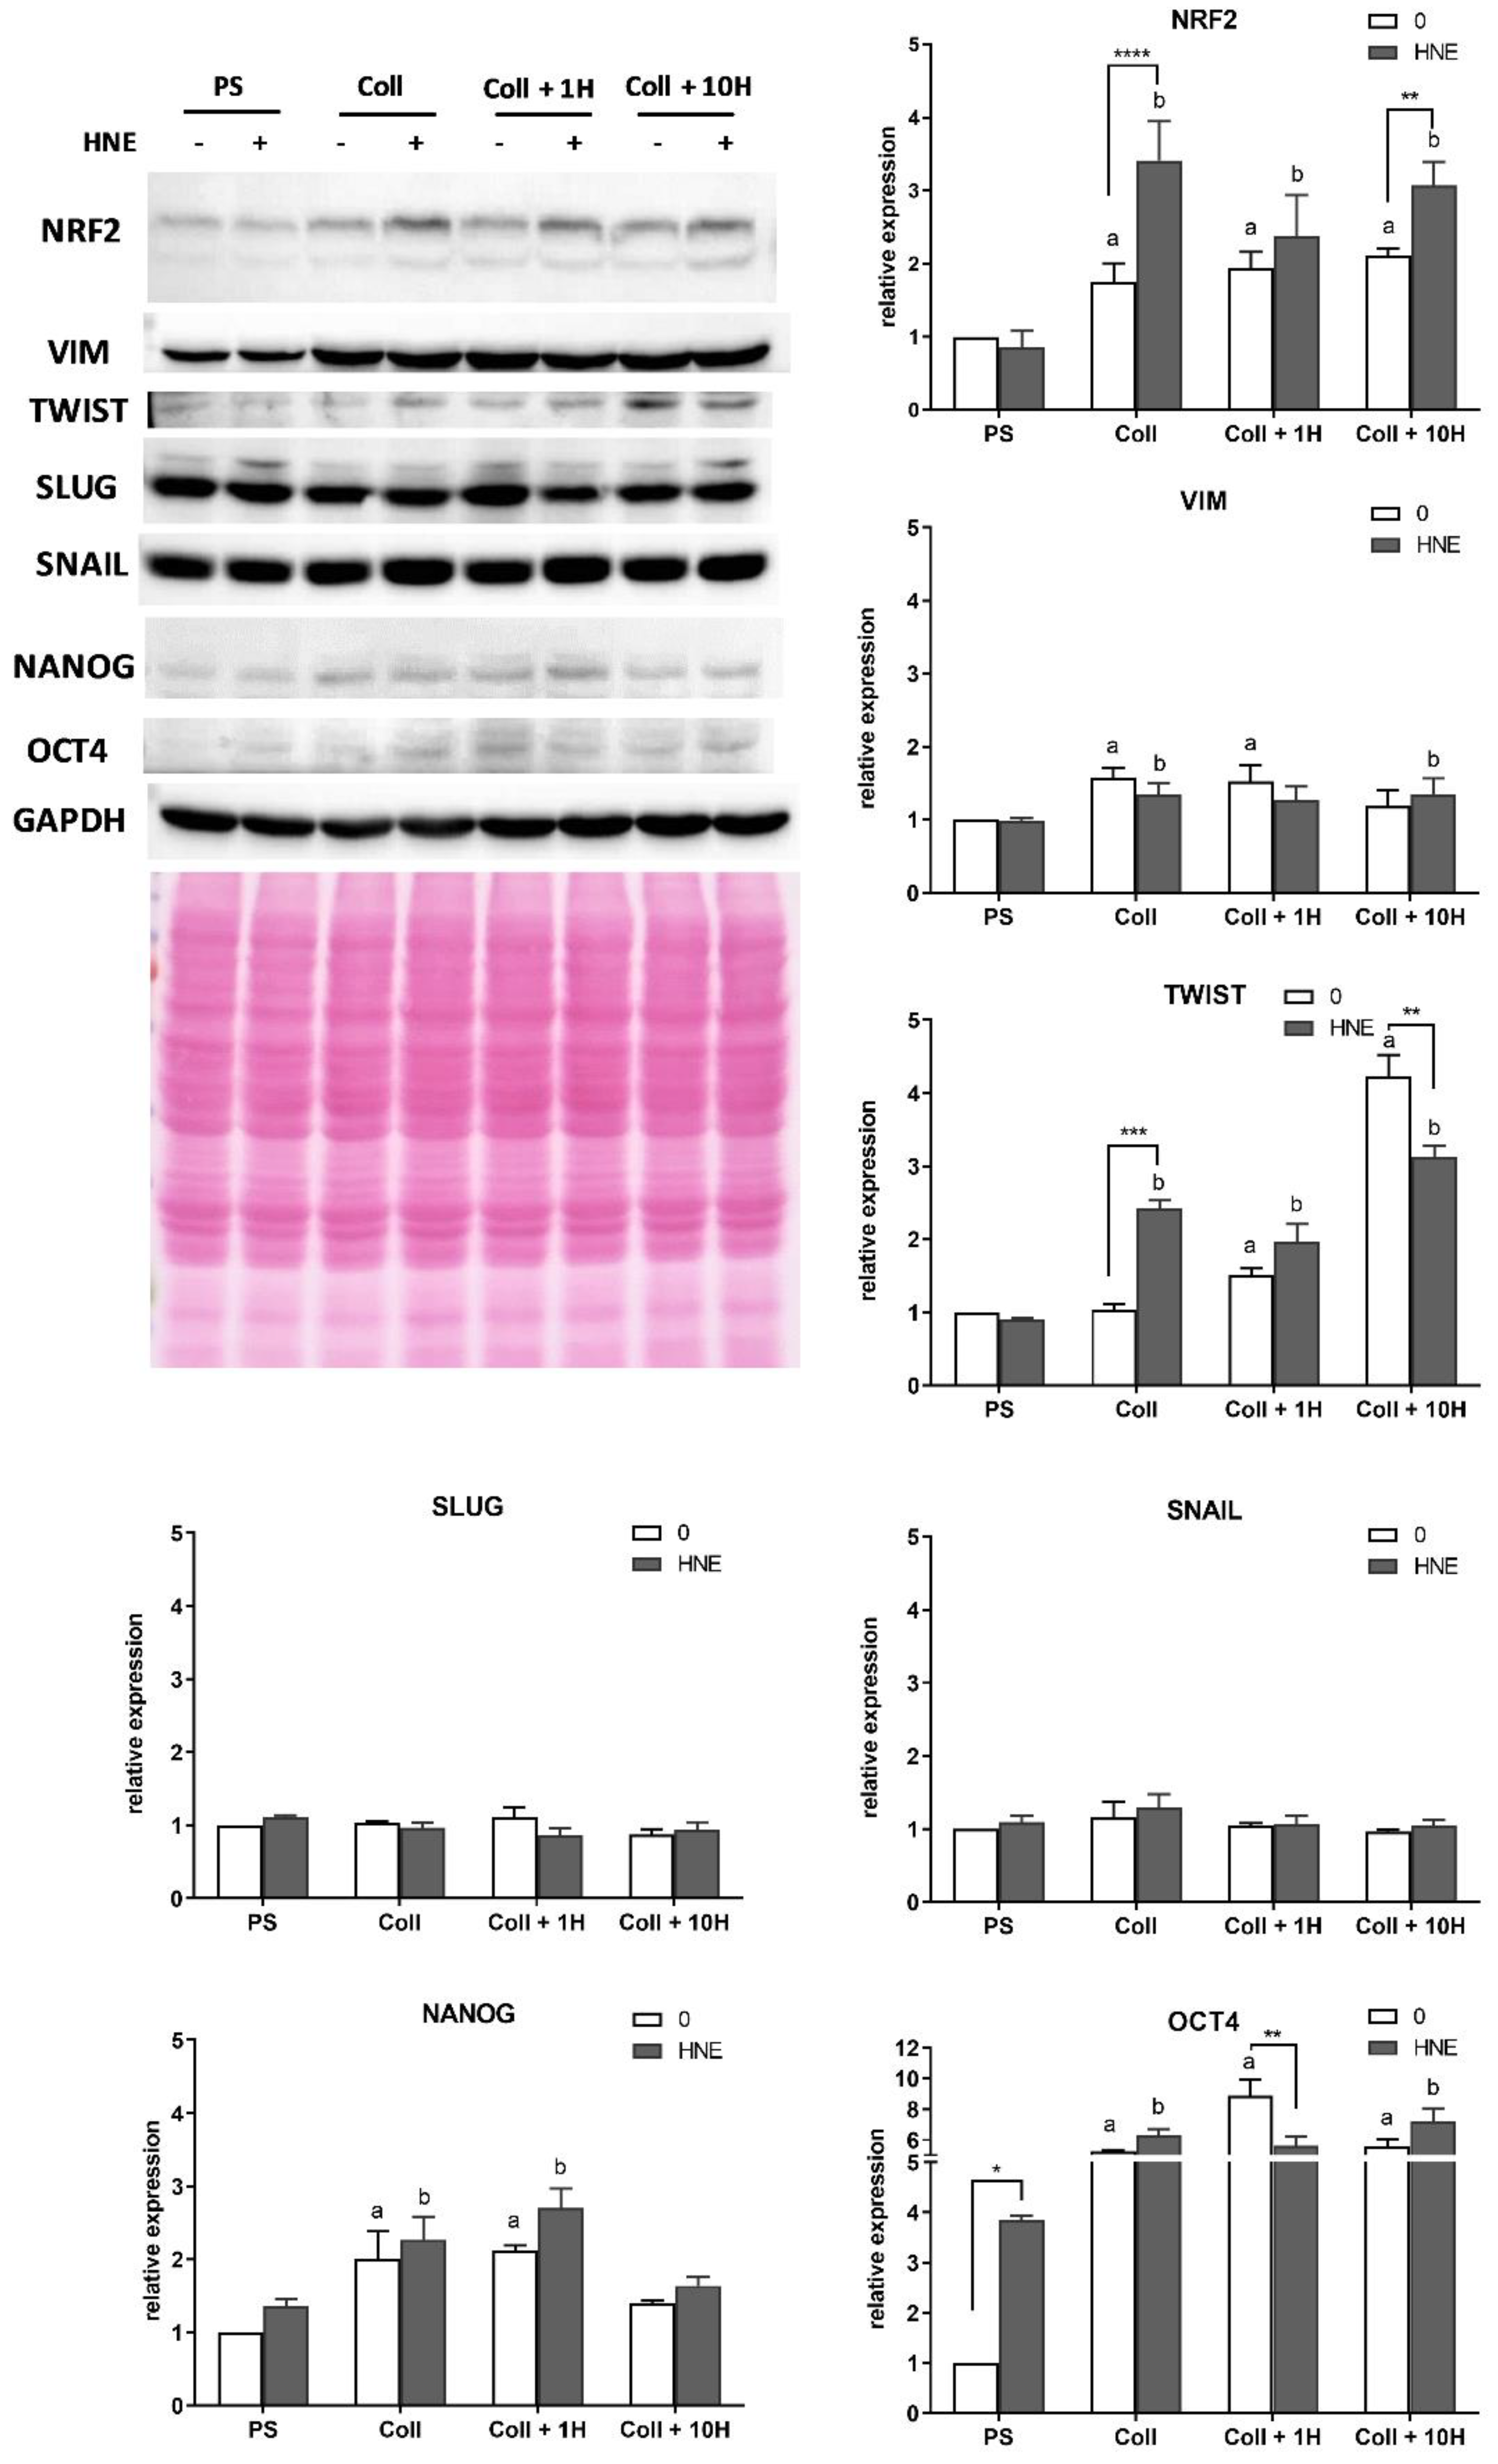
3.6. Western Blot
4. Discussion
5. Conclusions
Supplementary Materials
Author Contributions
Funding
Acknowledgments
Conflicts of Interest
Abbreviations
References
- Izrailit, J.; Reedijk, M. Developmental pathways in breast cancer and breast tumor-initiating cells: Therapeutic implications. Cancer Lett. 2012, 317, 115–126. [Google Scholar] [CrossRef] [PubMed]
- Al-Hajj, M.; Becker, M.W.; Wicha, M.; Weissman, I.; Clarke, M.F. Therapeutic implications of cancer stem cells. Curr. Opin. Genet. Dev. 2004, 14, 43–47. [Google Scholar] [CrossRef] [PubMed]
- Balic, M.; Lin, H.; Young, L.; Hawes, D.; Giuliano, A.; McNamara, G.; Datar, R.H.; Cote, R.J. Most early disseminated cancer cells detected in bone marrow of breast cancer patients have a putative breast cancer stem cell phenotype. Clin. Cancer Res. 2006, 12, 5615–5621. [Google Scholar] [CrossRef] [PubMed]
- Paget, S. The distribution of secondary growths in cancer of the breast. Lancet 1889, 133, 571–573. [Google Scholar] [CrossRef]
- Gnant, M.; Mlineritsch, B.; Schippinger, W.; Luschin-Ebengreuth, G.; Pöstlberger, S.; Menzel, C.; Jakesz, R.; Seifert, M.; Hubalek, M.; Bjelic-Radisic, V.; et al. Endocrine therapy plus zoledronic acid in premenopausal breast cancer. N. Engl. J. Med. 2009, 360, 679–691. [Google Scholar] [CrossRef] [PubMed]
- Coleman, R.E.; Gregory, W.; Marshall, H.; Wilson, C.; Holen, I. The metastatic microenvironment of breast cancer: Clinical implications. Breast 2013, 22, S50–S56. [Google Scholar] [CrossRef]
- Liubomirski, Y.; Lerrer, S.; Meshel, T.; Rubinstein-Achiasaf, L.; Morein, D.; Wiemann, S.; Körner, C.; Ben-Baruch, A. Tumor-Stroma-Inflammation Networks Promote Pro-metastatic Chemokines and Aggressiveness Characteristics in Triple-Negative Breast Cancer. Front. Immunol. 2019, 10, 757. [Google Scholar] [CrossRef]
- Giussani, M.; Merlino, G.; Cappelletti, V.; Tagliabue, E.; Daidone, M.G. Tumor-extracellular matrix interactions: Identification of tools associated with breast cancer progression. Semin. Cancer Biol. 2015, 35, 3–10. [Google Scholar] [CrossRef]
- Wang, Y.J.; Bailey, J.M.; Rovira, M.; Leach, S.D. Sphere-forming assays for assessment of benign and malignant pancreatic stem cells. Methods Mol. Biol. 2013, 980, 281–290. [Google Scholar] [PubMed]
- Balic, M.; Schwarzenbacher, D.; Stanzer, S.; Heitzer, E.; Auer, M.; Geigl, J.B.; Cote, R.J.; Datar, R.H.; Dandachi, N. Genetic and epigenetic analysis of putative breast cancer stem cell models. BMC Cancer 2013, 13. [Google Scholar] [CrossRef]
- Celià-Terrassa, T.; Jolly, M.K. Cancer Stem Cells and Epithelial-to-Mesenchymal Transition in Cancer Metastasis. Cold Spring Harb. Perspect. Med. 2019. [Google Scholar] [CrossRef] [PubMed]
- Taube, J.H.; Herschkowitz, J.I.; Komurov, K.; Zhou, A.Y.; Gupta, S.; Yang, J.; Hartwell, K.; Onder, T.T.; Gupta, P.B.; Evans, K.W.; et al. Core epithelial-to-mesenchymal transition interactome gene-expression signature is associated with claudin-low and metaplastic breast cancer subtypes. Proc. Natl. Acad. Sci. USA 2010, 107, 15449–15454. [Google Scholar] [CrossRef] [PubMed]
- Du, B.; Shim, J.S. Targeting epithelial-mesenchymal transition (EMT) to overcome drug resistance in cancer. Molecules 2016, 21, 965. [Google Scholar] [CrossRef] [PubMed]
- Mimeault, M.; Batra, S.K. Altered gene products involved in the malignant reprogramming of cancer stem/progenitor cells and multitargeted therapies. Mol. Asp. Med. 2014, 39, 3–32. [Google Scholar] [CrossRef] [PubMed]
- Wei, S.C.; Fattet, L.; Tsai, J.H.; Guo, Y.; Pai, V.H.; Majeski, H.E.; Chen, A.C.; Sah, R.L.; Taylor, S.S.; Engler, A.J.; et al. Matrix stiffness drives epithelial-mesenchymal transition and tumour metastasis through a TWIST1-G3BP2 mechanotransduction pathway. Nat. Cell Biol. 2015, 17, 678–688. [Google Scholar] [CrossRef] [PubMed]
- Esterbauer, H.; Schaur, R.J.; Zollner, H. Chemistry and biochemistry of 4-hydroxynonenal, malonaldehyde and related aldehydes. Free Radic. Biol. Med. 1991, 11, 81–128. [Google Scholar] [CrossRef]
- Zhong, H.; Yin, H. Role of lipid peroxidation derived 4-hydroxynonenal (4-HNE) in cancer: Focusing on mitochondria. Redox Biol. 2015, 4, 193–199. [Google Scholar] [CrossRef]
- Guéraud, F.; Atalay, M.; Bresgen, N.; Cipak, A.; Eckl, P.M.M.; Huc, L.; Jouanin, I.; Siems, W.; Uchida, K.; Gueraud, F.; et al. Chemistry and biochemistry of lipid peroxidation products. Free Radic. Res. 2010, 44, 1098–1124. [Google Scholar] [CrossRef]
- Barrera, G.; Pizzimenti, S.; Dianzani, M.U. 4-hydroxynonenal and regulation of cell cycle: Effects on the pRb/E2F pathway. Free Radic. Biol. Med. 2004, 37, 597–606. [Google Scholar] [CrossRef]
- Milkovic, L.; Zarkovic, N.; Saso, L. Controversy about pharmacological modulation of Nrf2 for cancer therapy. Redox Biol. 2017, 12, 727–732. [Google Scholar] [CrossRef]
- Balic, M.; Rapp, N.; Stanzer, S.; Lin, H.; Strutz, J.; Szkandera, J.; Daidone, M.G.; Samonigg, H.; Cote, R.J.; Dandachi, N. Novel immunofluorescence protocol for multimarker assessment of putative disseminating breast cancer stem cells. Appl. Immunohistochem. Mol. Morphol. 2011, 19, 33–40. [Google Scholar] [CrossRef] [PubMed]
- Ginestier, C.; Hur, M.H.; Charafe-Jauffret, E.; Monville, F.; Dutcher, J.; Brown, M.; Jacquemier, J.; Viens, P.; Kleer, C.G.; Liu, S.; et al. ALDH1 is a marker of normal and malignant human mammary stem cells and a predictor of poor clinical outcome. Cell Stem Cell 2007, 1, 555–567. [Google Scholar] [CrossRef] [PubMed]
- Palafox, M.; Ferrer, I.; Pellegrini, P.; Vila, S.; Hernandez-Ortega, S.; Urruticoechea, A.; Climent, F.; Soler, M.T.; Muñoz, P.; Viñals, F.; et al. RANK induces epithelial-mesenchymal transition and stemness in human mammary epithelial cells and promotes tumorigenesis and metastasis. Cancer Res. 2012, 72, 2879–2888. [Google Scholar] [CrossRef] [PubMed]
- Bradford, M.M. A rapid and sensitive method for the quantitation of microgram quantities of protein utilizing the principle of protein-dye binding. Anal. Biochem. 1976, 72, 248–254. [Google Scholar] [CrossRef]
- Góth, L. A simple method for determination of serum catalase activity and revision of reference range. Clin. Chim. Acta 1991, 196, 143–151. [Google Scholar] [CrossRef]
- Radman Kastelic, A.; Odžak, R.; Pezdirc, I.; Sović, K.; Hrenar, T.; Čipak Gašparović, A.; Skočibušić, M.; Primožič, I. New and Potent Quinuclidine-Based Antimicrobial Agents. Molecules 2019, 24, 2675. [Google Scholar] [CrossRef]
- Tietze, F. Enzymic method for quantitative determination of nanogram amounts of total and oxidized glutathione: Applications to mammalian blood and other tissues. Anal. Biochem. 1969, 27, 502–522. [Google Scholar] [CrossRef]
- Srivastava, S.; Chandra, A.; Wang, L.-F.; Seifert, W.E.; DaGue, B.B.; Ansari, N.H.; Srivastava, S.K.; Bhatnagar, A. Metabolism of the Lipid Peroxidation Product, 4-Hydroxy- trans -2-nonenal, in Isolated Perfused Rat Heart. J. Biol. Chem. 1998, 273, 10893–10900. [Google Scholar] [CrossRef]
- Sawczuk, B.; Maciejczyk, M.; Sawczuk-Siemieniuk, M.; Posmyk, R.; Zalewska, A.; Car, H. Salivary Gland Function, Antioxidant Defence and Oxidative Damage in the Saliva of Patients with Breast Cancer: Does the BRCA1 Mutation Disturb the Salivary Redox Profile? Cancers 2019, 11, 1501. [Google Scholar] [CrossRef]
- Lee, J.D.; Cai, Q.; Shu, X.O.; Nechuta, S.J. The Role of Biomarkers of Oxidative Stress in Breast Cancer Risk and Prognosis: A Systematic Review of the Epidemiologic Literature. J. Women’s Health 2017, 26, 467–482. [Google Scholar] [CrossRef]
- Marquez-Quiñones, A.; Cipak, A.; Zarkovic, K.; Fattel-Fazenda, S.; Villa-Treviño, S.; Waeg, G.; Zarkovic, N.; Guéraud, F. HNE-protein adducts formation in different pre-carcinogenic stages of hepatitis in LEC rats. Free Radic. Res. 2010, 44, 119–127. [Google Scholar] [CrossRef] [PubMed]
- Balestrieri, M.L.; Dicitore, A.; Benevento, R.; Di Maio, M.; Santoriello, A.; Canonico, S.; Giordano, A.; Stiuso, P. Interplay between membrane lipid peroxidation, transglutaminase activity, and cyclooxygenase 2 expression in the tissue adjoining to breast cancer. J. Cell. Physiol. 2012, 227, 1577–1582. [Google Scholar] [CrossRef] [PubMed]
- Karihtala, P.; Kauppila, S.; Puistola, U.; Jukkola-Vuorinen, A. Divergent behaviour of oxidative stress markers 8-hydroxydeoxyguanosine (8-OHdG) and 4-hydroxy-2-nonenal (HNE) in breast carcinogenesis. Histopathology 2011, 58, 854–862. [Google Scholar] [CrossRef] [PubMed]
- Zhang, H.; Forman, H.J. Signaling by 4-hydroxy-2-nonenal: Exposure protocols, target selectivity and degradation. Arch. Biochem. Biophys. 2017, 617, 145–154. [Google Scholar] [CrossRef] [PubMed]
- Cipak, A.; Mrakovcic, L.; Ciz, M.; Lojek, A.; Mihaylova, B.; Goshev, I.; Jaganjac, M.; Cindric, M.; Sitic, S.; Margaritoni, M.; et al. Growth suppression of human breast carcinoma stem cells by lipid peroxidation product 4-hydroxy-2-nonenal and hydroxyl radical-modified collagen. Acta Biochim. Pol. 2010, 57, 165–171. [Google Scholar] [CrossRef] [PubMed]
- Cerbone, A.; Toaldo, C.; Laurora, S.; Briatore, F.; Pizzimenti, S.; Dianzani, M.U.; Ferretti, C.; Barrera, G. 4-Hydroxynonenal and PPARgamma ligands affect proliferation, differentiation, and apoptosis in colon cancer cells. Free Radic. Biol. Med. 2007, 42, 1661–1670. [Google Scholar] [CrossRef]
- Varnat, F.; Duquet, A.; Malerba, M.; Zbinden, M.; Mas, C.; Gervaz, P.; Ruiz i Altaba, A. Human colon cancer epithelial cells harbour active HEDGEHOG-GLI signalling that is essential for tumour growth, recurrence, metastasis and stem cell survival and expansion. EMBO Mol. Med. 2009, 1, 338–351. [Google Scholar] [CrossRef]
- Kalluri, R.; Weinberg, R.A. The basics of epithelial-mesenchymal transition. J. Clin. Investig. 2009, 119, 1420–1428. [Google Scholar] [CrossRef]
- Lah, T.T.; Novak, M.; Breznik, B. Brain Malignancies: Cancer Cell Trafficking in and out of the Niches. In Seminars Cancer Biology; Academic Press: New York, NY, USA, 2019. [Google Scholar]
- Hass, R.; von der Ohe, J.; Ungefroren, H. Potential Role of MSC/Cancer Cell Fusion and EMT for Breast Cancer Stem Cell Formation. Cancers 2019, 11, 1432. [Google Scholar] [CrossRef]
- Meitzler, J.L.; Konaté, M.M.; Doroshow, J.H. Hydrogen peroxide-producing NADPH oxidases and the promotion of migratory phenotypes in cancer. Arch. Biochem. Biophys. 2019, 675, 108076. [Google Scholar] [CrossRef]
- Sun, X.-D.; Liu, X.-E.; Huang, D.-S. Curcumin reverses the epithelial-mesenchymal transition of pancreatic cancer cells by inhibiting the Hedgehog signaling pathway. Oncol. Rep. 2013, 29, 2401–2407. [Google Scholar] [CrossRef] [PubMed]
- Castro, J.P.; Jung, T.; Grune, T.; Siems, W. 4-Hydroxynonenal (HNE) modified proteins in metabolic diseases. Free Radic. Biol. Med. 2017, 111, 309–315. [Google Scholar] [CrossRef] [PubMed]
- Go, Y.M.; Halvey, P.J.; Hansen, J.M.; Reed, M.; Pohl, J.; Jones, D.P. Reactive aldehyde modification of thioredoxin-1 activates early steps of inflammation and cell adhesion. Am. J. Pathol. 2007, 171, 1670–1681. [Google Scholar] [CrossRef] [PubMed]
- Zheng, X.; Carstens, J.L.; Kim, J.; Scheible, M.; Kaye, J.; Sugimoto, H.; Wu, C.C.; Lebleu, V.S.; Kalluri, R. Epithelial-to-mesenchymal transition is dispensable for metastasis but induces chemoresistance in pancreatic cancer. Nature 2015, 527, 525–530. [Google Scholar] [CrossRef]


| Growth Surface | MTT IC50 (µM HNE) | 3HT IC50 (µM HNE) |
|---|---|---|
| Single HNE treatment | ||
| PS | n.a. | 24.05 |
| Collagen I | n.a. | 25.54 |
| Collagen I + 1 µM HNE | n.a. | 24.83 |
| Collagen I + 10 µM HNE | n.a. | 23.60 |
| Multiple HNE treatments | ||
| PS | 44.42 | 44.59 |
| Collagen I | 28.78 | 45.04 |
| Collagen I + 1 µM HNE | 27.74 | 44.61 |
| Collagen I + 10 µM HNE | 26.48 | 44.64 |
© 2019 by the authors. Licensee MDPI, Basel, Switzerland. This article is an open access article distributed under the terms and conditions of the Creative Commons Attribution (CC BY) license (http://creativecommons.org/licenses/by/4.0/).
Share and Cite
Čipak Gašparović, A.; Milković, L.; Dandachi, N.; Stanzer, S.; Pezdirc, I.; Vrančić, J.; Šitić, S.; Suppan, C.; Balic, M. Chronic Oxidative Stress Promotes Molecular Changes Associated with Epithelial Mesenchymal Transition, NRF2, and Breast Cancer Stem Cell Phenotype. Antioxidants 2019, 8, 633. https://doi.org/10.3390/antiox8120633
Čipak Gašparović A, Milković L, Dandachi N, Stanzer S, Pezdirc I, Vrančić J, Šitić S, Suppan C, Balic M. Chronic Oxidative Stress Promotes Molecular Changes Associated with Epithelial Mesenchymal Transition, NRF2, and Breast Cancer Stem Cell Phenotype. Antioxidants. 2019; 8(12):633. https://doi.org/10.3390/antiox8120633
Chicago/Turabian StyleČipak Gašparović, Ana, Lidija Milković, Nadia Dandachi, Stefanie Stanzer, Iskra Pezdirc, Josip Vrančić, Sanda Šitić, Christoph Suppan, and Marija Balic. 2019. "Chronic Oxidative Stress Promotes Molecular Changes Associated with Epithelial Mesenchymal Transition, NRF2, and Breast Cancer Stem Cell Phenotype" Antioxidants 8, no. 12: 633. https://doi.org/10.3390/antiox8120633
APA StyleČipak Gašparović, A., Milković, L., Dandachi, N., Stanzer, S., Pezdirc, I., Vrančić, J., Šitić, S., Suppan, C., & Balic, M. (2019). Chronic Oxidative Stress Promotes Molecular Changes Associated with Epithelial Mesenchymal Transition, NRF2, and Breast Cancer Stem Cell Phenotype. Antioxidants, 8(12), 633. https://doi.org/10.3390/antiox8120633