Article

Selenium Status Is Associated with Inflammation in Epicardial Adipose Tissue in Elderly Patients with Coronary Artery Disease

1
Oslo Center for Clinical Heart Research, Department of Cardiology, Oslo University Hospital Ullevål, 0450 Oslo, Norway
2
Institute of Clinical Medicine, University of Oslo, 0318 Oslo, Norway
3
Department of Biomedical Science, University of Copenhagen, 2200 Copenhagen, Denmark
4
Clinical Research Centre, Medical University of Bialystok, 15-276 Bialystok, Poland
5
Department of Cardiothoracic Surgery, Oslo University Hospital, 0450 Oslo, Norway
6
Norwegian Institute of Public Health, 0213 Oslo, Norway
7
Department of Medical and Health Sciences, Linköping University, 581 83 Linköping, Sweden
8
K.G. Jebsen Center for Cardiac Biomarkers, Campus Ahus, University of Oslo, 1478 Lørenskog, Norway
*
Author to whom correspondence should be addressed.
Antioxidants 2026, 15(6), 687; https://doi.org/10.3390/antiox15060687
Submission received: 27 March 2026 / Revised: 19 May 2026 / Accepted: 27 May 2026 / Published: 29 May 2026
(This article belongs to the Special Issue Biological Activities of Antioxidant Selenoproteins)

Abstract

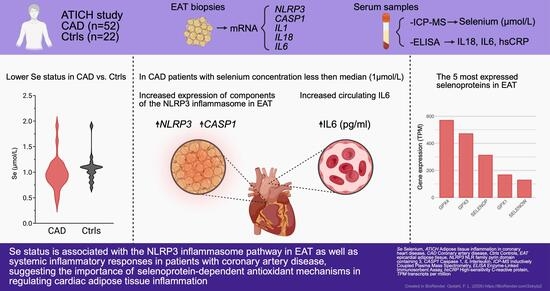
Background: Inflammation in epicardial adipose tissue (EAT) contributes to cardiovascular disease through the local production of pro-inflammatory cytokines affecting the adjacent myocardium. Selenium (Se) is essential for selenoprotein-mediated antioxidant and anti-inflammatory functions. We investigated associations between Se status and inflammatory markers in EAT and in the circulation in patients with coronary artery disease (CAD). Methods: Patients with CAD undergoing coronary artery bypass grafting (n = 52) and valve disease patients receiving valve replacement serving as controls (n = 22) were included from the ATICH study. EAT biopsies were obtained during open-chest chest surgery. Serum Se was measured by inductively coupled plasma mass spectrometry. Associations between Se and EAT mRNA expression of Nod-like receptor family pyrin domain-containing protein 3 (NLRP3) inflammasome components and cytokines, as well as circulating inflammatory markers, were assessed using Spearman’s rho and group comparisons based on median Se levels. Results: Se concentrations were lower in CAD patients than controls (0.9 vs. 1.1 µmol/L, p = 0.025). In CAD patients, Se levels correlated with EAT expression of CASP1 and IL18, and with circulating IL-6. Se levels above the median were associated with lower EAT expression of CASP1 and NLRP3 and reduced IL-6 levels (p < 0.05, all). Our analysis of publicly available RNA seq data demonstrated selenoprotein’s presence in EAT. Conclusion: Lower Se status in CAD was associated with increased systemic and EAT inflammation, suggesting a role for selenoprotein-dependent antioxidant mechanisms in regulating cardiac adipose tissue inflammation.

Graphical Abstract

1. Introduction

Cardiovascular disease (CVD), including coronary artery disease (CAD), is a leading cause of death in Europe [1]. Atherosclerosis is the main underlying mechanism of CAD, driven by systemic and local inflammation, endothelial dysfunction, and oxidative stress [2]. Epicardial adipose tissue (EAT) is in direct contact with the myocardium and is implicated in the development and progression of CAD [3,4]. Under physiological conditions, EAT constitutes a protecting depot serving energy to the myocardium. In states of chronic inflammation and/or visceral obesity, often accompanying aging, EAT volume increases and undergoes structural changes with extracellular matrix degradation, the infiltration of immune cells that release pro-inflammatory mediators, and the production of reactive oxygen species (ROS) [5,6,7]. Counteracting the pro-inflammatory milieu is considered therapeutically favorable, e.g., the CANTOS and ASSAIL-MI trials with inhibition of interleukin (IL)-1β and the IL-6 receptor, respectively, show modest cardiovascular risk benefits without a reduction in adverse events in very high-risk patients with residual inflammation [8,9].
Selenium (Se) is an essential trace element [10]. In many European countries, particularly in the Nordic region, low concentrations of Se in the soil contribute to inadequate dietary intake and subsequent risk of Se deficiency [11]. Following dietary intake, Se is absorbed in the distal duodenum and transported to the liver for storage, after which it is distributed to target tissues via the principal Se transporter, selenoprotein P (SELENOP) [12]. Se is incorporated into selenoproteins as the amino acid selenocysteine, and low Se status impairs selenoprotein activity. Twenty-five human genes encode selenoproteins, e.g., glutathione peroxidases (GPXs) and thioredoxin reductases (TXNRDs). Selenoproteins have a wide range of physiological functions, including anti-inflammatory effects such as nuclear factor (NF)-κB inhibition, antioxidant activity such as neutralizing ROS, gene regulation, and the inhibition of endoplasmic reticulum (ER) stress with the removal of misfolded proteins [10,13].
Previous reports show that selenoproteins are highly present in EAT, underpinning their impact in this environment [14,15,16,17,18,19,20].
In the present study, our aim was to explore the role of Se status with regard to its anti-inflammatory effects in CAD, focusing on EAT and circulating proteins. Se status may influence vascular function, atherosclerosis, and CAD severity through the protective effects of selenoproteins against inflammation- and oxidative stress-mediated damage to the cardiovascular system. We focused on innate immunity by assessing the mRNA expression of the Nod-like receptor family pyrin domain-containing protein 3 (NLRP3) inflammasome components in EAT (NLRP3 and CASP1), their related cytokines (IL-1β and IL-18, encoded by IL1B and IL18, respectively), and IL6 [21], as well as circulating levels of IL-18, IL-6, and high-sensitivity C-reactive protein (hsCRP), in patients with CAD undergoing coronary artery bypass grafting (CABG).
Our results suggested that Se status in CAD patients was associated with the NLRP3 inflammasome pathway in EAT, not previously reported, as well as systemic inflammatory responses. While omics data including selenoprotein presence in EAT are accessible in the public domain, they have not previously been selectively summarized in a scientific publication. These novel findings support the importance of adequate Se status for the anti-inflammatory and antioxidant functions of selenoproteins in EAT, thereby underscoring their potential relevance in both the prevention and progression of CAD.

2. Materials and Methods

2.1. The ATICH Study Population

The Adipose Tissue In Coronary Heart (ATICH) trial is an observational, cross-sectional study including n = 52 patients with CAD undergoing CABG and n = 22 subjects) with valve diseases undergoing valve replacement [22], with the intention to explore inflammatory processes in EAT requiring open-chest surgery for biopsy procedures. Participants were recruited at the Department of Cardiothoracic Surgery, Oslo University Hospital, Ullevaal, Oslo (Norway), from 2016 to 2018. No restrictions were set for inclusion except for use of medications known to interfere with inflammation, e.g., steroid drugs. Before surgery, all patients gave written consent to participate. The study was conducted in accordance with the Declaration of Helsinki, and the protocol was approved by the Regional Ethics Committee of North Norway (#2016/411). The ATICH study is registered at clinicaltrial.gov with the code NCT02760914.
Arterial blood samples were collected before anesthesia. Whole blood was centrifuged at 2500× g for 10′ and serum samples were frozen at −80 °C until analysis. During open-chest surgery and prior to initiation of extracorporeal circulation, EAT biopsies were obtained from the area between the right coronary artery and the pulmonary artery. Samples were placed in an RNA stabilizer (Allprotect Tissue Reagent, Cat#76405, Qiagen, Hilden, Germany), before being snap-frozen at −80 °C.
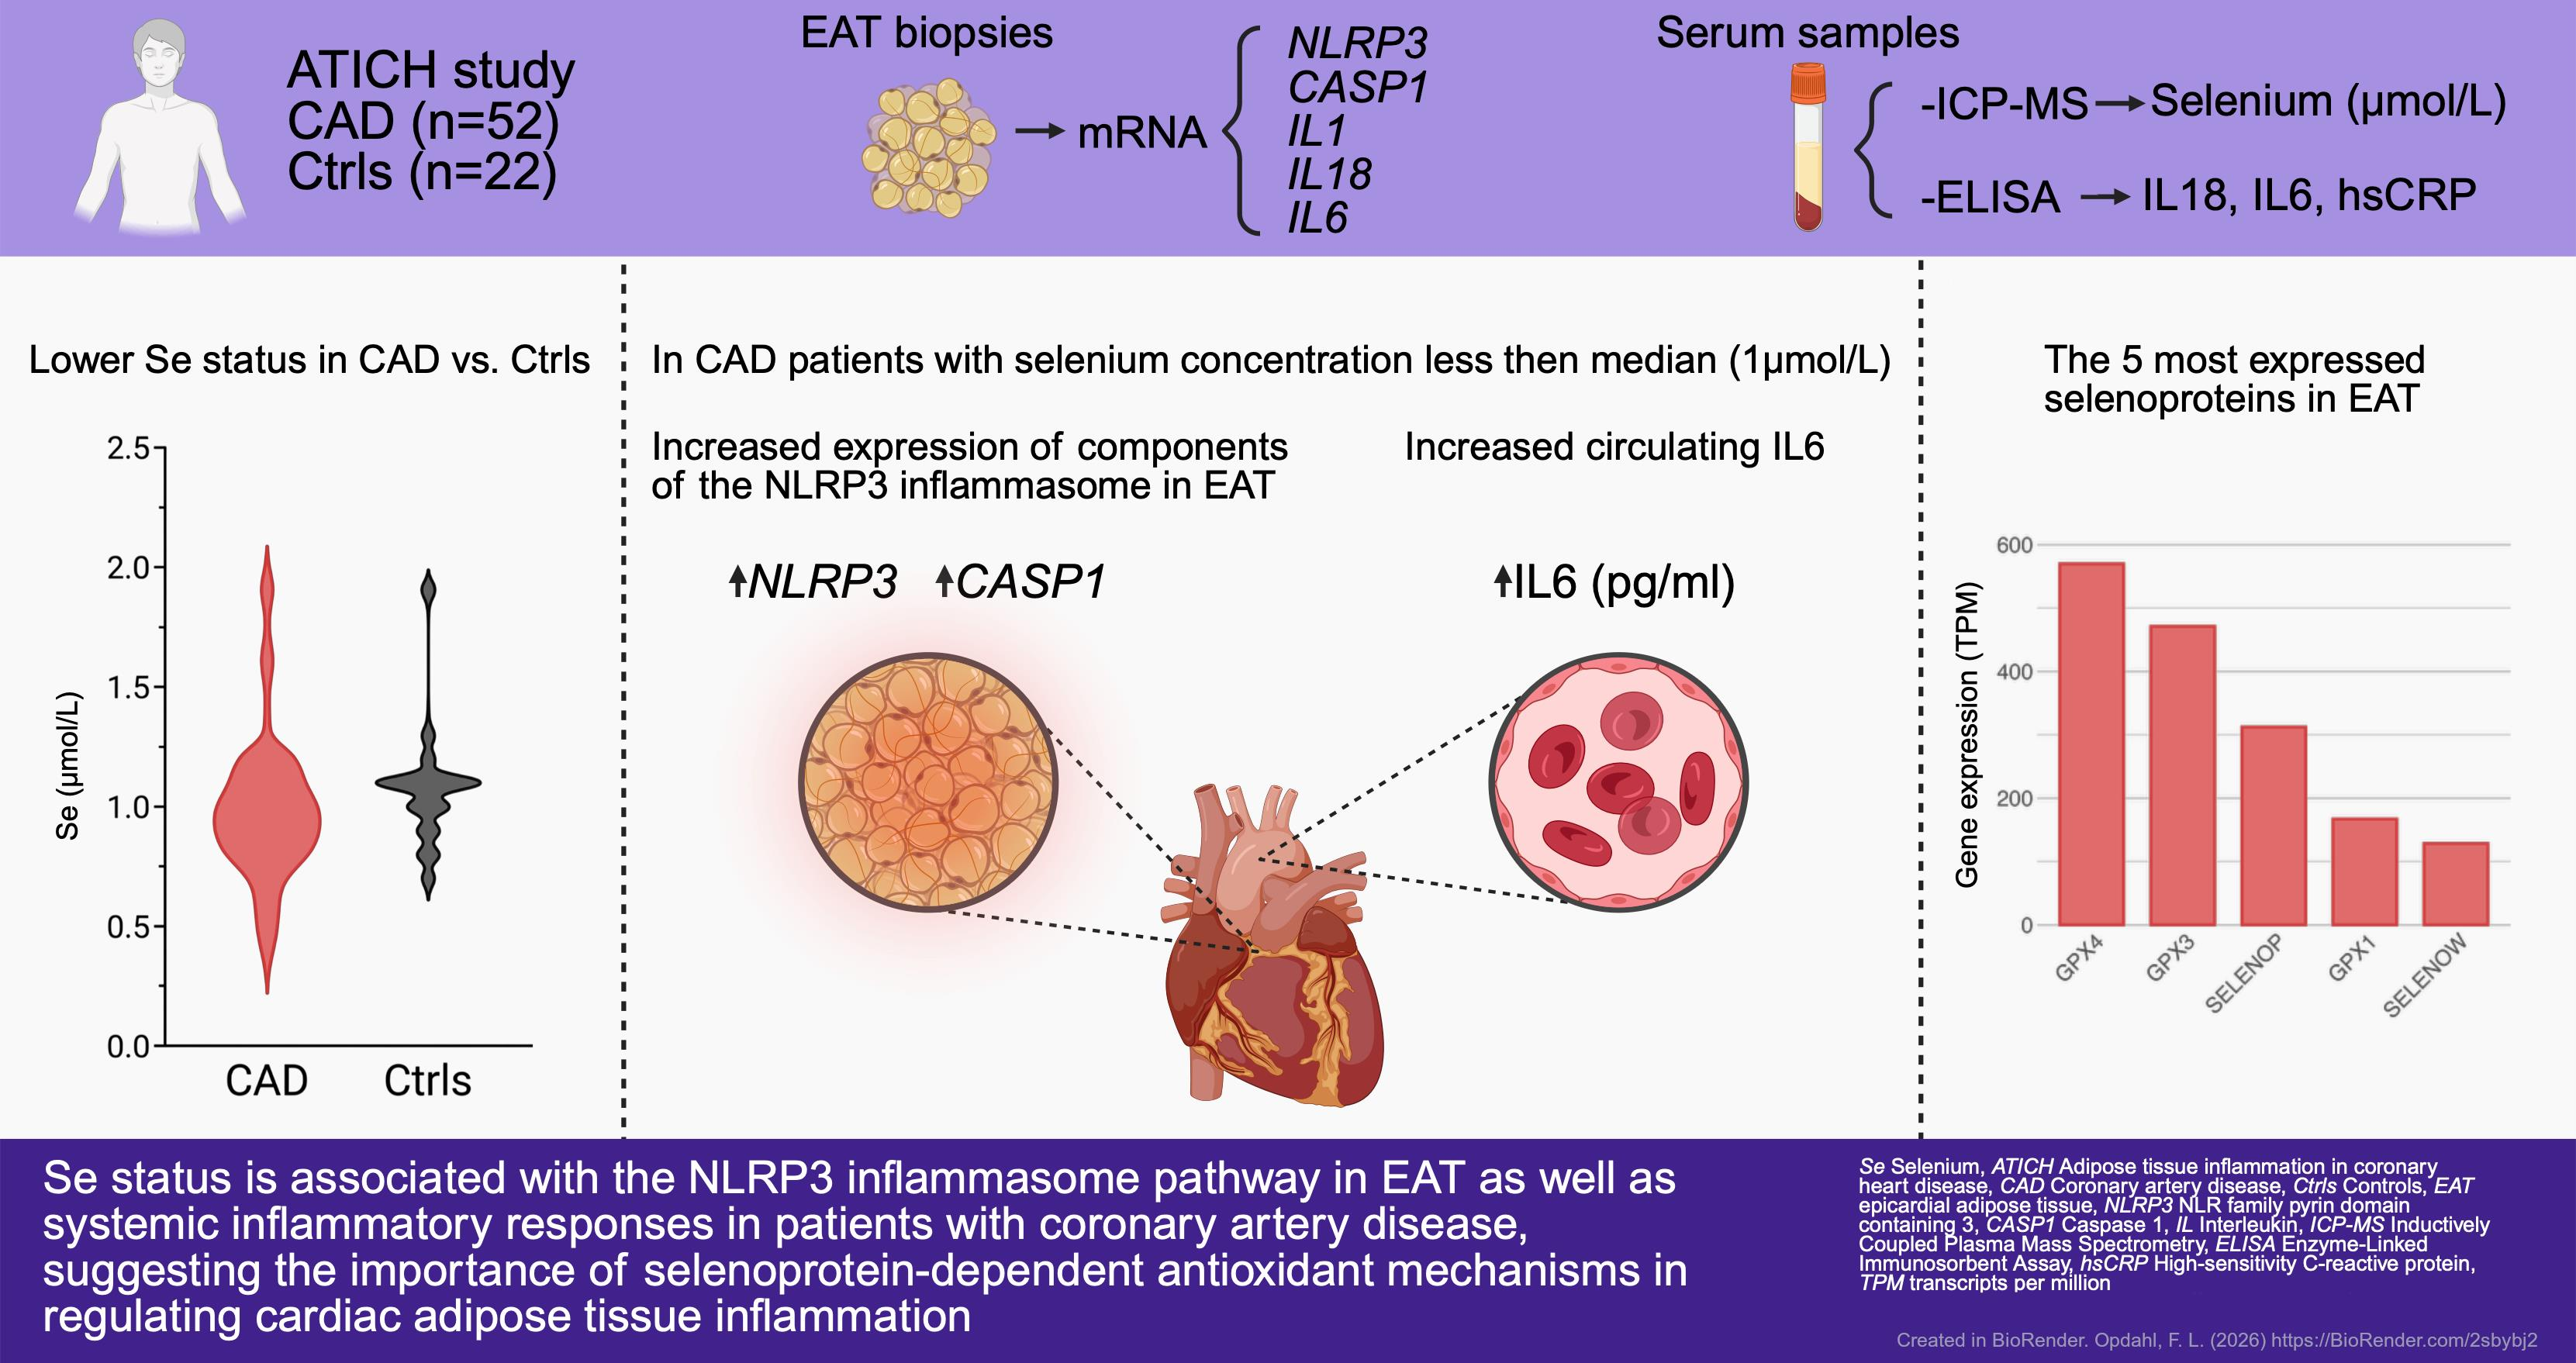
A schematic illustration of the present study is presented in Figure 1.

2.2. Serum Se Measurements

Serum Se was quantified using inductively coupled plasma mass spectrometry (ICP-MS) on a NexlON 2000 B instrument (PerkinElmer, Waltham, MA, USA). Serum samples were diluted 1:20 with water (Milli-RX, Millipore (Millipore Sigma, Burlington, MA, USA), and 0.1% nitric acid, 0.5% butanol (both Merck, Darmstadt, Germany) and 10 ul/L of Rhodium standard (TruQ standard (Perkin Elmer) in 10% HCL) were added to the samples ahead of the mass spectrometry measurements. The precision of the method has an average coefficient of variation (CV) of 7.6%.

2.3. ELISA Measurements of Circulating Biomarkers

Serum concentrations of IL-18, IL-6, and hsCRP were determined as part of a previous publication [22]. In brief, commercially available enzyme-linked immunosorbent assays (ELISAs) were used: IL-18 (MBL, Medical and Biological Laboratories Co., Ltd, Nagoya, Japan), Human IL-6 (R&D Systems, Inc., 614 McKinley Place NE, Minneapolis, Minnesota, USA), and C-Reactive Protein HS ELISA (DRG, DRG Instruments GmbH, Marburg, Germany), as previously described [21]. The inter-assay coefficients of variation (CVs) in our laboratory were 1.4%, 2.7%, and 6.1%, respectively.

2.4. mRNA Levels in Epicardial Adipose Tissue

Gene expression levels in EAT were determined as part of a previous publication [22]. In brief, total RNA was extracted using the RNeasy Lipid Tissue Mini Kit according to the manufacturer protocol (Qiagen, GmbH, Hilden, Germany). RNA purity and quantity were measured by the NanoDrop 1000 Spectrophotometer (Saveen Werner, Limhamn, Sweden). The mean purity, assessed as the 260 and 280 nm absorbance ratio (260/280), was 1.7, and mean quantity was 28.6 ng/μL. Copy DNA (cDNA) was made from 5 ng/μL RNA with qScript cDNA superMix (Quanta Biosciences, Gaithersburg, MD, USA). The following TaqMan assays were used: NLRP3 (Hs00918082_m1), CASP1 (Hs00354836_m1), IL1B (Hs01555410_m1), IL18 (Hs00155517_m1), and IL6 (Hs00174131_m1), all Applied Biosystems, Foster City, CA, USA). Real-time qPCR was performed on a ViiA7 instrument (Applied Biosystems) using TaqMan® Universal PCR Master Mix (Applied Biosystems, Foster City, CA, USA) (P/N 4324018). B2M (Hs99999907_m1) (Applied Biosystems) was used for normalization, and relative quantification (RQ) of the target genes was determined through applying the ΔΔCT method [23].
Publicly available RNA-sequencing datasets from human EAT were identified through a search of the Gene Expression Omnibus (GEO), using the term “epicardial adipose tissue” and applying the filters “homo sapiens” and “expression profiling by high throughput sequencing”. RNA sequencing data were retrieved from GSE108971 [14], GSE125856 [15], GSE192886 [16], GSE222739 [17], GSE179455 [18], GSE135445 [19], and GSE263644 [20]. For the purposes of this analysis, samples were included irrespective of disease status or study group, and all available EAT sequencing data were considered. From the eligible datasets, median transcripts per million (TPM) values for selenoprotein-related genes were extracted and reviewed.

2.5. Statistics

SPSS version 31.0 was used for statistics and (SPSS Inc., Chicago, IL, USA) figures were created in GraphPad Prism version 10.6.1 (San Diego, CA, USA) and BioRender (Toronto, ON, Canada). Clinical characteristics are presented as numbers and percentages, mean (SD) or as median values with 25th and 75th percentiles. As most variables had a skewed distribution, non-parametric statistics were used throughout, i.e., Mann–Whitney U test for group comparisons and Spearman Rho for correlation analyses. Linear regression with log-transformed Se levels was used when analyzing the difference in Se concentrations between the CAD and controls, adjusted for age, sex, biochemical markers, and medication, with all variables differently distributed between the two groups. Independent variables added in the model were checked for multicollinearity. Histograms, Q-Q plots and Kolmogorov–Smirnov tests were used to assess the normality of the measured Se concentrations. p-values < 0.05 were considered statistically significant.

3. Results

3.1. Clinical Characteristics

The clinical characteristics of the ATICH study population are summarized in Table 1, i.e., CAD patients and controls with valve diseases. As expected, and described before [22], several comorbidities were more present in the CAD group, with hypertension being the most common, followed by angina, previous myocardial infarction (MI) and any type of diabetes. The CAD group had more men, more use of statins and beta-blockers, and higher levels of glycated hemoglobin A1c (HbA1c) and glomerular filtration rate (GFR) compared with the control group.

3.2. Serum Se Concentration in CAD Patients and Controls

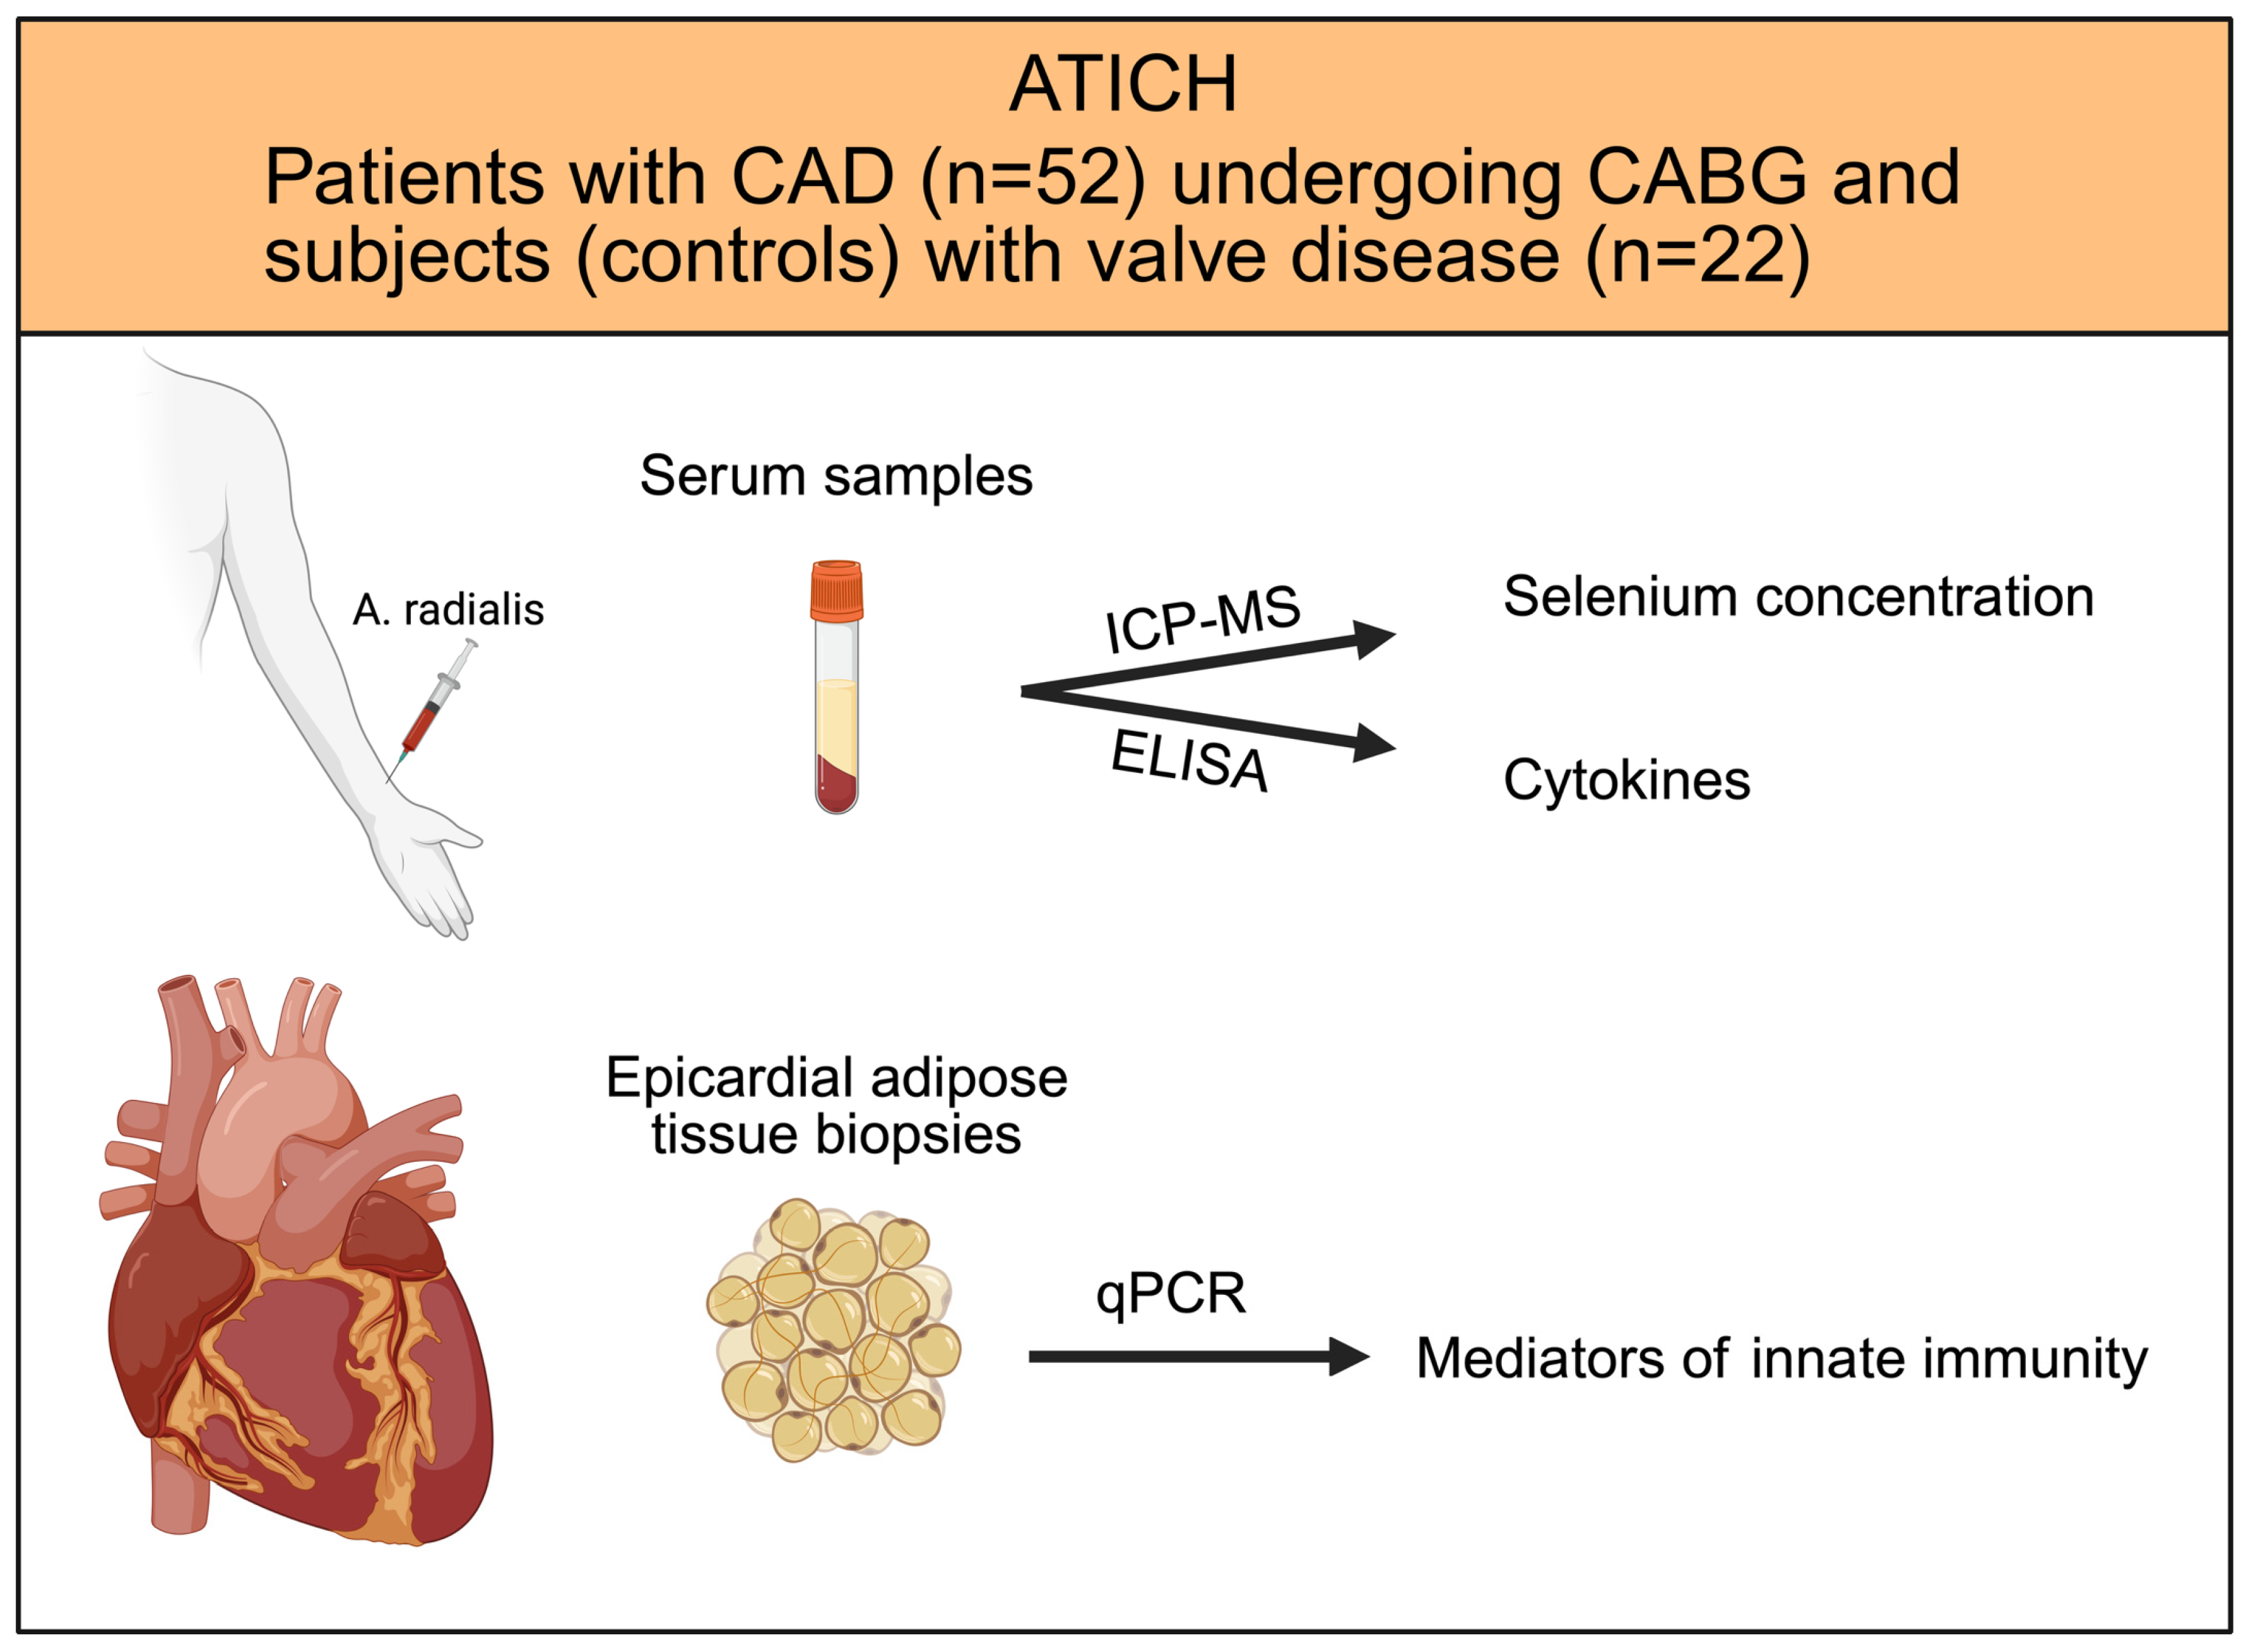
Se concentrations were successfully analyzed in all seventy-four subjects with medium Se levels (25, 75 percentiles) of 1.0 µmol/L (0.8, 1.1). Se concentrations were lower in the CAD group: 0.90 (0.8, 1.1) compared with controls: 1.1 (0.98, 1.1), p = 0.025 (unadjusted). The range (min–max) of serum Se in the CAD and control group were: 0.4–1.9 and 0.7–1.9, respectively (Figure 2).
Of note, when adjusting for age, sex, previous MI, total cholesterol, HbA1c, GFR, and the use of aspirin and beta-blockers in a linear regression model, Se failed to be statistically significantly lower in the CAD group vs. controls, (p = 0.141). In the model, previous MI emerged as the strongest and only statistically significant independent contributor to the difference in Se between CAD patients and controls (Table 2). Thus, we speculate that patients with MI may have more severe atherosclerosis, in which Se deficiency could have been a contributing factor.
However, within the CAD group, serum Se concentrations were not associated with comorbidities such as prior MI, diabetes, or hypertension, nor with sex, smoking status or medication use (Table 3).

3.3. Association Between Serum Se Concentration and Major Systematic Inflammatory Biomarkers

Correlation analyses of serum Se concentration against mRNA/protein variables (previously measured [22]) were performed only in the CAD group, due to the limited sample size of the control group. For more information, previously measured mRNA levels of the selected genes [22] are shown in Supplementary Table S1. In CAD, serum Se correlated inversely to levels of central inflammation biomarkers IL-6 (r = −0.398, p = 0.004) and hsCRP (r = −0.267, strong tendency, p = 0.056), but was not significantly correlated to IL-18 (r = −0.069, p = 0.63).
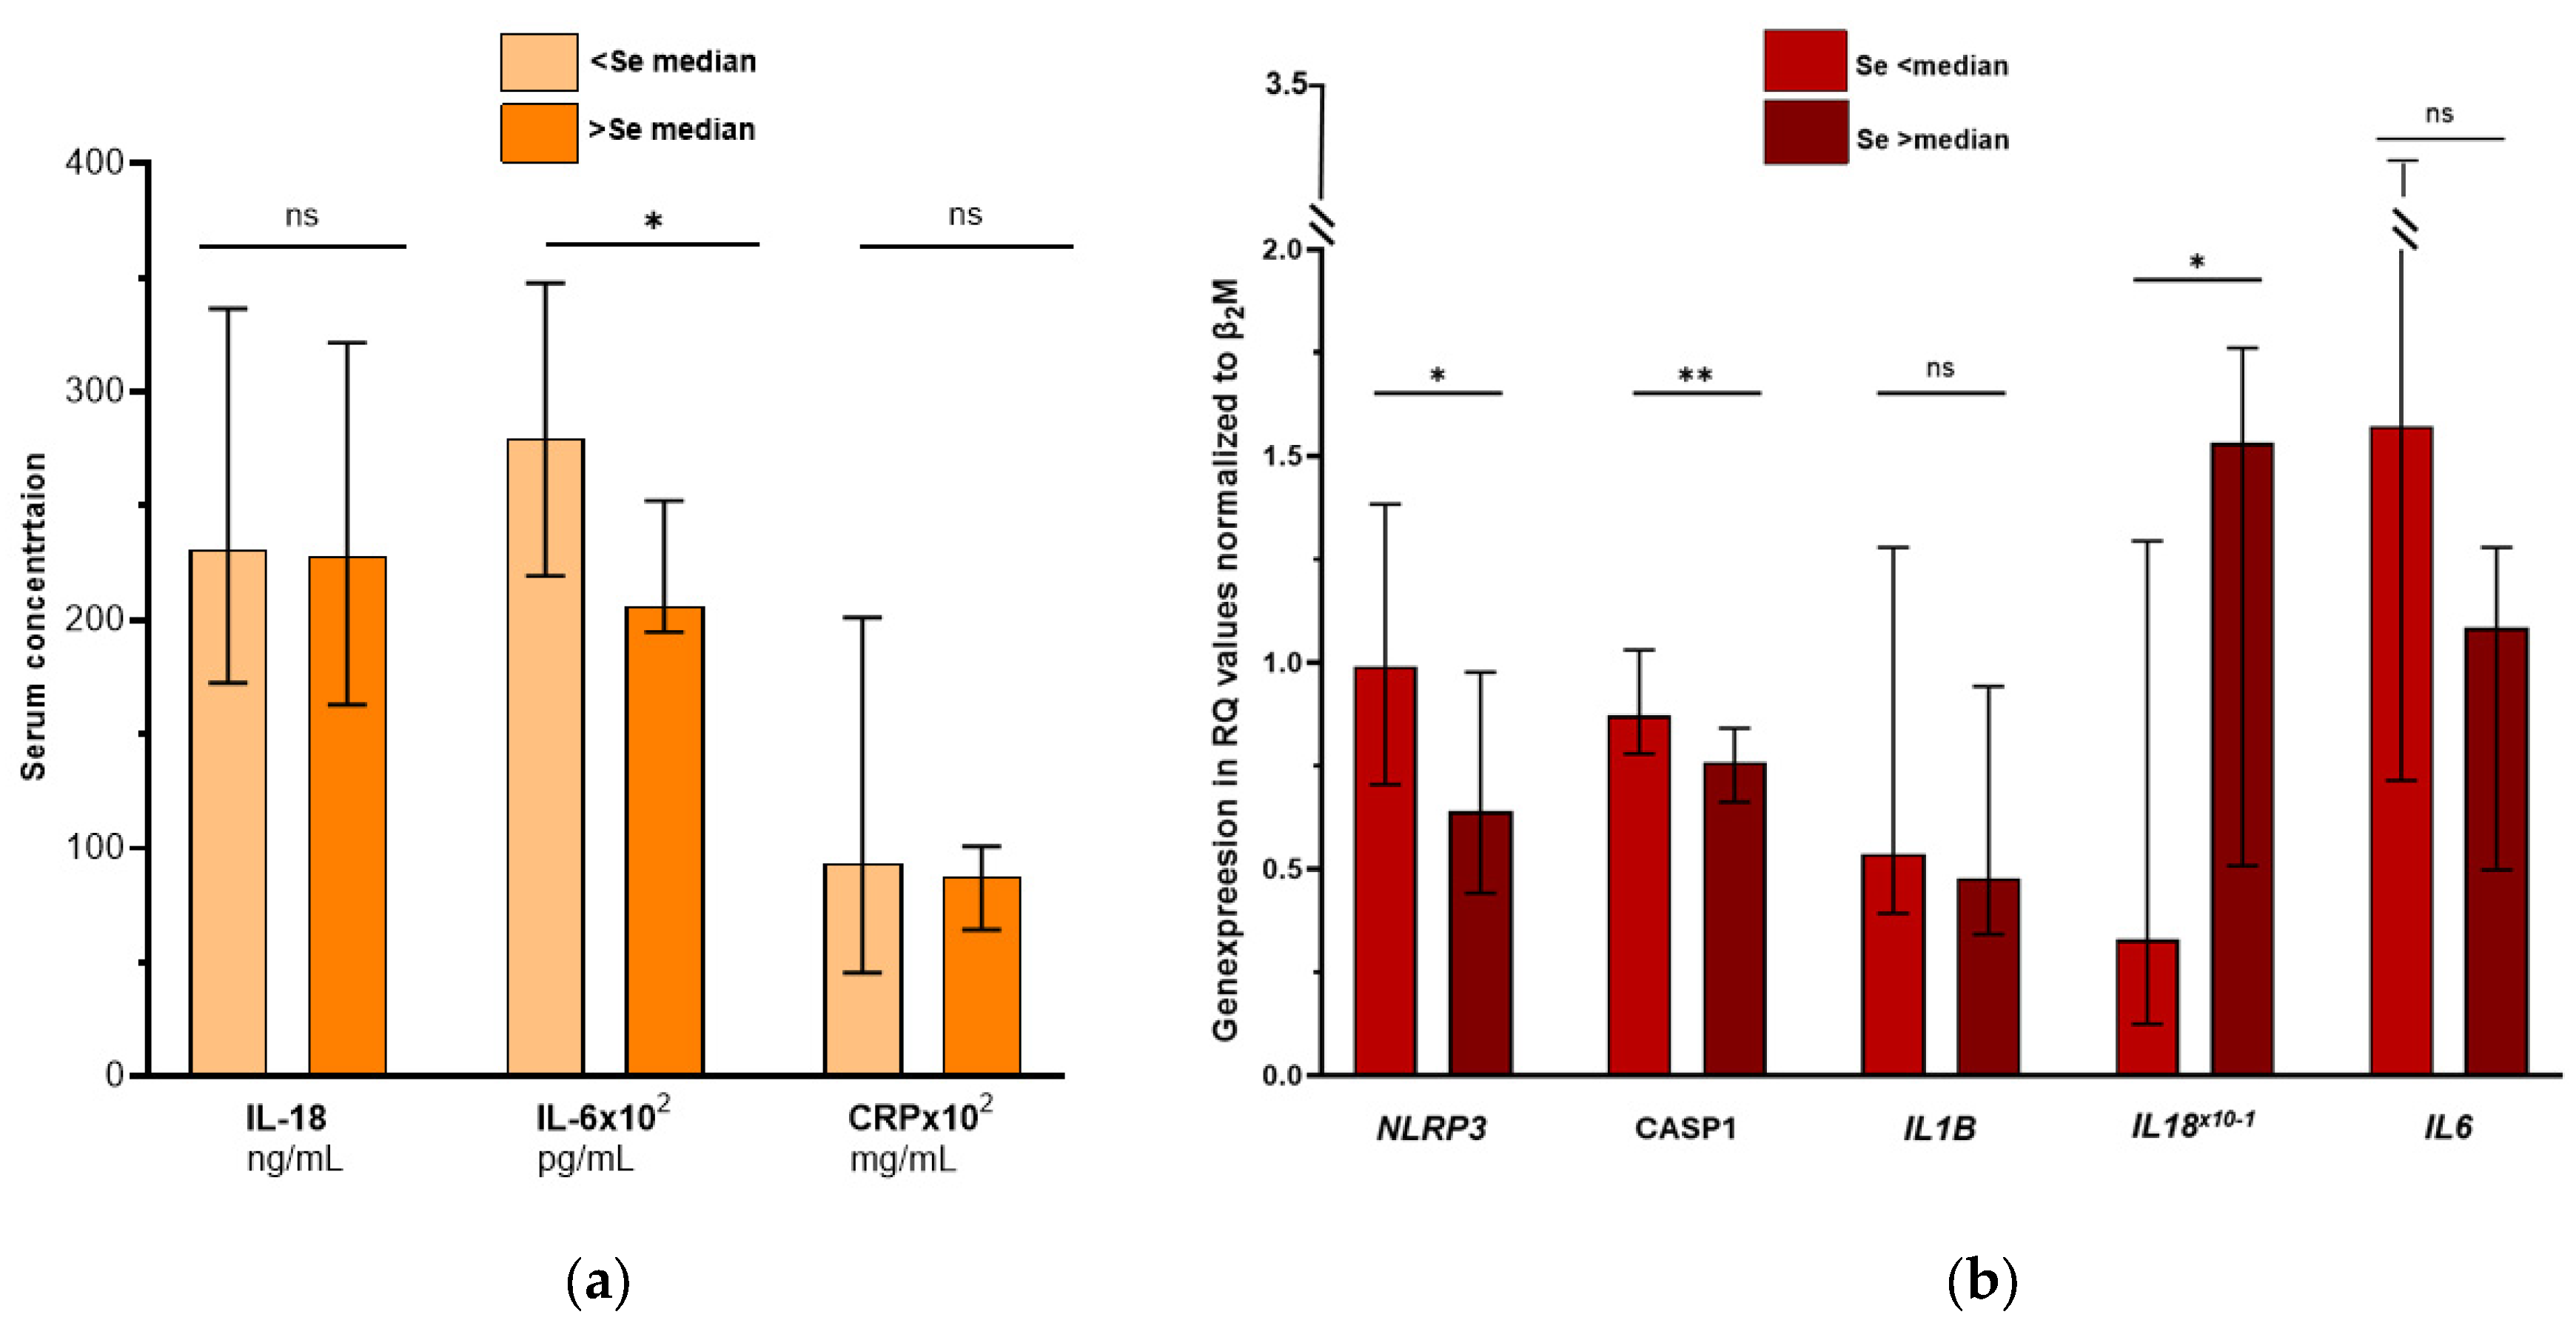
When serum Se concentration was categorized according to median Se level in the total cohort (1.0 µmol/L), the stratified analyses showed lower IL-6 concentration at Se levels > the median (p = 0.035), whereas no difference in the levels of CRP and IL-18 was found (p > 0.5, both) (Figure 3a).

3.4. Associations Between Serum Se Concentration and EAT Expression of the NLRP3-Inflammasome Components and Related Cytokines

In the CAD group, serum Se concentration was inversely correlated to CASP1 mRNA levels (r = −0.335, p = 0.015), yet no significant correlation was observed to the expression of the other inflammasome component NLRP3 (r = −0.234, p = 0.095) and the downstream cytokine IL1B (r = −0.002, p = 0.98). A positive correlation was observed between serum Se and IL18 mRNA expression (r = 0.300, p = 0.032).
Categorizing the expression of the markers according to the median Se level (1.0 µmol/L), NLRP3 and CASP1 were lower (p = 0.022 and p = 0.004, respectively) and IL18 was more highly expressed (p = 0.023) at Se concentrations above vs. below the median level (Figure 3b), yet no association was observed for IL1B and IL6 (p ≥ 0.5, both).

3.5. Selenoproteins in EAT

Results from the publicly available transcriptome data (RNA sequencing) of EAT, from patients with CAD, heart failure or atrial fibrillation, and diabetes patients, were retrieved from previous publications [14,15,16,17,18,19,20] and are shown in Supplementary Figure S1. Of the 25 genes in the human genome that encode selenoproteins, GPX1, GPX3, GPX4, SELENOP, and SENOW were observed to be highly expressed in EAT in all seven datasets, with the presence of several others, such as TXNRD1, SELENO-F, -M, and -N, also being noted. The selenoproteins GPX6 and SELENOV were not expressed in EAT.

4. Discussion

The main findings of this study are that patients with CAD undergoing CABG exhibited lower serum Se concentrations in the unadjusted analysis than valve disease patients, and that Se status was associated with both systemic inflammation and inflammatory gene expression in EAT. Specifically, Se correlated inversely with circulating IL-6 and hsCRP, and CAD patients with Se concentrations above the median had lower IL-6 levels. Moreover, Se status was associated with EAT mRNA expression of key NLRP3 inflammasome components, with lower expression of NLRP3 and CASP1 observed at higher Se concentrations.
Patients with valve diseases (including aortic stenosis (n = 16), mitral insufficiency (n = 5) and mitral stenosis (n = 1)), presumably without CAD, were included as controls in the present study. Given their median age of 69 years, the presence of chronic inflammation potentially affecting the coronary arteries cannot be excluded. However, these patients were considered to have a lower inflammatory burden compared with individuals with verified CAD. As the primary aim of the study was to explore inflammation in EAT, the use of biopsies from patients with valve diseases, rather than from healthy subjects, was considered a reasonable and pragmatic approach. Nevertheless, the choice of valve disease patients as controls might have influenced our results and a presumably greater difference in Se levels between CAD and healthy controls might be expected. The adjusted statistical model did not demonstrate a significant difference between the clinical groups, suggesting that comorbidity and disease severity might have influenced the results. This interpretation is supported by the finding that prior MI was the only significant contributor to the difference in Se levels between CAD patients and the control group.
The observed serum Se concentrations (median 0.9 µmol/L in CAD vs. 1.1 µmol/L in controls) are consistent with previous reports demonstrating lower Se status in CAD patients compared with non-CAD patients [24,25]. While some studies have reported comparable Se concentrations between CAD and non-CAD groups, reduced activity of Se-dependent enzymes, such as GPXs, has been observed in CAD patients vs. in healthy controls, and has been associated with disease severity [26,27]. Reviews and recent observational and intervention studies support a cardioprotective role of adequate Se status, associating with reduced cardiovascular morbidity, mortality, and preserved cardiac structure and function [28,29,30,31].
Serum Se concentrations below 0.8 µmol/L are considered low, and CAD subjects in the lower range may therefore have been in a state of Se deficiency with impaired selenoprotein function. Recent reports have indicated that an intake of 120 µg/day is required for the optimal functioning of the most important selenoproteins, such as GPX3 and SELENOP [32,33]. A reduction in the activity of antioxidant selenoproteins, especially GPXs and TXNRDs, may compromise redox homeostasis and promote activation of redox-sensitive inflammatory pathways [34]. Recently, in the EAT of patients with CAD, redox homeostasis was observed disrupted, leading to activation of the NLRP3 inflammasome pathway [35]. This disruption was due to an imbalance of the thioredoxin system, in which the selenoproteins TXNRDs are key components. Several key selenoproteins are highly expressed by immune cells and adipocytes [36,37]. Publicly available transcriptomes indicate the presence of multiple selenoproteins in EAT in patients with CAD, atrial fibrillation, heart failure and diabetes, not previously reported. Especially high expression levels were observed for GPX1, GPX3, and GPX4—all three possessing high antioxidant activity—and the selenium transporter SELENOP, and SELENOW. The presence of several others was also found, such as TXNRD1, SELENO-F, -M and -N, which are mainly involved in protein folding in ER, and gene and antioxidant regulation [14,15,16,17,18,19,20]. SELENOW is highly expressed in the heart and skeletal muscle of mice and its expression changed in response to oxidative stress, consistent with redox regulation [38]. GPX4 is essential in preventing lipid peroxidation and for preserving membrane integrity, and appears to be prioritized during Se deficiency in rodents [39]. However, a condition with reduced cytosolic and mitochondrial antioxidant capacity may favor inflammasome activation and local cytokine production, which may directly influence the adjacent myocardium and coronary vasculature due to the lack of a fascial barrier.
Consistent with previous studies [40], we observed lower circulating IL-6 levels in CAD patients with higher Se status. Low Se status has been linked to elevated systemic inflammatory markers, likely reflecting impaired regulation of oxidative stress and inflammatory signaling [40]. Randomized trials and meta-analyses have demonstrated that Se supplementation can reduce circulating IL-6, CRP, and P-selectin [41,42], and experimental and clinical evidence suggests that Se deficiency enhances pro-inflammatory pathways and increases systemic inflammatory responses [43].
We here relate Se status to inflammatory gene expression in EAT. We focused on components of the NLRP3 inflammasome and the downstream cytokines, in which respective proteins, i.e., IL-18 and IL-1β are cleaved into their mature forms by the NLRP3 inflammasome. EAT is metabolically active and enriched in free fatty acids and cholesterol, which can promote NLRP3 inflammasome activation through NF-κB signaling, mitochondrial ROS generation, and lysosomal stress [44,45,46]. Se-dependent antioxidant systems are critical regulators of these processes. Recently, impaired mitochondrial respiratory capacity was observed in EAT in states of CAD progression, which indicates increased ROS production [47]. The lower expression of NLRP3 and CASP1 observed at higher Se concentrations may indicate reduced NLRP3 inflammasome activity in EAT, potentially resulting in decreased release of the pro-inflammatory cytokines IL-1β and IL-18 proteins. Suppression of oxidative stress and redox regulation of the NLRP3 inflammasome and related proteins depends especially on the selenoproteins GPXs and TXNRDs, which are found in EAT [48]. Experimental studies also support this molecular mechanism, as Se deficiency has been shown to activate the NLRP3 inflammasome, while Se supplementation suppressed NLRP3 and CASP1 expression in vivo [49,50]. The elevated EAT IL18 mRNA levels observed at intermediate Se concentrations were unexpected and may reflect compensatory or feedback mechanisms in chronic inflammatory states. Although significant differences in EAT were observed according to Se concentrations, the wide confidence intervals of the IL18 mRNA results raise question of reliability, or biological variance. Notably, IL18 expression tended to decrease (p = 0.07) at Se concentrations above the 75th percentile, suggesting that adequate Se status may be required to limit local inflammation. In this context, a recent study showed that appropriate doses of Se added to standard fodder increased circulating GPX1 and reduced IL-18, IL-6 and TNF-α in serum of hyperthyroid rats [51].

Limitations

The cross-sectional design precludes causal inference, and Se status was assessed at a single time point. Molecular analyses were restricted to expression analysis of selected targets, without assessments of protein levels or functional activity. Consequently, the findings do not provide evidence of actual protein presence in EAT or of NLRP3 inflammasome activation. The results should therefore be considered hypothesis-generating and warrant further investigation. Additionally, the sample size was modest, and findings may not be generalized beyond an elderly CAD population.

5. Conclusions

Patients with CAD exhibited lower serum Se concentrations, which were associated with increased systemic inflammation and enhanced expression of NLRP3 inflammasome components in EAT. Reduced Se availability may impair the selenoprotein-dependent antioxidant defense promoting redox imbalance, NLRP3 inflammasome activation, and pro-inflammatory cytokine production in EAT. Given the close anatomical proximity of EAT to the myocardium and coronary arteries, these inflammatory signals may contribute to adverse cardiac remodeling and atherosclerosis progression. Our data generate novel hypotheses linking Se status to NLRP3 inflammasome regulation in EAT and warrant further investigation.

Supplementary Materials

The following supporting information can be downloaded at: https://www.mdpi.com/article/10.3390/antiox15060687/s1, Supplementary Table 1; footnote: Added abbreviation for EAT, and CAD Supplementary Figure 1; footnote: Added abbreviations for EAT, and SELENOP/W/M/F/N/H/S/T/K/O/I/V.

Author Contributions

Conceptualization, T.B.O., S.L. and I.G.L.; methodology, T.B.O. and I.G.L.; software, T.B.O. and F.L.O.; validation, T.B.O., S.L., T.T., S.S., J.A., U.A. and I.G.L.; formal analysis, T.B.O. and S.Å.; investigation, T.B.O., T.T., S.S. and I.G.L.; resources, S.P. and I.G.L.; data curation, T.B.O. and F.L.O.; writing—original draft preparation, T.B.O. and I.G.L.; writing—review and editing, T.B.O., F.L.O., S.L., S.Å., S.P., T.T., S.S., J.A., U.A. and I.G.L.; visualization, T.B.O. and F.L.O.; supervision, I.G.L.; project administration, T.B.O., T.T., S.S. and I.G.L.; funding acquisition, T.B.O. and I.G.L. All authors have read and agreed to the published version of the manuscript.

Funding

This research was funded by the Stein Erik Hagens Foundation for Clinical Heart Research, Oslo (Norway). Part of the analysis cost was funded by grants from Pharma Nord Aps, Vejle (Denmark). The sponsors had no role in the design, execution, interpretation, or writing of the study.

Institutional Review Board Statement

The study was conducted in accordance with the Declaration of Helsinki, and the protocol was approved by the Regional Ethics Committee of North Norway (#2016/411) on date 25 April 2016.

Informed Consent Statement

Informed consent for participation was obtained from all subjects involved in the study.

Data Availability Statement

The raw data supporting the conclusions of this article will be made available by the authors on request.

Acknowledgments

We want to express our gratitude to Vibeke Bratseth and Jeanette Konstanse Steen for excellent technical assistance in handling adipose tissue samples, and Charlotte Holst Hansen for handling patient information. We also wish to acknowledge GraphPad version 10.6.1 for providing graphic tools. Finally, we want to thank FÜRST Medical Laboratory in Oslo, Norway, for providing excellent measurements of Se concentrations with ICP-MS.

Conflicts of Interest

T.B.O. has received speaker honorarium from Pharma Nord (Denmark), otherwise the authors declare no conflicts of interest. The funders had no role in the design of the study; in the collection, analyses, or interpretation of data; in the writing of the manuscript; or in the decision to publish the results.

Abbreviations

The following abbreviations are used in this manuscript:
ASSAIL-MIAnti-Inflammatory Effects of Anakinra in ST-Elevation Myocardial Infarction
ATICHAdipose tissue in coronary heart disease
CABGCoronary artery bypass grafting
CADCoronary artery disease
CANTOSCanakinumab Anti-inflammatory Thrombosis Outcomes Study
CASP1Caspase1
CRPC-reactive protein
EATEpicardial adipose tissue
ELISAEnzyme-Linked Immunosorbent Assay
GEOGene expression omnibus
GFRGlomerular filtration rate
GPXGlutathione peroxidase
HbA1cGlycated hemoglobin A1c
ICP-MSInductively coupled plasma mass spectrometry
ILInterleukin
MIMyocardial infarction
mRNAMessenger RNA
NF-κBNuclear factor kappa B
NLRP3Nod-like receptor family pyrin domain-containing protein 3
ROSReactive oxygen species
RQRelative quantification
SELENOPSelenoprotein P
TXNRDThioredoxin reductase

References

  1. Townsend, N.; Nichols, M.; Scarborough, P.; Rayner, M. Cardiovascular disease in Europe—epidemiological update 2015. Eur. Heart J. 2015, 36, 2696–2705. [Google Scholar] [CrossRef] [Scilit] [PubMed]
  2. Shao, C.; Wang, J.; Tian, J.; Tang, Y.D. Coronary Artery Disease: From Mechanisms to Clinical Practice; Advances in Experimental Medicine and Biology; Springer: Cham, Switzerland, 2020; Volume 1177, pp. 1–36. [Google Scholar] [CrossRef] [Scilit]
  3. Christensen, R.H.; von Scholten, B.J.; Lehrskov, L.L.; Rossing, P.; Jørgensen, P.G. Epicardial adipose tissue: An emerging biomarker of cardiovascular complications in type 2 diabetes? Ther. Adv. Endocrinol. Metab. 2020, 11, 2042018820928824. [Google Scholar] [CrossRef] [Scilit]
  4. Greulich, S.; Maxhera, B.; Vandenplas, G.; de Wiza, D.H.; Smiris, K.; Mueller, H.; Heinrichs, J.; Blumensatt, M.; Cuvelier, C.; Akhyari, P.; et al. Secretory products from epicardial adipose tissue of patients with type 2 diabetes mellitus induce cardiomyocyte dysfunction. Circulation 2012, 126, 2324–2334. [Google Scholar] [CrossRef] [Scilit] [PubMed]
  5. Iacobellis, G. Local and systemic effects of the multifaceted epicardial adipose tissue depot. Nat. Rev. Endocrinol. 2015, 11, 363–371. [Google Scholar] [CrossRef] [Scilit] [PubMed]
  6. Mazurek, T.; Zhang, L.; Zalewski, A.; Mannion, J.D.; Diehl, J.T.; Arafat, H.; Sarov-Blat, L.; O’Brien, S.; Keiper, E.A.; Johnson, A.G.; et al. Human epicardial adipose tissue is a source of inflammatory mediators. Circulation 2003, 108, 2460–2466. [Google Scholar] [CrossRef] [Scilit]
  7. Sacks, H.S.; Fain, J.N.; Cheema, P.; Bahouth, S.W.; Garrett, E.; Wolf, R.Y.; Wolford, D.; Samaha, J. Depot-specific overexpression of proinflammatory, redox, endothelial cell, and angiogenic genes in epicardial fat adjacent to severe stable coronary atherosclerosis. Metab. Syndr. Relat. Disord. 2011, 9, 433–439. [Google Scholar] [CrossRef] [Scilit]
  8. Ridker, P.M.; Everett, B.M.; Thuren, T.; MacFadyen, J.G.; Chang, W.H.; Ballantyne, C.; Fonseca, F.; Nicolau, J.; Koenig, W.; Anker, S.D.; et al. Antiinflammatory Therapy with Canakinumab for Atherosclerotic Disease. N. Engl. J. Med. 2017, 377, 1119–1131. [Google Scholar] [CrossRef] [Scilit]
  9. Broch, K.; Anstensrud, A.K.; Woxholt, S.; Sharma, K.; Tøllefsen, I.M.; Bendz, B.; Aakhus, S.; Ueland, T.; Amundsen, B.H.; Damås, J.K.; et al. Randomized Trial of Interleukin-6 Receptor Inhibition in Patients with Acute ST-Segment Elevation Myocardial Infarction. J. Am. Coll. Cardiol. 2021, 77, 1845–1855. [Google Scholar] [CrossRef] [Scilit]
  10. Rayman, M.P. Selenium and human health. Lancet 2012, 379, 1256–1268. [Google Scholar] [CrossRef] [Scilit]
  11. Samuelson, G. Dietary habits and nutritional status in adolescents over Europe. An overview of current studies in the Nordic countries. Eur. J. Clin. Nutr. 2000, 54, S21–S28. [Google Scholar] [CrossRef] [Scilit]
  12. Schomburg, L. Selenoprotein P - Selenium transport protein, enzyme and biomarker of selenium status. Free Radic. Biol. Med. 2022, 191, 150–163. [Google Scholar] [CrossRef] [Scilit] [PubMed]
  13. Labunskyy, V.M.; Hatfield, D.L.; Gladyshev, V.N. Selenoproteins: Molecular Pathways and Physiological Roles. Physiol. Rev. 2014, 94, 739–777. [Google Scholar] [CrossRef] [Scilit]
  14. Camarena, V.; Sant, D.; Mohseni, M.; Salerno, T.; Zaleski, M.L.; Wang, G.; Iacobellis, G. Novel atherogenic pathways from the differential transcriptome analysis of diabetic epicardial adipose tissue. Nutr. Metab. Cardiovasc. Dis. NMCD 2017, 27, 739–750. [Google Scholar] [CrossRef] [Scilit]
  15. Chechi, K.; Vijay, J.; Voisine, P.; Mathieu, P.; Bossé, Y.; Tchernof, A.; Grundberg, E.; Richard, D. UCP1 expression-associated gene signatures of human epicardial adipose tissue. JCI Insight 2019, 4, e123618. [Google Scholar] [CrossRef] [Scilit] [PubMed]
  16. He, S.; Zhu, H.; Zhang, J.; Yang, X.; Zhao, L. Genome-wide screening for circRNAs in epicardial adipose tissue of heart failure patients with preserved ejection fraction. Am. J. Transl. Res. 2023, 15, 4610–4619. [Google Scholar] [PubMed]
  17. Peng, Y.; Su, P.; Zhao, L. Long noncoding RNA and messenger RNA profiling in epicardial adipose tissue of patients with new-onset postoperative atrial fibrillation after coronary artery bypass grafting. Eur. J. Med. Res. 2024, 29, 134. [Google Scholar] [CrossRef] [Scilit]
  18. Vyas, V.; Blythe, H.; Wood, E.G.; Sandhar, B.; Sarker, S.J.; Balmforth, D.; Ambekar, S.G.; Yap, J.; Edmondson, S.J.; Di Salvo, C.; et al. Obesity and diabetes are major risk factors for epicardial adipose tissue inflammation. JCI Insight 2021, 6, e145495. [Google Scholar] [CrossRef] [Scilit]
  19. Zhao, L.; Ma, Z.; Guo, Z.; Zheng, M.; Li, K.; Yang, X. Analysis of long non-coding RNA and mRNA profiles in epicardial adipose tissue of patients with atrial fibrillation. Biomed. Pharmacother. 2020, 121, 109634. [Google Scholar] [CrossRef] [Scilit]
  20. Ryk, A.; Marcinkiewicz, A.; Chrzanowski, J.; Michalak, A.M.; Dróżdz, I.; Burzyński, J.; Krejca, M.; Fendler, W. Cholesin receptor signalling is active in cardiovascular system-associated adipose tissue and correlates with SGLT2i treatment in patients with diabetes. Cardiovasc. Diabetol. 2024, 23, 211. [Google Scholar] [CrossRef] [Scilit]
  21. An, N.; Gao, Y.; Si, Z.; Zhang, H.; Wang, L.; Tian, C.; Yuan, M.; Yang, X.; Li, X.; Shang, H.; et al. Regulatory Mechanisms of the NLRP3 Inflammasome, a Novel Immune-Inflammatory Marker in Cardiovascular Diseases. Front. Immunol. 2019, 10, 1592. [Google Scholar] [CrossRef] [Scilit]
  22. Åkra, S.; Seljeflot, I.; Braathen, B.; Bratseth, V.; Hansen, C.H.; Arnesen, H.; Tønnessen, T.; Solheim, S. The NLRP3 inflammasome activation in subcutaneous, epicardial and pericardial adipose tissue in patients with coronary heart disease undergoing coronary by-pass surgery. Atheroscler. Plus 2022, 48, 47–54. [Google Scholar] [CrossRef] [Scilit] [PubMed]
  23. Livak, K.J.; Schmittgen, T.D. Analysis of relative gene expression data using real-time quantitative PCR and the 2(-Delta Delta C(T)) Method. Methods 2001, 25, 402–408. [Google Scholar] [CrossRef] [Scilit]
  24. Olasińska-Wiśniewska, A.; Urbanowicz, T.; Misterski, M.; Grygier, M.; Araszkiewicz, A.F.; Wojewódzki, F.; Stefaniak, S.; Marcinkowski, P.; Kauf, I.; Jemielity, M.; et al. Concentration of Trace Elements in Patients with Aortic Stenosis and Coexisting Coronary Artery Disease: A Pilot Study. J. Clin. Med. 2025, 15, 8. [Google Scholar] [CrossRef] [Scilit] [PubMed]
  25. Hassanzadeh, M.; Faridhosseini, R.; Mahini, M.; Faridhosseini, F.; Ranjbar, A. Serum Levels of TNF-, IL-6, and Selenium in Patients with Acute and Chronic Coronary Artery Disease. Iran. J. Immunol. 2006, 3, 142–145. [Google Scholar] [CrossRef] [PubMed]
  26. Parizadeh, S.M.; Moohebati, M.; Ghafoori, F.; Ghayour-Mobarhan, M.; Kazemi-Bajestani, S.M.; Tavallaie, S.; Azimi-Nezhad, M.; Ferns, G.A. Serum selenium and glutathione peroxidase concentrations in Iranian patients with angiography-defined coronary artery disease. Angiology 2009, 60, 186–191. [Google Scholar] [CrossRef] [Scilit]
  27. Yegin, A.; Yegin, H.; Alicigüzel, Y.; Deger, N.; Semiz, E. Erythrocyte selenium-glutathione peroxidase activity is lower in patients with coronary atherosclerosis. Jpn. Heart J. 1997, 38, 793–798. [Google Scholar] [CrossRef] [Scilit]
  28. Liu, H.; Xu, H.; Huang, K. Selenium in the prevention of atherosclerosis and its underlying mechanisms. Metallomics 2017, 9, 21–37. [Google Scholar] [CrossRef] [Scilit]
  29. Sun, Y.; Mao, Q.; Zhou, D.; Tian, J.; Du, H.; Yu, Q.; Zhao, J.; Duan, W.; Liu, C.; Duan, Y.; et al. Associations of multiple blood metals with cardiac structure and function: A cross-sectional study in a CAD population. Env. Pollut. 2024, 360, 124718. [Google Scholar] [CrossRef] [Scilit]
  30. Alehagen, U.; Aaseth, J.; Johansson, P. Reduced Cardiovascular Mortality 10 Years after Supplementation with Selenium and Coenzyme Q10 for Four Years: Follow-Up Results of a Prospective Randomized Double-Blind Placebo-Controlled Trial in Elderly Citizens. PLoS ONE 2015, 10, e0141641. [Google Scholar] [CrossRef] [Scilit]
  31. Dunning, B.J.; Bourgonje, A.R.; Bulthuis, M.L.C.; Alexander, J.; Aaseth, J.O.; Larsson, A.; van Goor, H.; Alehagen, U. Selenium and coenzyme Q(10) improve the systemic redox status while reducing cardiovascular mortality in elderly population-based individuals. Free Radic. Biol. Med. 2023, 204, 207–214. [Google Scholar] [CrossRef] [Scilit]
  32. Alexander, J.; Olsen, A.K. Selenium - a scoping review for Nordic Nutrition Recommendations 2023. Food Nutr. Res. 2023, 67, 10320. [Google Scholar] [CrossRef] [Scilit]
  33. Alexander, J.; Aaseth, J.O.; Schomburg, L.; Chillon, T.S.; Larsson, A.; Alehagen, U. Circulating Glutathione Peroxidase-3 in Elderly-Association with Renal Function, Cardiovascular Mortality, and Impact of Selenium and Coenzyme Q(10) Supplementation. Antioxidants 2024, 13, 1566. [Google Scholar] [CrossRef] [Scilit]
  34. Hariharan, S.; Dharmaraj, S. Selenium and selenoproteins: It’s role in regulation of inflammation. Inflammopharmacology 2020, 28, 667–695. [Google Scholar] [CrossRef] [Scilit]
  35. Shateri, H.; Manafi, B.; Tayebinia, H.; Karimi, J.; Khodadadi, I. Imbalance in thioredoxin system activates NLRP3 inflammasome pathway in epicardial adipose tissue of patients with coronary artery disease. Mol. Biol. Rep. 2021, 48, 1181–1191. [Google Scholar] [CrossRef] [Scilit]
  36. Avery, J.C.; Hoffmann, P.R. Selenium, Selenoproteins, and Immunity. Nutrients 2018, 10, 1203. [Google Scholar] [CrossRef] [Scilit]
  37. Tinkov, A.A.; Ajsuvakova, O.P.; Filippini, T.; Zhou, J.C.; Lei, X.G.; Gatiatulina, E.R.; Michalke, B.; Skalnaya, M.G.; Vinceti, M.; Aschner, M.; et al. Selenium and Selenoproteins in Adipose Tissue Physiology and Obesity. Biomolecules 2020, 10, 658. [Google Scholar] [CrossRef] [Scilit] [PubMed]
  38. Loflin, J.; Lopez, N.; Whanger, P.D.; Kioussi, C. Selenoprotein W during development and oxidative stress. J. Inorg. Biochem. 2006, 100, 1679–1684. [Google Scholar] [CrossRef] [Scilit]
  39. Sunde, R.A.; Raines, A.M. Selenium regulation of the selenoprotein and nonselenoprotein transcriptomes in rodents. Adv. Nutr. 2011, 2, 138–150. [Google Scholar] [CrossRef] [Scilit] [PubMed]
  40. Barchielli, G.; Capperucci, A.; Tanini, D. The Role of Selenium in Pathologies: An Updated Review. Antioxidants 2022, 11, 251. [Google Scholar] [CrossRef] [Scilit] [PubMed]
  41. Gholizadeh, M.; Khalili, A.; Roodi, P.B.; Saeedy, S.A.G.; Najafi, S.; Keshavarz Mohammadian, M.; Djafarian, K. Selenium supplementation decreases CRP and IL-6 and increases TNF-alpha: A systematic review and meta-analysis of randomized controlled trials. J. Trace Elem. Med. Biol. 2023, 79, 127199. [Google Scholar] [CrossRef] [Scilit]
  42. Alehagen, U.; Lindahl, T.L.; Aaseth, J.; Svensson, E.; Johansson, P. Levels of sP-selectin and hs-CRP Decrease with Dietary Intervention with Selenium and Coenzyme Q10 Combined: A Secondary Analysis of a Randomized Clinical Trial. PLoS ONE 2015, 10, e0137680. [Google Scholar] [CrossRef] [Scilit]
  43. Duntas, L.H. Selenium and inflammation: Underlying anti-inflammatory mechanisms. Horm. Metab. Res. 2009, 41, 443–447. [Google Scholar] [CrossRef] [Scilit]
  44. Iacobellis, G.; Bianco, A.C. Epicardial adipose tissue: Emerging physiological, pathophysiological and clinical features. Trends Endocrinol. Metab. TEM. 2011, 22, 450–457. [Google Scholar] [CrossRef] [Scilit]
  45. Jo, E.K.; Kim, J.K.; Shin, D.M.; Sasakawa, C. Molecular mechanisms regulating NLRP3 inflammasome activation. Cell. Mol. Immunol. 2016, 13, 148–159. [Google Scholar] [CrossRef] [Scilit]
  46. Legrand-Poels, S.; Esser, N.; L’Homme, L.; Scheen, A.; Paquot, N.; Piette, J. Free fatty acids as modulators of the NLRP3 inflammasome in obesity/type 2 diabetes. Biochem. Pharmacol. 2014, 92, 131–141. [Google Scholar] [CrossRef] [Scilit] [PubMed]
  47. Nakajima, T.; Yokota, T.; Shingu, Y.; Yamada, A.; Iba, Y.; Ujihira, K.; Wakasa, S.; Ooka, T.; Takada, S.; Shirakawa, R.; et al. Impaired mitochondrial oxidative phosphorylation capacity in epicardial adipose tissue is associated with decreased concentration of adiponectin and severity of coronary atherosclerosis. Sci. Rep. 2019, 9, 3535. [Google Scholar] [CrossRef] [Scilit]
  48. Rusetskaya, N.Y.; Loginova, N.Y.; Pokrovskaya, E.P.; Chesovskikh, Y.S.; Titova, L.E. Redox regulation of the NLRP3-mediated inflammation and pyroptosis. Biomed. Khim. 2023, 69, 333–352. [Google Scholar] [CrossRef] [Scilit]
  49. An, Z.; Hu, H.; Wang, Q.; Qiu, Y.; Chu, J.; Xia, Y.; Li, S. Dietary Selenium deficiency activates the NLRP3 inflammasome to induce gallbladder pyroptosis by regulating glycolysis and histone lactylation through ROS/HIF-1α pathway. J. Nutr. Biochem. 2026, 147, 110118. [Google Scholar] [CrossRef] [Scilit] [PubMed]
  50. Bi, C.L.; Zhang, S.J.; Shen, Y.Z.; Pauline, M.; Li, H.; Tang, H. Selenium Plays an Anti-Inflammatory Role by Regulation NLRP3 Inflammasome in Staphylococcus aureus-Infected Mouse Mammary Gland. Biol. Trace Elem. Res. 2021, 199, 604–610. [Google Scholar] [CrossRef] [Scilit] [PubMed]
  51. Yoldas, A.; Bahtiyar, N.; Aydemir, B.; Toplan, S. Evaluation of selenoproteins and proinflammatory cytokines in L-thyroxine-induced hyperthyroid rats: Effects of selenium supplementation. Arch. Endocrinol. Metab. 2025, 69, e240444. [Google Scholar] [CrossRef] [Scilit]
Figure 1. Schematic illustration of the study. The ATICH (Adipose Tissue In Coronary Heart) trial included patients undergoing coronary artery bypass grafting (CABG) (n = 52) and subjects with valve diseases undergoing valve replacement (n = 22), included as controls. Arterial blood samples were taken from a.radialis, and serum was prepared for Se analysis measured by inductively coupled plasma mass spectrometry (ICP-MS), and serum concentrations of the selected cytokines IL-18, IL-6 and hsCRP. Biopsies from epicardial adipose tissue were obtained between the right coronary artery and the pulmonary artery during open chest surgery from CAD patients and controls. mRNA levels of mediators of innate immunity, the NLRP3, CASP1, IL1B, IL18, and IL6 were measured by qPCR. Created in BioRender. Opdahl, F.L. (2026) https://BioRender.com/9t29sbn.
Antioxidants 15 00687 g001
Figure 2. Serum Se concentrations in patients in the ATICH study. Violin plot showing the distribution of Se concentration (µmol/L) in CAD patients and controls. Red plot presents concentrations in the CAD group, median (range): 0.9 (0.4–1.9). Orange plot presents concentrations in the control group, median (range): 1.0 (0.7–1.9). The dashed lines in the figure illustrate the median level.
Antioxidants 15 00687 g002
Figure 3. Protein and mRNA variables according to median Se concentration in CAD patients. (a) Distribution of cytokines in serum according to median Se levels. Light and dark orange columns indicate Se < and > median levels, respectively. Bars represent 25, 75 percentiles. p-values indicate differences in levels of markers according to median Se levels (Mann–Whitney U test) * p < 0.05; ns: non-significant; IL: Interleukin; CRP; C-reactive protein. (b) Distribution of mRNA levels in EAT according to median Se levels. Light and dark burgundy columns indicate Se < and > median levels, respectively. Bars represent 25, 75 percentiles; p-values indicate differences in levels of markers according to median Se levels (Mann–Whitney U test); * p < 0.05; ** p < 0.01; ns: non-significant; NLRP3: Nod-like receptor family pyrin domain-containing protein 3; CASP1: Caspase 1; IL: Interleukin.
Antioxidants 15 00687 g003
Table 1. Clinical characteristics of the study population.
CAD Patients (n = 52)Controls (n = 22)p-Value
Age (years)66.5 (62,71.8)69.0 (63, 71.5)0.397
Male (%)40 (76.9%)11 (50%)0.040
Smoker (previous/current)31 (59.6%)10 (45.5%)0.217
Weight (kg)85 (70.3, 95.5)82.5 (77.5, 107.0)0.445
Height (m)1.77 (1.68, 1.81)1.75 (1.67, 1.82)0.939
Waist (cm)92 (86, 98)90 (88, 101)0.843
Waist to height ratio0.53 (0.49, 0.56)0.52 (0.49, 0.55)0.646
BMI (kg/m2)27.3 (23.8, 30.1)28.4 (24.6, 31.6)0.366
SBP (mmHg)140 (125, 160)140 (115, 163)0.825
DBP (mmHg)80 (70, 87)79 (70, 86)0.752
Selenium (µmol/L)0.90 (0.80, 1.10)1.1 (0.98, 1.10)0.025
Cardiovascular status   
Previous MI (%)20 (38.5%)2 (9.1%)0.025
Angina (%)24 (46.2%)0 (0%)<0.001
PCI (%)20 (38.5%)0 (0%)0.002
Hypertension (%)28 (53.9%)9 (40.9%)0.309
Diabetes type I and II (%)14 (26.9%)3 (13.6%)0.214
Heart failure (%)3 (5.8%)1 (4.5%)1.000
Medications   
Aspirin (%)45 (86.5%)9 (40.9%)<0.001
Other antiplatelet (%)14 (26.9%)0 (0%)<0.001
ACEi/ATII (%)24 (46.2%)11 (50%)1.000
Beta-blockers (%)32 (61.5%)6 (27.3%)0.015
Statins (%)37 (71.2%)11 (50%)0.081
Other lipid-lowering agents (%)10 (19.2%)1 (4.5%)0.105
Insulin (%)6 (11.5%)0 (0%)0.232
Anti-diabetic drugs (%)11 (21.2%)3 (13.6%)0.450
Diuretics (%)7 (13.5%)5 (22.7%)0.275
Laboratory values   
hsCRP (mg/L)0.91 (0.49, 1.77)1.00 (1.00, 2.00)0.976
IL-6 (pg/mL)2.56 (2.02, 3.29)2.45 (1.79, 3.09)0.390
IL-18 (ng/mL)230 (171, 335)223 (182, 279)0.614
Troponin T (ng/L)13 (9, 22)11.5 (9, 25)0.947
Total Chol (mmol/L)3.1 (2.7, 3.4)3.9 (2.8, 4.6)0.026
HDL-Chol (mmol/L)0.97 (0.75, 1.12)1.10 (0.87, 1.30)0.064
LDL-Chol (mmol/L)1.83 (1.4, 2.2)2.18 (1.8, 2.9)0.020
Triglycerides (mmol/L)1.22 (1.0, 1.8)1.02 (0.9, 1.7)0.293
Glucose (mmol/L)5.6 (4.9, 6.6)5.6 (4.9, 6.3)0.679
HbA1c (mmol/mol)39 (36, 51)36 (33, 38)0.011
GFR (%)90 (75, 95)80 (68, 91)0.030
Creatinine (μmol/L)76 (67, 85)80 (64.8, 91)0.434
Uric acid (μmol/L)313 (271, 362)317 (258, 396)0.532
These characteristics and measurements have previously been published as part of the study by Åkra, S. et al. [22]. Levels are median (25, 75 percentiles), or numbers (%). p-Values < 0.05 are bolded. BMI: Body Mass Index; SBP: Systolic Blood Pressure; DBP: Diastolic Blood Pressure; MI: Myocardial Infarction; PCI: Percutaneous Coronary Intervention; ACEi: Angiotensin-Converting Enzyme inhibitors; ATII: Angiotensin II receptor antagonist; hsCRP: high-sensitivity C-reactive protein; Total Chol: total cholesterol; HDL-Chol: high-density lipoprotein cholesterol; LDL-Chol: low-density lipoprotein cholesterol; HbA1C: glycosylated hemoglobin A1c; GFR: Glomerular filtration rate.
Table 2. Linear multiple regression with log Se concentration as the dependent variable group.
VariableStd. CoefficientStd. Errort-Valuep-Value
Group0.2390.0401.4930.141
Age−0.1060.005−0.8090.422
Sex−0.1410.035−0.9820.331
Previous MI−0.3040.035−2.1400.037
Total Chol−0.0530.020−0.3660.716
HbA1c0.0490.0130.0370.715
GFR0.1250.0000.9680.337
ASA−0.0590.037−0.4100.683
Beta-blockers0.0700.0340.4710.640
The p-Value < 0.05 is bolded. MI: myocardial infarction; Total Chol: total cholesterol; HbA1c: glycosylated hemoglobin A1c; GFR: glomerular filtration rate; ASA: aspirin. ANOVA model; R2: 0.165, VIF: <1.651, all, indicating no multicollinearity.
Table 3. Se concentrations in different clinical CAD groups.
Clinical SubgroupsSe Concentrationp-Value
Male (40)—Female (12)1.00 (0.80, 1.10)—0.85 (0.70, 1.08)0.27
Previous MI Yes (20)—No (32)0.90 (0.70, 1.10)—1.00 (0.80, 1.10)0.19
Hypertension Yes (28)—No (24)1.10 (0.90, 1.10)—0.90 (0.73, 1.08)0.13
Diabetes type I and II Yes (12)—No (40)0.95 (0.83, 1.18)—0.90 (0.80, 1.10)0.42
Smoking status a Yes (14)—No (38)0.85 (0.73, 1.08)—1.00 (0.80, 1.10)0.23
Medication b  
Statins Yes (37)—No (15)1.00 (0.80, 1.10)—0.90 (0.80, 1.10)0.68
ASA Yes (45)—No (7)1.00 (0.80, 1.10)—0.90 (0.60, 1.60)0.67
Other anti-platelets Yes (14)—No (38)0.85 (0.80, 0.95)—1.00 (0.80, 1.10)0.054
Beta-blockers Yes (32)—No (20)0.90 (0.80, 1.00)—0.95 (0.80, 1.10)0.51
Number of patients given in the clinical subgroups. Values are median (25, 75 percentiles). p-values represent statistical differences between clinical groups (Mann–Whitney U test). MI: myocardial infarction, Diabetes type I and II; ASA: aspirin; a current smokers vs. no; b medications known to affects Se absorption or concentration (NIH Office of Dietary Supplements; https://ods.od.nih.gov).
Disclaimer/Publisher’s Note: The statements, opinions and data contained in all publications are solely those of the individual author(s) and contributor(s) and not of MDPI and/or the editor(s). MDPI and/or the editor(s) disclaim responsibility for any injury to people or property resulting from any ideas, methods, instructions or products referred to in the content.