
Improvement of the Structure and Antioxidant Activity of Protein–Polyphenol Complexes in Barley Malts Using Roasting Methods


Abstract
1. Introduction
2. Materials and Methods
2.1. Chemicals and Materials
2.2. Preparation of Protein–Polyphenol Complexes and Polyphenol-Free Proteins
2.2.1. Extraction of Protein–Polyphenol Complexes
2.2.2. Extraction of Polyphenol-Free Proteins
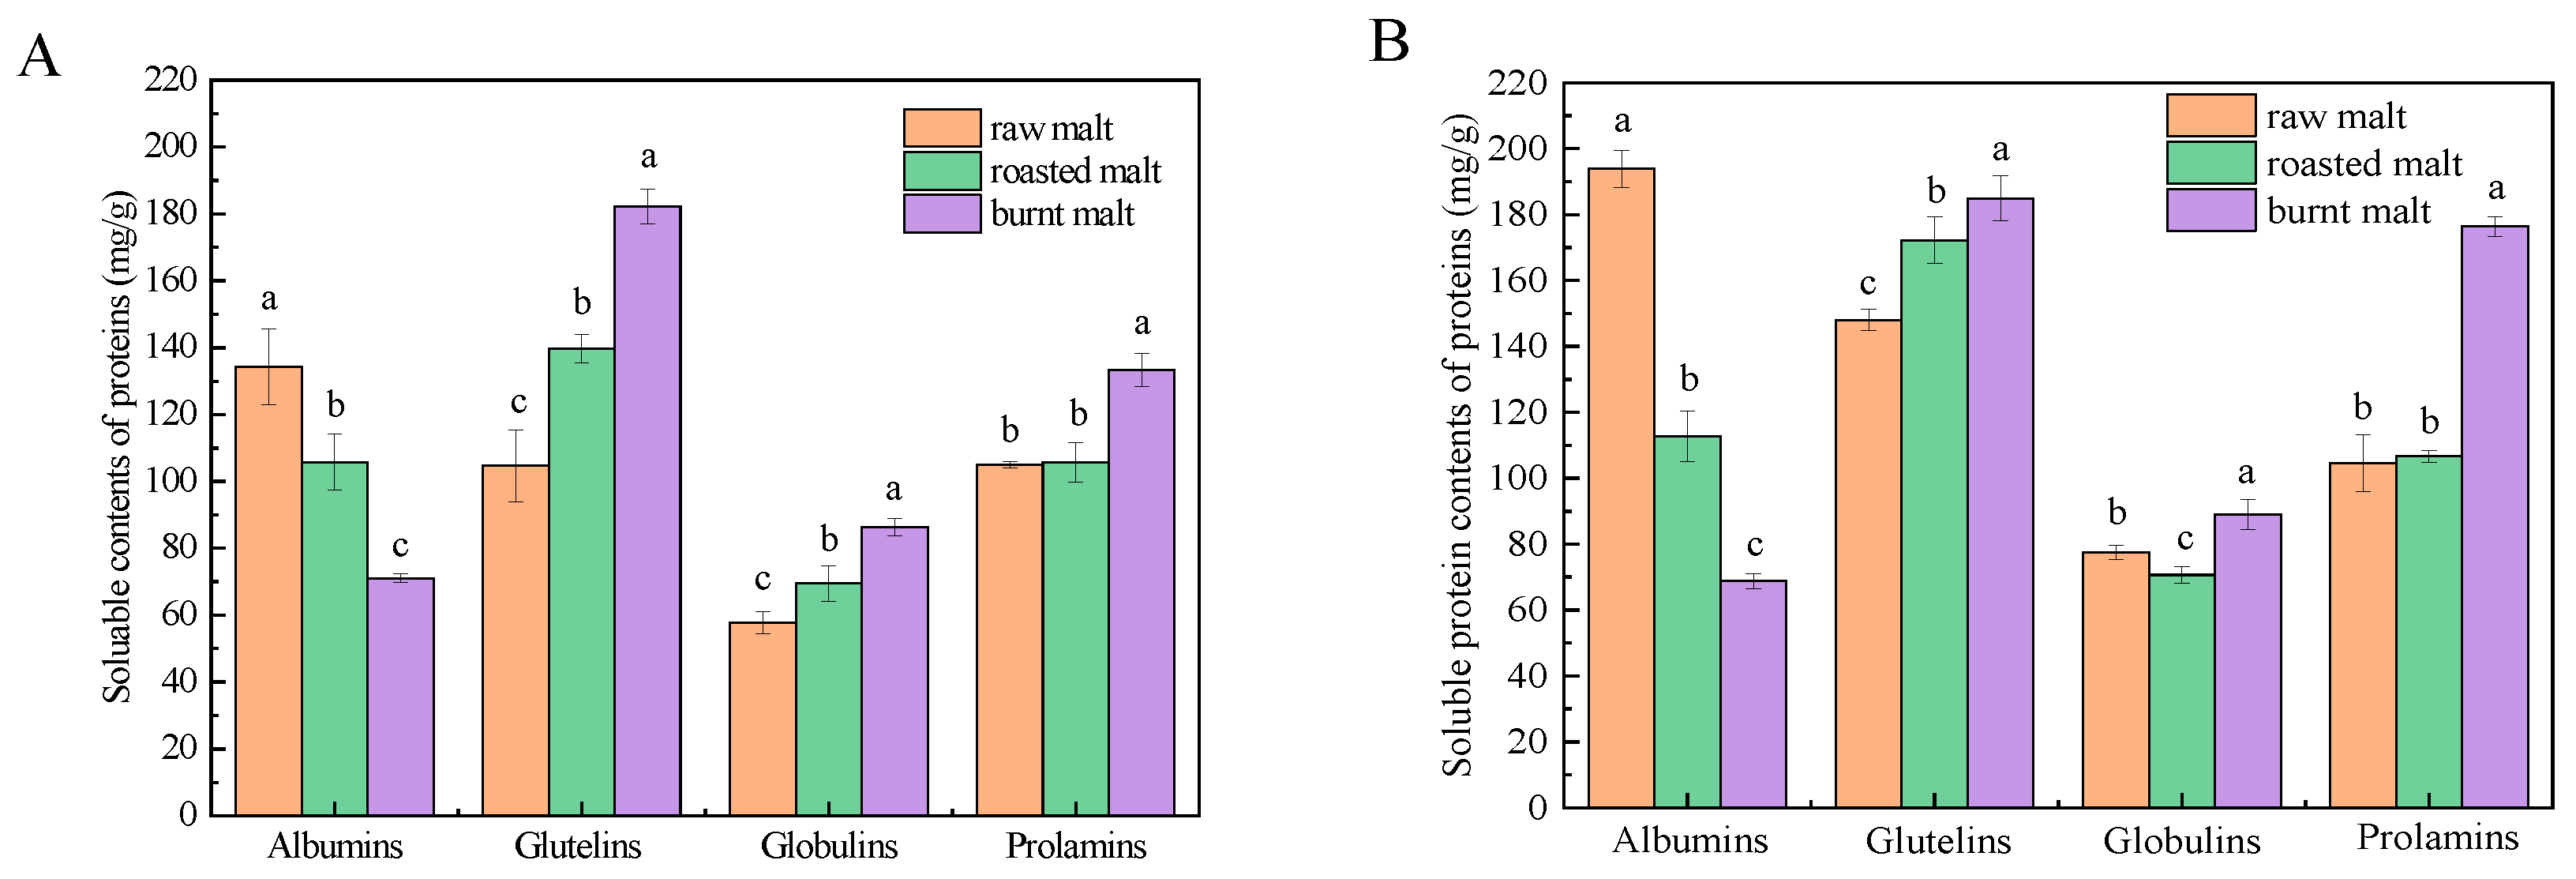
2.3. Determination of the Soluble Protein Content
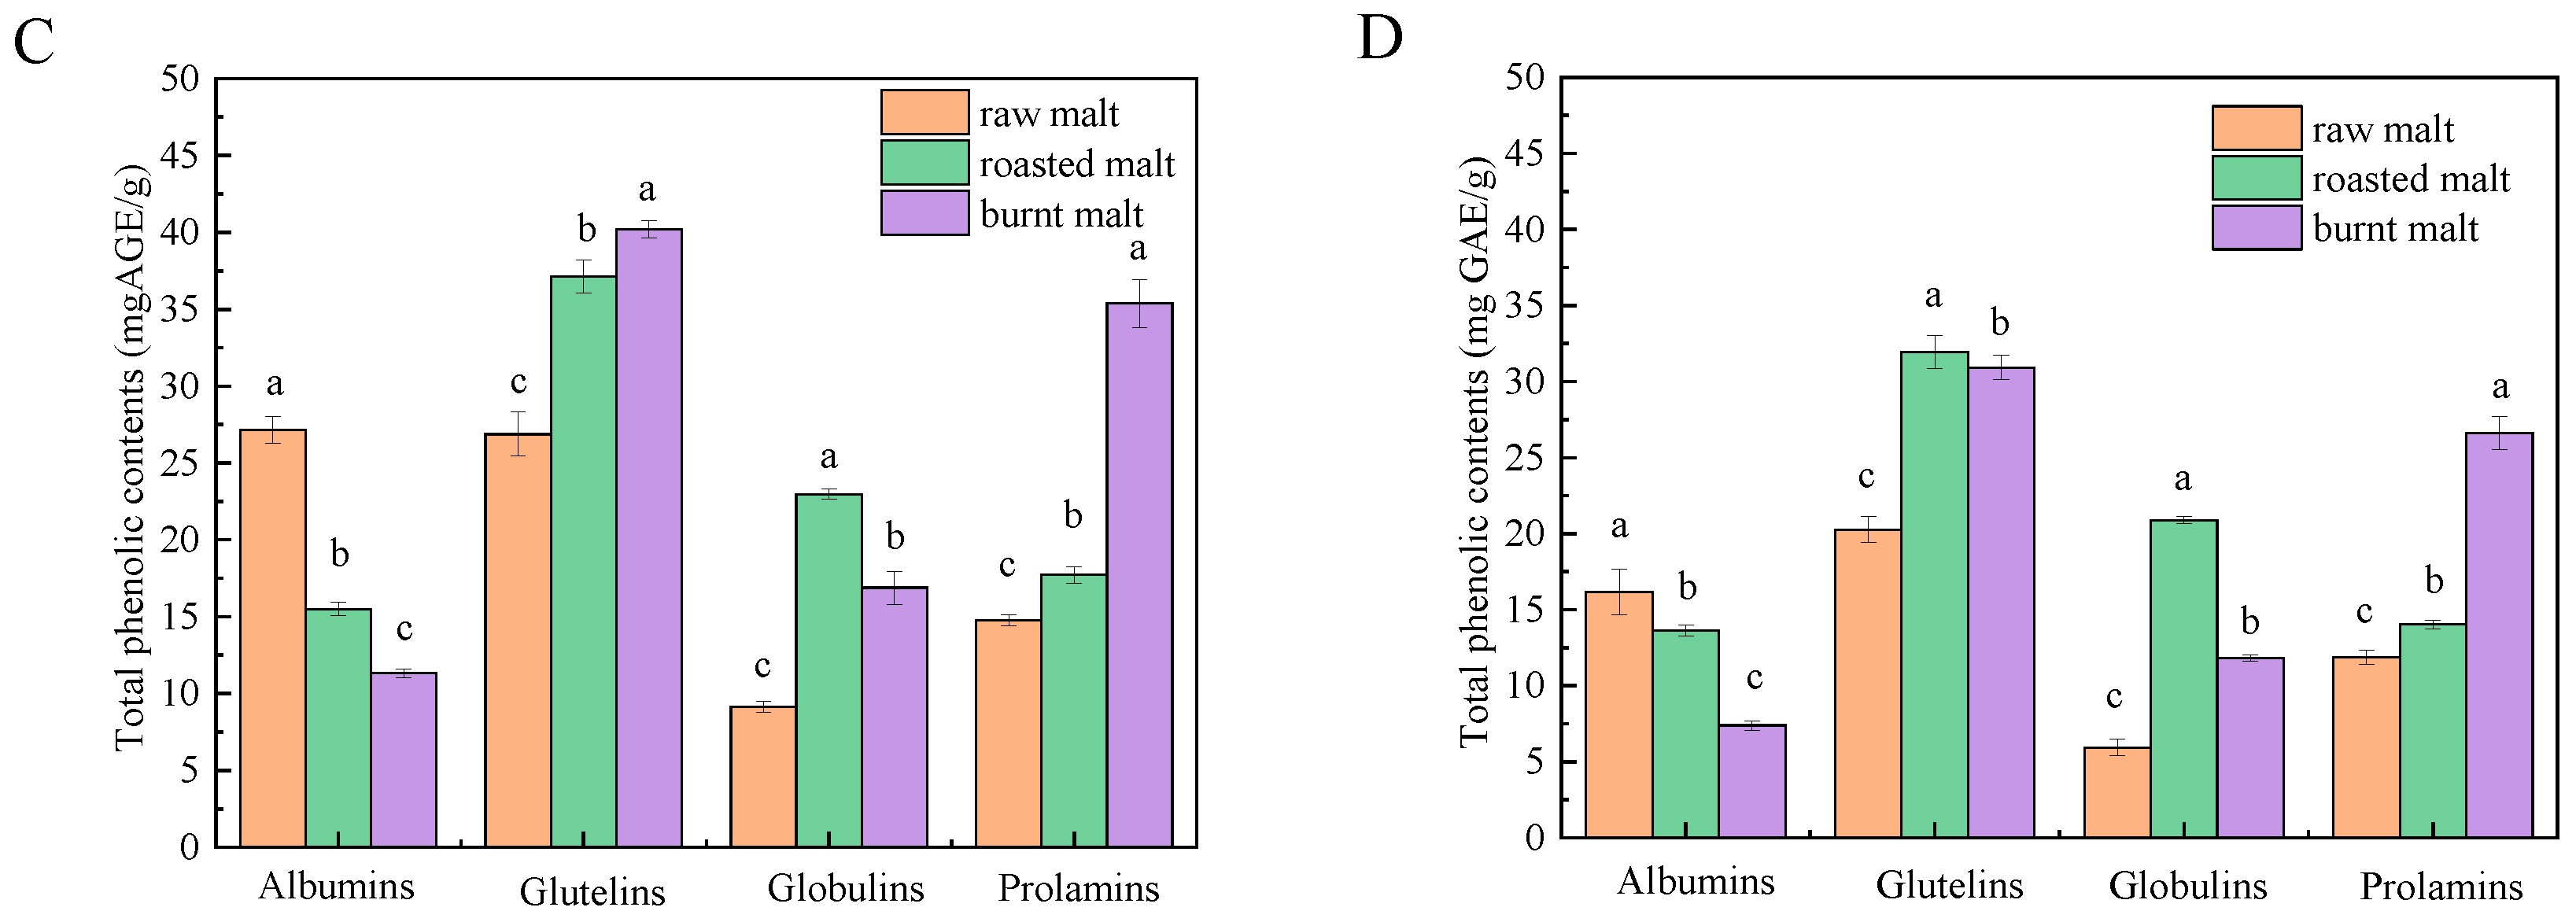
2.4. Determination of Polyphenol Content
2.5. ABTS+ Radical Scavenging Activity Assay
2.6. Ferric Ion-Reducing Antioxidant Power
2.7. Oxygen Radical Absorbance Capacity
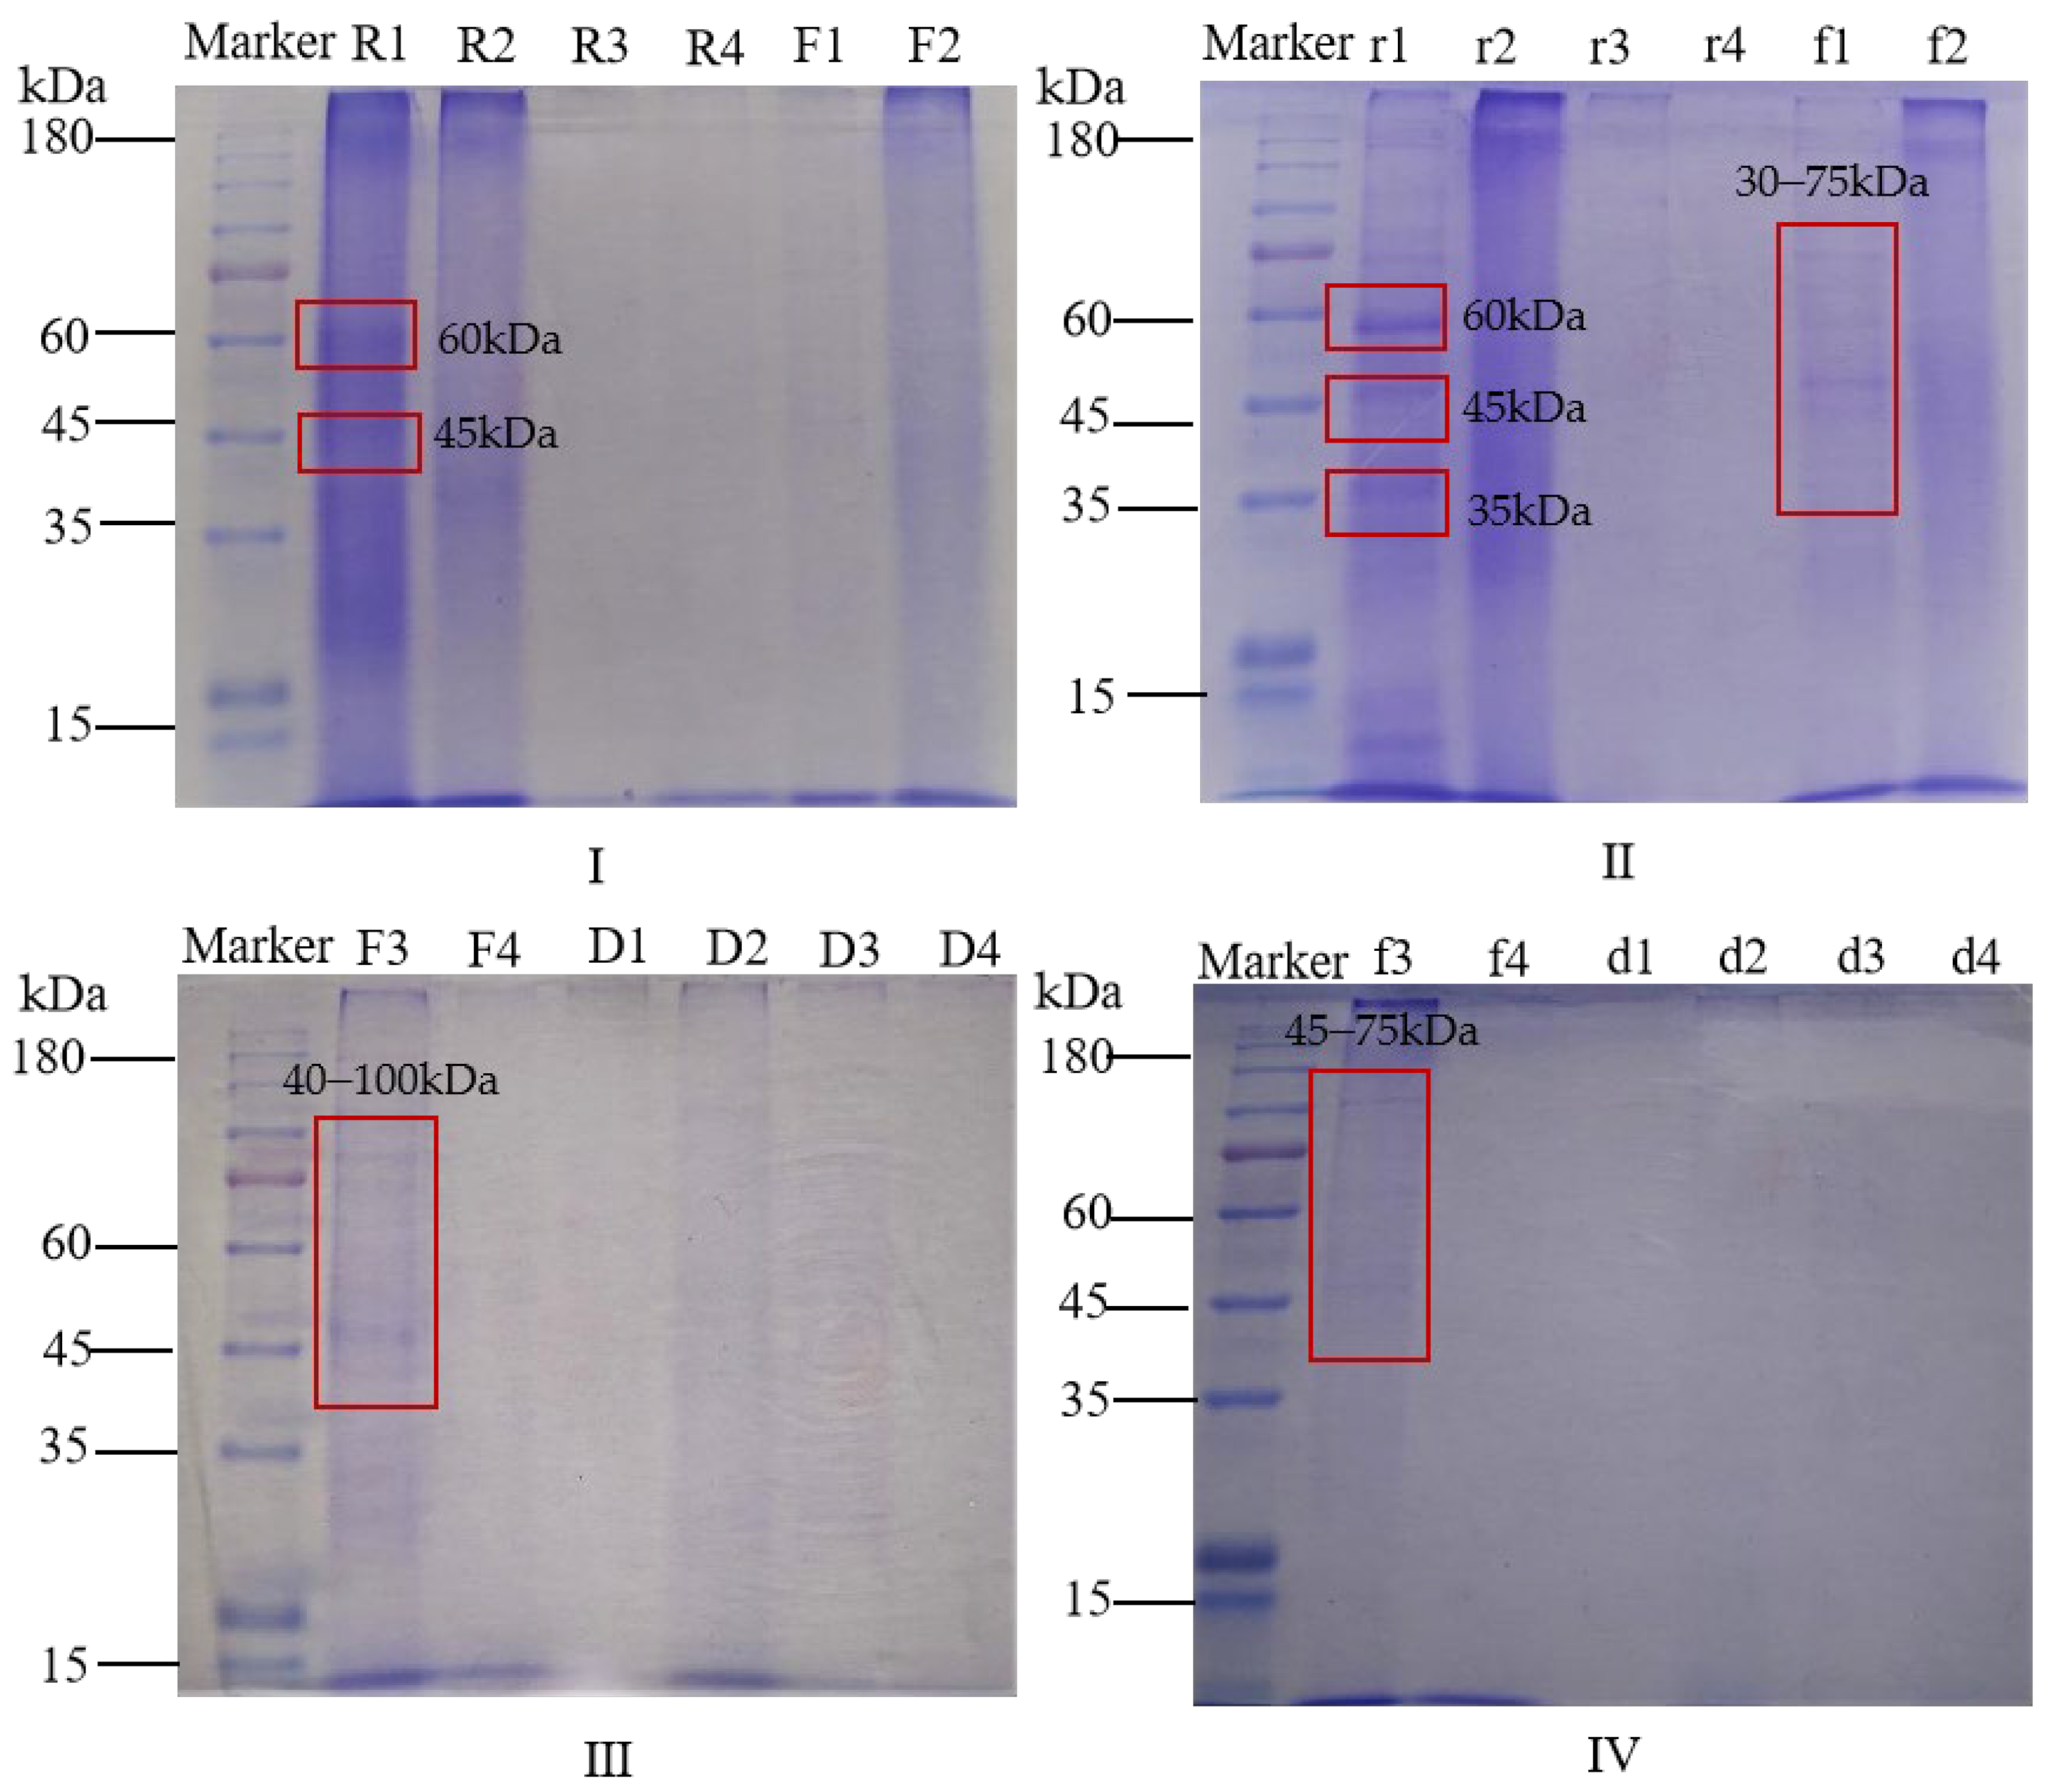
2.8. SDS-PAGE
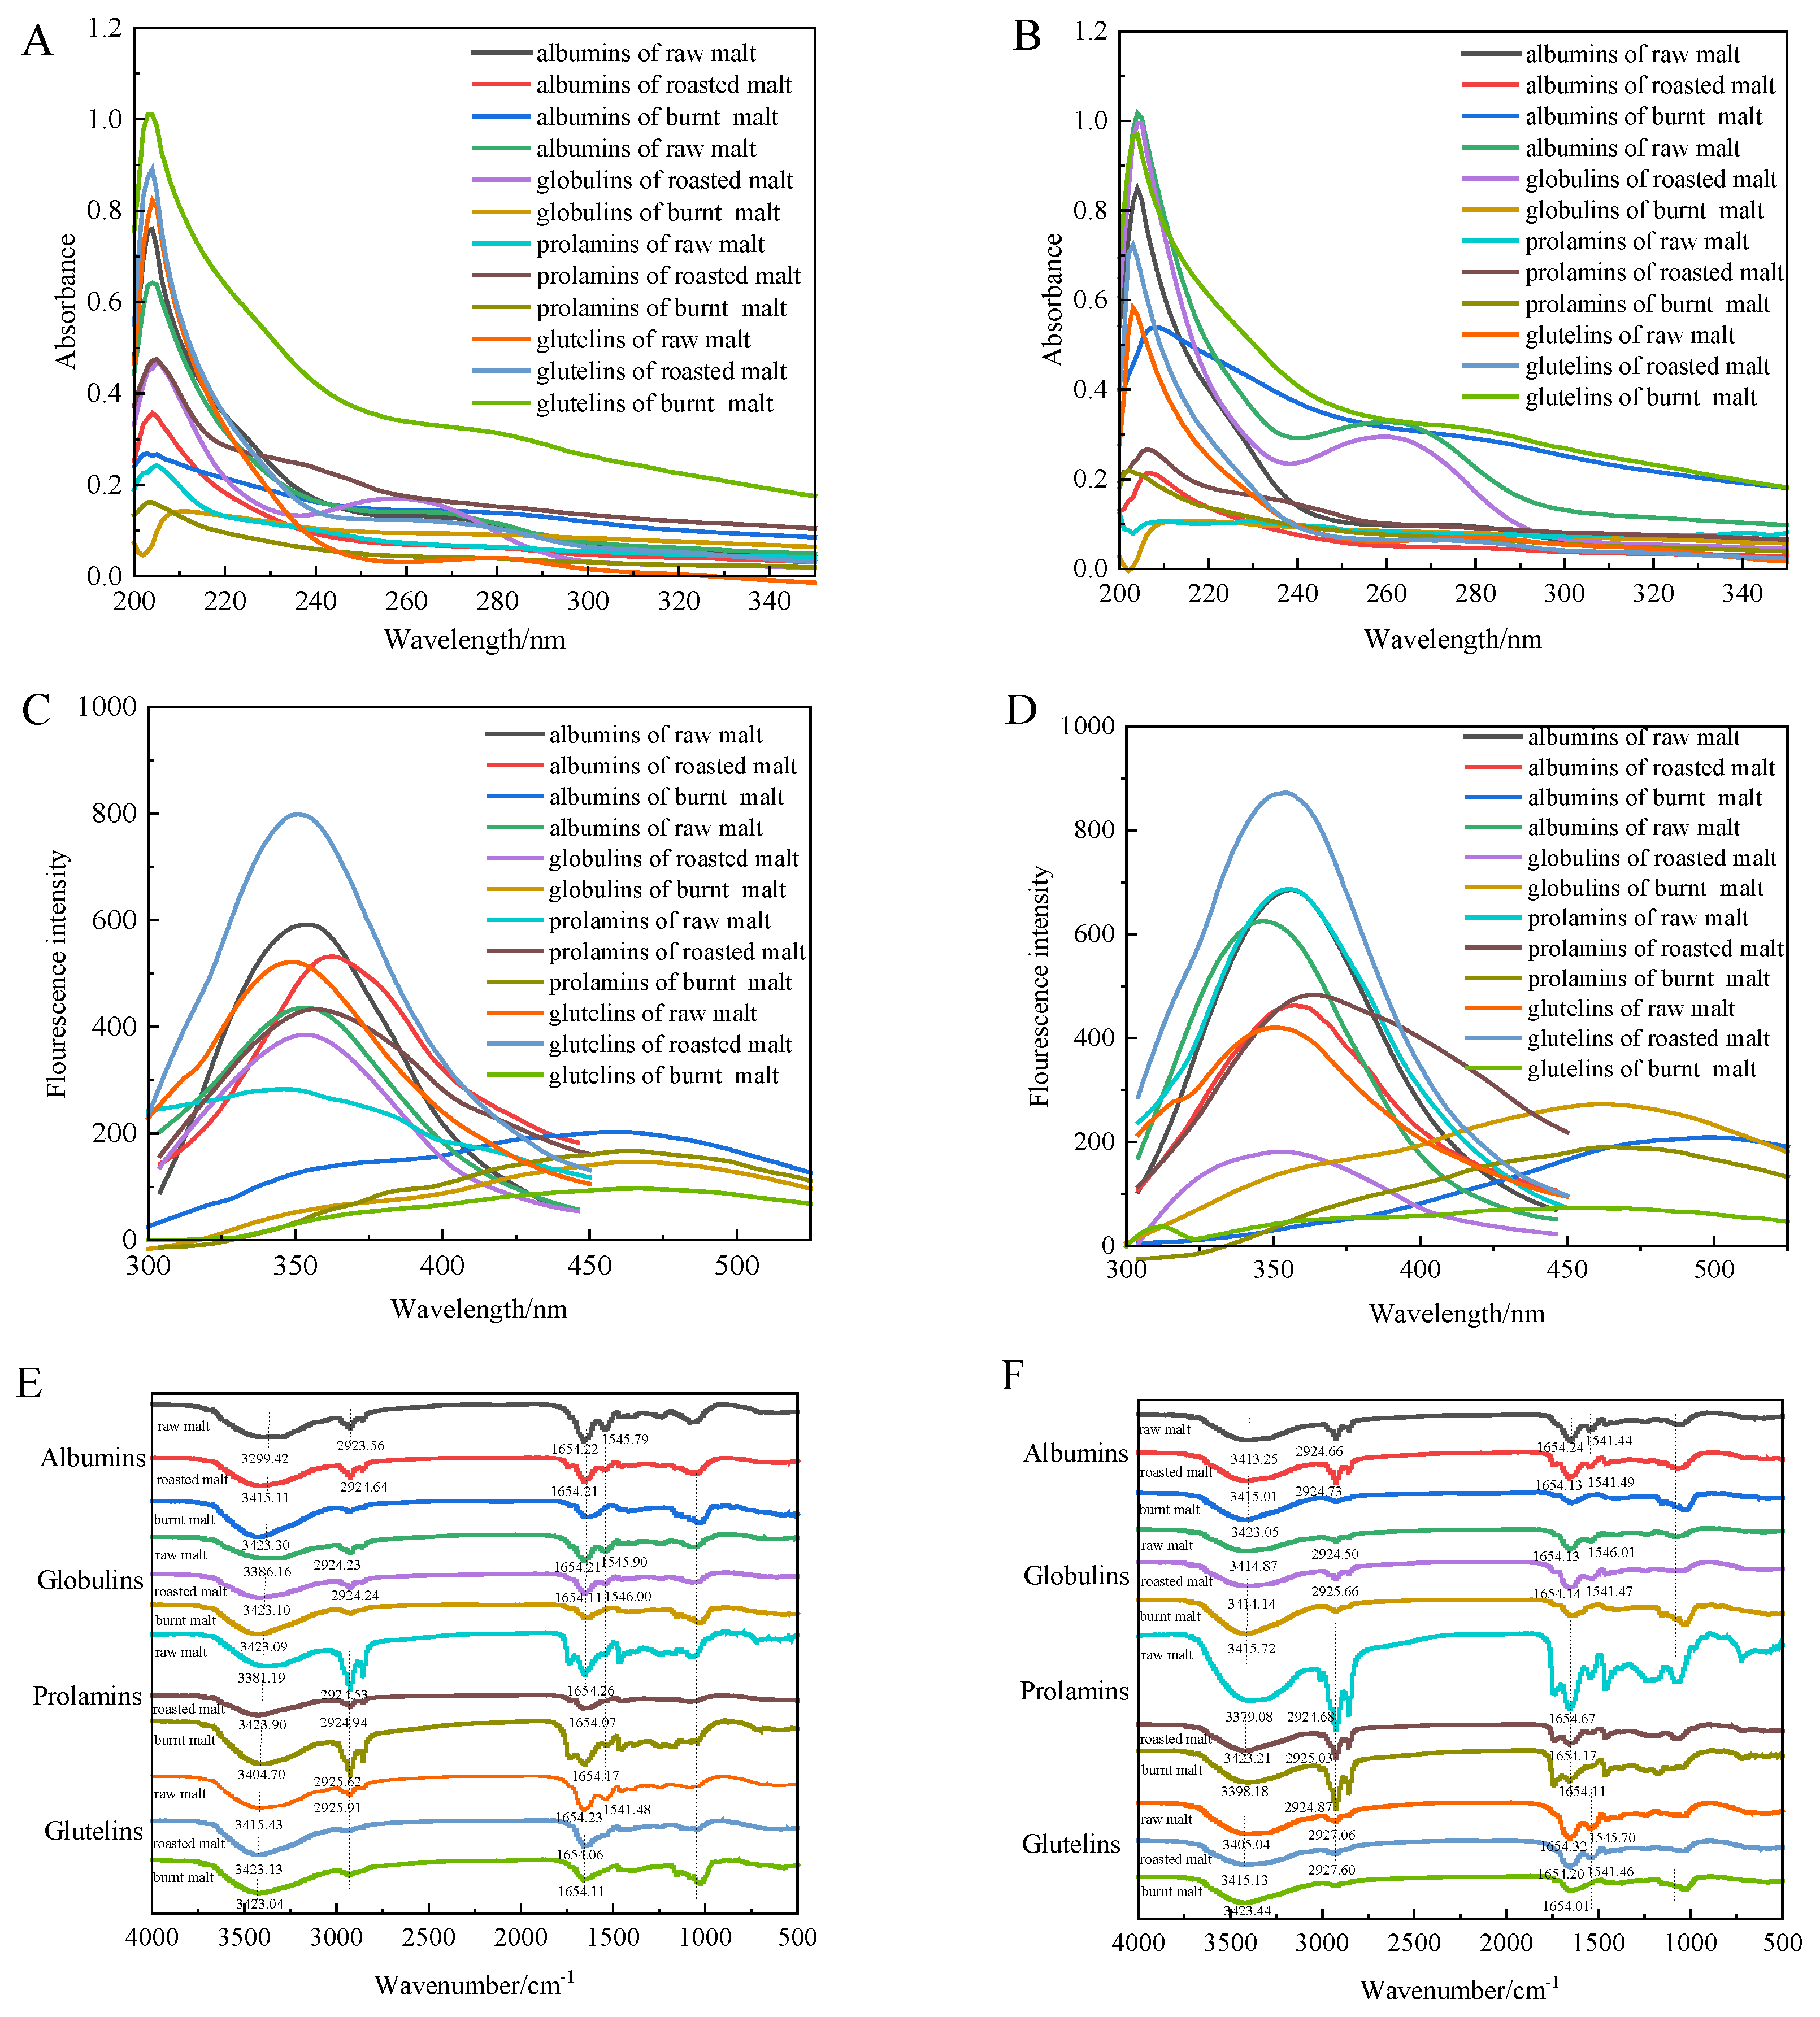
2.9. Ultraviolet (UV) Spectroscopy
2.10. Intrinsic Fluorescence (FL) Spectroscopy
2.11. Fourier-Transform Infrared (FTIR) Spectroscopy
2.12. Scanning Electron Microscopy (SEM)
2.13. Circular Dichroism (CD) Spectroscopy
2.14. Amino Acid Content
2.15. Statistical Analysis
3. Results
3.1. Soluble Protein Content
3.2. Total Polyphenol Content
3.3. ABTS+ Radical Scavenging Capacity
3.4. Ferric Ion-Reducing Capacity
3.5. Oxygen Radical Scavenging Capacity
3.6. Relative Molecular Mass
3.7. Ultraviolet Spectroscopy
3.8. Intrinsic Fluorescence Spectroscopy
3.9. Fourier-Transform Infrared Spectroscopy
3.10. Micromorphology
3.11. Secondary Structure
3.12. Amino Acid Content
4. Discussion
5. Conclusions
Supplementary Materials
Author Contributions
Funding
Institutional Review Board Statement
Informed Consent Statement
Data Availability Statement
Acknowledgments
Conflicts of Interest
References
- Sologubik, C.A.; Campañone, L.A.; Pagano, A.M.; Gely, M.C. Effect of Moisture Content on Some Physical Properties of Barley. Ind. Crop. Prod. 2013, 43, 762–767. [Google Scholar] [CrossRef]
- Chen, Y.; Huang, J.; Hu, J.; Yan, R.; Ma, X. Comparative Study on the Phytochemical Profiles and Cellular Antioxidant Activity of Phenolics Extracted from Barley Malts Processed under Different Roasting Temperatures. Food Funct. 2019, 10, 2176–2185. [Google Scholar] [CrossRef] [PubMed]
- Aljahdali, N.; Gadonna-Widehem, P.; Anton, P.M.; Carbonero, F. Gut Microbiota Modulation by Dietary Barley Malt Melanoidins. Nutrients 2020, 12, 241. [Google Scholar] [CrossRef] [PubMed]
- Landete, J.M. Dietary Intake of Natural Antioxidants: Vitamins and Polyphenols. Crit. Rev. Food Sci. Nutr. 2013, 53, 706–721. [Google Scholar] [CrossRef]
- Yahya, H.; Linforth, R.S.T.; Cook, D.J. Flavour Generation during Commercial Barley and Malt Roasting Operations: A Time Course Study. Food Chem. 2014, 145, 378–387. [Google Scholar] [CrossRef]
- Fleischer, K.; Hellwig, M. Kilning Invokes Oxidative Changes in Malt Proteins. Eur. Food Res. Technol. 2023, 249, 199–206. [Google Scholar] [CrossRef]
- Samaras, T.S.; Camburn, P.A.; Chandra, S.X.; Gordon, M.H.; Ames, J.M. Antioxidant Properties of Kilned and Roasted Malts. J. Agric. Food Chem. 2005, 53, 8068–8074. [Google Scholar] [CrossRef]
- Hu, J.; Tong, H.J.; Zeng, Q.Q.; Cai, B.C.; Ting, C.; Qin, K.M. Research Progress on Mechanism of Chemical Constituents Change during Processing of Seed Chinese Materia Medica. Chin. Tradit. Herb. Drugs 2017, 4, 2548–2556. [Google Scholar]
- Stübler, A.-S.; Lesmes, U.; Juadjur, A.; Heinz, V.; Rauh, C.; Shpigelman, A.; Aganovic, K. Impact of Pilot-Scale Processing (Thermal, PEF, HPP) on the Stability and Bioaccessibility of Polyphenols and Proteins in Mixed Protein- and Polyphenol-Rich Juice Systems. Innov. Food Sci. Emerg. Technol. 2020, 64, 102426. [Google Scholar] [CrossRef]
- Nawaz, A.; Walayat, N.; Khalifa, I.; Harlina, P.W.; Irshad, S.; Qin, Z.; Luo, X. Emerging Challenges and Efficacy of Polyphenols–Proteins Interaction in Maintaining the Meat Safety during Thermal Processing. Compr. Rev. Food Sci. Food Saf. 2024, 23, e13313. [Google Scholar] [CrossRef]
- Foegeding, E.A.; Plundrich, N.; Schneider, M.; Campbell, C.; Lila, M.A. Protein-Polyphenol Particles for Delivering Structural and Health Functionality. Food Hydrocoll. 2017, 72, 163–173. [Google Scholar] [CrossRef]
- Quan, T.H.; Benjakul, S.; Sae-leaw, T.; Balange, A.K.; Maqsood, S. Protein–Polyphenol Conjugates: Antioxidant Property, Functionalities and Their Applications. Trends Food Sci. Technol. 2019, 91, 507–517. [Google Scholar] [CrossRef]
- Bhinder, S.; Kumari, S.; Singh, B.; Kaur, A.; Singh, N. Impact of Germination on Phenolic Composition, Antioxidant Properties, Antinutritional Factors, Mineral Content and Maillard Reaction Products of Malted Quinoa Flour. Food Chem. 2021, 346, 128915. [Google Scholar] [CrossRef] [PubMed]
- Drummond e Silva, F.G.; Miralles, B.; Hernandez-Ledesma, B.; Amigo, L.; Iglesias, A.H.; Reyes Reyes, F.G.; Maria Netto, F. Influence of Protein-Phenolic Complex on the Antioxidant Capacity of Flaxseed (Linum usitatissimum L.) Products. J. Agric. Food Chem. 2017, 65, 800–809. [Google Scholar] [CrossRef]
- Grintzalis, K.; Georgiou, C.D.; Schneider, Y.-J. An Accurate and Sensitive Coomassie Brilliant Blue G-250-Based Assay for Protein Determination. Anal. Biochem. 2015, 480, 28–30. [Google Scholar] [CrossRef]
- Chen, Y.; Wang, E.; Wei, Z.; Zheng, Y.; Yan, R.; Ma, X. Phytochemical Analysis, Cellular Antioxidant and α-Glucosidase Inhibitory Activities of Various Herb Plant Organs. Ind. Crop. Prod. 2019, 141, 111771. [Google Scholar] [CrossRef]
- Zhang, J.; Lv, J.; Zhuang, G.; Zhang, J.; Hu, F.; Chen, Y. The Evaluation of the Phytochemical Profiles and Antioxidant and α-Glucosidase Inhibitory Activities of Four Herbal Teas Originating from China: A Comparative Analysis of Aqueous and Ethanol Infusions. Foods 2024, 13, 1705. [Google Scholar] [CrossRef]
- Aryal, S.; Baniya, M.K.; Danekhu, K.; Kunwar, P.; Gurung, R.; Koirala, N. Total Phenolic Content, Flavonoid Content and Antioxidant Potential of Wild Vegetables from Western Nepal. Plants 2019, 8, 96. [Google Scholar] [CrossRef]
- Chen, Y.; Ma, X.; Fu, X.; Yan, R. Phytochemical Content, Cellular Antioxidant Activity and Antiproliferative Activity of Adinandra Nitida Tea (Shiyacha) Infusion Subjected to in Vitro Gastrointestinal Digestion. RSC Adv. 2017, 7, 50430–50440. [Google Scholar] [CrossRef]
- Li, J.; Dai, Z.; Chen, Z.; Hao, Y.; Wang, S.; Mao, X. Improved Gelling and Emulsifying Properties of Myofibrillar Protein from Frozen Shrimp (Litopenaeus vannamei) by High-Intensity Ultrasound. Food Hydrocoll. 2023, 135, 108188. [Google Scholar] [CrossRef]
- Wang, Y.; Ye, L. Haze in Beer: Its Formation and Alleviating Strategies, from a Protein–Polyphenol Complex Angle. Foods 2021, 10, 3114. [Google Scholar] [CrossRef] [PubMed]
- Jongberg, S.; Andersen, M.L.; Lund, M.N. Characterisation of Protein-Polyphenol Interactions in Beer during Forced Aging: Protein-Polyphenol Interactions in Beer Haze. J. Inst. Brew. 2020, 126, 371–381. [Google Scholar] [CrossRef]
- Lao, Y.; Ye, Q.; Wang, Y.; Vongsvivut, J.; Selomulya, C. Quantifying the Effects of Pre-Roasting on Structural and Functional Properties of Yellow Pea Proteins. Food Res. Int. 2023, 172, 113180. [Google Scholar] [CrossRef] [PubMed]
- Sashikala, V.B.; Sreerama, Y.N.; Pratape, V.M.; Narasimha, H.V. Effect of Thermal Processing on Protein Solubility of Green Gram (Phaseolus Aureus) Legume Cultivars. J. Food Sci. Technol. 2015, 52, 1552–1560. [Google Scholar] [CrossRef]
- Yang, J.; Mocking-Bode, H.C.M.; Van Den Hoek, I.A.F.; Theunissen, M.; Voudouris, P.; Meinders, M.B.J.; Sagis, L.M.C. The Impact of Heating and Freeze or Spray Drying on the Interface and Foam Stabilising Properties of Pea Protein Extracts: Explained by Aggregation and Protein Composition. Food Hydrocoll. 2022, 133, 107913. [Google Scholar] [CrossRef]
- Kaur, R.; Prasad, K. Effect of Malting and Roasting of Chickpea on Functional and Nutritional Qualities of Its Protein Fractions. Int. J. Food Sci. Technol. 2022, 57, 3990–4000. [Google Scholar] [CrossRef]
- Yan, X.; Wang, Y.; Chen, Y.; Xie, J.; Yu, Q. Effect of Roasting Duration on the Solubility, Structure, and IgE-Binding Capacity of Cashew Nut Proteins. Innov. Food Sci. Emerg. Technol. 2021, 68, 102635. [Google Scholar] [CrossRef]
- Stone, A.K.; Parolia, S.; House, J.D.; Wang, N.; Nickerson, M.T. Effect of Roasting Pulse Seeds at Different Tempering Moisture on the Flour Functional Properties and Nutritional Quality. Food Res. Int. 2021, 147, 110489. [Google Scholar] [CrossRef]
- Kong, X.; Huang, Z.; Zhang, C.; Hua, Y.; Chen, Y.; Li, X. Phenolic Compounds in Walnut Pellicle Improve Walnut (Juglans regia L.) Protein Solubility under pH-Shifting Condition. Food Res. Int. 2023, 163, 112156. [Google Scholar] [CrossRef]
- Saricaoglu, B.; Yılmaz, H.; Subaşı, B.G.; Capanoglu, E. Effect of De-Phenolization on Protein-Phenolic Interactions of Sunflower Protein Isolate. Food Res. Int. 2023, 164, 112345. [Google Scholar] [CrossRef]
- Carvalho, D.O.; Gonçalves, L.M.; Guido, L.F. Overall Antioxidant Properties of Malt and How They Are Influenced by the Individual Constituents of Barley and the Malting Process. Compr. Rev. Food Sci. Food Saf. 2016, 15, 927–943. [Google Scholar] [CrossRef] [PubMed]
- Li, L.; Wang, Q.; Liu, C.; Hong, J.; Zheng, X. Effect of Oven Roasting on Major Chemical Components in Cereals and Its Modulation on Flour-based Products Quality. J. Food Sci. 2023, 88, 2740–2757. [Google Scholar] [CrossRef] [PubMed]
- Benmeziane-Derradji, F.; Djermoune-Arkoub, L.; Ayat, N.E.-H.; Aoufi, D. Impact of Roasting on the Physicochemical, Functional Properties, Antioxidant Content and Microstructure Changes of Algerian Lentil (Lens culinaris) Flour. J. Food Meas. Charact. 2020, 14, 2840–2853. [Google Scholar] [CrossRef]
- Mesfin, N.; Belay, A.; Amare, E. Effect of Germination, Roasting, and Variety on Physicochemical, Techno-Functional, and Antioxidant Properties of Chickpea (Cicer arietinum L.) Protein Isolate Powder. Heliyon 2021, 7, e08081. [Google Scholar] [CrossRef]
- Rizki, H.; Kzaiber, F.; Elharfi, M.; Ennahli, S.; Hanine, H. Effects of Roasting Temperature and Time on the Physicochemical Properties of Sesame (Sesamum indicum L.) Seeds. Int. J. Innov. Appl. Stud. 2015, 11, 148–155. [Google Scholar]
- Lopes, C.; Ferruccio, C.A.; Sales, A.C.d.A.; Tavares, G.M.; de Castro, R.J.S. Effects of Processing Technologies on the Antioxidant Properties of Common Bean (Phaseolus vulgaris L.) and Lentil (Lens culinaris) Proteins and Their Hydrolysates. Food Res. Int. 2023, 172, 113190. [Google Scholar] [CrossRef]
- El-Beltagi, H.E.S. Effect of Roasting Treatments on Protein Fraction Profiles, Some Enzyme Activities of Egyptian Peanuts. Int. J. Food Sci. Nutr. 2011, 62, 453–456. [Google Scholar] [CrossRef]
- Runyon, J.R.; Sunilkumar, B.A.; Nilsson, L.; Rascon, A.; Bergenståhl, B. The Effect of Heat Treatment on the Soluble Protein Content of Oats. J. Cereal Sci. 2015, 65, 119–124. [Google Scholar] [CrossRef]
- Relkin, P.; Shukat, R. Food Protein Aggregates as Vitamin-Matrix Carriers: Impact of Processing Conditions. Food Chem. 2012, 134, 2141–2148. [Google Scholar] [CrossRef]
- Yang, C.; Wang, B.; Wang, J.; Xia, S.; Wu, Y. Effect of Pyrogallic Acid (1,2,3-Benzenetriol) Polyphenol-Protein Covalent Conjugation Reaction Degree on Structure and Antioxidant Properties of Pumpkin (Cucurbita sp.) Seed Protein Isolate. LWT-Food Sci. Technol. 2019, 109, 443–449. [Google Scholar] [CrossRef]
- Yu, J.; Zhang, Z.; Lin, X.; Ji, Y.; Zhang, R.; Ji, H.; Chen, Y. Changes in the Structure and Hydration Properties of High-Temperature Peanut Protein Induced by Cold Plasma Oxidation. Int. J. Biol. Macromol. 2023, 253, 127500. [Google Scholar] [CrossRef] [PubMed]
- Fan, L.; Mao, X.; Wu, Q. Purification, Identification and Molecular Docking of Novel Antioxidant Peptides from Walnut (Juglans regia L.) Protein Hydrolysates. Molecules 2022, 27, 8423. [Google Scholar] [CrossRef] [PubMed]
- Wang, Y.-R.; Yang, Q.; Li-Sha, Y.-J.; Chen, H.-Q. Effects of Thermal Aggregation Treatment on the Structural, Gelation Properties and Microstructure of Phosphorylated Rice Glutelin Gel. J. Cereal Sci. 2021, 100, 103252. [Google Scholar] [CrossRef]
- Torbica, A.; Pećinar, I.; Lević, S.; Belović, M.; Jovičić, M.; Stevanović, Z.D.; Nedović, V. Insight in Changes in Starch and Proteins Molecular Structure of Non-Wheat Cereal Flours Influenced by Roasting and Extrusion Treatments. Food Hydrocoll. 2023, 140, 108591. [Google Scholar] [CrossRef]
- Feng, Y.; Jin, C.; Lv, S.; Zhang, H.; Ren, F.; Wang, J. Molecular Mechanisms and Applications of Polyphenol-Protein Complexes with Antioxidant Properties: A Review. Antioxidants 2023, 12, 1577. [Google Scholar] [CrossRef]
- Xiong, S.; Chen, M.; Pei, X.; Yin, J.; Oliveira, H.; Mateus, N.; Ye, S.; Wu, M.; Zhang, R.; He, J. Antiproliferative and Antioxidant Properties of Protein-Free and Protein-Bound Phenolics Isolated from Purple Rice (Oryza sativa L.). Int. J. Biol. Macromol. 2025, 293, 139340. [Google Scholar] [CrossRef]
- Qie, X.; Chen, W.; Wu, R.; Wang, Z.; Zeng, M.; Chen, J.; Goff, H.D.; He, Z. The Effects of β-Lactoglobulin on Cyanidin-3-O-Glucoside Antioxidant Activity and Bioaccessibility after Heat Treatment. Food Res. Int. 2022, 157, 111494. [Google Scholar] [CrossRef]


| Picture | Malt Name | Chinese Name | Description | Preparation Method |
|---|---|---|---|---|
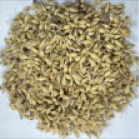 | Raw malt | Sheng maiya | Light yellow in color with a hard texture, light smell, and sweet taste. | Ripe barley grains are soaked until germination and dried when the buds reach 5 mm. |
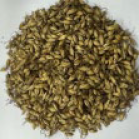 | Roasted malt | Chao maiya | Brown-yellow in color with small char spots, slightly bitter in aroma and taste. | The raw malt is stir-fried to produce a brown-yellow color. |
 | Burnt malt | Jiao maiya | Dark brown color, with a dark aroma and slightly bitter taste. | The raw malt is fried until dark brown. |
| Samples | α-Helix (%) | β-Turn (%) | Random Coil (%) | β-Sheet (%) | |
|---|---|---|---|---|---|
| Albumin-polyphenol complexes | raw malt | 12.2 | 18.0 | 42.3 | 29.9 |
| roasted malt | 11.7 | 18.3 | 42.7 | 30.8 | |
| burnt malt | 10.4 | 18.7 | 44.8 | 33.4 | |
| Globulin-polyphenol complexes | raw malt | 10.8 | 18.6 | 44.2 | 32.6 |
| roasted malt | 11.2 | 18.4 | 43.8 | 31.9 | |
| burnt malt | 10.4 | 18.7 | 44.9 | 33.4 | |
| Prolamin-polyphenol complexes | raw malt | 10.5 | 18.7 | 44.9 | 33.4 |
| roasted malt | 10.6 | 18.6 | 44.5 | 33.1 | |
| burnt malt | 10.5 | 18.7 | 44.8 | 33.3 | |
| Glutelin-polyphenol complexes | raw malt | 11.8 | 18.2 | 42.0 | 36.4 |
| roasted malt | 11.2 | 18.4 | 43.4 | 31.7 | |
| burnt malt | 10.5 | 18.7 | 44.6 | 33.1 | |
| Polyphenol-free albumins | raw malt | 14.8 | 17.2 | 37.3 | 30.4 |
| roasted malt | 11.6 | 18.2 | 43.1 | 30.9 | |
| burnt malt | 10.4 | 18.7 | 45.0 | 33.6 | |
| Polyphenol-free globulins | raw malt | 12.7 | 17.8 | 41.8 | 29.0 |
| roasted malt | 12.0 | 17.4 | 43.7 | 28.4 | |
| burnt malt | 10.4 | 18.7 | 45.1 | 33.6 | |
| Polyphenol-free prolamins | raw malt | 10.5 | 18.7 | 44.9 | 33.4 |
| roasted malt | 10.3 | 18.7 | 45.2 | 33.5 | |
| burnt malt | 10.5 | 18.7 | 44.8 | 33.4 | |
| Polyphenol-free glutelins | raw malt | 11.2 | 18.4 | 43.4 | 31.7 |
| roasted malt | 11.4 | 18.3 | 42.9 | 31.3 | |
| burnt malt | 10.6 | 18.7 | 44.5 | 33.1 | |
| Raw Malt | Roasted Malt | Burnt Malt | Raw Malt | Roasted Malt | Burnt Malt | Raw Malt | Roasted Malt | Burnt Malt | Raw Malt | Roasted Malt | Burnt Malt | ||
|---|---|---|---|---|---|---|---|---|---|---|---|---|---|
| Albumin-polyphenol complexes | Globulin-polyphenol complexes | Prolamin-polyphenol complexes | Glutelin-polyphenol complexes | ||||||||||
| Asp | 43.7 ± 2.4 a | 18.2 ± 0.6 b | 1.3 ± 0.0 c | 43.9 ± 3.9 a | 19.4 ± 0.2 b | 3.2 ± 0.0 c | 3.2 ± 0.4 b | 3.7 ± 0.1 b | 6.3 ± 0.1 a | 36.7 ± 2.7 a | 29.7 ± 1.7 b | 5.0 ± 0.2 c | |
| Thr | 20.6 ± 0.7 a | 9.3 ± 0.2 b | 0.4 ± 0.0 c | 20.4 ± 1.6 a | 9.1 ± 0.1 b | 1.2 ± 0.0 c | 2.9 ± 0.3 b | 4.0 ± 0.1 a | 1.0 ± 0.0 c | 20.4 ± 1.4 a | 18.4 ± 0.9 b | 0.8 ± 0.0 c | |
| Ser | 18.8 ± 0.8 a | 9.9 ± 0.3 b | 0.4 ± 0.0 c | 20.7 ± 1.8 a | 9.0 ± 0.2 b | 1.2 ± 0.0 c | 4.6 ± 0.6 b | 9.1 ± 0.3 a | 0.3 ± 0.0 c | 24.1 ± 1.7 a | 22.5 ± 1.3 a | 0.4 ± 0.0 b | |
| Glu | 60.5 ± 2.0 a | 45.1 ± 1.3 b | 6.3 ± 0.2 c | 66.3 ± 4.9 a | 34.6 ± 0.4 b | 9.9 ± 0.2 c | 30.4 ± 3.3 c | 129.1 ± 2.6 a | 49.9 ± 1.8 b | 76.5 ± 1.8 a | 103.4 ± 1.2 b | 33.3 ± 1.7 c | |
| Gly | 19.2 ± 0.6 a | 10.9 ± 0.2 b | 0.80 ± 0.0 c | 20.7 ± 0.9 a | 10.7 ± 0.4 b | 2.1 ± 0.1 c | 3.1 ± 0.2 b | 2.5 ± 0.1 c | 6.1 ± 0.1 a | 19.3 ± 1.1 a | 19.1 ± 1.2 a | 3.9 ± 0.1 b | |
| Ala | 36.7 ± 8.3 a | 14.0 ± 0.3 b | 1.2 ± 0.1 c | 35.6 ± 3.0 a | 15.3 ± 0.6 b | 3.2 ± 0.1 c | 3.9 ± 0.5 b | 3.8 ± 0.2 b | 9.2 ± 1.0 a | 31.2 ± 1.2 a | 25.8 ± 3.4 a | 5.9 ± 0.3 b | |
| Cys | N.d. | 1.4 ± 0.1 a | 0.1 ± 0.0 b | N.d. | N.d. | 0.1 ± 0.0 a | N.d. | 0.2 ± 0.0 b | 0.5 ± 0.0 a | N.d. | N.d. | 0.3 ± 0.0 a | |
| Val | 25.6 ± 0.9 a | 11.8 ± 0.4 b | 1.3 ± 0.0 c | 28.1 ± 2.1 a | 11.8 ± 0.2 b | 2.7 ± 0.0 c | 5.8 ± 0.6 c | 7.2 ± 0.1 b | 13.2 ± 0.4 a | 29.5 ± 1.8 a | 27.1 ± 1.5 a | 7.5 ± 0.3 b | |
| Met | 6.8 ± 0.7 a | 2.0 ± 0.0 b | 0.02 ± 0.0 c | 4.3 ± 0.4 a | 2.9 ± 0.0 b | 0.04 ± 0.0 c | N.d. | N.d. | N.d. | 1.3 ± 0.0 b | 1.9 ± 0.1 a | 0.1 ± 0.0 c | |
| Ile | 20.1 ± 0.5 a | 9.0 ± 0.3 b | 0.8 ± 0.0 c | 20.8 ± 1.2 a | 8.8 ± 0.1 b | 1.8 ± 0.1 c | 5.0 ± 0.6 c | 12.0 ± 0.3 a | 10.3 ± 0.3 b | 22.8 ± 1.6 a | 20.5 ± 1.2 a | 5.2 ± 0.2 b | |
| Leu | 44.5 ± 0.8 a | 17.7 ± 0.2 b | 1.6 ± 0.1 c | 39.2 ± 0.7 a | 16.8 ± 0.5 b | 3.5 ± 0.1 c | 9.3 ± 0.9 b | 19.7 ± 0.9 a | 20.7 ± 0.6 a | 47.8 ± 0.4 a | 41.9 ± 0.9 b | 11.5 ± 0.5 c | |
| Tyr | 14.4 ± 0.5 a | 7.3 ± 0.3 b | 0.5 ± 0.0 c | 15.1 ± 1.2 a | 6.7 ± 0.0 b | 1.1 ± 0.0 c | 2.9 ± 0.3 c | 12.0 ± 0.3 a | 7.9 ± 0.2 b | 18.1 ± 1.2 a | 19.5 ± 1.3 a | 4.1 ± 0.2 b | |
| Phe | 21.1 ± 0.8 a | 13.0 ± 0.4 b | 1.1 ± 0.0 c | 24.0 ± 1.8 a | 10.7 ± 0.0 b | 2.2 ± 0.0 c | 6.6 ± 0.7 c | 40.7 ± 0.8 a | 16.5 ± 0.4 b | 31.7 ± 1.9 a | 29.0 ± 1.5 a | 8.7 ± 0.3 b | |
| Lys | 29.8 ± 1.2 a | 10.0 ± 0.3 b | 0.7 ± 0.1 c | 26.5 ± 0.6 a | 10.7 ± 0.5 b | 1.8 ± 0.0 c | 2.7 ± 0.2 a | 1.4 ± 0.2 b | 2.3 ± 0.0 a | 17.3 ± 0.3 a | 13.1 ± 0.0 b | 1.7 ± 0.2 c | |
| His | 9.8 ± 0.6 a | 5.1 ± 0.2 b | 0.3 ± 0.0 c | 10.4 ± 0.5 a | 4.8 ± 0.2 b | 0.8 ± 0.0 c | 1.5 ± 0.0 c | 4.2 ± 0.1 a | 2.6 ± 0.2 b | 11.8 ± 0.6 a | 11.6 ± 0.8 a | 1.6 ± 0.0 b | |
| Arg | 23.9 ± 1.1 a | 12.9 ± 0.0 b | 0.4 ± 0.0 c | 30.8 ± 2.7 a | 14.4 ± 0.6 b | 1.5 ± 0.1 c | 5.0 ± 0.5 b | 8.6 ± 2.5 a | 1.0 ± 0.1 c | 25.8 ± 1.2 a | 24.6 ± 1.5 a | 0.3 ± 0.0 b | |
| Pro | 11.8 ± 0.3 b | 13.8 ± 0.3 a | 2.1 ± 0.1 c | 12.7 ± 0.9 a | 8.7 ± 0.1 b | 3.0 ± 0.1 c | 10.4 ± 0.9 c | 80.8 ± 0.6 a | 19.5 ± 0.6 b | 39.8 ± 2.0 a | 44.2 ± 2.1 a | 11.5 ± 0.5 b | |
| Total | 407.5 ± 2.0 a | 211.4 ± 5.3 b | 19.4 ± 0.4 c | 419.5 ± 20.9 a | 194.3 ± 2.6 b | 39.4 ± 0.7 c | 97.2 ± 9.4 c | 339.2 ± 9.1 a | 167.1 ± 5.1 b | 452.3 ± 20.6 a | 464.3 ± 20.8 a | 101.7 ± 4.6 b | |
| Polyphenol-free albumins | Polyphenol-free globulins | Polyphenol-free prolamins | Polyphenol-free glutelins | ||||||||||
| Asp | 20.2 ± 1.1 a | 18.9 ± 0.6 a | 1.2 ± 0.0 b | 51.4 ± 3.3 a | 24.2 ± 0.5 b | 1.5 ± 0.2 c | 2.6 ± 0.1 b | 1.9 ± 0.0 c | 4.5 ± 0.2 a | 46.3 ± 1.3 a | 34.1 ± 0.8 b | 6.2 ± 0.1 c | |
| Thr | 9.7 ± 0.5 a | 10.2 ± 0.3 a | 0.3 ± 0.0 b | 25.6 ± 1.5 a | 14.7 ± 0.4 b | 0.5 ± 0.1 c | 2.4 ± 0.1 a | 2.0 ± 0.0 b | 0.7 ± 0.0 c | 26.5 ± 0.3 a | 19.6 ± 0.4 b | 1.0 ± 0.0 c | |
| Ser | 10.8 ± 0.6 a | 11.5 ± 0.4 a | 0.3 ± 0.0 b | 21.9 ± 1.4 a | 17.5 ± 0.3 b | 0.3 ± 0.0 c | 4.8 ± 0.3 a | 4.3 ± 0.1 a | 0.3 ± 0.0 b | 31.5 ± 0.9 a | 24.5 ± 0.5 b | 0.5 ± 0.0 c | |
| Glu | 40.1 ± 2.1 b | 51.6 ± 1.7 a | 5.4 ± 0.3 c | 83.4 ± 5.3 b | 97.4 ± 3.8 a | 6.3 ± 0.1 c | 49.3 ± 2.5 a | 55.2 ± 2.3 a | 23.5 ± 0.7 b | 102.8 ± 4.2 a | 103.5 ± 5.2 a | 35.7 ± 0.7 b | |
| Gly | 11.1 ± 0.3 b | 11.9 ± 0.3 a | 0.7 ± 0.1 c | 23.9 ± 1.8 a | 15.6 ± 0.4 b | 1.1 ± 0.0 c | 2.5 ± 0.0 a | 1.9 ± 0.1 b | 4.3 ± 0.1 c | 26.3 ± 2.8 a | 20.2 ± 0.3 b | 4.7 ± 0.1 c | |
| Ala | 13.6 ± 0.4 a | 14.4 ± 0.2 a | 1.4 ± 0.2 b | 38.1 ± 3.6 a | 19.3 ± 0.1 b | 1.7 ± 0.1 c | 3.0 ± 0.1 b | 2.2 ± 0.0 c | 5.8 ± 0.1 a | 36.1 ± 3.0 a | 30.5 ± 0.4 b | 7.0 ± 0.3 c | |
| Cys | 1.4 ± 0.1 b | 1.6 ± 0.0 a | 0.1 ± 0.0 c | N.d. | 0.6 ± 0.1 a | 0.1 ± 0.0 b | 0.2 ± 0.0 c | 0.7 ± 0.0 a | 0.3 ± 0.0 b | N.d. | N.d. | 0.31 ± 0.0 a | |
| Val | 14.0 ± 0.7 a | 14.7 ± 0.5 a | 1.4 ± 0.2 b | 31.1 ± 1.8 a | 22.0 ± 0.8 b | 1.7 ± 0.0 c | 5.5 ± 0.2 b | 4.7 ± 0.2 c | 8.6 ± 0.3 a | 37.3 ± 0.6 a | 32.0 ± 1.0 b | 8.4 ± 0.1 c | |
| Met | 0.9 ± 0.0 b | 1.6 ± 0.1 a | N.d. | 7.0 ± 0.4 a | 0.9 ± 0.0 b | 0.03 ± 0.0 c | N.d. | N.d. | N.d. | 1.7 ± 0.0 a | 1.6 ± 0.1 b | 0.1 ± 0.0 c | |
| Ile | 9.0 ± 0.6 b | 10.9 ± 0.4 a | 0.8 ± 0.0 c | 25.5 ± 1.6 a | 17.0 ± 0.5 b | 1.0 ± 0.0 c | 6.1 ± 0.4 a | 6.9 ± 0.3 a | 6.5 ± 0.3 a | 28.3 ± 0.4 a | 24.2 ± 0.7 b | 5.9 ± 0.0 c | |
| Leu | 19.9 ± 0.7 a | 21.0 ± 0.7 a | 1.5 ± 0.0 b | 26.7 ± 1.0 b | 33.0 ± 1.5 a | 1.9 ± 0.0 c | 10.1 ± 0.4 b | 9.4 ± 0.4 b | 12.7 ± 0.7 a | 58.3 ± 1.2 a | 48.5 ± 0.9 b | 12.5 ± 0.2 c | |
| Tyr | 8.2 ± 0.4 a | 8.6 ± 0.3 a | 0.5 ± 0.1 b | 17.0 ± 1.1 a | 13.7 ± 0.6 b | 0.6 ± 0.0 c | 4.2 ± 0.2 a | 4.5 ± 0.2 a | 4.8 ± 0.6 a | 24.4 ± 0.4 a | 20.3 ± 0.8 b | 4.6 ± 0.9 c | |
| Phe | 11.6 ± 0.5 b | 15.3 ± 0.5 a | 1.0 ± 0.0 c | 24.9 ± 1.4 a | 24.9 ± 0.8 a | 1.2 ± 0.1 b | 12.0 ± 0.4 b | 15.4 ± 0.6 a | 9.3 ± 0.0 c | 39.0 ± 0.3 a | 33.3 ± 1.0 b | 9.3 ± 0.2 c | |
| Lys | 9.1 ± 0.2 a | 9.3 ± 0.4 a | 0.4 ± 0.01 b | 34.5 ± 1.5 a | 11.4 ± 0.4 b | 0.6 ± 0.1 c | 2.6 ± 0.0 a | 1.4 ± 0.5 bc | 1.8 ± 0.2 ab | 23.9 ± 0.4 a | 14.7 ± 0.1 b | 1.9 ± 0.1 c | |
| His | 5.6 ± 0.1 b | 5.9 ± 0.0 a | 0.3 ± 0.0 c | 11.3 ± 0.9 a | 9.9 ± 0.6 a | 0.3 ± 0.0 b | 2.2 ± 0.1 a | 2.0 ± 0.0 a | 1.5 ± 0.1 b | 16.8 ± 0.1 a | 13.5 ± 0.9 b | 1.6 ± 0.2 c | |
| Arg | 14.4 ± 0.9 a | 14.4 ± 0.5 a | 0.3 ± 0.0 b | 32.4 ± 2.3 a | 19.9 ± 0.5 b | 0.3 ± 0.0 c | 4.2 ± 0.3 a | 3.8 ± 0.2 a | 0.7 ± 0.1 b | 36.1 ± 0.9 a | 27.8 ± 0.6 b | 0.5 ± 0.0 c | |
| Pro | 12.0 ± 0.5 b | 16.1 ± 0.5 a | 1.8 ± 0.0 c | 51.3 ± 1.3 a | 31.3 ± 1.3 b | 2.2 ± 0.0 c | 19.1 ± 0.6 b | 23.3 ± 1.0 a | 9.3 ± 0.2 c | 55.4 ± 0.5 a | 51.0 ± 1.8 b | 12.1 ± 0.3 c | |
| Total | 211.5 ± 9.3 b | 237.9 ± 6.1 a | 17.2 ± 0.6 c | 506.0 ± 21.2 a | 373.3 ± 11.7 b | 22.6 ± 1.8 c | 130.6 ± 5.1 a | 139.6 ± 5.9 a | 94.6 ± 2.4 b | 590.5 ± 7.7 a | 499.3 ± 5.1 b | 112.1 ± 1.8 c | |
Disclaimer/Publisher’s Note: The statements, opinions and data contained in all publications are solely those of the individual author(s) and contributor(s) and not of MDPI and/or the editor(s). MDPI and/or the editor(s) disclaim responsibility for any injury to people or property resulting from any ideas, methods, instructions or products referred to in the content. |
© 2025 by the authors. Licensee MDPI, Basel, Switzerland. This article is an open access article distributed under the terms and conditions of the Creative Commons Attribution (CC BY) license (https://creativecommons.org/licenses/by/4.0/).
Share and Cite
Wu, G.; Lin, H.; Chen, Y. Improvement of the Structure and Antioxidant Activity of Protein–Polyphenol Complexes in Barley Malts Using Roasting Methods. Antioxidants 2025, 14, 538. https://doi.org/10.3390/antiox14050538
Wu G, Lin H, Chen Y. Improvement of the Structure and Antioxidant Activity of Protein–Polyphenol Complexes in Barley Malts Using Roasting Methods. Antioxidants. 2025; 14(5):538. https://doi.org/10.3390/antiox14050538
Chicago/Turabian StyleWu, Guozhi, Huiting Lin, and Yongsheng Chen. 2025. "Improvement of the Structure and Antioxidant Activity of Protein–Polyphenol Complexes in Barley Malts Using Roasting Methods" Antioxidants 14, no. 5: 538. https://doi.org/10.3390/antiox14050538
APA StyleWu, G., Lin, H., & Chen, Y. (2025). Improvement of the Structure and Antioxidant Activity of Protein–Polyphenol Complexes in Barley Malts Using Roasting Methods. Antioxidants, 14(5), 538. https://doi.org/10.3390/antiox14050538