1. Introduction
Breast cancer remains a leading cause of cancer-related mortality among women, accounting for 25% (1.7 million) of all cases globally and resulting in a death every 15 min [
1]. In the United States, breast cancer was responsible for 1200 deaths among women aged 20 to 39 years and 9727 deaths among those aged 40 to 59 years in 2019. Since the mid-2000s, the incidence of breast cancer has shown a consistent annual increase of approximately 0.5% [
2,
3]. Addressing breast cancer on a global scale necessitates the development of innovative approaches and novel treatments. Breast cancer classification, based on cellular markers that inform targeted therapies, comprises three major groups: (a) estrogen receptor (ER) or progesterone receptor (PR) positive, (b) human epidermal growth factor receptor 2 (HER2, encoded by the ERBB2 gene) positive, with or without ER and PR expression, and (c) triple-negative breast cancer (TNBC), which is defined by the lack of ER and PR expression and absence of HER2 amplification [
4,
5].
This subset of invasive breast cancers, comprising 10–20% of cases, is highly aggressive, has limited effective therapeutic options [
6], and is associated with poor prognosis and survival outcomes [
4,
7]. Unlike patients with estrogen receptor-positive or HER2-positive tumors, who benefit from targeted therapies, those with TNBC have few targeted treatment options available [
4,
5]. The absence of these molecular targets necessitates the development of novel therapeutic approaches, such as targeting epigenetic regulators like HDAC6. Research into TNBC has explored various molecular mechanisms, including the roles of histone deacetylases (HDACs), androgen receptor (AR), vascular endothelial growth factor (VEGF), impaired DNA repair mechanisms, the mammalian target of rapamycin (mTOR), and the Src oncogene pathway [
8].
Human HDACs consist of 18 enzymes grouped into four classes. Classes I, II, and IV are zinc-dependent, while class III relies on NAD+ for activity. Class I includes HDACs 1, 2, 3, and 8; Class IIa comprises HDACs 4, 5, 7, and 9; Class IIb includes HDACs 6 and 10; and Class IV consists of HDAC 11. HDAC6, a unique zinc-dependent histone deacetylase in class IIb, is mainly located in the cytoplasm and is distinguished by its multifunctional nature. It possesses two distinct catalytic domains, setting it apart from other HDACs [
9,
10]. It regulates the acetylation of non-histone proteins, such as cortactin and α-tubulin, and modulates the chaperone activity of heat shock protein 90 (HSP90) [
11,
12]. HDAC6 is overexpressed in several cancers such as breast cancer [
13], pancreatic cancer [
12], prostate cancer, ovarian cancer, myeloid leukemia [
10], B and T cell lymphomas [
14], glioblastoma [
15], oral squamous cell carcinoma [
16], bladder cancer, and lung cancer [
12].
HDAC6 plays a multifaceted role in regulating several cellular processes, including cell cycle progression, proliferation, migration, protein trafficking and degradation, cell shape modulation [
17], as well as autophagy, apoptosis, and chemotherapy sensitivity in various cancers [
18,
19]. Recent findings underscore the need for carefully chosen targeted drugs that inhibit HDAC6, as this selectivity could be pivotal for improving anticancer treatment strategies [
10,
15]. In breast cancer models, HDAC6 is implicated in promoting metastatic dissemination and enhancing the motility of cancer cells [
20,
21]. Previous studies have demonstrated that MDA-MB-231 cells exhibit significantly higher levels of HDAC6 expression compared to MCF-7 cells [
22]. However, further research is needed to explore the differential roles of HDAC6 in various breast cancer subtypes and to determine the therapeutic potential of selective HDAC6 inhibitors.
In this study, we synthesized BKS-112, a chemical compound described as (E)-N-hydroxy-3-(2-(4-fluorostyryl) thiazol-4-yl) propanamide, as a potent HDAC6 inhibitor. We began with preliminary molecular docking analyses using HDAC6 (PDB: 5EDU) and HDAC1 (PDB: 4BKX) to assess the binding potential of our designed derivatives. Based on these computational insights, we synthesized the derivatives and performed in vitro enzymatic assays to evaluate HDAC1 and HDAC6 inhibition [
23]. This comprehensive approach led to the identification of BKS-112 as a highly potent and selective HDAC6 inhibitor, characterized by improved safety and cellular selectivity. Notably, the incorporation of a phenylethene cap in BKS-112 significantly enhanced HDAC6 selectivity, highlighting the importance of rigidifying the cap group to optimize specificity toward HDAC subtypes [
23].
This study aimed to advance the understanding and development of novel therapeutic agents for the precise treatment of TNBC. By investigating new compounds and elucidating their mechanisms of action, we sought to address the challenges posed by drug resistance and identify more effective clinical targets. Our findings aim to pave the way for improved treatment strategies and enhanced outcomes for patients with TNBC.
2. Materials and Methods
2.1. Compounds
BKS-112 (6u, denoted as (E)-N-hydroxy-3-(2-(4-fluorostyryl) thiazol-4-yl) propanamide) was obtained from Professor Young Hoon Jung (Department of Pharmacy, Sungkyunkwan University, Suwon, Republic of Korea) [
23]. SAHA was purchased from Sigma-Aldrich (St. Louis, MO, USA). Solutions of BKS-112 (50 mM) and SAHA (5 mM) were prepared in dimethyl sulfoxide (DMSO).
2.2. Reagents
Dulbecco’s modified Eagle’s medium (DMEM) was purchased from WELGENE Inc. (Gyeongsangbuk-do, Republic of Korea), and fetal bovine serum (FBS), Dulbecco’s phosphate-buffered saline (DPBS), and trypsin were obtained from Gibco Invitrogen Corporation (Carlsbad, CA, USA). MTT, Pierce bicinchoninic acid (BCA) protein assay reagents A and B, and 4′,6-diamidino-2-phenylindole (DAPI) were obtained from Thermo Fisher Scientific (Invitrogen, Grand Island, NY, USA). The FITC Annexin V apoptosis detection kit was purchased from BD Pharmingen (Franklin Lakes, NJ, USA). Acridine orange, crystal violet, and Triton X-100 were purchased from Sigma-Aldrich (St. Louis, MO, USA). Bovine serum albumin was purchased from Bovogen Biologicals Pty Ltd. (East Keilor, VIC 3033, Australia). Luminata™ Crescendo Western Horseradish Peroxidase (HRP) Substrate and polyvinylidene difluoride membrane were purchased from Merck Millipore Korea (Seoul, Republic of Korea).
2.3. Antibodies
Primary antibodies against HDAC1 (ab7028-50), HDAC2 (ab219053), HDAC3 (ab7030-50), HDAC4 (#2072), HDAC5 (sc-133225), HDAC6 (ab133493), HDAC7 (sc-74563), acetyl histone H3 (#9677), acetyl histone H4 (sc-8660-R), α-tubulin (sc-8035), acetyl α-tubulin (#5335), tissue inhibitors of metalloproteinase (TIMP) 1 (ab1827), TIMP 2 (sc-5539), metalloproteinase (MMP) 2 (sc-13595), MMP 9 (sc-10737), Cyclin A (sc-751), Cyclin B1 (#4138), Cyclin D1 (sc-718), Cyclin E (sc-481), cyclin-dependent kinase (CDK) 1 (ab133327), CDK 2 (ab7954-1), CDK 4 (sc-260), CDK 6 (sc-7181), P21 (sc-6246), P27 (sc-528), P16 (sc-468), B-cell lymphoma 2 (Bcl2)-associated protein x (Bax; ab32503), Bcl 2 (ab32124), Caspase 3 (#9662s), Cleaved caspase 3 (#9661), Caspase 8 (#4790), Caspase 9 (#9508), P53 (#2527), Phospho P53 (#9286), cytochrome C (sc-7159), poly-ADP ribose polymerase (PARP; sc-7150), Cleaved PARP (#5625S), light chain 3 (LC3; ab51520), P62 (ab56416), autophagy-related gene (ATG) 7 (#2631), ATG 5 (#12994), Beclin 1 (#3738S), mTOR (#2983S), Phospho-mTOR (#2971S), adenosine monophosphate-activated protein kinase (AMPK; 2532), Phospho AMPK (2535), extracellular signal-regulated kinase (ERK; A4782), Phospho ERK (sc-7383), P38 (#9212), Jun N-terminal kinase (JNK; #9252), phosphoinositide 3-kinase (PI3K; #4292S), Phospho PI3K (#4228), AKT (#9272), Phospho AKT (#9271S), and β-Actin (sc-8432). The HRP-conjugated secondary antibodies were purchased from Santa Cruz Biotechnology (Santa Cruz, CA, USA).
2.4. Cell Culture Condition and Viability Assay
The American Type Culture Collection (Manassas, VA, USA) supplied the human TNBC cell line MDA-MB 231. These cells were cultured in DMEM supplemented with 10% FBS and 1% AA, following standard incubation conditions at 37 °C in a humidified atmosphere containing 5% CO2. The MTT assay was used to assess the metabolic activity, proliferation, cell viability, and cytotoxicity of MDA-MB 231 cells. Following 24 h after 5 × 10⁴ cells per well were seeded into 96-well plates. The cells were subjected to BKS-112 treatment at concentrations of 2, 10, and 50 µM, along with SAHA (5 µM) as the standard control. After treatment, 100 µL of MTT reagent was added and incubated at 37 °C for 3 h, followed by a 30-min incubation with DMSO. Finally, the absorbance was measured at 540 nm using a VERSA Max Microplate Reader (Molecular Devices Corp., San Jose, CA, USA).
2.5. Colony Formation Assay
The colony formation assay is an in vitro cell survival experiment that assesses the capacity of individual cells to form colonies. In this assay, 1 × 10³ cells were seeded per well in 6-well plates and incubated for 24 h. Subsequently, the cells were subjected to treatment with a BKS-112 (at concentrations of 2, 10, and 50 µM) along with SAHA (5 µM) as the standard control, and this treatment continued for two weeks. After treatment, the cells were washed twice, fixed with 4% paraformaldehyde, and stained with crystal violet. Finally, the stained colonies were imaged and analyzed using an image analyzer.
2.6. HDAC6 Activity Assay
The HDAC6 Activity Assay Kit Cat. No. ab284549), enables the evaluation of HDAC6 deacetylase activity by utilizing a synthetic acetylated peptide substrate that generates an AFC fluorophore that is easily detectable using a standard microplate reader. To perform the assay, cells were initially cultured and treated with varying concentrations of BKS-112 (2, 10, and 50 µM) and SAHA (used as a standard control at 5 µM). Subsequently, a lysis buffer was added, followed by centrifugation at 16,000× g for 10 min at 4 °C to collect the lysate supernatant. After BCA protein analysis, an appropriate amount of lysate was transferred into a 96-well white plate. An HDAC6 inhibitor control, tubacin (2 µL of 10X Tubacin), was introduced and incubated at 37 °C for 10 min. Following this, a positive control (ranging from 25 to 50 µL) was added, and the sample and positive control volumes were adjusted to 50 μL per well using HDAC6 Assay Buffer. The substrate mix (50 μL) was then added and thoroughly mixed, and the plate was sealed for a 30-min incubation at 37 °C. To halt the reaction, 10 μL of a developer was added to each well and further incubated for 10 min at 37 °C. Finally, fluorescence measurements were performed in the endpoint mode with excitation/emission wavelengths of 380/490 nm.
2.7. Immunocytochemistry
MDA-MB 231 cells were cultured in confocal dishes to provide a controlled environment for subsequent treatment. Cells were exposed to varying concentrations of BKS-112. After 48 h, the cells were fixed with acetone for 20 min, and excess fixative was removed using ice-cold phosphate-buffered saline (PBS). To prepare the cells for immunofluorescence analysis, they were treated with 10% normal goat serum in PBS for 30 min. Subsequently, the cells were incubated with primary antibody targeting HDAC6 (ab133493, 1:400 dilution) at 35 °C for 3 h. After washing with PBS, cells were incubated with Alexa Fluor 488-conjugated goat anti-rabbit IgG secondary for 30 min at room temperature in the dark. Cells were then counterstained with 0.1 μg/mL DAPI in PBS for 5 min to visualize nuclei. After final PBS washes, the treated and stained cells were analyzed using a K1-fluo fluorescence microscope (Nanoscope Systems, Daejeon, Republic of Korea) at 400× magnification. HDAC6 immunofluorescence was detected in the green channel (excitation ~488 nm/emission ~520 nm for Alexa Fluor 488), and DAPI nuclear staining was detected in the blue channel (excitation 405 nm/emission ~460 nm). The treated and stained cells were analyzed using a K1-fluo microscope (Nanoscope Systems, Daejeon, Republic of Korea) at 400× magnification.
2.8. Western Blot Analysis
Western blotting is a laboratory technique that employs gel electrophoresis to separate and identify proteins based on their molecular weight. In this experiment, MDA-MB 231 cells were cultured and treated with a BKS-112 at concentrations of 2, 10, and 50 µM and with SAHA at 5 µM. After 48 h of treatment, the cells were collected and lysed using PRO-PREP cell lysis buffer, and the protein content in the lysates was quantified using a BCA protein assay. Quantified lysates were loaded onto sodium dodecyl-sulfate-polyacrylamide gel electrophoresis gels and subsequently transferred onto nitrocellulose membranes. The membranes were blocked and subjected to immunoblotting using specific primary antibodies and HRP-conjugated secondary antibodies. Finally, the protein bands were visualized using the Luminata™ Crescendo Western HRP Substrate and captured with a ChemiDoc imaging system (Bio-Rad, Hercules, CA, USA).
2.9. Wound-Healing Assay
A wound-healing assay is a method employed to investigate cell migration and cell-to-cell interactions. In this study, 2 × 10⁴ cells were seeded per well in 96-well plates and allowed to grow for 24 h until the confluence exceeded 95%. Wounds were then created using a Wound Maker (Essen Bioscience, Ann Arbor, MI, USA) and subsequently treated with a BKS-112 at concentrations of 2, 10, and 50 µM, in addition to SAHA at 5 µM. Images of the wounded areas were captured at 6-h intervals, and the relative wound-healing density was quantified using IncuCyte® ZOOM 2016B software (Essen Bioscience, Ann Arbor, MI, USA).
2.10. Cell Cycle Analysis
Flow cytometry is a powerful technique capable of detecting cell populations at various phases of the cell cycle (G0/G1, S, and G2/M) and identifying apoptotic cells (sub-G0). For this experiment, 4 × 10⁴ cells per well were cultured in a 60 × 15 mm dish and treated with BKS-112 at concentrations of 2, 10, and 50 µM in addition to SAHA at 5 µM. The treated cells were then harvested, washed with cold DPBS, and subsequently fixed with ice-cold 70% pure ethanol overnight at 4 °C. Following fixation, the cells were stained with a propidium iodide staining solution (10 µL/mL) combined with RNAase (5 µg/mL) in cold DPBS, and the cell suspension was incubated for 30 min at 37 °C in the dark. Flow cytometry analysis was performed using the Guava® EasyCyte flow cytometer (Merck Millipore, Burlington, MA, USA).
2.11. Apoptotic Flow Cytometry Analysis
Apoptosis, a process initiated by the binding of annexin V to phosphatidylserine residues on the cell membrane, is commonly examined using flow cytometry. In this study, 4 × 10⁴ cells were seeded per well in a 60 × 15 mm dish and allowed to grow for 24 h. Subsequently, the cells were treated with a BKS-112 at concentrations of 2, 10, and 50 µM, along with SAHA at 5 µM. After this treatment period, the entire cell population, including both live and dead cells, was harvested for flow cytometry analysis employing the BD Pharmingen™ FITC Annexin V Apoptosis Detection Kit (BD Biosciences, San Diego, CA, USA). The harvested cells were stained with annexin V Recom FITC (2 µL) and propidium iodide staining solution (4 µL), which were diluted with annexin V 1X binding buffer (100 µL), and the staining was conducted for 30 min in the dark. Subsequently, the stained cells were suitably diluted with 1X binding buffer and analyzed using flow cytometry (Guava EasyCyte flow cytometer; Merck Millipore, Burlington, MA, USA).
2.12. DAPI Staining
DAPI staining was used to evaluate the overall cell morphology, determine the number of nuclei, and identify apoptotic nuclei characterized by fragmented or condensed chromatin. First, 1 × 10³ cells/well were seeded into a confocal dish and allowed to grow for 24 h. Subsequently, the cells were treated with BKS-112 at concentrations of 2, 10, and 50 µM, along with SAHA at 5 µM. The dishes were then rinsed twice with DPBS, and a 300 nM DAPI staining solution was added to the cells. The staining solution was incubated for 1–5 min in the dark at room temperature. Following the DAPI staining period, the DAPI solution was removed, and the cells were washed with DPBS five times to eliminate any debris. Apoptotic bodies and nuclear morphology within the cells were analyzed using a K1-fluo microscope at 400× magnification (Nanoscope Systems, Daejeon, Republic of Korea).
2.13. Determination of Intracellular Reactive Oxygen Species
MDA-MB-231 cells were seeded into a 96-well black plate and allowed to incubate for 24 h. The cells were then treated with BKS-112 at concentrations of 2, 10, and 50 µM, alongside SAHA (5 µM) as a reference compound. After a 48-h incubation period, the media were removed, and the wells were washed with Dulbecco’s phosphate-buffered saline (DPBS). To assess reactive oxygen species (ROS) generation, 20 µM of 2′,7′-dichlorofluorescin diacetate (DCFDA) was added to each well (100 µL per well, excluding black wells). For the black wells, 100 µL of FBS buffer was added instead, and the cells were incubated for an additional 45 min. Finally, 100 µL of the positive control was added to the designated wells, and fluorescence was measured using the PerkinElmer Multilabel Plate Reader_EnVision™ (DawinBio, Gyeonggi-do, Republic of Korea).
2.14. Autophagy Assay
In this study, 4 × 10⁴ cells were seeded per well in a 60 × 15 mm dish and allowed to grow for 24 h. Subsequently, the cells were treated with BKS-112 at concentrations of 2, 10, and 50 µM, along with SAHA at 5 µM for 48 h. The cells were stained with a rhodamine solution (0.5 µM), which was diluted with DPBS, and the staining was conducted for 3 h in the dark. After this staining period, the entire cell population, including both live and dead cells, was harvested for flow cytometry. Subsequently, the stained cells were suitably diluted with DPBS and analyzed using flow cytometry (Guava EasyCyte flow cytometer; Merck Millipore, Burlington, MA, USA).
Acridine orange is a fluorescent dye known to emit distinct colors and selectively bind to DNA or RNA in cells, aiding in the differentiation of cellular organelles. For the staining procedure, 1 × 10³ cells were seeded per well in a confocal dish and incubated for 24 h. Subsequently, the cells underwent treatment with BKS-112 at concentrations of 2, 10, and 50 µM and SAHA at 5 µM, serving as the standard control, for 48 h. Following treatment, the cells were rinsed with DPBS and stained with acridine orange (5 mg/mL) for 15 min. The stained cells were thoroughly washed five times with DPBS to eliminate excess dye. Acridine orange fluorescence was detected using dual-wavelength emission: green fluorescence (excitation 488 nm, emission 530 nm) for cytoplasm and nuclei, and red fluorescence (excitation 488 nm, emission > 600 nm) for acidic vesicular organelles including autophagosomes and lysosomes. Subsequently, the cells were examined under a K1-fluo microscope at 400× magnification (Nanoscope Systems, Daejeon, Republic of Korea).
Rhodamine 123 is a fluorescent dye with a strong affinity for mitochondria in living cells, making it useful for evaluating the mitochondrial membrane potential. In our experiment, cells were cultured and treated with BKS-112 alongside SAHA (used at 5 µM as the standard control) within a 6-well plate. Subsequently, a solution containing rhodamine 123 (0.5 mM) was prepared by adding it to 2 mL of DMEM and evenly distributing it across the cells in a 6-well plate. The plate was covered with foil and incubated for 3 h. After incubation, the cells were harvested, their pellet was washed with DPBS, and 1 mL of cold DPBS was added for subsequent flow cytometry analysis. Flow cytometry was used to examine and analyze the rhodamine-stained cells using a Guava EasyCyte flow cytometer (Merck Millipore, Burlington, MA, USA).
2.15. Statistical Analysis
The data in our study are presented as the mean value along with the standard deviation (mean ± SD). To assess the statistical differences among various groups, we employed analysis of variance (ANOVA), followed by Tukey’s multiple comparison tests. For all statistical assessments, we used a significance level of 5% (p < 0.05). Statistical analysis was performed using values representing the mean ± standard deviation (*** p < 0.001, ** p < 0.01, and * p < 0.05) using the GraphPad Prism Software (version 5.0; GraphPad Software, San Diego, CA, USA).
4. Discussion
TNBC is a heterogeneous and recurrent cancer characterized by high metastasis rates, poor prognosis, and limited therapeutic targets. Despite advancements in targeted cancer therapies, effective treatment options for TNBC remain elusive [
24]. Clinical trials are currently investigating the efficacy of HDAC inhibitors in treating various malignancies, including head and neck cancer, Hodgkin’s lymphoma, and breast cancer [
25,
26]. Recent studies have demonstrated the anticancer properties of HDAC inhibitors, which include the inhibition of cell proliferation, colony formation, and migration, as well as the induction of apoptosis, cell cycle alterations, and autophagy. Notably, ACY-1215 (ricolinostat), a well-known HDAC6 inhibitor, has shown efficacy inducing cell proliferation inhibition, apoptosis, and G1 cell cycle arrest, exhibiting significant anti-tumor effects in TNBC cells [
27]. In our study, we demonstrated that the suppression of cell survival and proliferation by BKS-112 treatment. Morphological changes and a reduction in colony formation with BKS-112 treatment further underscored its impact on MDA-MB-231 cells. Our findings also revealed that BKS-112 inhibited MDA-MB-231 cell migration, as demonstrated by a wound-healing assay that graphically depicted relative wound density.
BKS-112 regulated α-tubulin acetylation and decreased HDAC6 expression in MDA-MB-231 cells, resulting in reduced tumor growth and invasiveness compared to SAHA. HDAC6 activity assays demonstrated that BKS-112 effectively inhibited HDAC6 expression in a dose-dependent manner. Specifically, BKS-112 increased microtubule acetylation by inhibiting HDAC6, thereby impeding cancer cell migration. In this study, we employed SAHA (vorinostat) as the reference compound for evaluating BKS-112’s anticancer activity. While highly selective HDAC6 inhibitors such as ACY-1215 and tubacin exist, SAHA was chosen as a clinically relevant benchmark for several important reasons. SAHA is an FDA-approved pan-HDAC inhibitor with extensive clinical validation in cancer treatment and well-documented activity in TNBC models, providing a robust therapeutic standard for comparison. Although BKS-112 was rationally designed for HDAC6 selectivity and demonstrates 126-fold selectivity for HDAC6 over HDAC1 (IC
50 = 42.98 nM for HDAC6 vs. 5432 nM for HDAC1) [
23], our Western blot analysis (
Figure 2E,F) reveals that BKS-112 also exhibits moderate inhibitory activity against HDAC3 and HDAC4 while sparing HDAC1, HDAC2, and HDAC5. This profile indicates that BKS-112 functions as a moderately selective multi-HDAC inhibitor with preferential HDAC6 activity rather than an exclusively HDAC6-specific inhibitor. In contrast, SAHA causes a broad reduction in HDAC1-7 expression. Therefore, comparing BKS-112 to SAHA allowed us to evaluate whether selective enrichment of HDAC6 inhibition, combined with moderate HDAC3/4 activity, could achieve comparable or superior anticancer efficacy to broad-spectrum HDAC inhibition while potentially reducing toxicity through sparing of class I HDACs critical for normal cellular function. Our results demonstrate that BKS-112 achieves superior effects on colony formation and migration inhibition compared to SAHA (
Figure 1E–H), despite its more selective inhibition profile, suggesting therapeutic advantages of this selectivity pattern. The coordinated inhibition of HDAC6, HDAC3, and HDAC4 by BKS-112 may synergistically contribute to its potent anticancer effects, as these isoforms play distinct but complementary roles in cancer cell survival and progression. In the highly invasive TNBC cell line MDA-MB-231, HDAC6 was identified as a critical regulator of cytoskeletal remodeling and cellular migration, as well as a significant contributor to proteolysis within a two-dimensional matrix [
22]. Cell cycle arrest at specific checkpoints is a critical mechanism that facilitates cell death [
28]. Numerous anticancer agents function through diverse intracellular signaling pathways to inhibit cell proliferation, thereby modulating the cell cycle [
29]. There was a decrease in the percentage of cells in the G1 phase, the initial phase of the cell cycle for DNA synthesis and replication. Conversely, there was an increase in the percentage of cells in the G2 phase, suggesting a cellular response to stress, DNA damage, or regulatory mechanisms induced by BKS-112 treatment. The G2 checkpoint primarily regulates the mitosis-promoting functions of cyclin B/CDK1 complex [
29]. HDAC inhibitors were shown to elevate the expression of p21, a molecule that inhibits the cyclin–CDK complex, which is essential for cell cycle progression [
30]. Furthermore, the maintenance phase of the G2 checkpoint is likely influenced, at least in part, by transcriptional programs regulated by p53.
Our study demonstrates that BKS-112 exhibits anticancer properties by suppressing cyclins and CDKs in MDA-MB-231 cells, which are key regulators of the cell cycle. This downregulation can help overcome resistance mechanisms, rendering cancer cells more susceptible to treatment. In the presence of the HDAC6 inhibitor BKS-112, p21 and p27 bind to cyclins, thereby enhancing the compound’s anticancer effects. This interaction activates p21 and p27, effectively decelerating the cell cycle—an advantageous outcome in cancer therapy aimed at controlling unchecked cell proliferation [
31].
A previous study reported that HDAC6 protein is produced, and influences client proteins involved in promoting cellular proliferation, anti-apoptotic signaling, and cell cycle regulation in response to cellular stress [
25]. Our findings indicate that BKS-112 significantly increased the population of apoptotic cells in a dose-dependent manner. This compound effectively suppressed cell proliferation, potentially enhancing cancer treatment efficacy by rapidly reducing the cancer cell population. The intrinsic apoptotic pathway modulated by BKS-112 involves the regulation of both pro-apoptotic and anti-apoptotic Bcl-2 family proteins. The tumor suppressor gene p53 plays a central and pivotal role in the complex machinery of apoptosis, a programmed cell death process [
31]. In our study, Bax and Bcl-2, serving as facilitators and suppressors of apoptosis, respectively, were critical determinants of cell fate in response to apoptotic stimuli. The increased DAPI fluorescence intensity, indicating chromatin condensation within the nucleus, confirmed the presence of apoptotic nuclei following BKS-112 treatment, underscoring its role in promoting programmed cell death.
Furthermore, it has been reported that HDAC6 plays a protective role in facilitating the clearance of misfolded protein aggregates under conditions of cellular stress, ensuring their elimination within autophagosomes [
32]. This process is likely mediated by the ubiquitin-binding protein p62, which has a high binding affinity for LC3 and aids in the removal of protein aggregates [
33,
34]. In the control group, minimal red fluorescence was observed, indicating the absence of autophagic vacuoles. In contrast, cells treated with BKS-112 exhibited higher red fluorescence intensity, especially at 48 h, reflecting the presence of autophagic vacuoles. BKS-112 treatment led to two significant changes: an increase in LC3 levels, indicating enhanced autophagic activity, and a decrease in p62 levels, signifying the degradation of cellular components during autophagy.
The recruitment of various elements such as autophagy-related genes (ATGs), aggregates, and lysosomes to aggresomes is contingent on two key factors: the structural integrity of the microtubule cytoskeleton and the enzymatic activity of HDAC6, which is responsible for deacetylating tubulin [
32]. In the context of BKS-112-induced autophagy in MDA-MB-231 cells, the activities of ATG and Beclin, genes associated with cancer initiation and progression, were heightened. This suggests that BKS-112 treatment activates these genes, potentially facilitating cancer initiation and progression in MDA-MB-231 cells during autophagy-induced cellular stress.
ROS levels are predominantly regulated by cellular metabolism, while ROS simultaneously influence energy metabolism by modulating key metabolic enzymes and signaling pathways involved in oncogenesis [
35]. AMP-activated protein kinase (AMPK) is crucial for maintaining redox balance, and NADPH acts as a reducing agent in enzymatic processes while also serving as an antioxidant to counter ROS [
36]. HDAC6 is intricately associated with the PI3K/AKT and MAPK/ERK signaling pathways. Inhibiting HDAC6 results in the dephosphorylation of AKT and ERK, thereby suppressing cell proliferation and promoting apoptosis. Additionally, HDAC6 inhibition induces the hyperacetylation of heat shock protein 90, which further reduces the phosphorylation levels of AKT and ERK [
37,
38]. HDAC6 also prevents the translocation of apoptotic signaling proteins from the cytosol to the mitochondria [
39,
40]. The regulation of HDAC6 expression activates MAPK pathways, including ERK, JNK, and p38 signaling pathways. These findings suggest that ROS may contribute to the induction of cell death during apoptosis and could play a regulatory role in autophagy through the MAPK signaling pathway [
41]. Recent studies have revealed new molecular insights into TNBC progression and treatment resistance. Zhang et al. (2024) demonstrated that the RNA-binding protein POP1 promotes TNBC proliferation through m6A-dependent degradation of CDKN1A mRNA, identifying a potential therapeutic role for the m6A inhibitor STM2457 in suppressing tumor growth [
42]. Similarly, Zhang et al. (2025) reported that PRMT1-mediated PARP1 methylation activates the NF-κB (P65) signaling pathway, thereby enhancing lung metastasis and docetaxel resistance [
43].
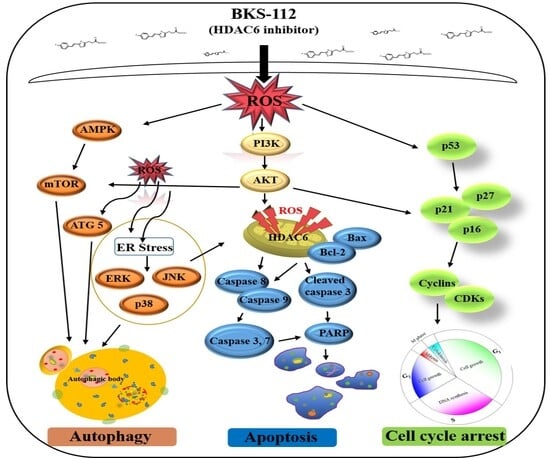
BKS-112 exerts its effects by modulating multiple cellular pathways that are critical to cancer initiation and progression. Mitochondria-generated ROS serve a dual function in cancer, either supporting cell survival or inducing cell death in MDA-MB-231 cells. The PI3K/AKT pathway, essential in cancer biology, influences cell proliferation, metastasis, and drug resistance. The BKS-112 treatment affects key autophagic and apoptotic pathways, including ATG5, PI3K-AKT-mTOR, and MAPK signaling, promoting ROS-mediated apoptosis by altering the Bcl-2/Bax balance and activating cleaved caspase-3. Additionally, BKS-112 triggers mitochondrial apoptosis and autophagy through MAPK pathways, such as ERK, JNK, and p38, in MDA-MB-231 cells. It induces G1 phase cell cycle arrest and causes endoplasmic reticulum stress, leading to caspase-dependent apoptosis. The compound also halts the cell cycle at the G0/G1 phase by stimulating ROS production and inactivating the AKT/CDK/cyclin D1 pathway. These findings suggest a potential role for HDAC6 inhibition in TNBC prevention, with BKS-112 modulating multiple cellular pathways that influence breast cancer cell survival and death mechanisms.
Our choice of SAHA as a reference compound was scientifically justified based on its clinical relevance and BKS-112’s multi-HDAC activity profile. Direct head-to-head comparison with highly selective HDAC6 inhibitors such as ACY-1215 (ricolinostat) or tubacin would provide valuable complementary information. Such comparisons would help delineate whether the anticancer efficacy of BKS-112 results primarily from its potent HDAC6 inhibition or whether the additional moderate activity against HDAC3 and HDAC4 contributes synergistically to its therapeutic effects. Understanding the relative contributions of individual HDAC isoforms to BKS-112’s mechanism of action would facilitate optimization of selectivity profiles for future HDAC inhibitor development. Additionally, comparative studies with other selective HDAC6 inhibitors would better position BKS-112 within the landscape of HDAC-targeted therapies and identify potential advantages in terms of potency, selectivity, pharmacokinetics, or therapeutic index. These comparative evaluations are planned for future investigations to comprehensively characterize BKS-112’s therapeutic positioning for TNBC treatment. Although the current study provides detailed in vitro evidence for the HDAC6-selective inhibition and anticancer activity of BKS-112, certain limitations remain. These include the use of a single TNBC cell line, the absence of in vivo validation, and the lack of pharmacokinetic or toxicological data. Furthermore, potential assay interferences related to compound solubility and cellular heterogeneity cannot be excluded. Future studies will aim to validate BKS-112 across multiple breast cancer subtypes, explore its efficacy and safety in vivo, and investigate its impact on EMT and immune-regulatory pathways.


