
Biochelates from Spent Coffee Grounds Increases Iron Levels in Dutch Cucumbers but Affects Their Antioxidant Capacity

 , , , ,
  , and
, and 
Abstract
1. Introduction
2. Materials and Methods
2.1. SCG BioProducts
2.2. Greenhouse Experiment
2.3. Crop Maintenance
2.4. Plant Sampling and Processing
2.5. Fe Determination
2.6. In Vitro Digestion and Fermentation
2.7. Antioxidant Tests
2.7.1. Trolox Equivalent Antioxidant Capacity Versus Reducing Capacity (TEACFRAP Assay)
2.7.2. Trolox Equivalent Antioxidant Capacity Versus DPPH Radicals (TEACDPPH Assay)
2.7.3. Trolox Equivalent Antioxidant Capacity Versus ABTS+ Radicals (TEACABTS Assay)
2.7.4. Total Phenolic Content: Folin–Ciocalteu (FC) Assay
2.8. Analysis of Short-Chain Fatty Acids
2.9. Calculation of Daily Antioxidant and Fe Intakes
2.10. Statistical Analysis
3. Results
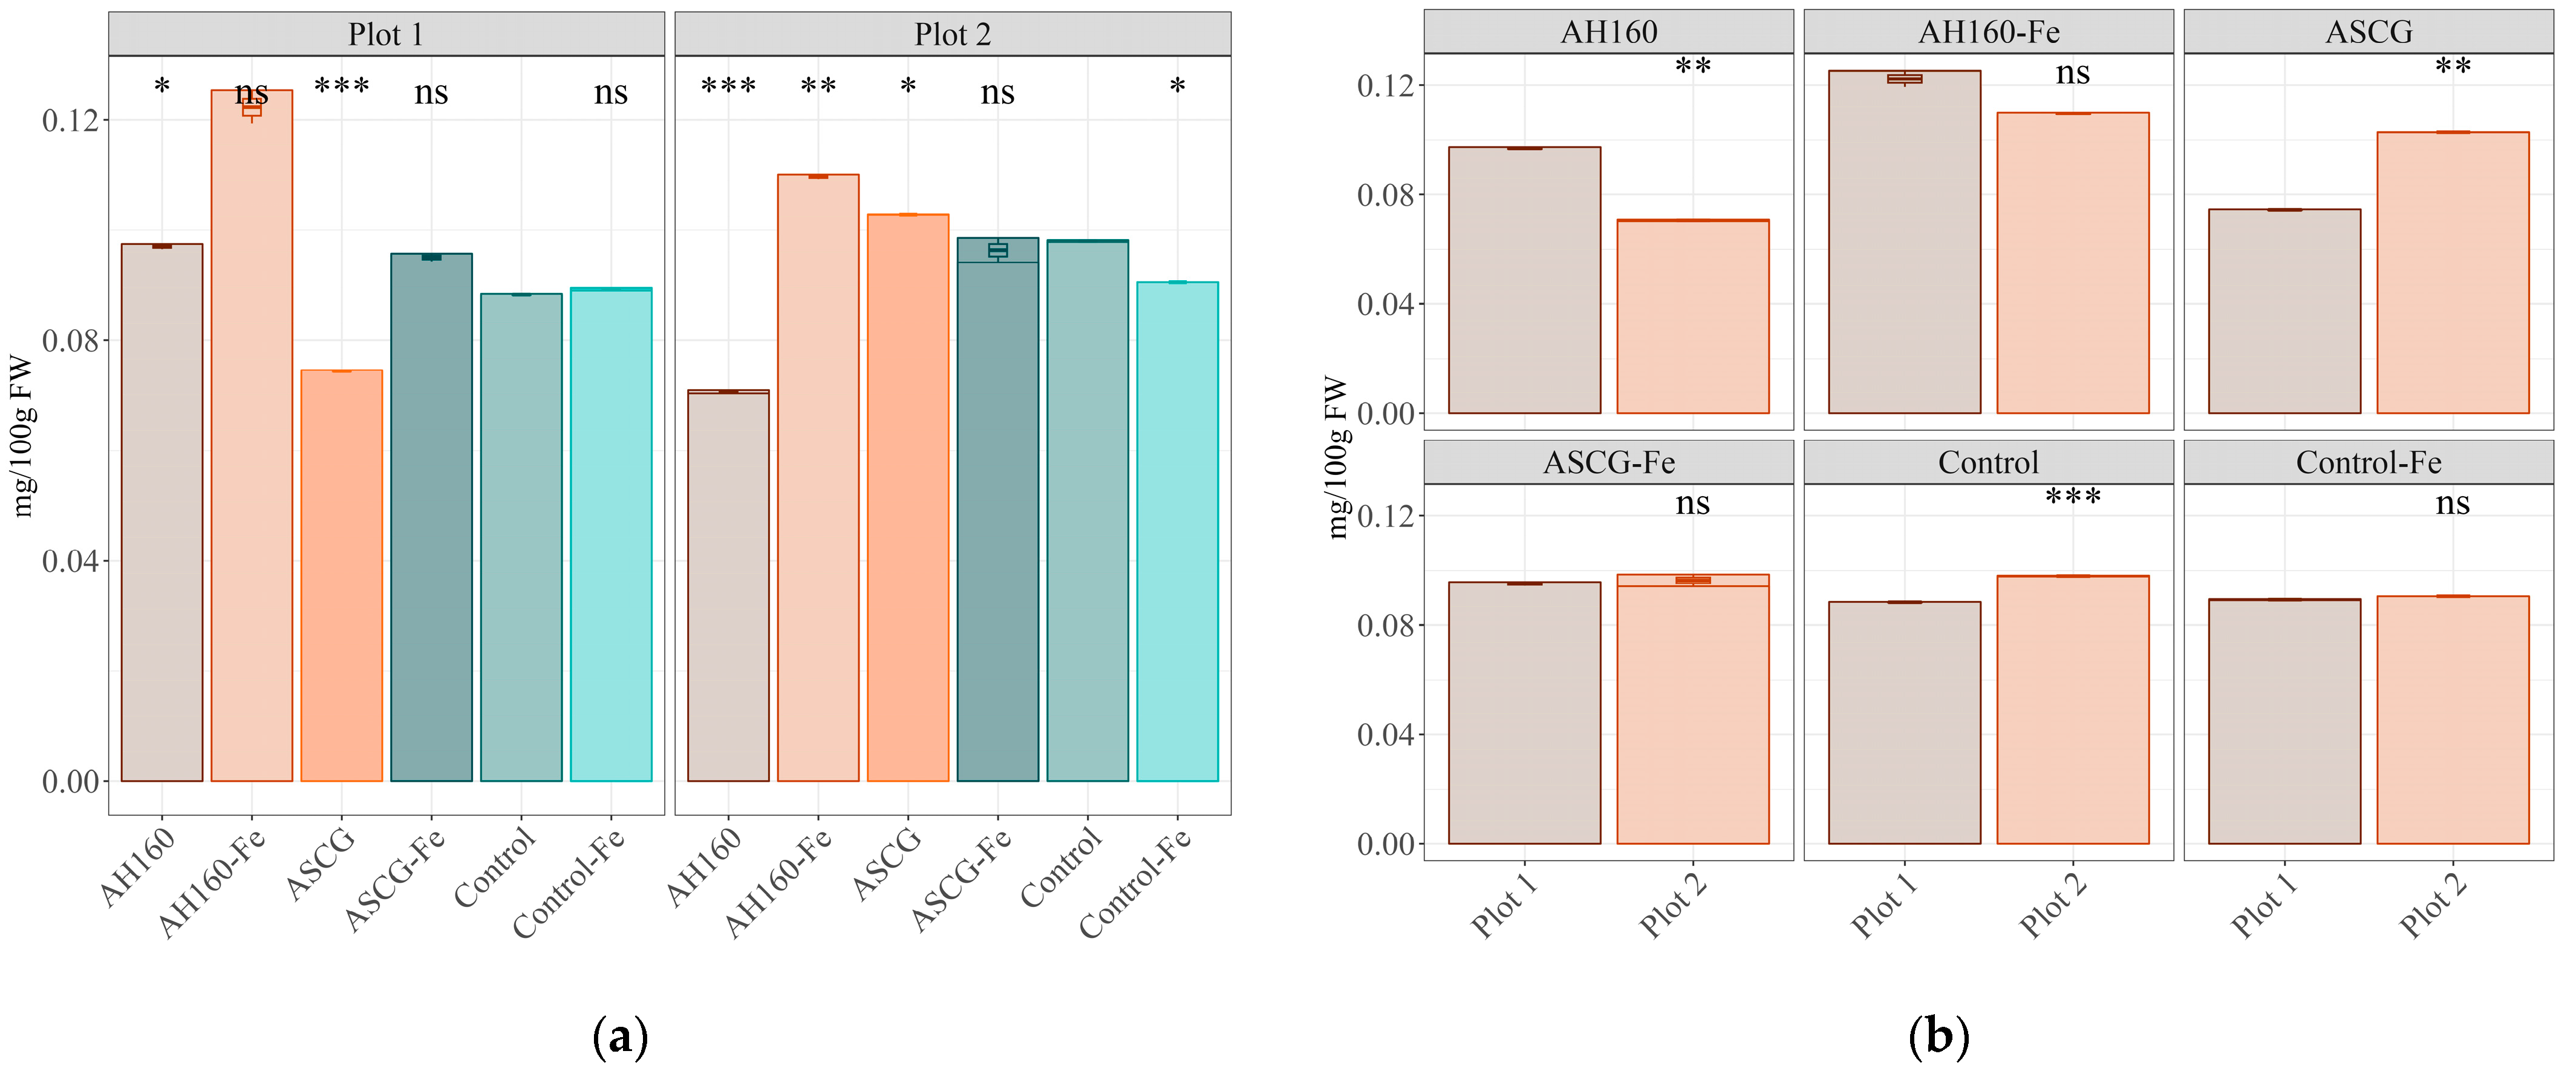
3.1. Fe Content
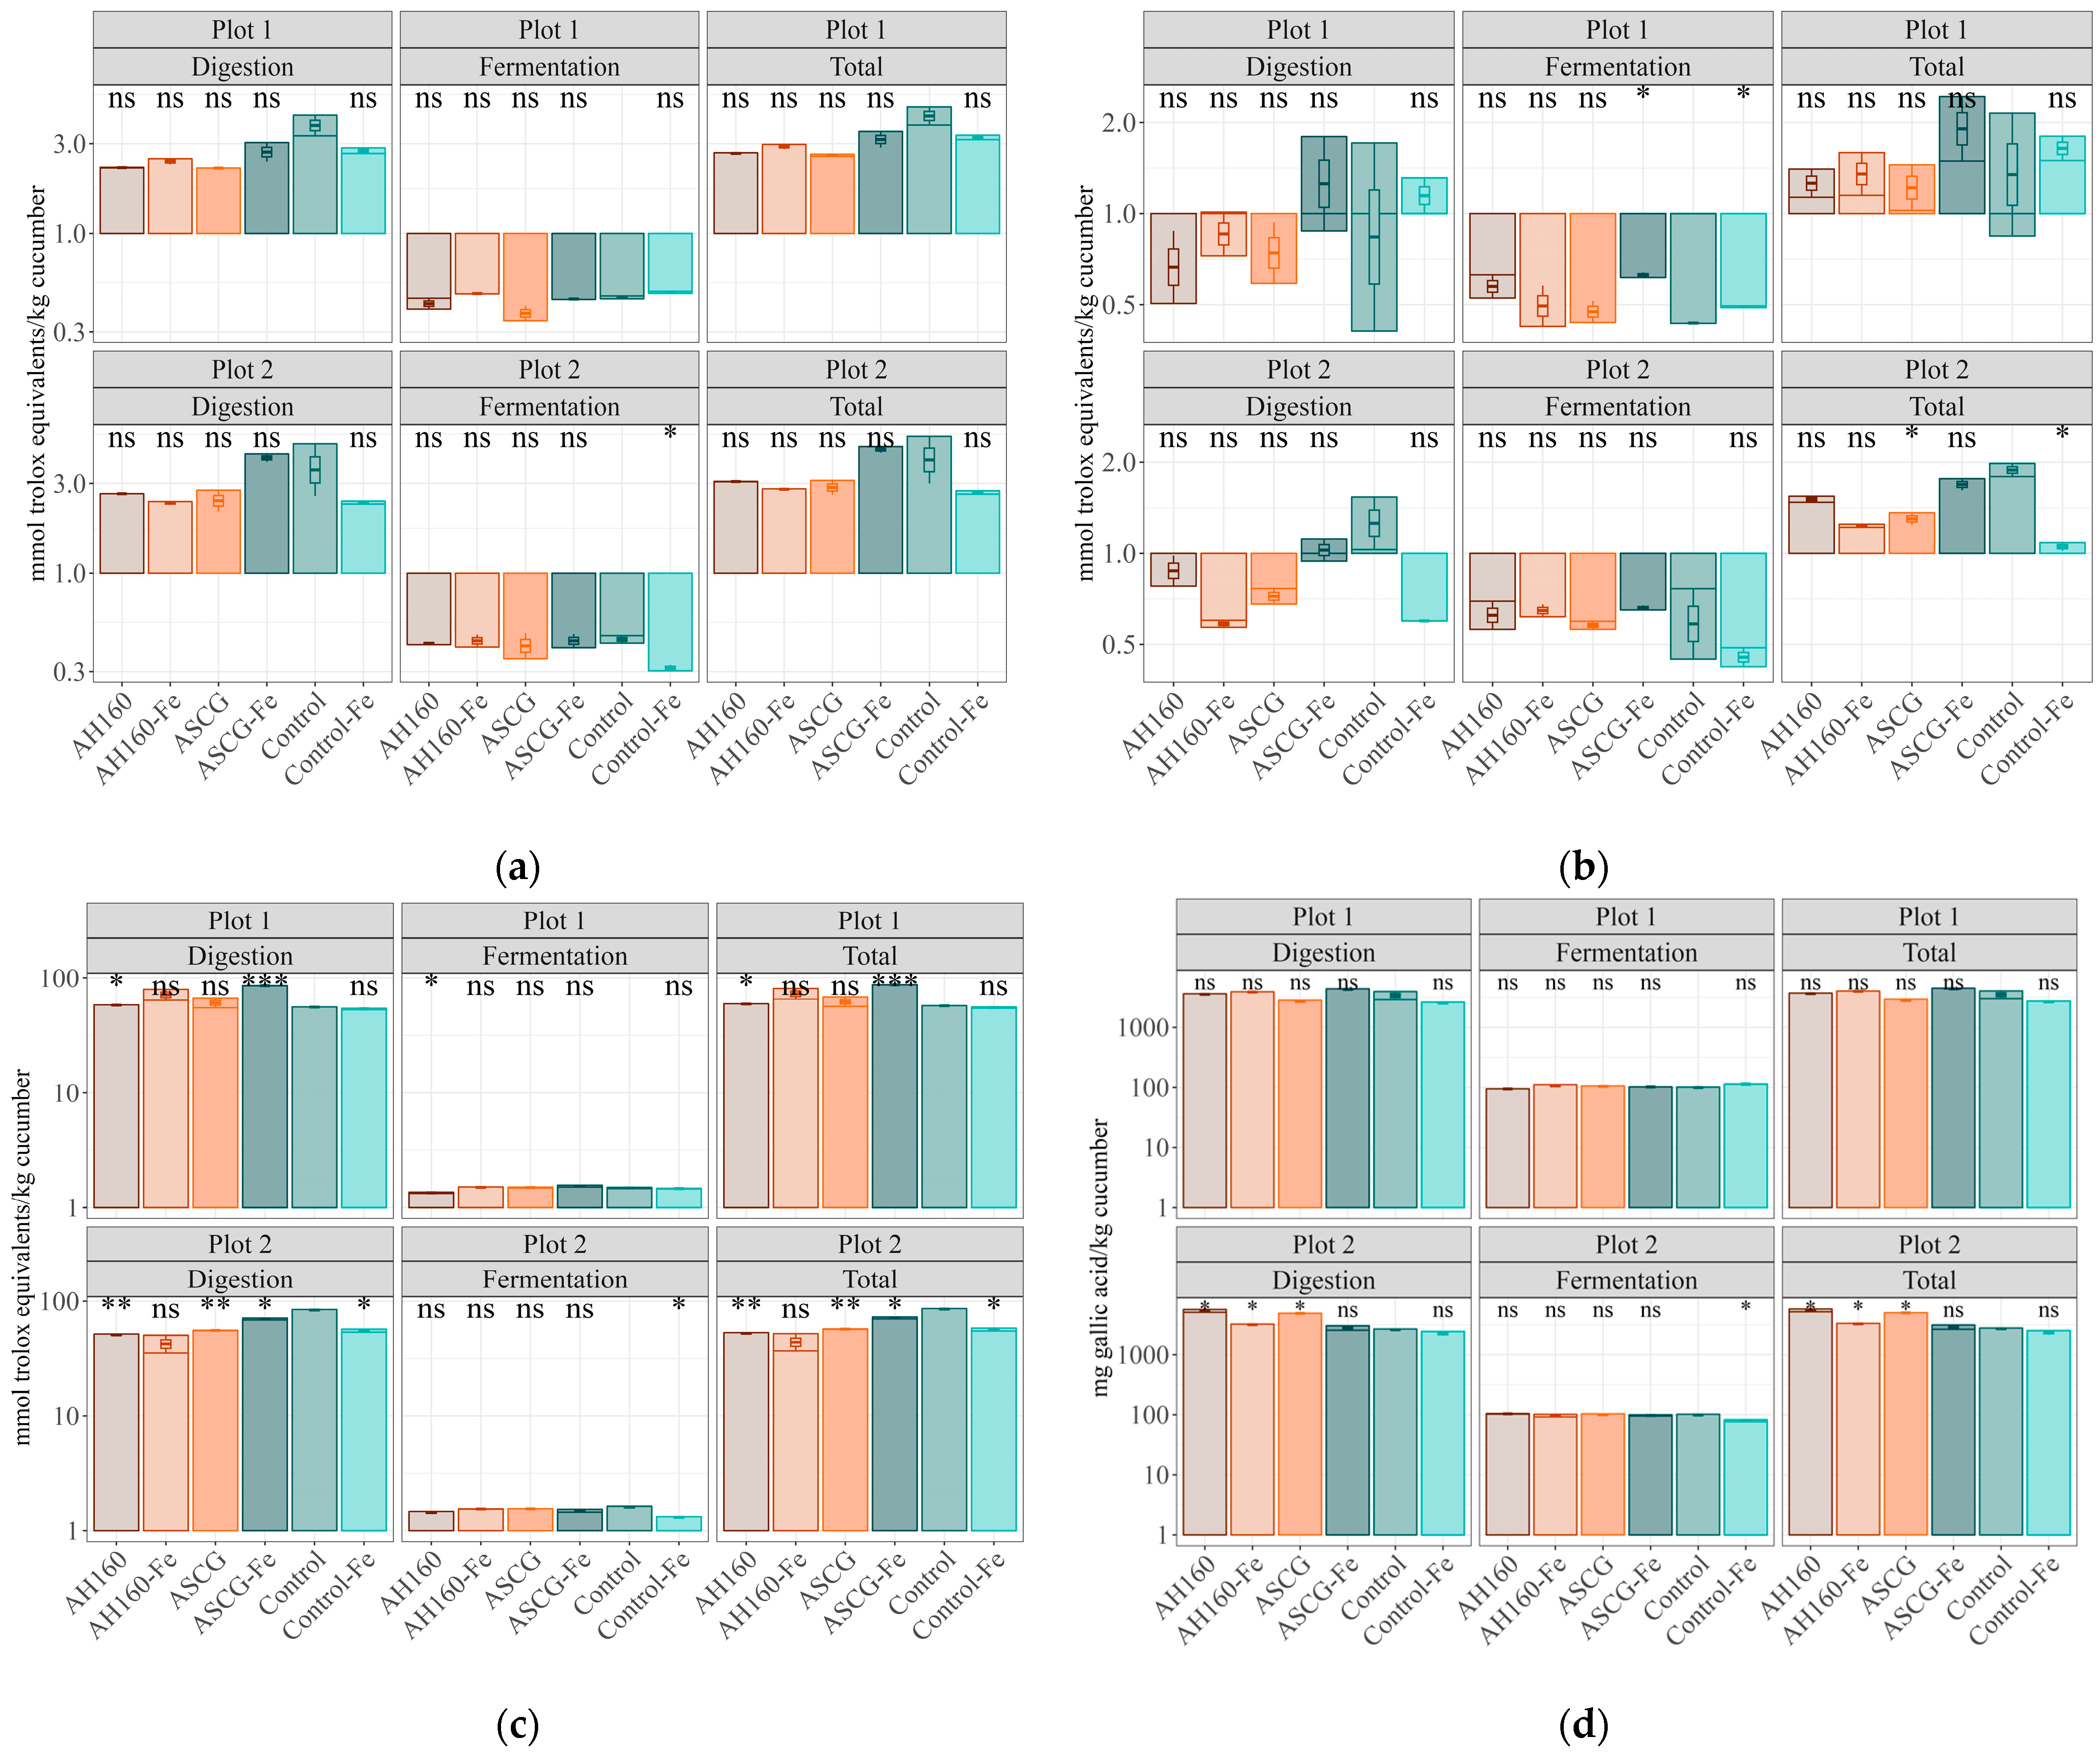
3.2. Antioxidant Capacity
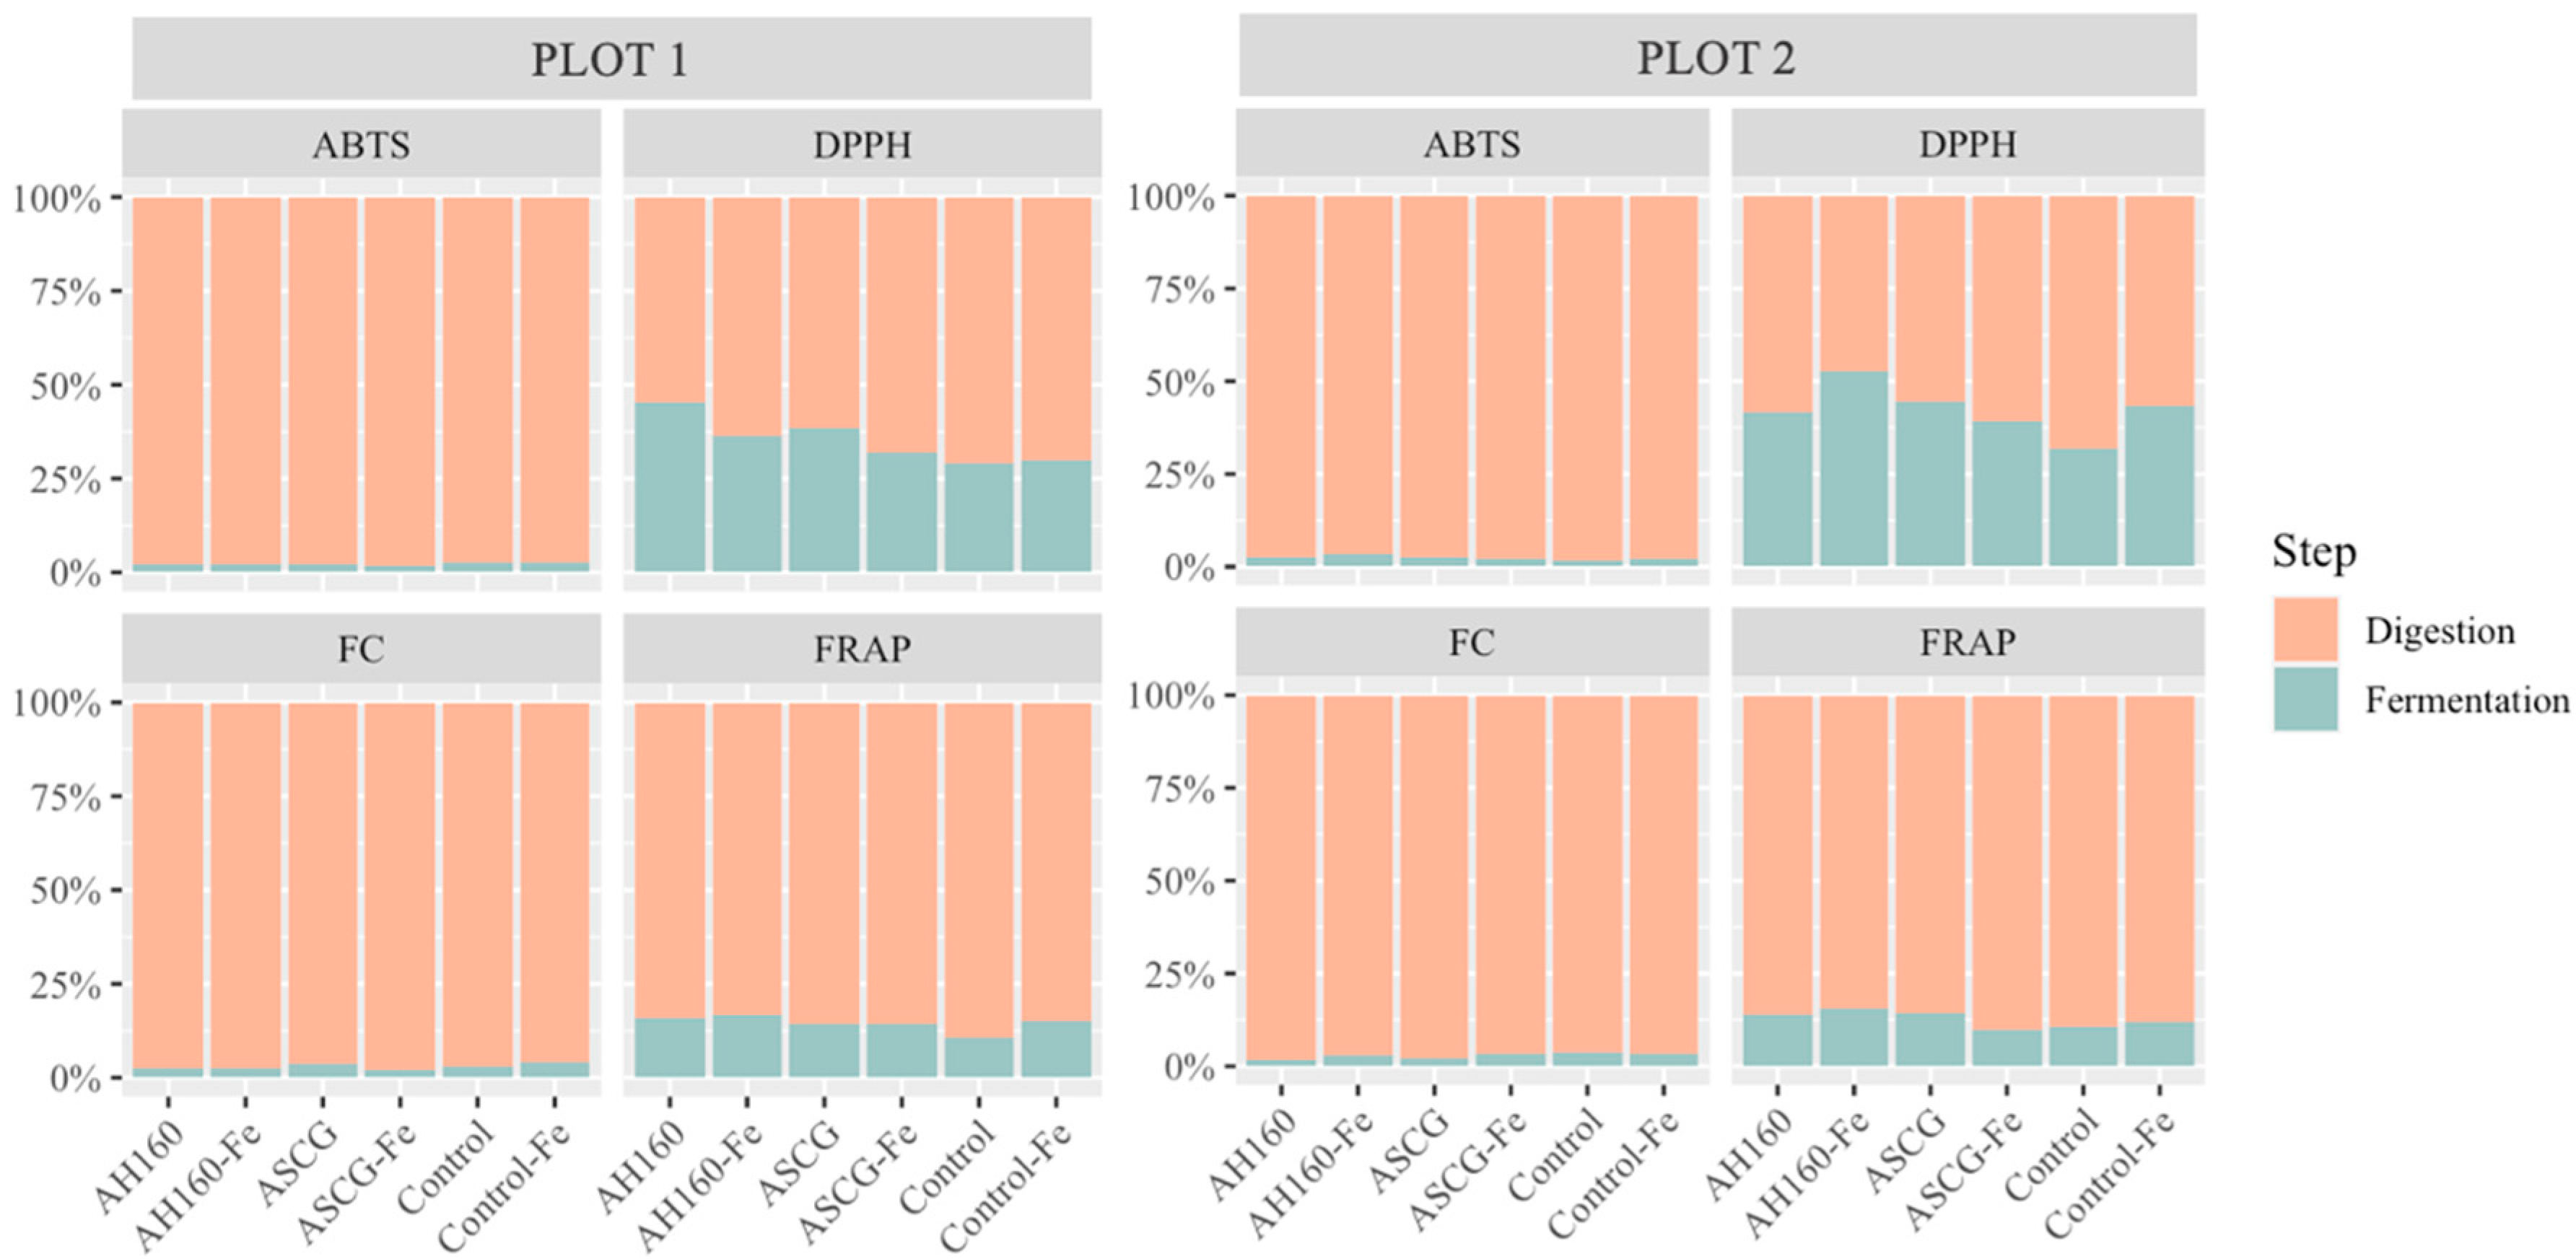
Differences in the Antioxidant Capacities of the In Vitro Digestion–Fermentation Fractions
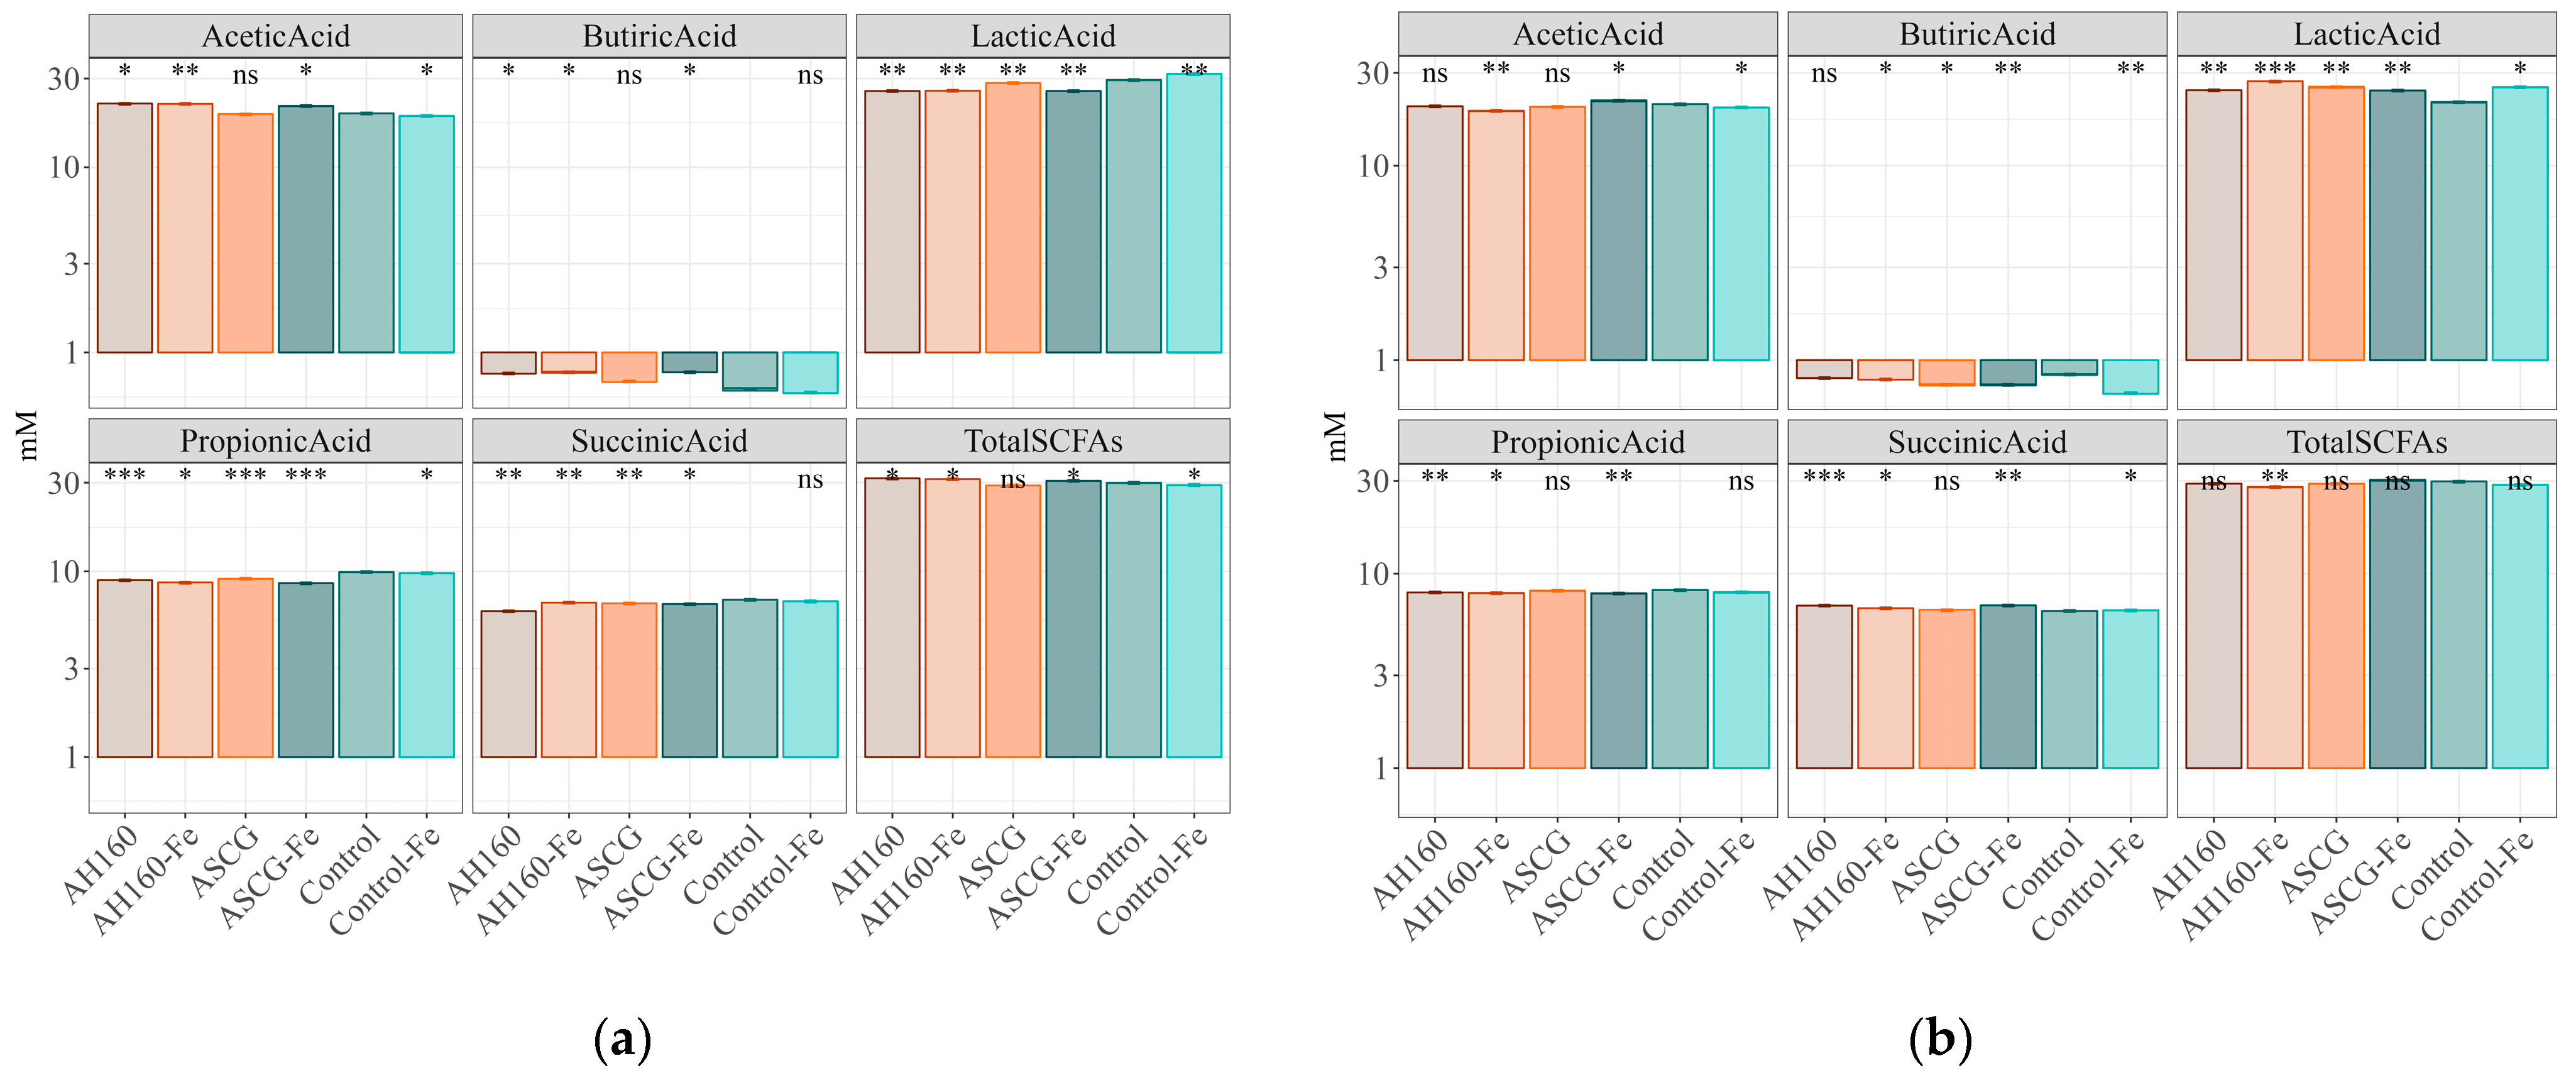
3.3. Short-Chain Fatty Acids Produced after In Vitro Fermentation
4. Discussion
5. Conclusions
Supplementary Materials
Author Contributions
Funding
Institutional Review Board Statement
Informed Consent Statement
Data Availability Statement
Acknowledgments
Conflicts of Interest
Abbreviations
References
- Kamil, M.; Ramadan, K.M.; Awad, O.I.; Ibrahim, T.K.; Inayat, A.; Ma, X. Environmental impacts of biodiesel production from waste spent coffee grounds and its implementation in a compression ignition engine. Sci. Total Environm. 2019, 675, 13–30. [Google Scholar] [CrossRef] [PubMed]
- Al-Hamamre, Z.; Foerster, S.; Hartmann, F.; Kröger, M.; Kaltschmitt, M. Oil extracted from spent coffee grounds as a renewable source for fatty acid methyl ester manufacturing. Fuel 2012, 96, 70–76. [Google Scholar] [CrossRef]
- Comino, F.; Cervera-Mata, A.; Aranda, V.; Martín-García, J.M.; Delgado, G. Short-term impact of spent coffee grounds over soil organic matter composition and stability in two contrasted Mediterranean agricultural soils. J. Soils Sed. 2020, 20, 1182–1198. [Google Scholar] [CrossRef]
- Yaashikaa, P.R.; Kumar, P.S.; Varjani, S.; Saravanan, A. A critical review on the biochar production techniques, characterization, stability and applications for circular bioeconomy. Biotechnol. Rep. 2020, 28, e0057. [Google Scholar] [CrossRef] [PubMed]
- Kumar, A.; Bhattacharya, T. Biochar: A sustainable solution. Environ. Dev. Sustain. 2021, 23, 6642–6680. [Google Scholar] [CrossRef]
- Palansooriya, K.N.; Ok, Y.S.; Awad, Y.M.; Lee, S.S.; Sung, J.-K.; Koutsospyros, A.; Moon, D.H. Impacts of biochar application on upland agriculture: A review. J. Environl. Manag. 2019, 234, 52–64. [Google Scholar] [CrossRef] [PubMed]
- Garbowski, T.; Bar-Michalczyk, D.; Charazińska, S.; Grabowska-Polanowska, B.; Kowalczyk, A.; Lochyński, P. An overview of natural soil amendments in agriculture. Soil. Till. Res. 2023, 225, 105462. [Google Scholar] [CrossRef]
- Larney, F.J.; Angers, D.A. The role of organic amendments in soil reclamation: A review. Can. J. Soil. Sci. 2012, 92, 19–38. [Google Scholar] [CrossRef]
- Szerement, J.; Szatanik-Kloc, A.; Mokrzycki, J.; Mierzwa-Hersztek, M. Agronomic biofortification with Se, Zn, and Fe: An effective strategy to enhance crop nutritional quality and stress defense—A review. J. Soil. Sci. Plant Nutr. 2022, 22, 1129–1159. [Google Scholar] [CrossRef]
- Buturi, C.V.; Mauro, R.P.; Fogliano, V.; Leonardi, C.; Giuffrida, F. Mineral biofortification of vegetables as a tool to improve human diet. Foods 2021, 10, 223. [Google Scholar] [CrossRef] [PubMed]
- Di Gioia, F.; Petropoulos, S.A.; Ozores-Hampton, M.; Morgan, K.; Rosskopf, E.N. Zn and iron agronomic biofortification of brassicaceae microgreens. Agronomy 2019, 9, 667. [Google Scholar] [CrossRef]
- Sharma, V.; Sharma, L.; Sandhu, K.S. Cucumber (Cucumis sativus L.). In Antioxidants in Vegetables and Nuts—Properties and Health Benefits; Nayik, G.A., Gull, A., Eds.; Springer: Singapore, 2020; pp. 333–340. [Google Scholar]
- Thomson, C.; Garcia, A.L.; Edwards, C.A. Interactions between Dietary Fibre and the Gut Microbiota. Proc. Nutr. Soc. 2021, 80, 398–408. [Google Scholar] [CrossRef] [PubMed]
- Campos-Perez, W.; Martinez-Lopez, E. Effects of Short Chain Fatty Acids on Metabolic and Inflammatory Processes in Human Health. Biochim. Biophys. Acta Mol. Cell Biol. Lipids 2021, 1866, 158900. [Google Scholar] [CrossRef] [PubMed]
- Navajas-Porras, B.; Pérez-Burillo, S.; Valverde-Moya, Á.J.; Hinojosa-Nogueira, D.; Pastoriza, S.; Rufián-Henares, J.A. Effect of Cooking Methods on the Antioxidant Capacity of Plant Foods Submitted to In Vitro Digestion–Fermentation. Antioxidants 2021, 9, 1312. [Google Scholar] [CrossRef] [PubMed]
- Lara-Ramos, L.; Fernández-Bayo, J.; Delgado, G.; Fernández-Arteaga, A. Agronomic iron-biofortification by activated hydrochars of spent coffee grounds. Front. Sustain. Food Syst. 2023, 7, 1092306. [Google Scholar] [CrossRef]
- Zhao, A.; Yang, S.; Wang, B.; Tian, X. Effects of ZnSO4 and Zn-EDTA applied by broadcasting or by banding on soil Zn fractions and Zn uptake by wheat (Triticum aestivum L.) under greenhouse conditions. J. Plant Nutr. Soil. Sci. 2019, 182, 307–317. [Google Scholar] [CrossRef]
- Pérez-Burillo, S.; Molino, S.; Navajas-Porras, B.; Valverde-Moya, A.J.; Hinojosa-Nogueira, D.; López-Maldonado, A.; Pastoriza, S.; Rufián-Henares, J.A. An in vitro batch fermentation protocol for studying the contribution of food to gut microbiota composition and functionality. Nat. Prot. 2021, 16, 3186–3209. [Google Scholar] [CrossRef] [PubMed]
- Pastoriza, S.; Delgado-Andrade, C.; Haro, A.; Rufián-Henares, J.A. A physiologic approach to test the global antioxidant response of foods. The GAR method. Food Chem. 2011, 129, 1926–1932. [Google Scholar] [CrossRef]
- Benzie, I.F.; Strain, J.J. The ferric reducing ability of plasma (FRAP) as a measure of «antioxidant power»: The FRAP assay. Anal. Biochem. 1996, 239, 70–76. [Google Scholar] [CrossRef] [PubMed]
- Yen, G.-C.; Chen, H.-Y. Antioxidant Activity of Various Tea Extracts in Relation to Their Antimutagenicity. J. Agric. Food Chem. 1995, 43, 27–32. [Google Scholar] [CrossRef]
- Re, R.; Pellegrini, N.; Proteggent, A.; Pannala, A.; Yang, M.; Rice-Evans, C. Antioxidant activity applying an improved ABTS radical cation decolorization assay. Free Radic. Biol. Med. 1999, 26, 1231–1237. [Google Scholar] [CrossRef]
- Singleton, V.L.; Rossi, J.A. Colorimetry of total phenolics with phosphomolybdic-phosphotungstic acid reagents. Am. J. Enol. Vitic. 1965, 16, 144–158. [Google Scholar] [CrossRef]
- Panzella, L.; Pérez-Burillo, S.; Pastoriza, S.; Martín, M.A.; Cerruti, P.; Goya, L.; Ramos, S.; Rufián-Henares, J.A.; Napolitano, A.; d’Ischia, M. High antioxidant action and prebiotic activity of hydrolyzed spent coffee grounds (hscg) in a simulated digestion–fermentation model: Toward the development of a novel food supplement. J. Agric. Food Chem. 2017, 65, 6452–6459. [Google Scholar] [CrossRef] [PubMed]
- Alimentación en España. Consulted on November 16th, 2023. Available online: https://www.mercasa.es/publicaciones/alimentacion-en-espana/ (accessed on 15 December 2023).
- Salas-Salvadó, J.; Sanjaume, A.B.; Casañas, R.T.; Solà, M.E.S.; Peláez, R.B. (Eds.) . Nutrición y Dietética Clínica, 4th ed.; Elsevier Health Sciences: Barcelona, Spain, 2019. [Google Scholar]
- Saura-Calixto, F.; Goñi, I. Antioxidant capacity of the Spanish Mediterranean diet. Food Chem. 2006, 94, 442–447. [Google Scholar] [CrossRef]
- Dietary Reference Values. EFSA. Consulted on November 16th, 2023. Available online: https://multimedia.efsa.europa.eu/drvs/index.htm (accessed on 15 December 2023).
- Kolodziejczyk, A.A.; Zheng, D.; Elinav, E. Diet-microbiota interactions and personalized nutrition. Nat. Rev. Microbiol. 2019, 17, 742–753. [Google Scholar] [CrossRef] [PubMed]
- Maqueda, C.; Morillo, E.; Lopez, R.; Undabeytia, T.; Cabrera, F. Influence of organic amendments on Fe, Cu, Mn, and Zn availability and clay minerals of different soils. Arch. Agron. Soil. Sci. 2015, 61, 599–613. [Google Scholar] [CrossRef]
- Weil, R.R.; Brady, N.C. Calcium, magnesium, silicon and trace microelements. In The Nature and Properties of Soils, 15th ed.; Weil, R.R., Brady, N.C., Eds.; Pearson: New York, NY, USA, 2017; pp. 696–744. [Google Scholar]
- Scarano, A.; Laddomada, B.; Blando, F.; De Santis, S.; Verna, G.; Chieppa, M.; Santino, A. The Chelating Ability of Plant Polyphenols Can Affect Iron Homeostasis and Gut Microbiota. Antioxidants 2023, 12, 630. [Google Scholar] [CrossRef]
- Dave, L.A.; Hodgkinson, S.M.; Roy, N.C.; Smith, N.W.; McNabb, W.C. The role of holistic nutritional properties of diets in the assessment of food system and dietary sustainability. Crit. Rev. Food Sci. Nutr. 2023, 63, 5117–5137. [Google Scholar] [CrossRef]
- Alexandropoulou, I.; Komaitis, M.; Kapsokefalou, M. Effects of iron, ascorbate, meat and casein on the antioxidant capacity of green tea under conditions of in vitro digestion. Food Chem. 2006, 94, 359–365. [Google Scholar] [CrossRef]
- Andrade, C.; Perestrelo, R.; Câmara, J.S. Bioactive Compounds and Antioxidant Activity from Spent Coffee Grounds as a Powerful Approach for Its Valorization. Molecules 2022, 27, 7504. [Google Scholar] [CrossRef] [PubMed]
- Martins, S.; Silva, E.; Brito, C.; Martins-Gomes, C.; Gonçalves, A.; Arrobas, M.; Rodrigues, M.Â.; Correia, C.M.; Nunes, F.M. Zeolites and Biochar Modulate Olive Fruit and Oil Polyphenolic Profile. Antioxidants 2022, 11, 1332. [Google Scholar] [CrossRef] [PubMed]
- Everette, J.D.; Bryant, Q.M.; Green, A.M.; Abbey, Y.A.; Wangila, G.W.; Walker, R.B. Thorough study of reactivity of various compound classes toward the Folin-Ciocalteu reagent. J. Agric. Food Chem. 2010, 58, 8139–8144. [Google Scholar] [CrossRef] [PubMed]
- Passioura, J.B. Soil structure and plant growth. Soil Res. 1991, 29, 717–728. [Google Scholar] [CrossRef]


| Nº | Treatment | Description | Fe Added (mg/kg) |
|---|---|---|---|
| 1 | Control | No bioproduct | 0 |
| 2 | Control-Fe | Commercial chelate (EDDHA-Fe, 6%) | 10 |
| 3 | ASCG | Activated spent coffee grounds (SCG) | 0.104 |
| 4 | AH160 | Activated hydrochar obtained from SCG at 160 °C | 0.105 |
| 5 | ASCG-Fe | Activated SCG functionalized with Fe | 21 |
| 6 | AH160-Fe | Activated hydrochar obtained from SCG at 160 °C functionalized with Fe | 23 |
| Fe Content | FRAP Assay | DPPH Assay | ABTS Assay | FC Assay | |
| Plot 1 | |||||
| AH160-Fe/AH160 | * | ns | ns | ns | ns |
| ASCG/AH160 | * | ns | ns | ns | ns |
| ASCG-Fe/AH160 | ns | ns | ns | * | ns |
| Control/AH160 | * | ns | ns | * | ns |
| Control-Fe/AH160 | * | ns | ns | ns | ns |
| ASCG/AH160-Fe | * | ns | ns | ns | ns |
| ASCG-Fe/AH160-Fe | * | ns | ns | ns | ns |
| Control/AH160-Fe | ns | ns | ns | ns | ns |
| Control-Fe/AH160-Fe | * | ns | ns | ns | * |
| ASCG-Fe/ASCG | * | ns | ns | * | * |
| Control/ASCG | * | ns | ns | ns | ns |
| Control-Fe/ASCG | * | ns | ns | ns | ns |
| Control/ASCG-Fe | ns | ns | ns | * | ns |
| Control-Fe/ASCG-Fe | ns | ns | ns | * | * |
| Control-Fe/Control | ns | ns | ns | ns | ns |
| Plot 2 | |||||
| AH160-Fe/AH160 | * | ns | ns | ns | * |
| ASCG/AH160 | * | ns | ns | ns | ns |
| ASCG-Fe/AH160 | * | ns | ns | * | * |
| Control/AH160 | * | ns | ns | * | * |
| Control-Fe/AH160 | * | ns | * | ns | * |
| ASCG/AH160-Fe | * | ns | ns | ns | * |
| ASCG-Fe/AH160-Fe | * | ns | * | * | ns |
| Control/AH160-Fe | * | ns | ns | ns | * |
| Control-Fe/AH160-Fe | * | ns | ns | ns | ns |
| ASCG-Fe/ASCG | * | ns | * | ns | * |
| Control/ASCG | * | ns | * | * | * |
| Control-Fe/ASCG | * | ns | ns | ns | * |
| Control/ASCG-Fe | ns | ns | ns | * | ns |
| Control-Fe/ASCG-Fe | ns | ns | * | ns | ns |
| Control-Fe/Control | * | ns | * | * | ns |
| Plot 1 | Acetic Acid | Butyric Acid | Lactic Acid | Propionic Acid | Succinic Acid | Total SCFAs |
| AH160-Fe/AH160 | * | ns | ns | * | * | ns |
| ASCG/AH160 | ns | * | * | * | * | * |
| ASCG-Fe/AH160 | * | ns | ns | * | * | * |
| Control/AH160 | * | * | * | * | * | * |
| Control-Fe/AH160 | * | * | * | * | * | * |
| ASCG/AH160-Fe | * | * | * | * | ns | * |
| ASCG-Fe/AH160-Fe | ns | ns | ns | ns | * | * |
| Control/AH160-Fe | * | * | * | * | * | * |
| Control-Fe/AH160-Fe | * | * | * | * | * | * |
| ASCG-Fe/ASCG | * | * | * | * | ns | * |
| Control/ASCG | ns | ns | * | * | * | ns |
| Control-Fe/ASCG | * | * | * | * | * | ns |
| Control/ASCG-Fe | * | * | * | * | * | * |
| Control-Fe/ASCG-Fe | * | * | * | * | * | * |
| Control-Fe/Control | * | ns | * | * | ns | * |
| Plot 2 | Acetic acid | Butyric acid | Lactic acid | Propionic acid | Succinic acid | Total SCFAs |
| AH160-Fe/AH160 | * | ns | * | ns | * | * |
| ASCG/AH160 | ns | * | * | * | * | ns |
| ASCG-Fe/AH160 | * | * | ns | ns | ns | * |
| Control/AH160 | ns | ns | * | * | * | * |
| Control-Fe/AH160 | * | * | * | ns | * | * |
| ASCG/AH160-Fe | * | * | * | * | * | * |
| ASCG-Fe/AH160-Fe | * | * | * | ns | * | * |
| Control/AH160-Fe | * | * | * | * | * | * |
| Control-Fe/AH160-Fe | * | * | * | ns | * | * |
| ASCG-Fe/ASCG | * | ns | * | * | * | * |
| Control/ASCG | ns | * | ns | ns | ns | ns |
| Control-Fe/ASCG | ns | * | ns | * | ns | * |
| Control/ASCG-Fe | * | * | * | * | * | ns |
| Control-Fe/ASCG-Fe | * | * | * | ns | * | * |
| Control-Fe/Control | * | * | ns | * | * | ns |
| Group | Analytical Assay | Fe/Daily Intake * (mg Fe/Day) | Fe/Serving Intake † (mg Fe/Serving) | Mean Contribution to Daily Fe Intake Compared with Previous Data # (%) | Mean Contribution to Daily Fe Per Serving Intake # (%) | ||||
| Plot 1 | Plot 2 | Plot 1 | Plot 2 | Plot 1 | Plot 2 | Plot 1 | Plot 2 | ||
| Control | Fe content | 0.01 | 0.01 | 0.13 | 0.15 | 0.07 | 0.07 | 1.66 | 1.84 |
| Control-Fe | Fe content | 0.01 | 0.01 | 0.13 | 0.14 | 0.07 | 0.07 | 1.68 | 1.70 |
| ASCG | Fe content | 0.00 | 0.01 | 0.11 | 0.15 | 0.06 | 0.08 | 1.40 | 1.93 |
| AH160 | Fe content | 0.01 | 0.00 | 0.15 | 0.11 | 0.07 | 0.05 | 1.82 | 1.33 |
| ASCG-Fe | Fe content | 0.01 | 0.01 | 0.14 | 0.14 | 0.07 | 0.07 | 1.78 | 1.81 |
| AH160-FE | Fe content | 0.01 | 0.01 | 0.18 | 0.16 | 0.09 | 0.08 | 2.29 | 2.06 |
| Group | Analytical assay | Polyphenols/Daily Intake * (mg Gallic Acid/Day) | Polyphenols/Serving Intake † (mg Gallic Acid/Serving) | Mean Contribution to Daily Polyphenol Intake Compared with Previous Data $ (%) | Mean Contribution to Daily Polyphenol Intake per Serving $ (%) | ||||
| Plot 1 | Plot 2 | Plot 1 | Plot 2 | Plot 1 | Plot 2 | Plot 1 | Plot 2 | ||
| Control | FC assay | 21.1 | 16.3 | 529 | 407 | 1.81 | 1.39 | 45.1 | 34.7 |
| Control-Fe | FC assay | 16.0 | 14.0 | 401 | 351 | 1.37 | 1.20 | 34.2 | 29.9 |
| ASCG | FC assay | 16.8 | 29.9 | 421 | 748 | 1.44 | 2.56 | 35.9 | 63.9 |
| AH160 | FC assay | 21.8 | 32.9 | 546 | 822 | 1.87 | 2.81 | 46.6 | 70.2 |
| ASCG-Fe | FC assay | 26.4 | 17.3 | 660 | 434 | 2.25 | 1.48 | 56.3 | 37.0 |
| AH160-Fe | FC assay | 23.8 | 19.6 | 596 | 489 | 2.04 | 1.67 | 50.9 | 41.8 |
Disclaimer/Publisher’s Note: The statements, opinions and data contained in all publications are solely those of the individual author(s) and contributor(s) and not of MDPI and/or the editor(s). MDPI and/or the editor(s) disclaim responsibility for any injury to people or property resulting from any ideas, methods, instructions or products referred to in the content. |
© 2024 by the authors. Licensee MDPI, Basel, Switzerland. This article is an open access article distributed under the terms and conditions of the Creative Commons Attribution (CC BY) license (https://creativecommons.org/licenses/by/4.0/).
Share and Cite
Navajas-Porras, B.; Cervera-Mata, A.; Fernández-Arteaga, A.; Delgado-Osorio, A.; Navarro-Moreno, M.; Hinojosa-Nogueira, D.; Pastoriza, S.; Delgado, G.; Navarro-Alarcón, M.; Rufián-Henares, J.Á. Biochelates from Spent Coffee Grounds Increases Iron Levels in Dutch Cucumbers but Affects Their Antioxidant Capacity. Antioxidants 2024, 13, 465. https://doi.org/10.3390/antiox13040465
Navajas-Porras B, Cervera-Mata A, Fernández-Arteaga A, Delgado-Osorio A, Navarro-Moreno M, Hinojosa-Nogueira D, Pastoriza S, Delgado G, Navarro-Alarcón M, Rufián-Henares JÁ. Biochelates from Spent Coffee Grounds Increases Iron Levels in Dutch Cucumbers but Affects Their Antioxidant Capacity. Antioxidants. 2024; 13(4):465. https://doi.org/10.3390/antiox13040465
Chicago/Turabian StyleNavajas-Porras, Beatriz, Ana Cervera-Mata, Alejandro Fernández-Arteaga, Adriana Delgado-Osorio, Miguel Navarro-Moreno, Daniel Hinojosa-Nogueira, Silvia Pastoriza, Gabriel Delgado, Miguel Navarro-Alarcón, and José Ángel Rufián-Henares. 2024. "Biochelates from Spent Coffee Grounds Increases Iron Levels in Dutch Cucumbers but Affects Their Antioxidant Capacity" Antioxidants 13, no. 4: 465. https://doi.org/10.3390/antiox13040465
APA StyleNavajas-Porras, B., Cervera-Mata, A., Fernández-Arteaga, A., Delgado-Osorio, A., Navarro-Moreno, M., Hinojosa-Nogueira, D., Pastoriza, S., Delgado, G., Navarro-Alarcón, M., & Rufián-Henares, J. Á. (2024). Biochelates from Spent Coffee Grounds Increases Iron Levels in Dutch Cucumbers but Affects Their Antioxidant Capacity. Antioxidants, 13(4), 465. https://doi.org/10.3390/antiox13040465