
Methylglyoxal-Derived Nucleoside Adducts Drive Vascular Dysfunction in a RAGE-Dependent Manner
 ,
,  , and
, and 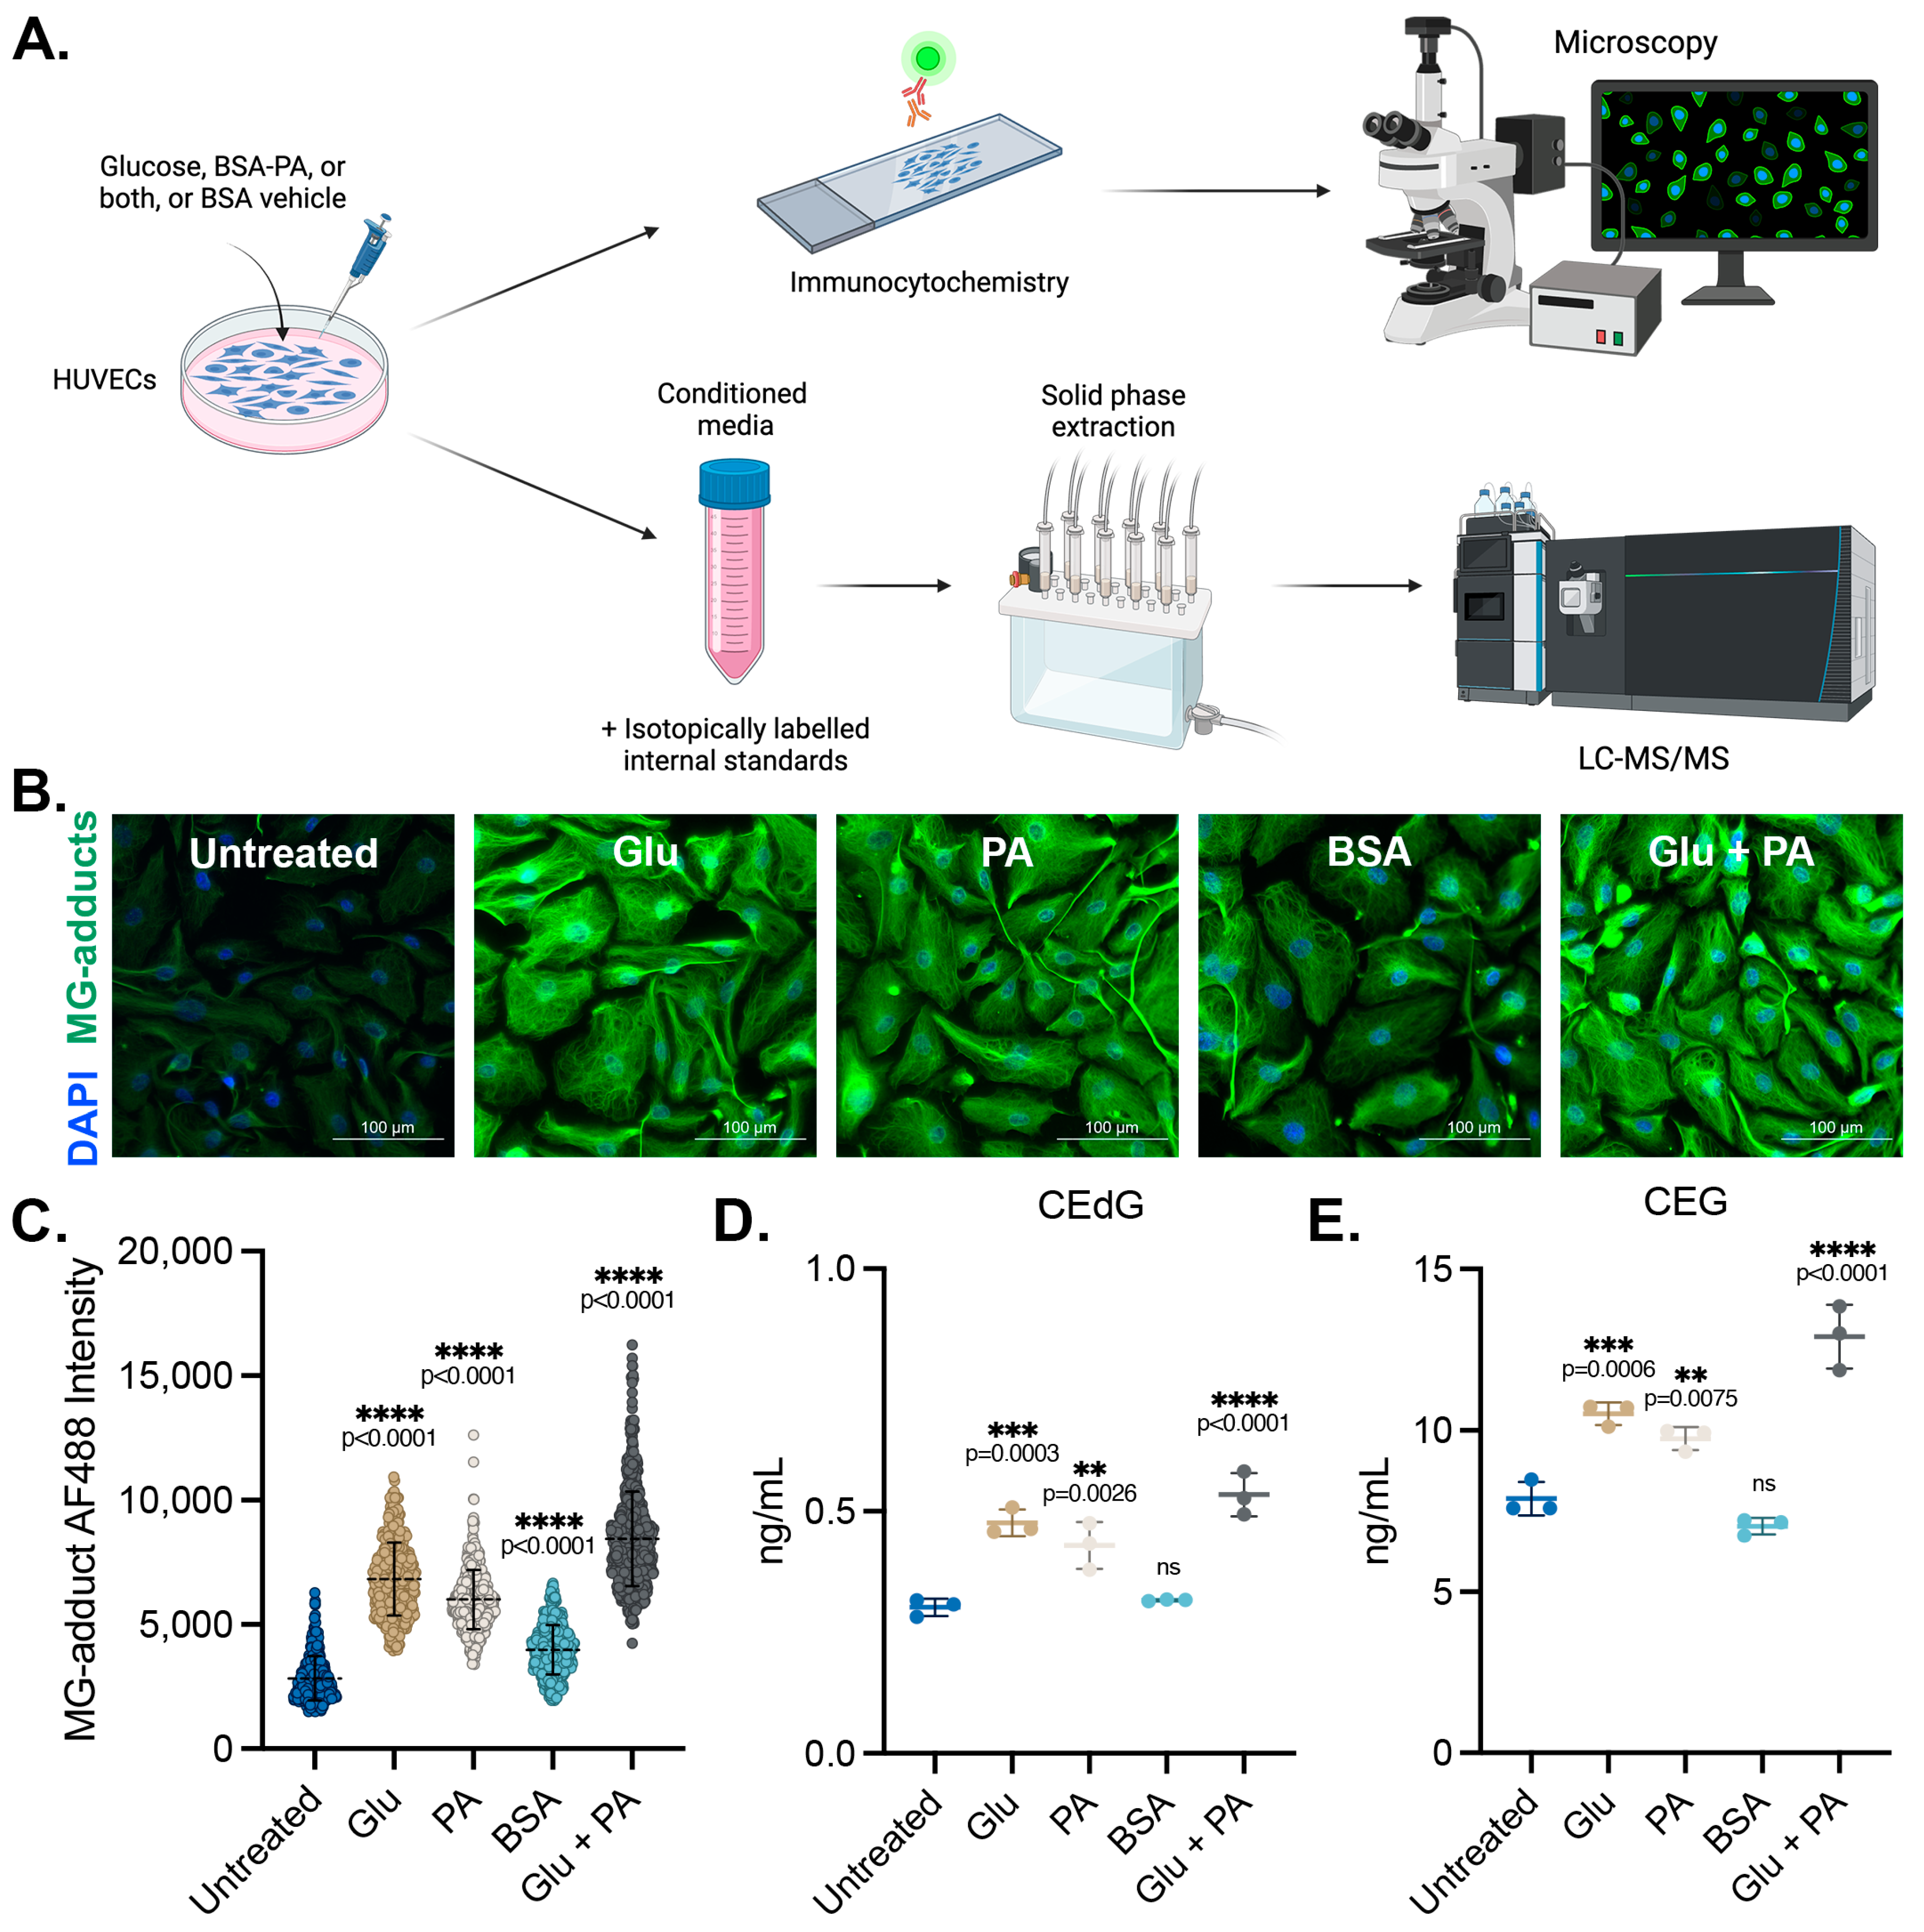
Abstract
1. Introduction
2. Materials and Methods
2.1. Cell Cultures
2.2. Materials
2.3. Multiplex Mass Spectrometry Method to Measure MG Adducts
2.4. Isolation and Enrichment of Secreted MG Adducts
2.5. Experimental Treatments
2.6. RNA Extraction and Quantitative PCR
2.7. Crystal Violet Viability Assay
2.8. Proliferation and Morphology Assay
2.9. Immunofluorescence
2.10. Immunoblotting
2.11. Monocyte Adhesion Assay
2.12. Reactive Oxygen Species (ROS) Detection
2.13. Transwell Endothelial Permeability Assay
2.14. Measuring MG Adduct Cellular Uptake
2.15. RNA Sequencing
2.16. Bioinformatics Analysis
2.17. Statistical Analysis
3. Results
3.1. Endothelial Cells Produce and Secrete MG Adducts under Hyperglycemic and Hyperlipidemic Diabetic Conditions
3.2. MG Adducts Are Not Toxic to HUVECs
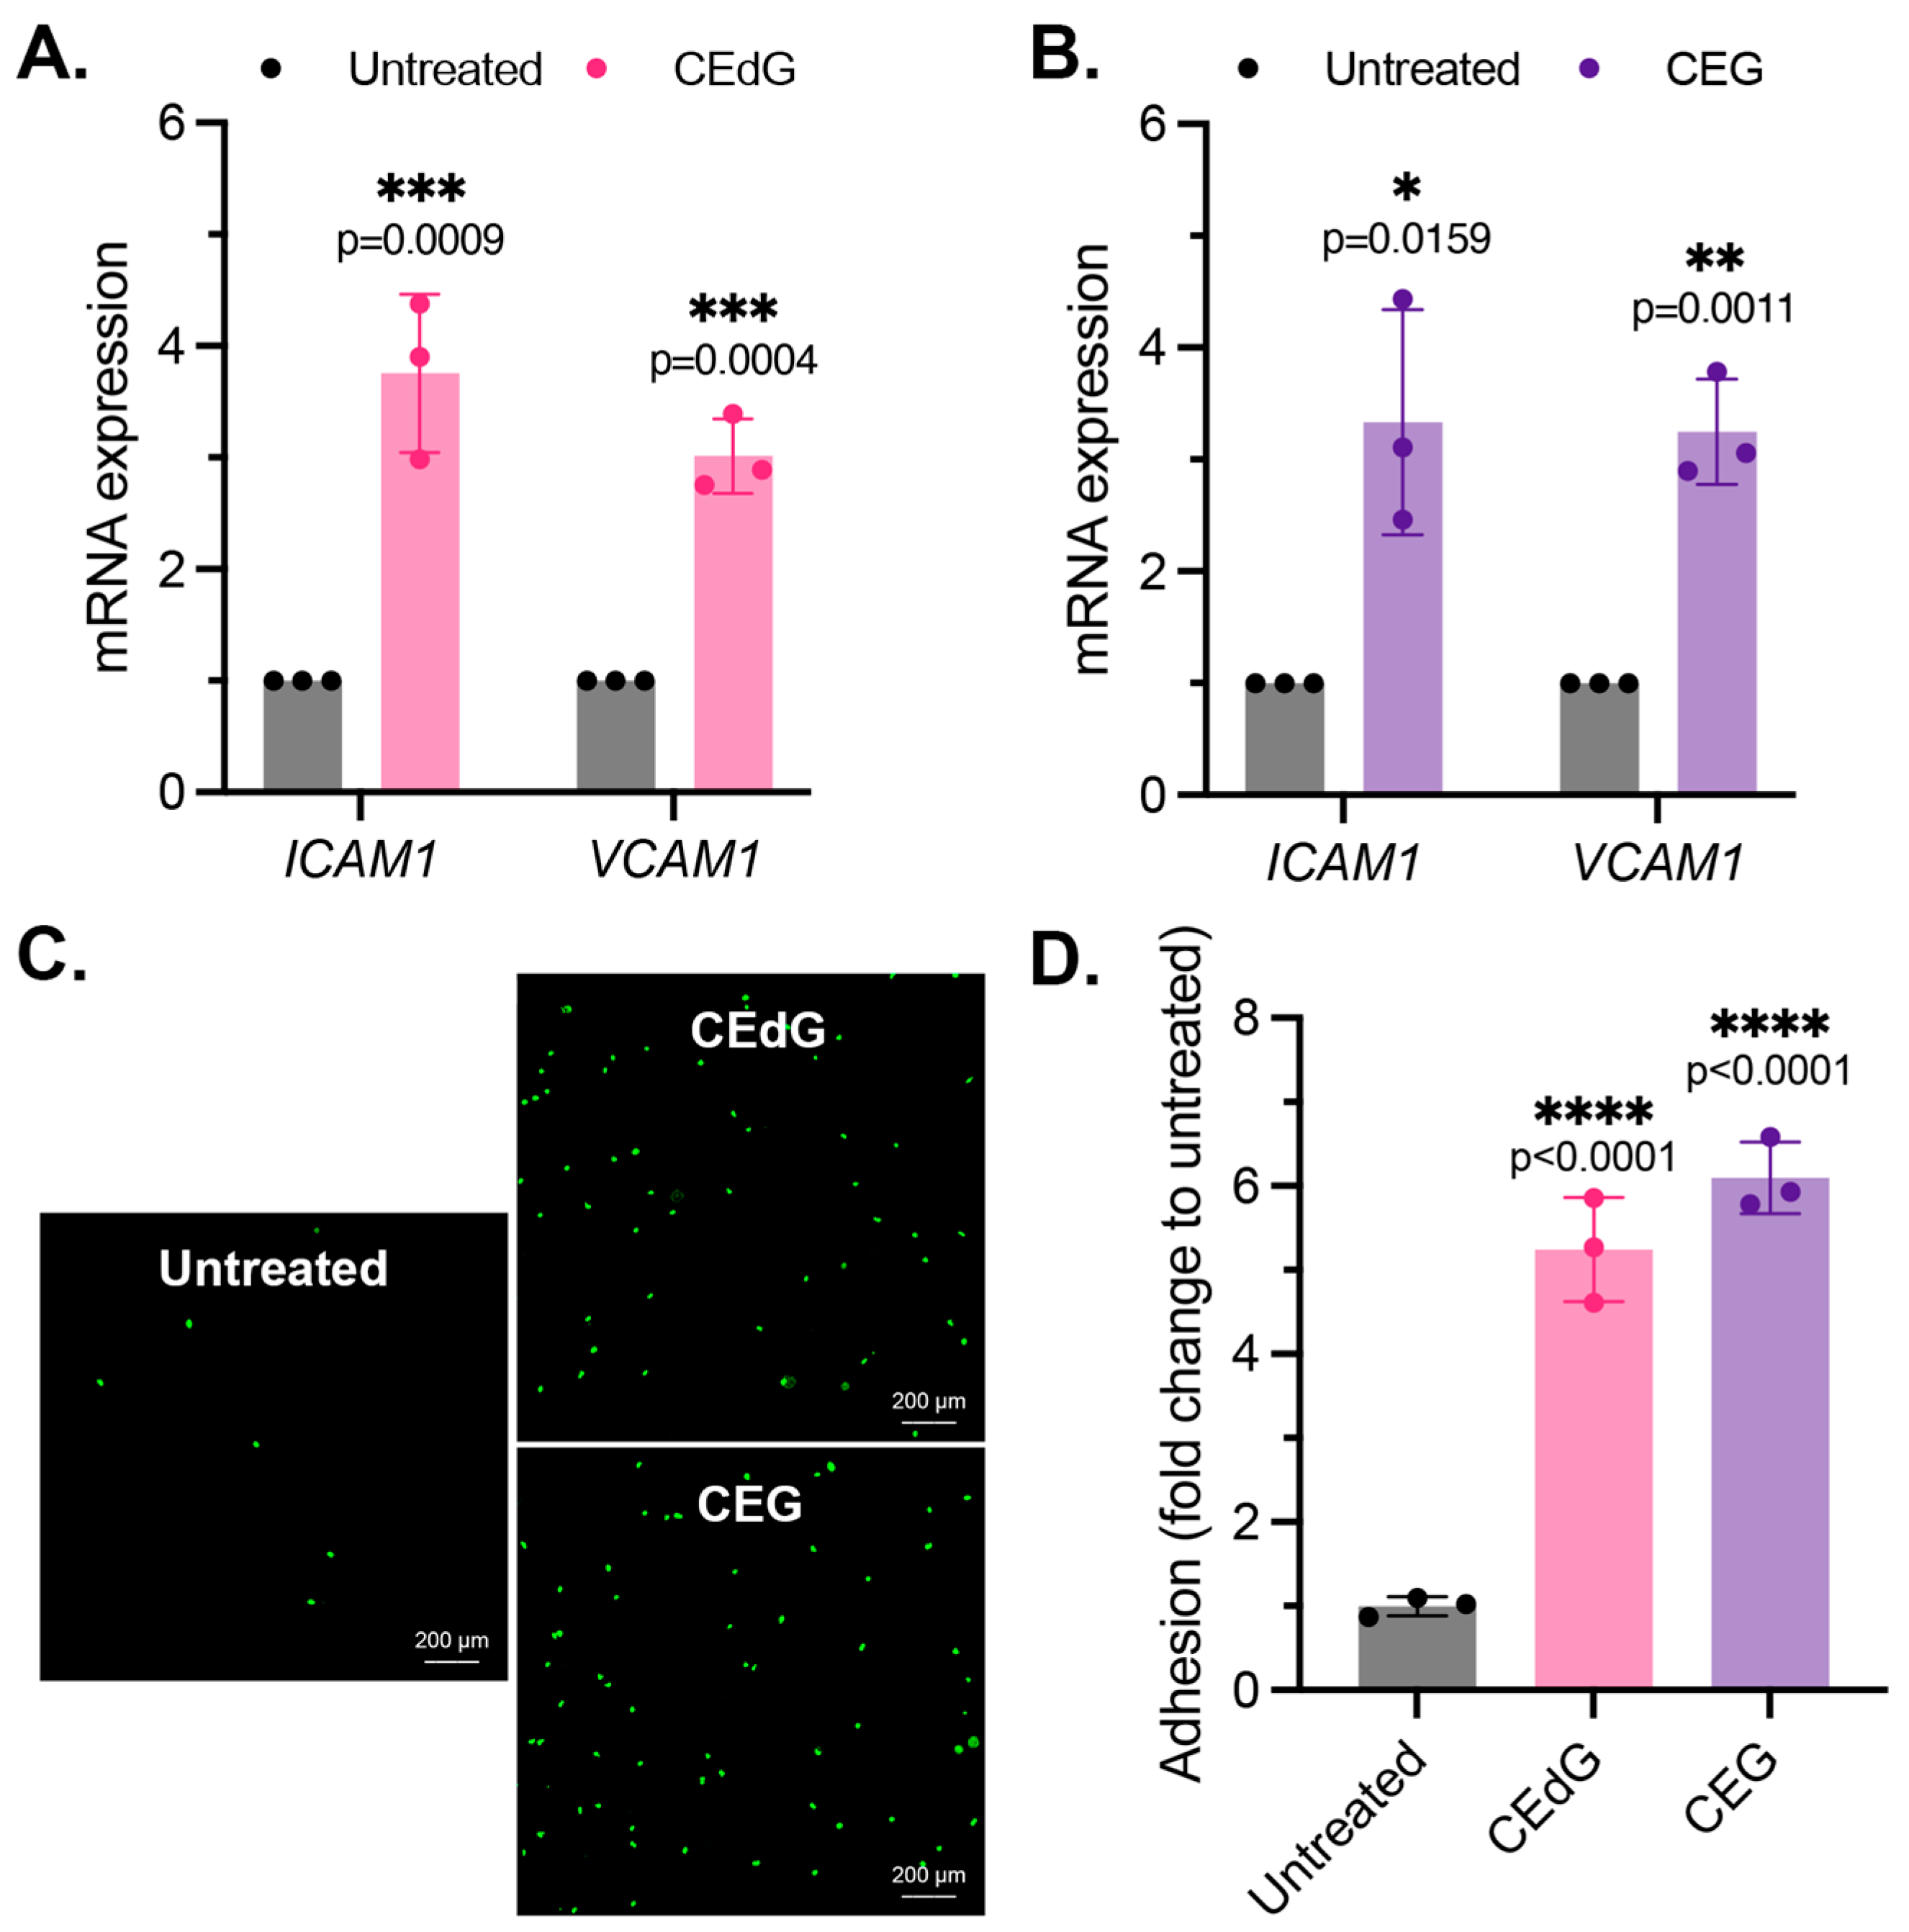
3.3. MG Adducts Promote Monocyte Adhesion
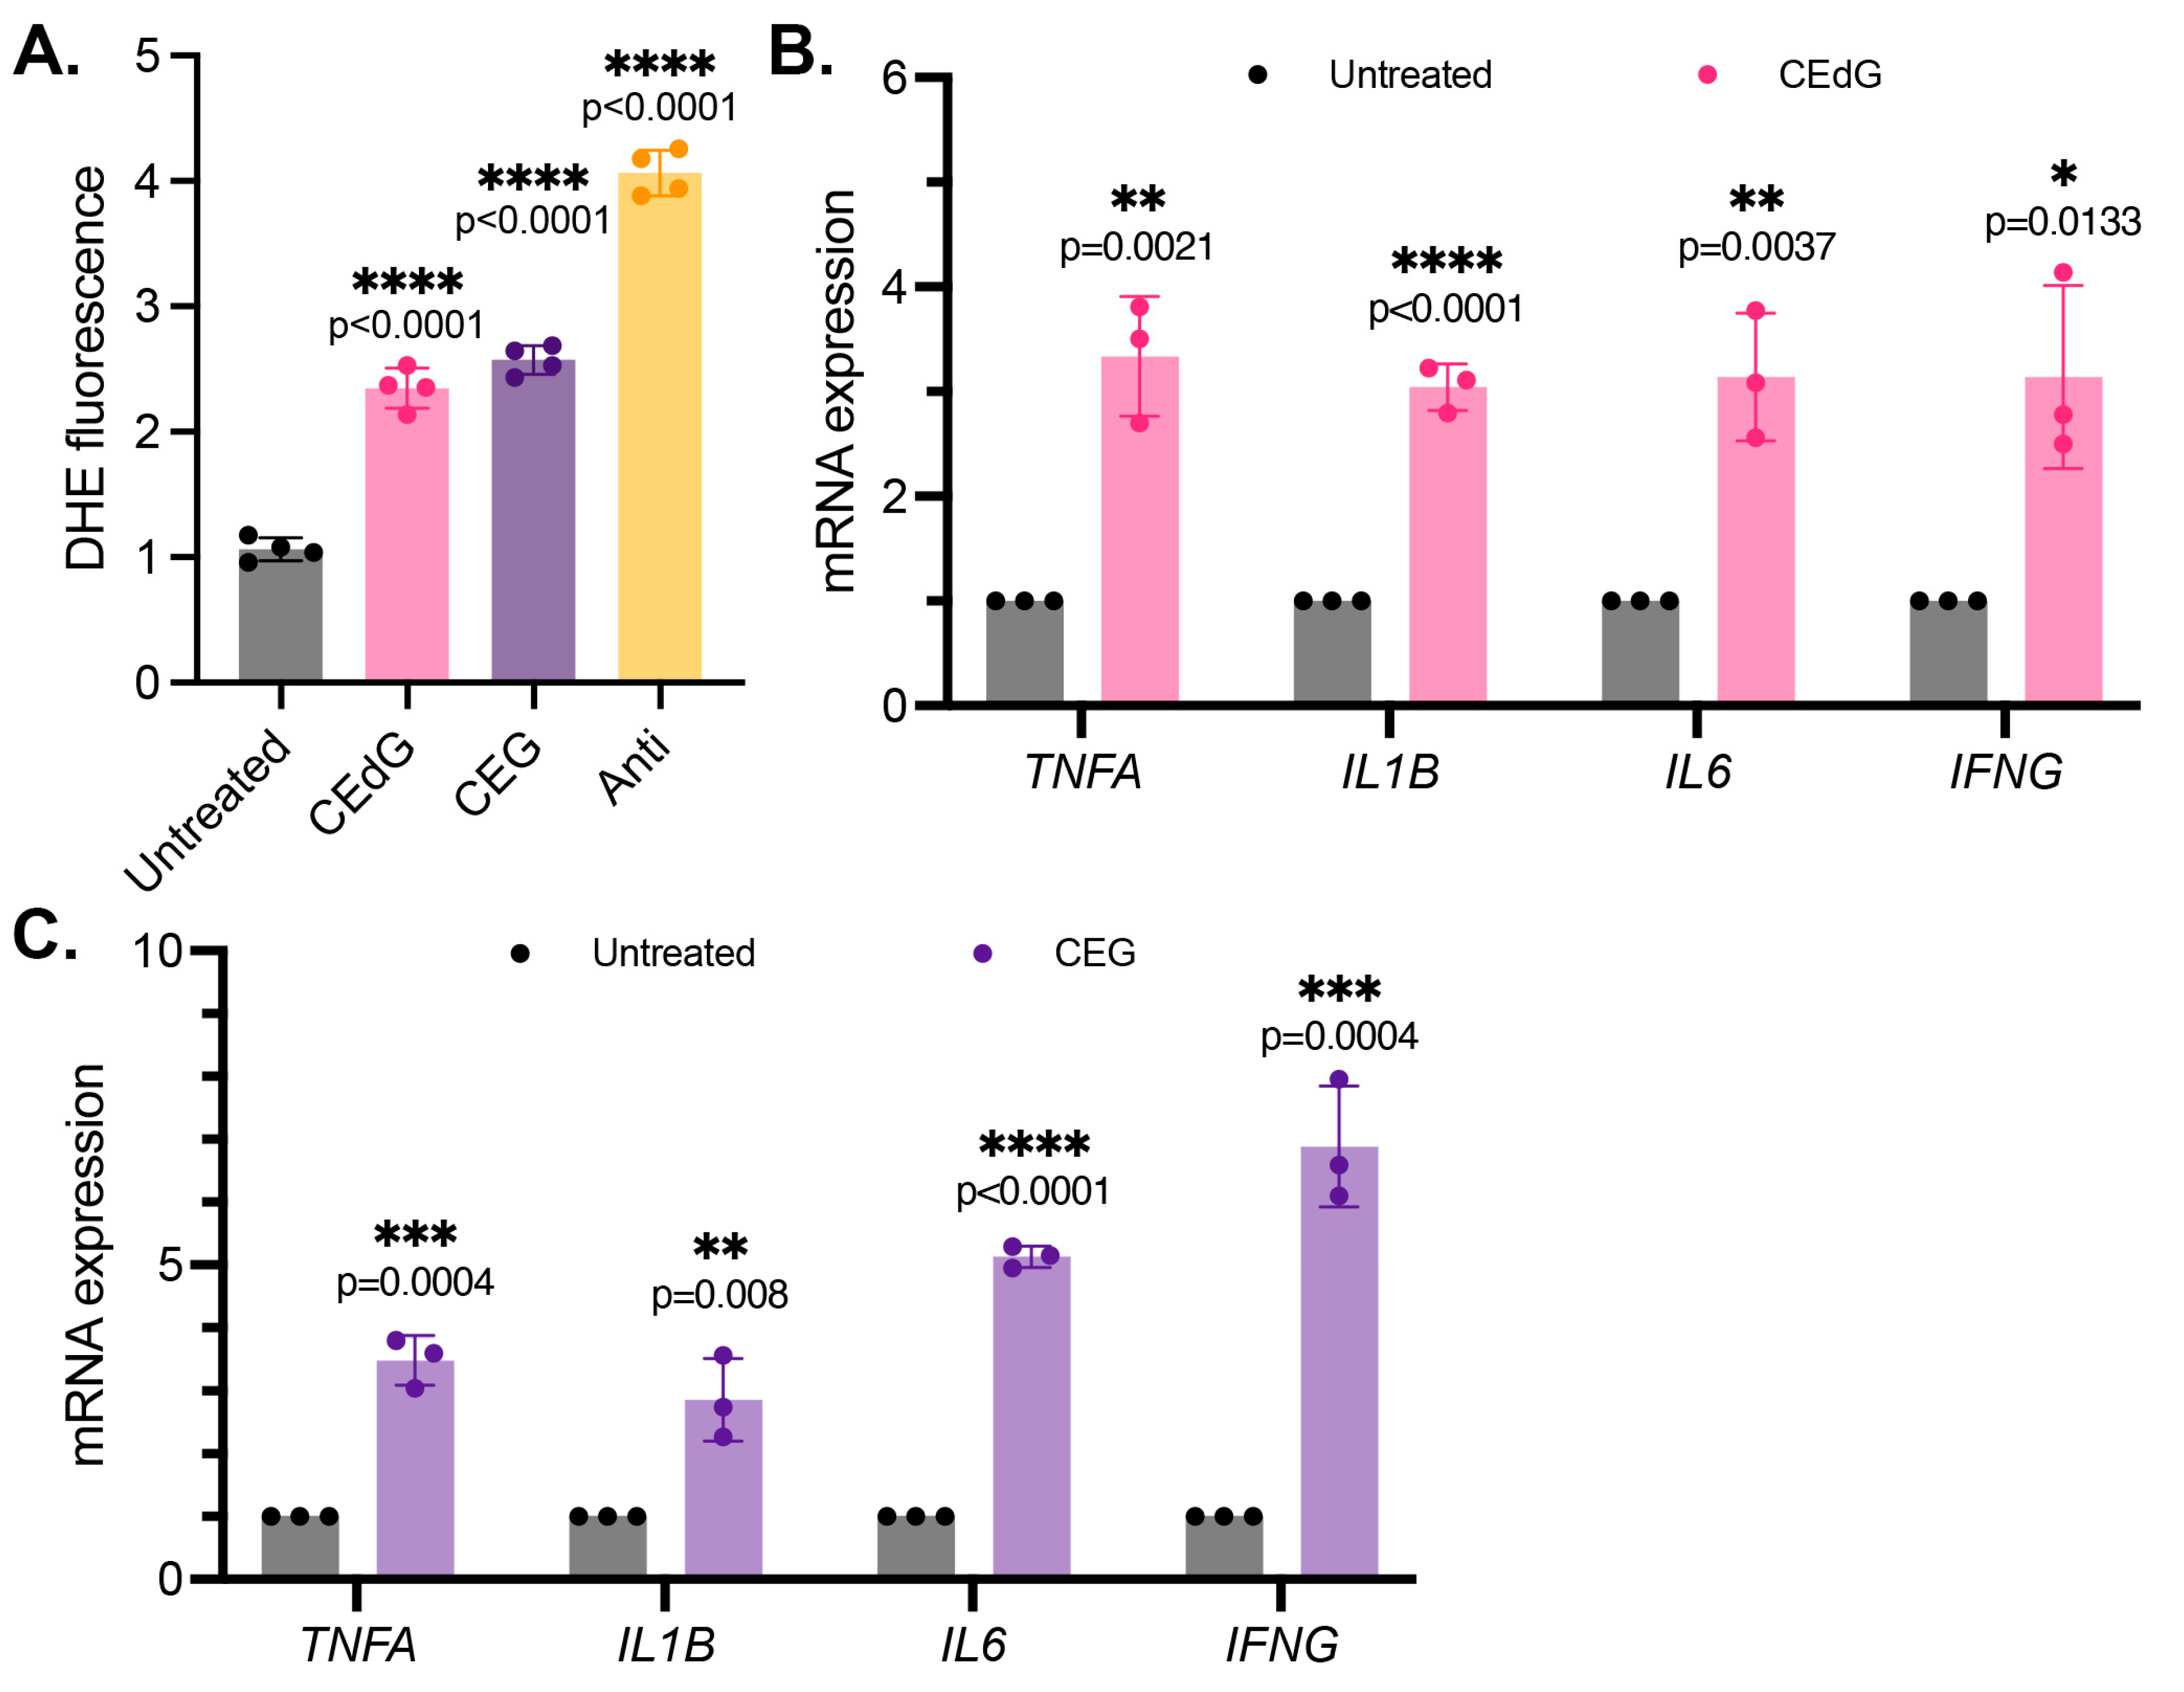
3.4. MG Adducts Induce Oxidative Stress and Inflammation
3.5. MG Adducts Induce Endothelial Dysfunction and Impair Endothelial Homeostasis and Vascular Integrity
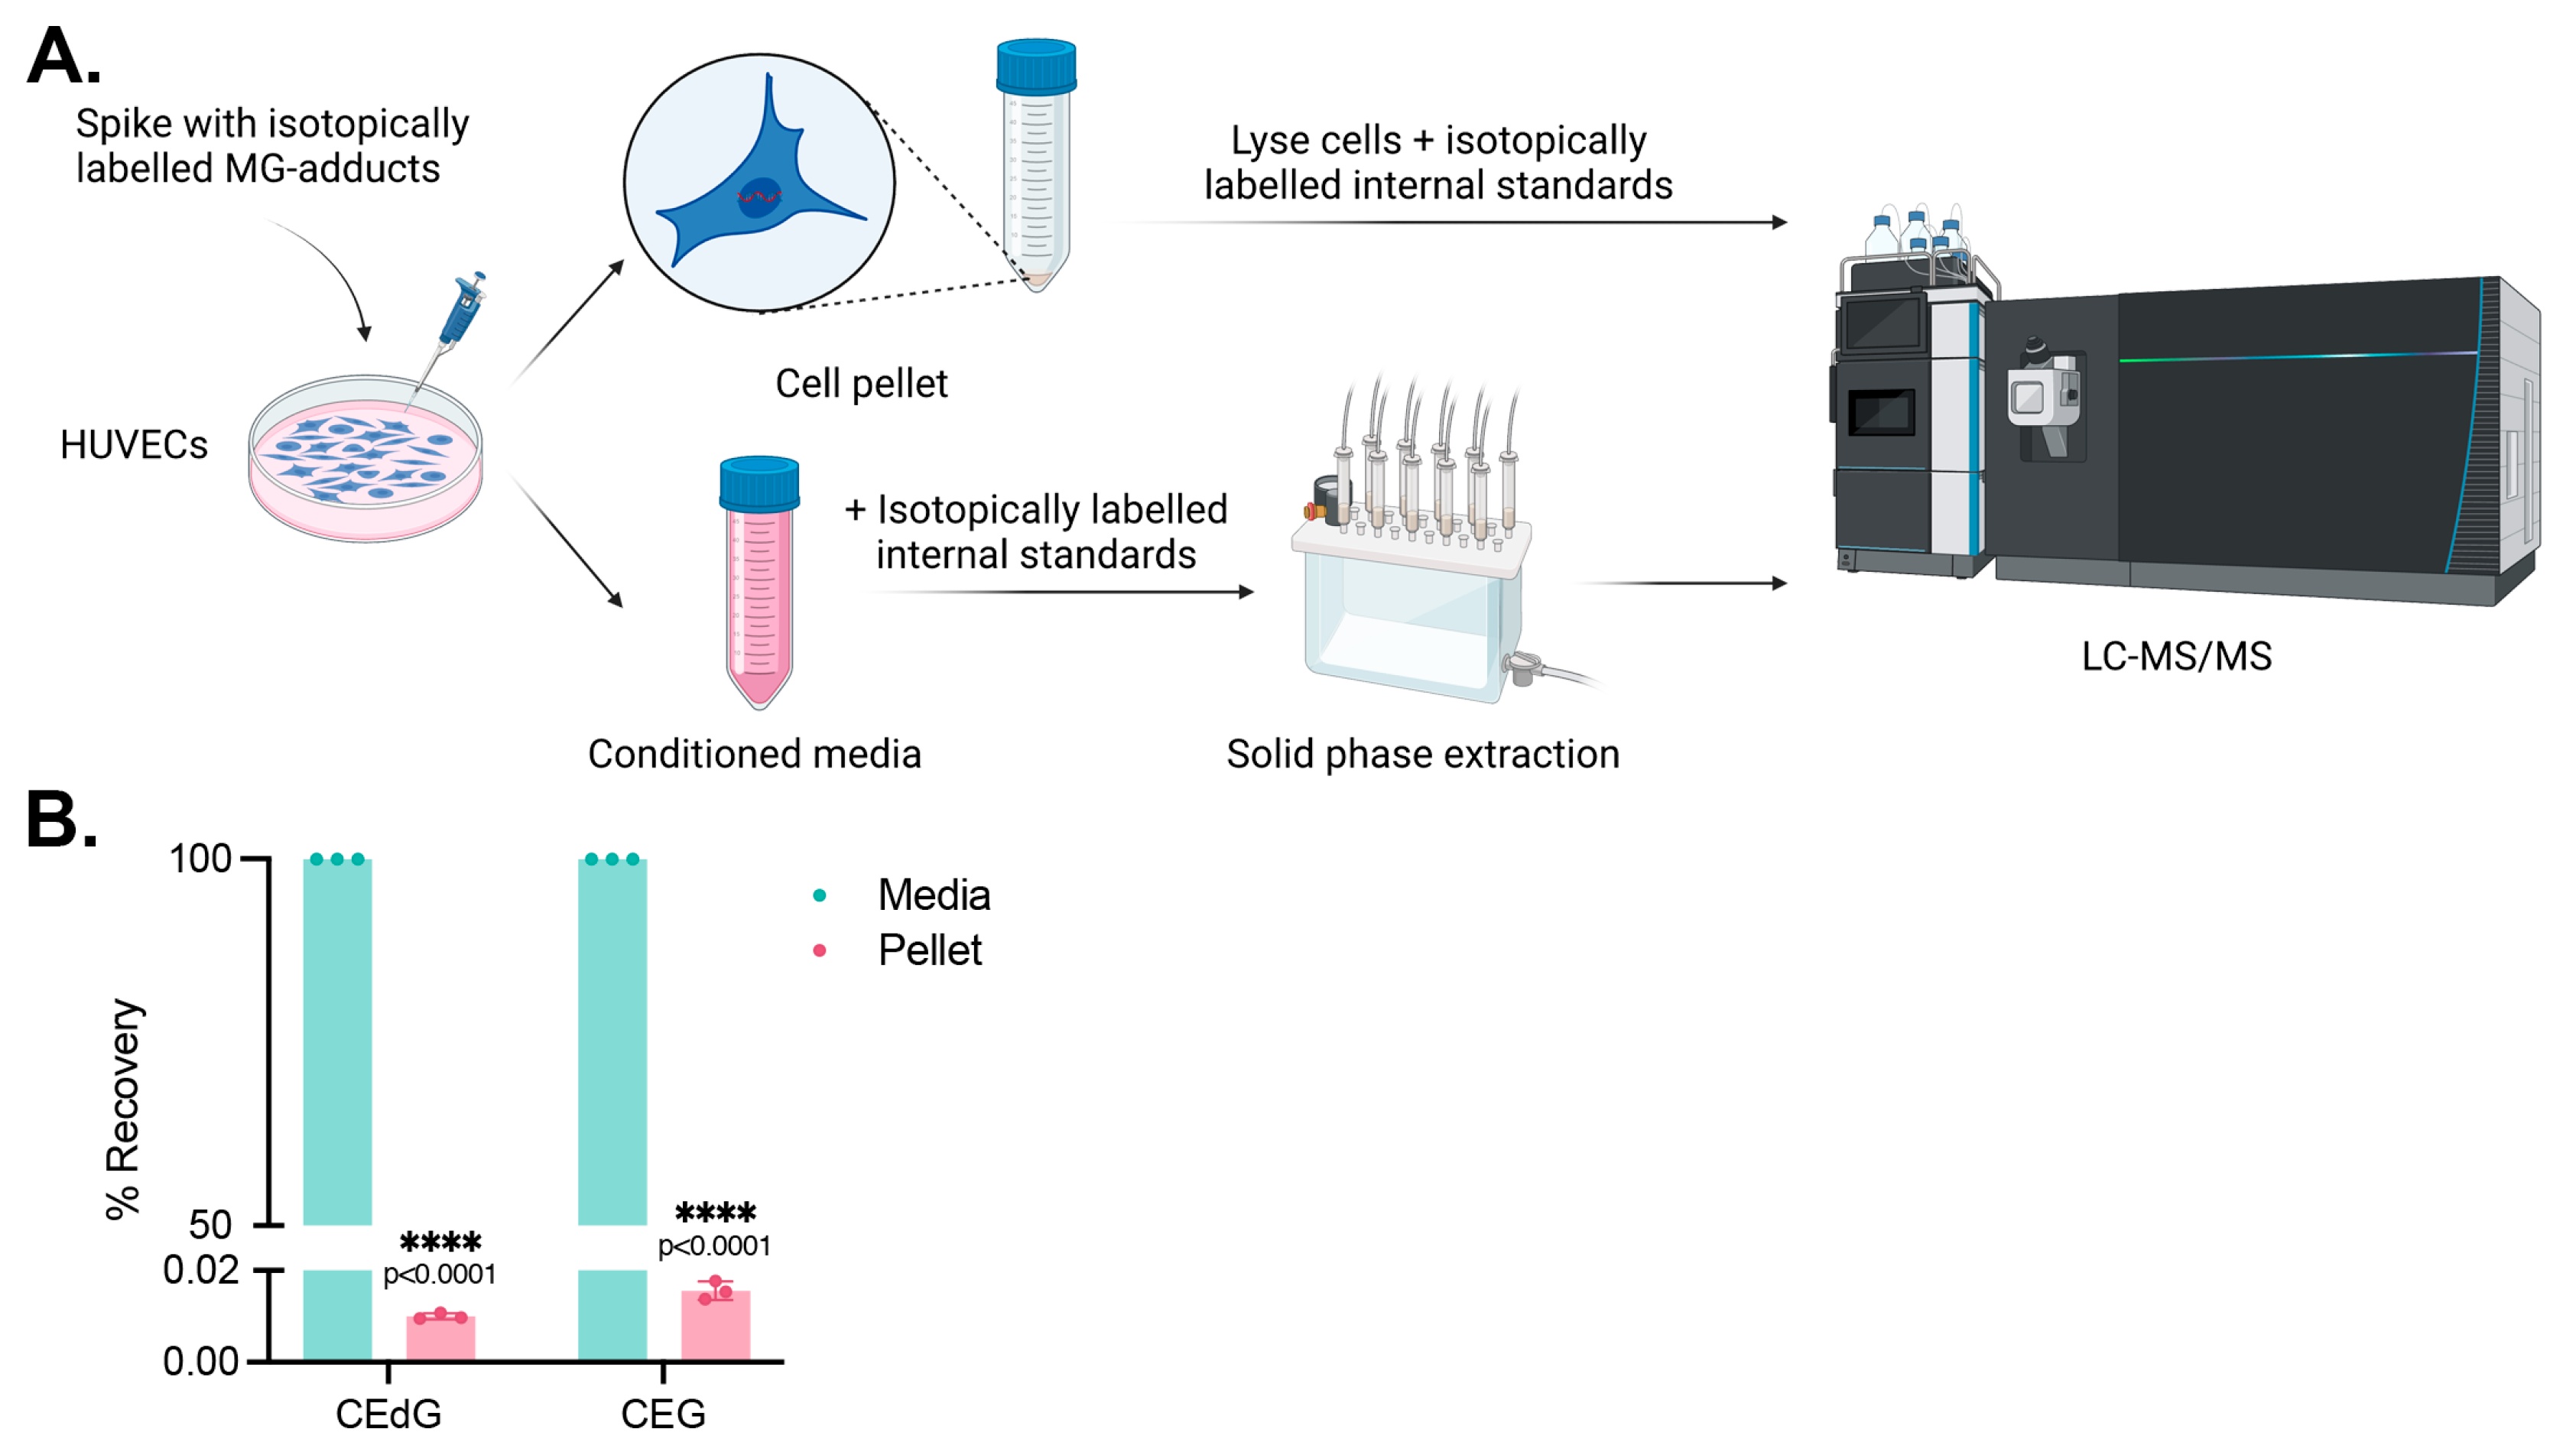
3.6. Cells Do Not Uptake MG Adducts
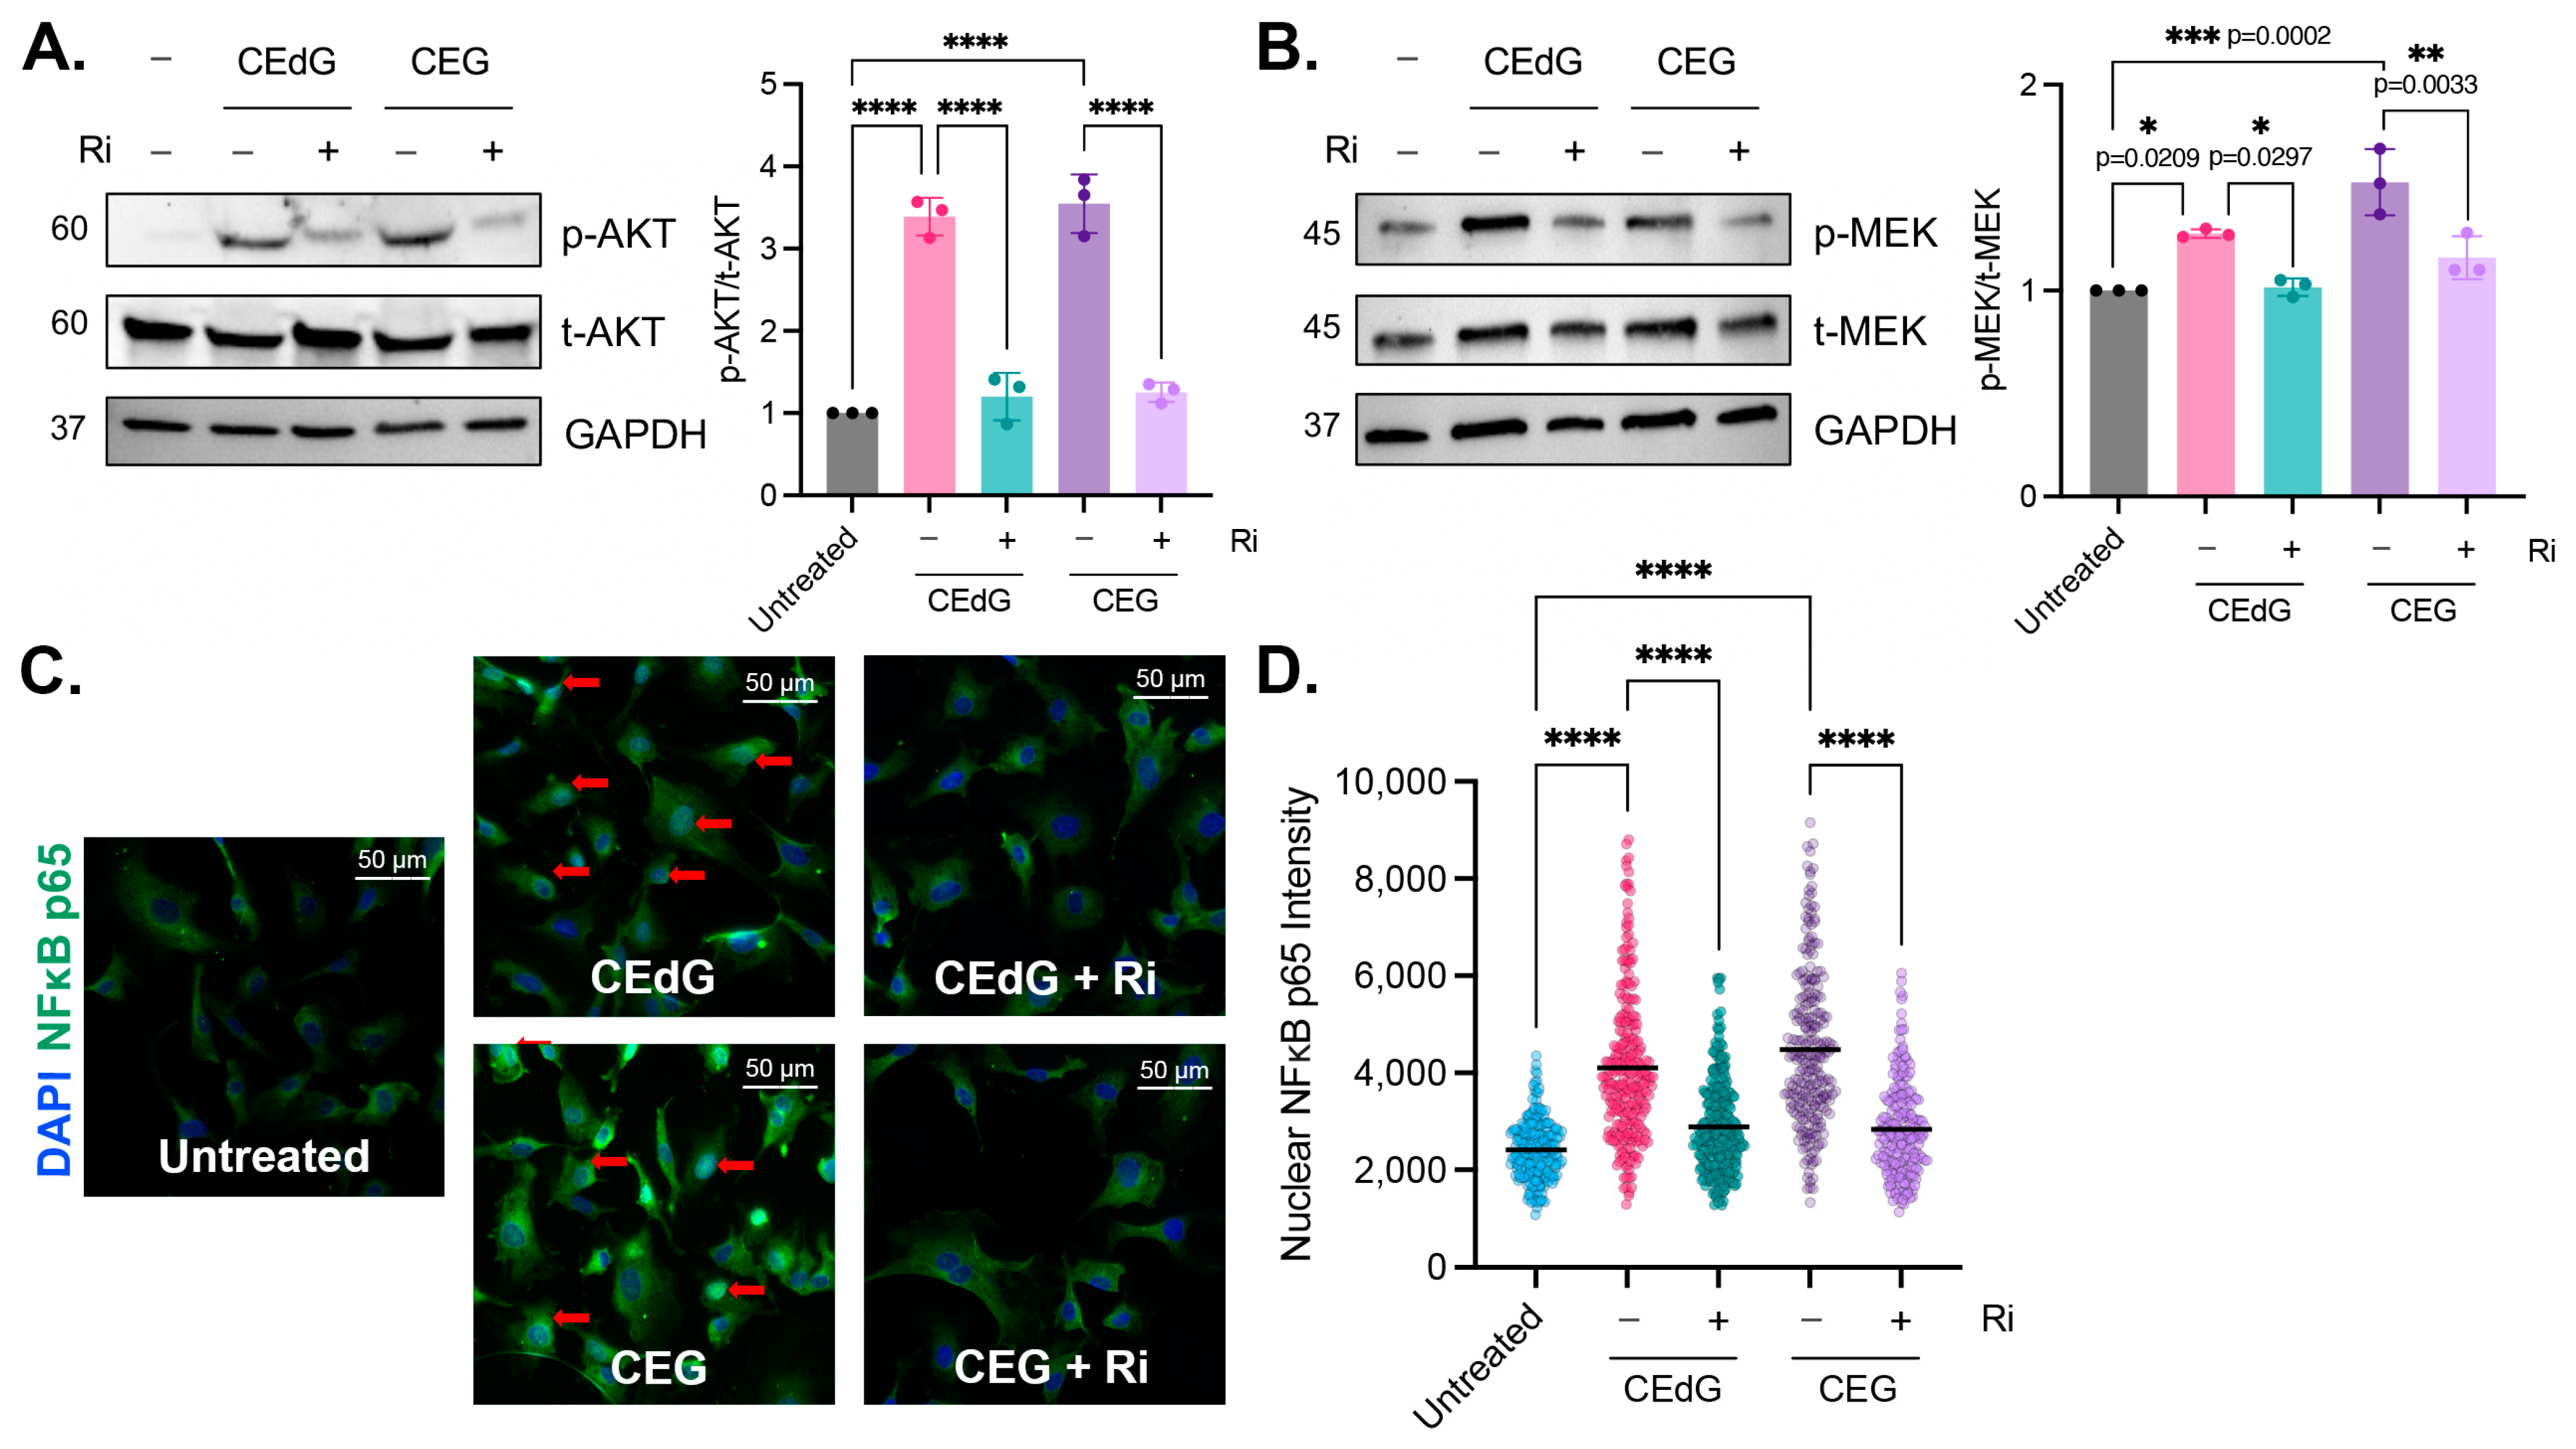
3.7. MG Adducts Activate RAGE
3.8. MG Adducts Drive NFκB p65 Nuclear Translocation in a RAGE-Dependent Manner
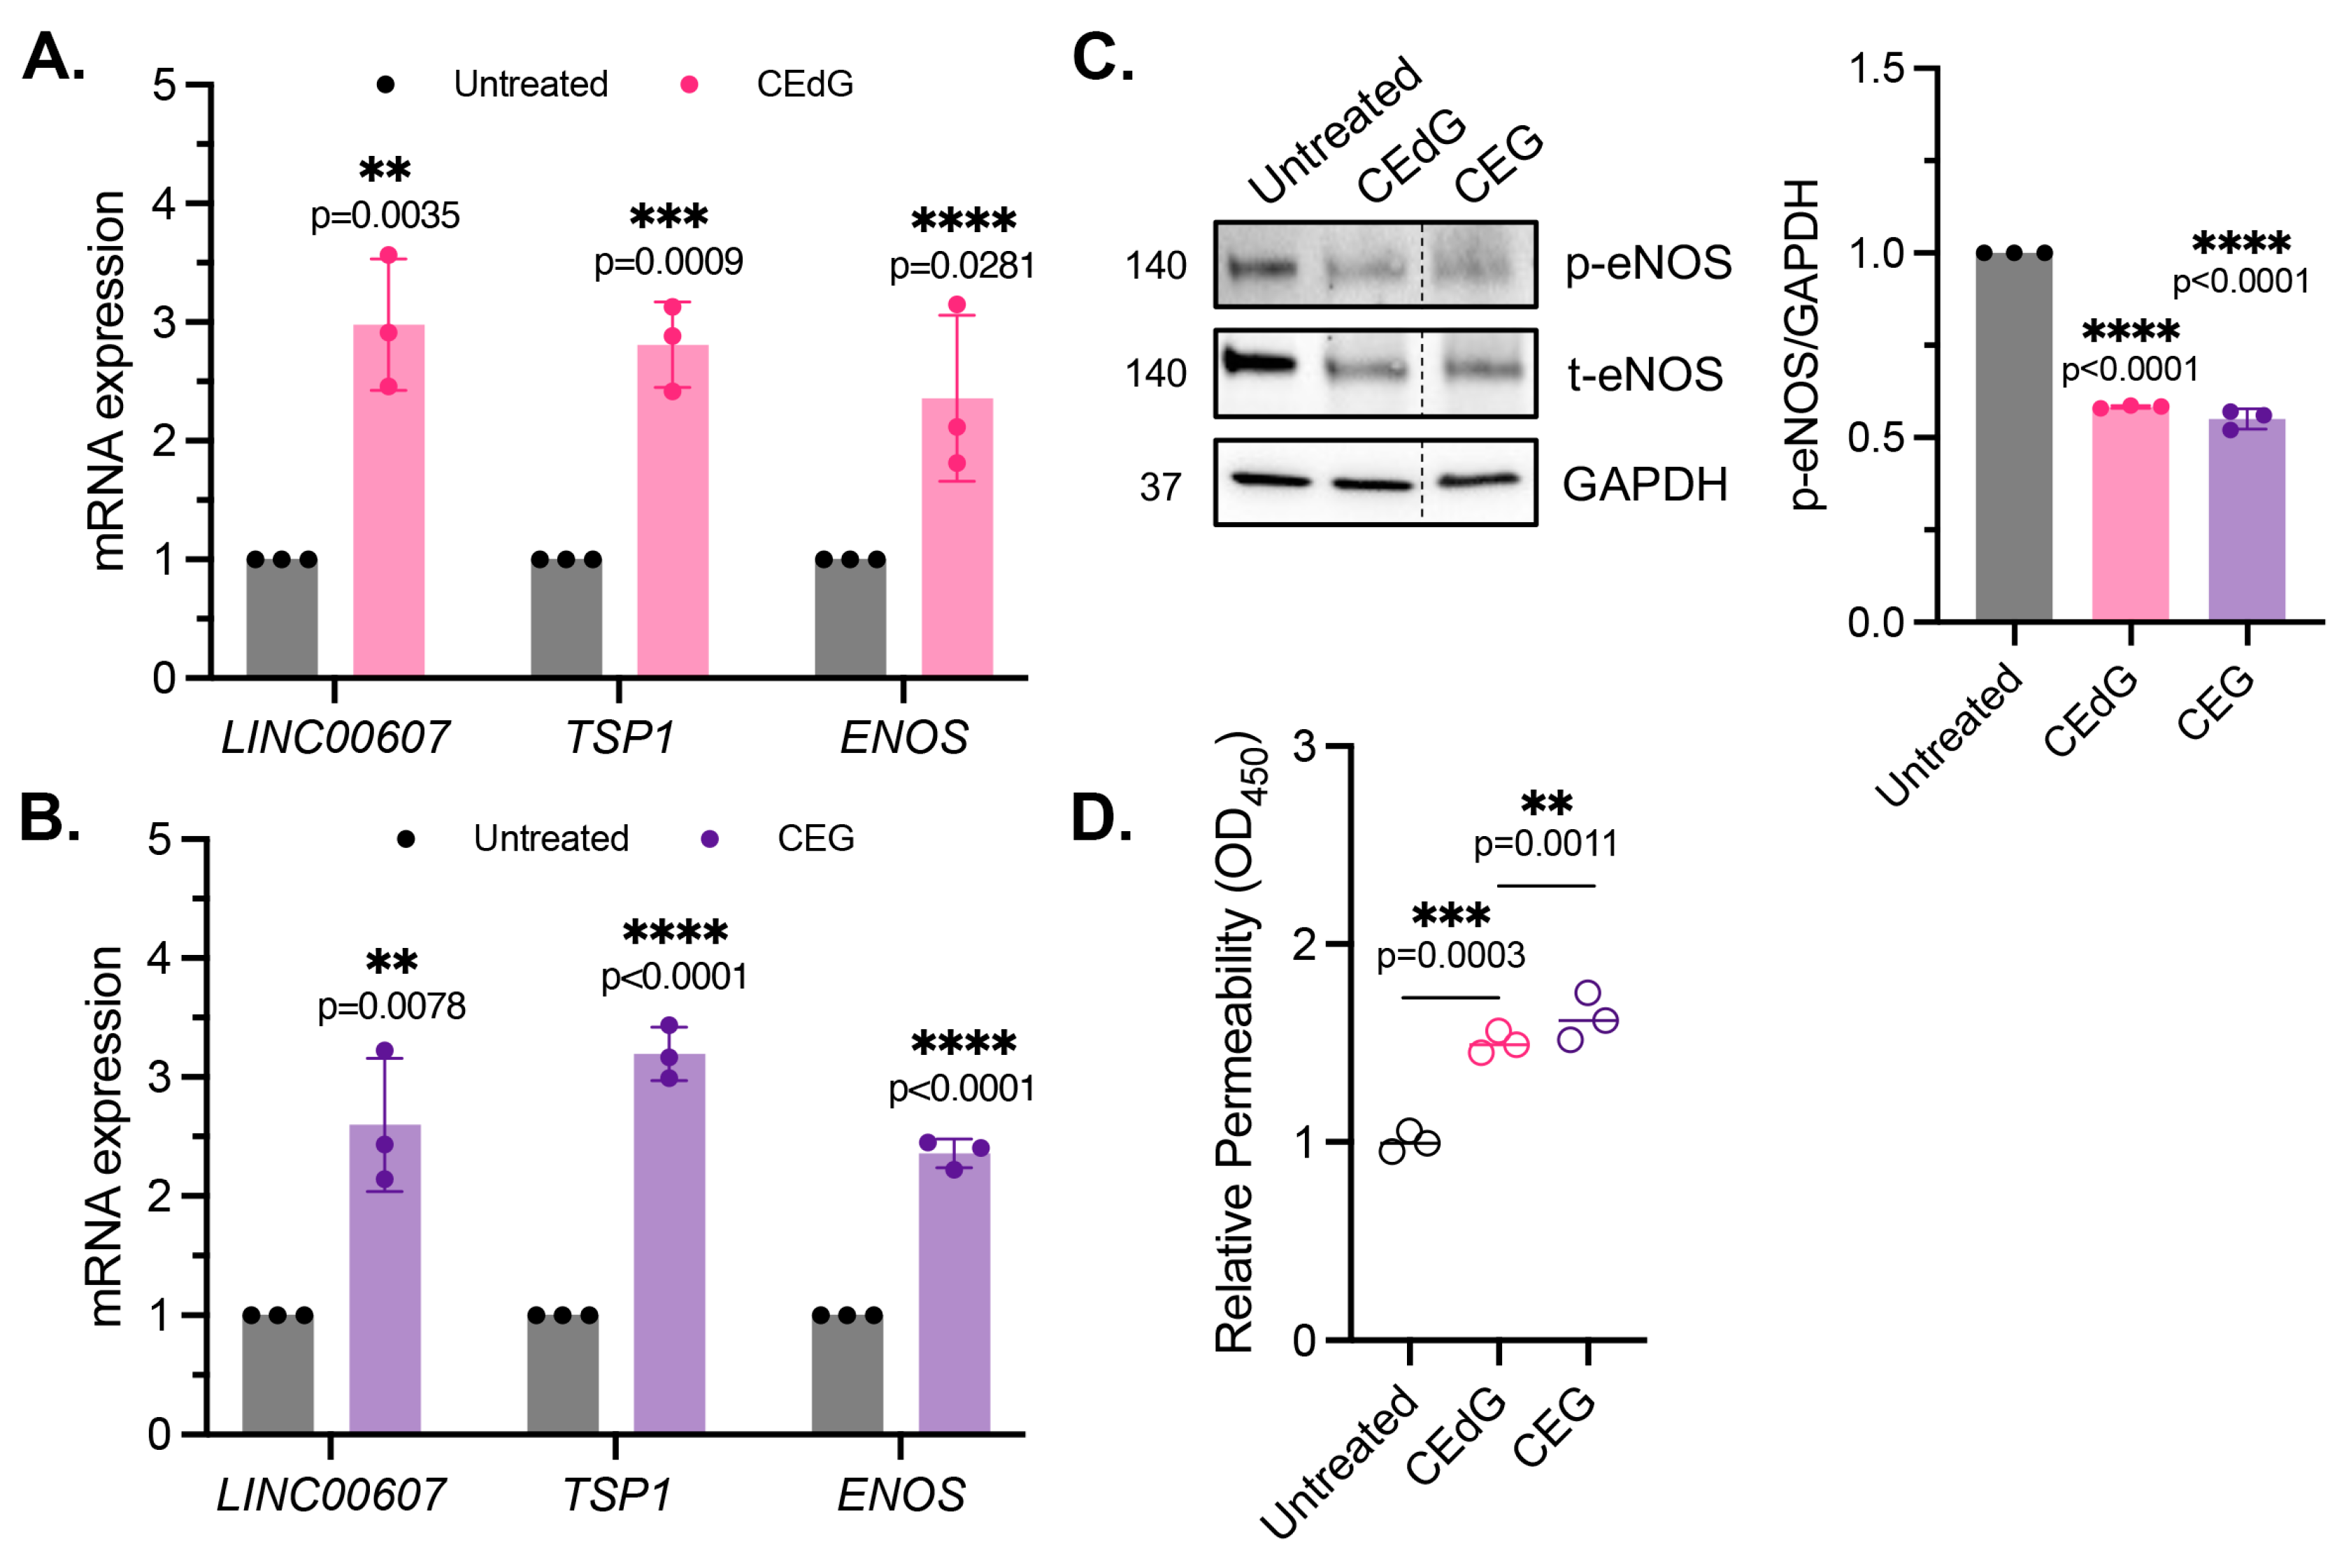
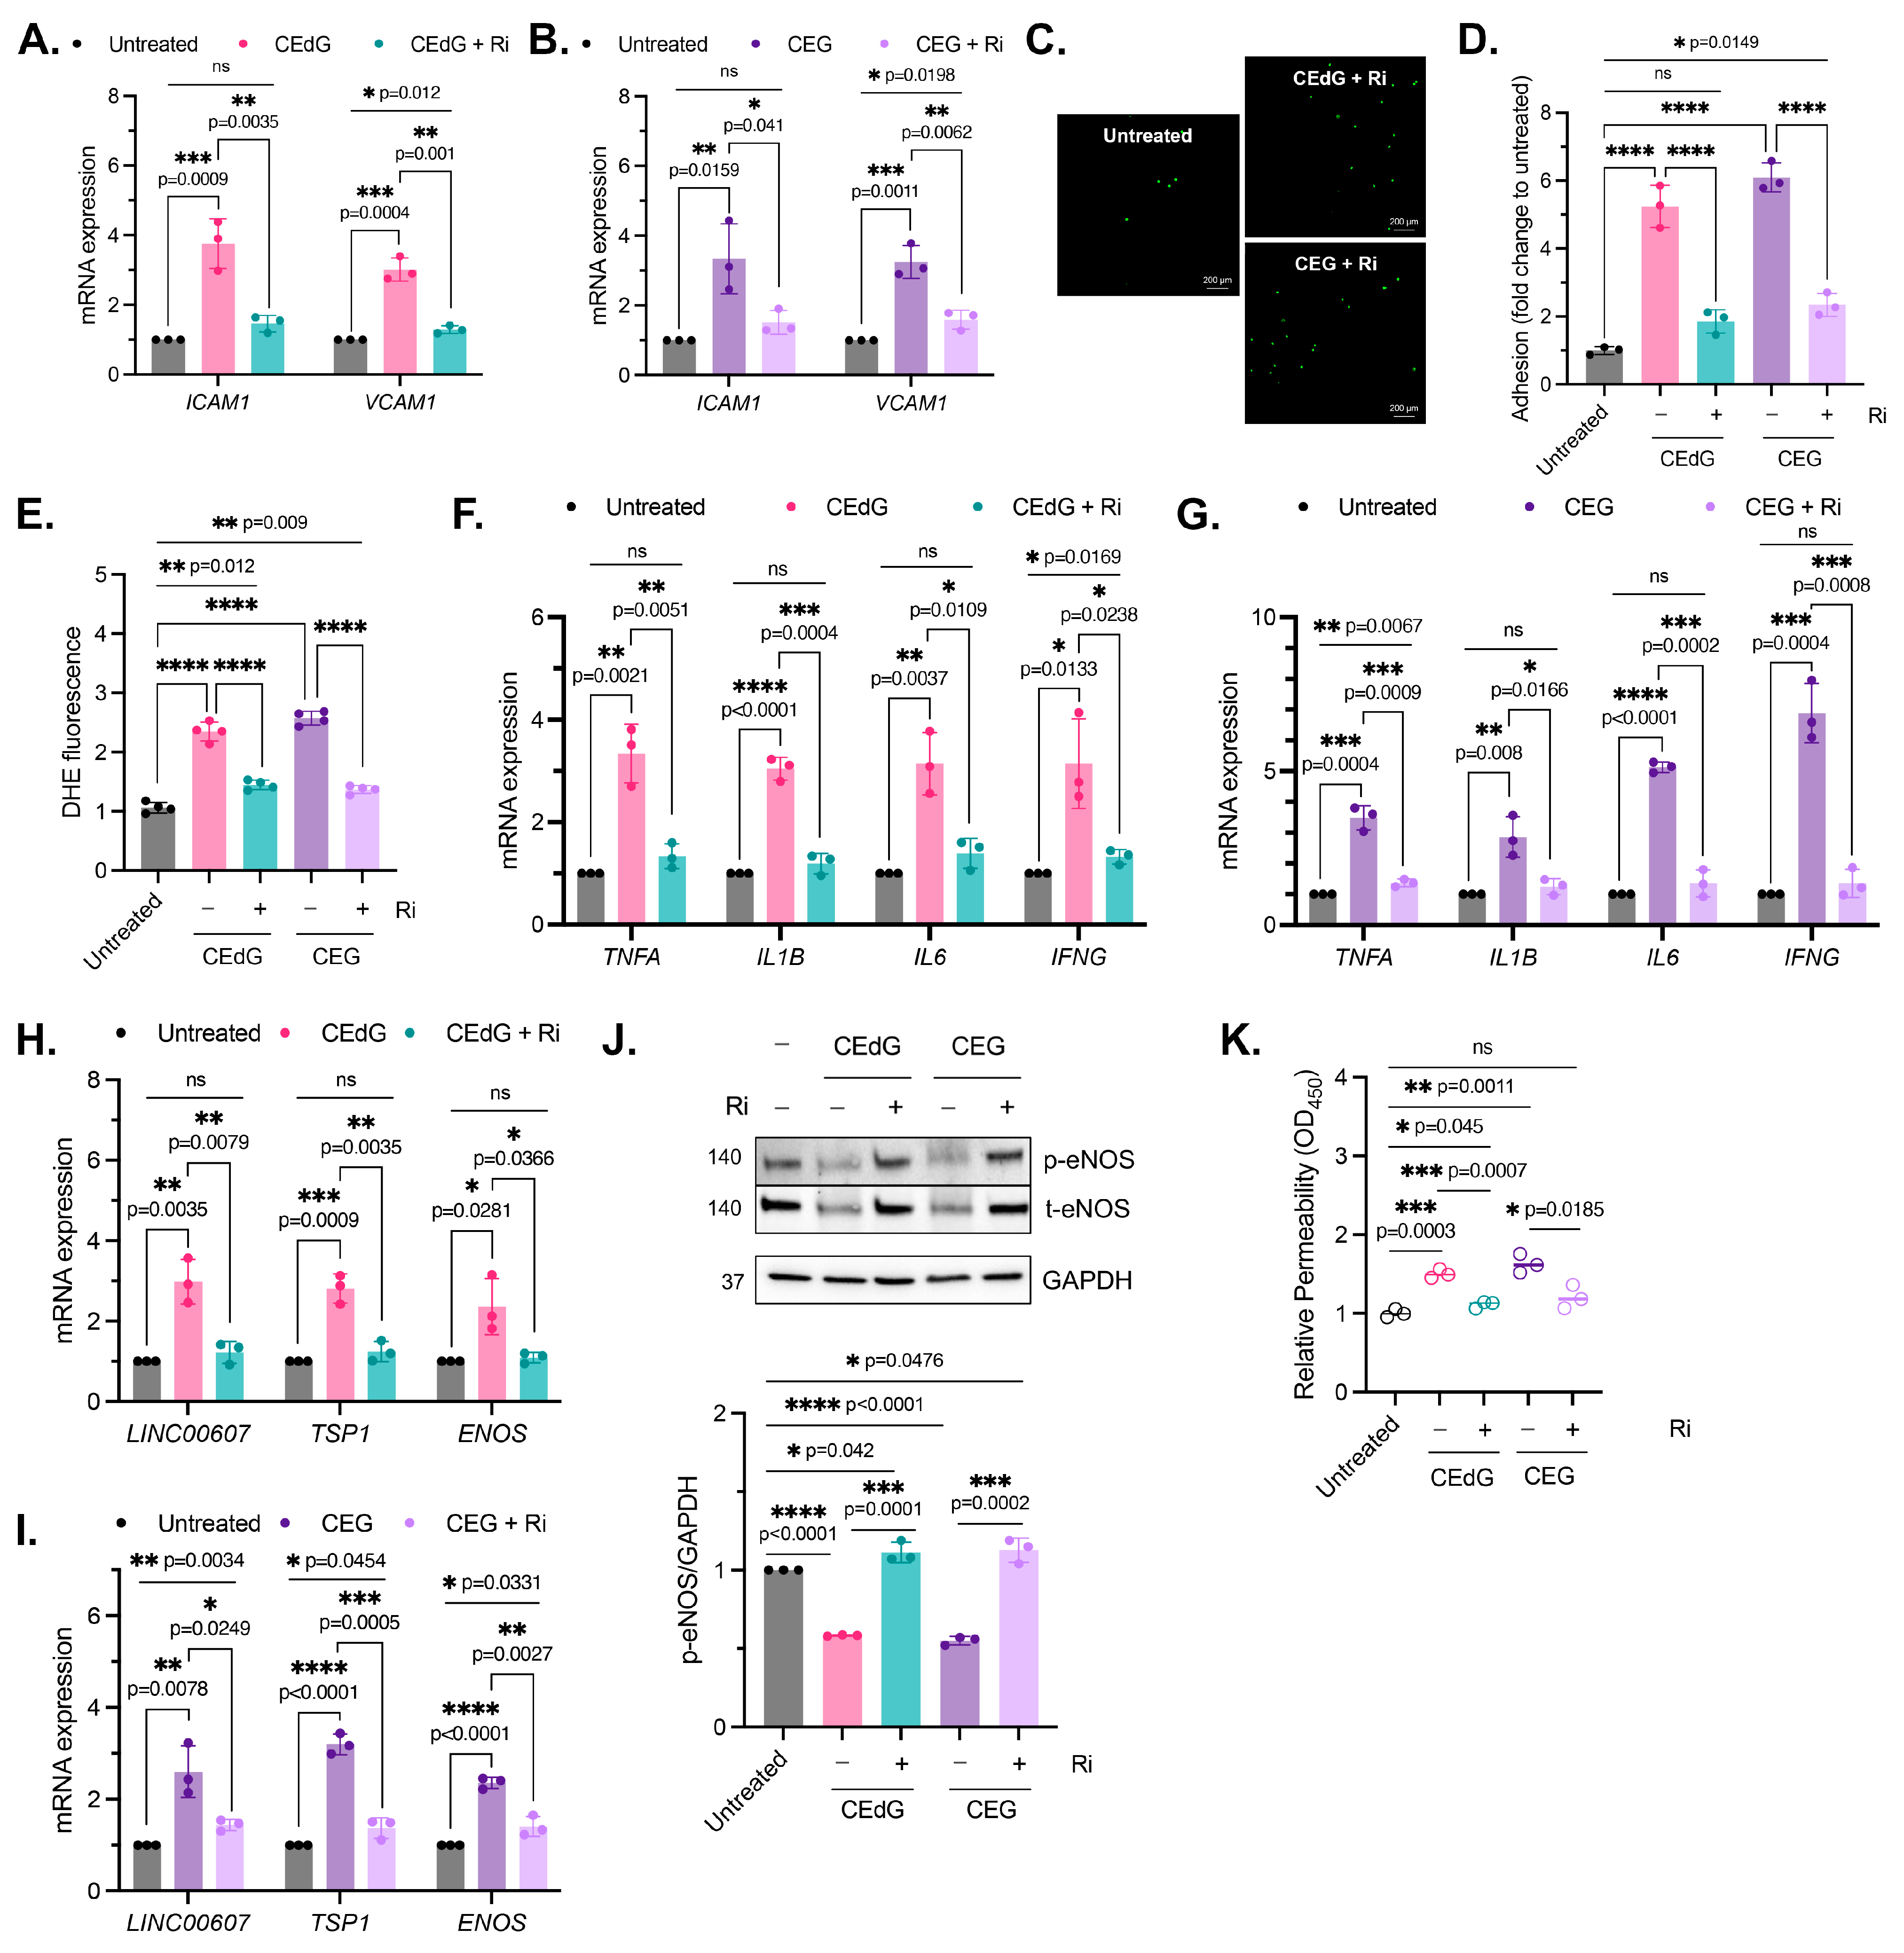
3.9. RAGE Inhibition Mitigates MG Adduct-Mediated Endothelial Dysfunction
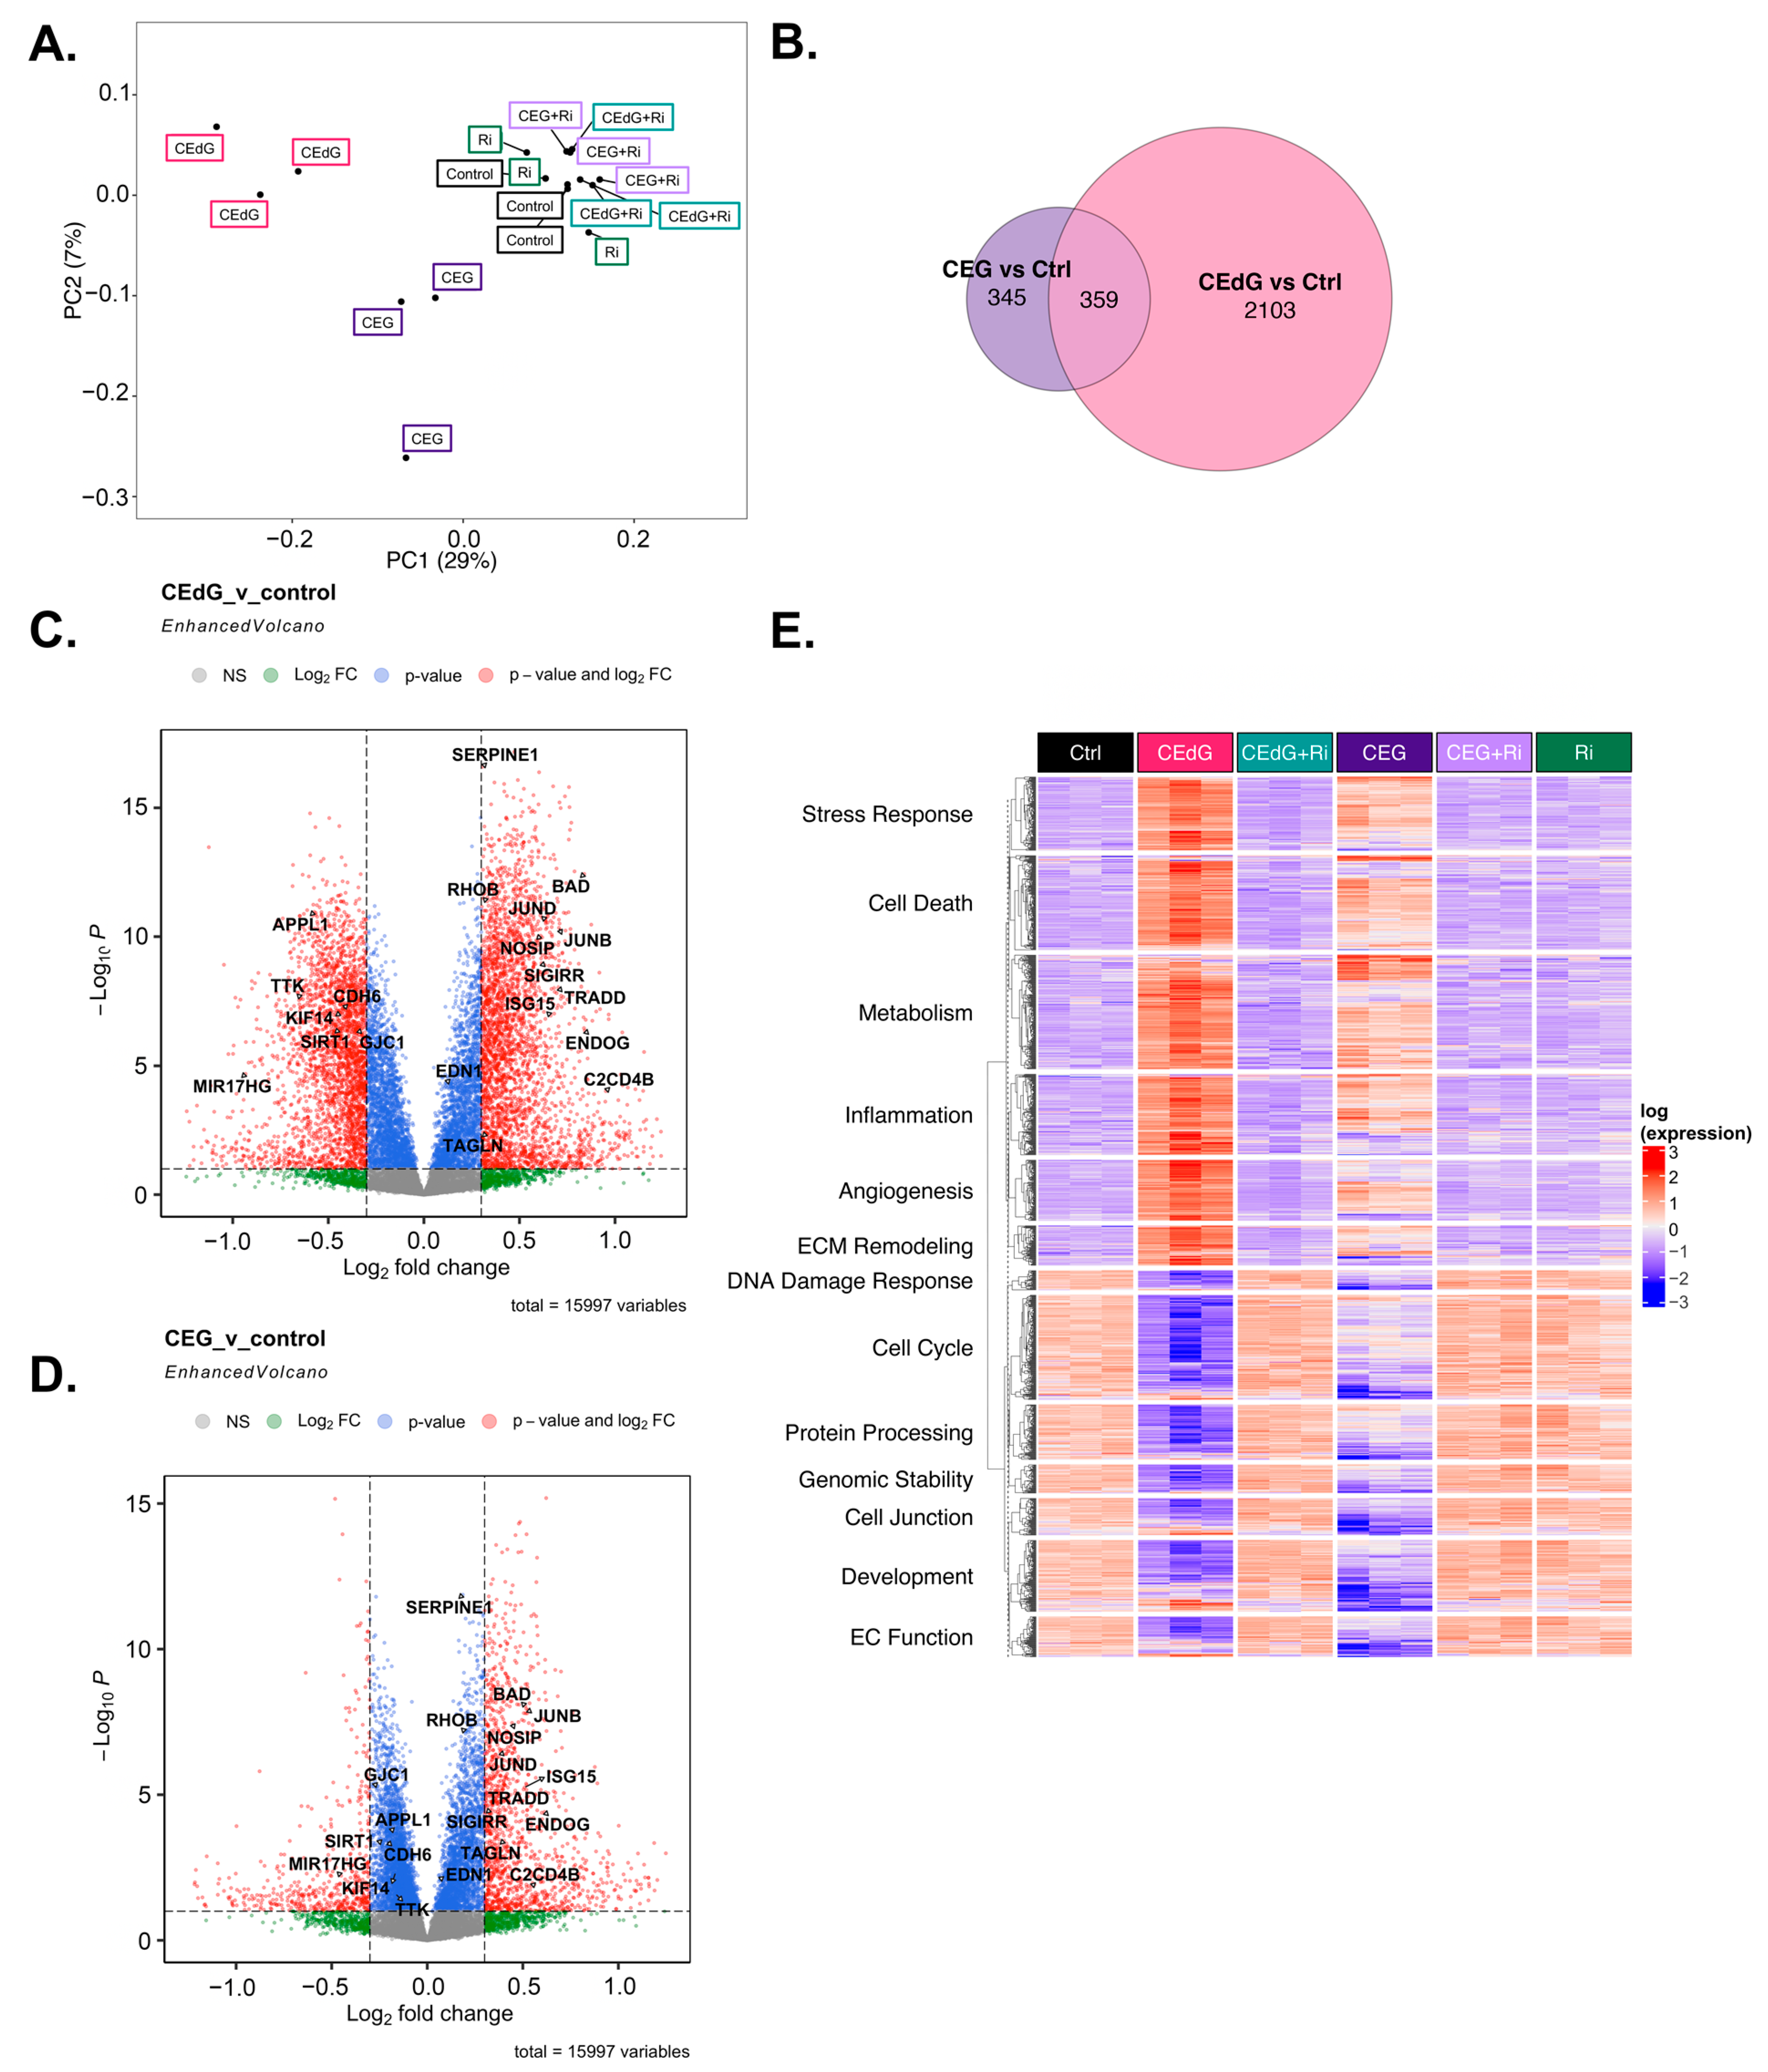
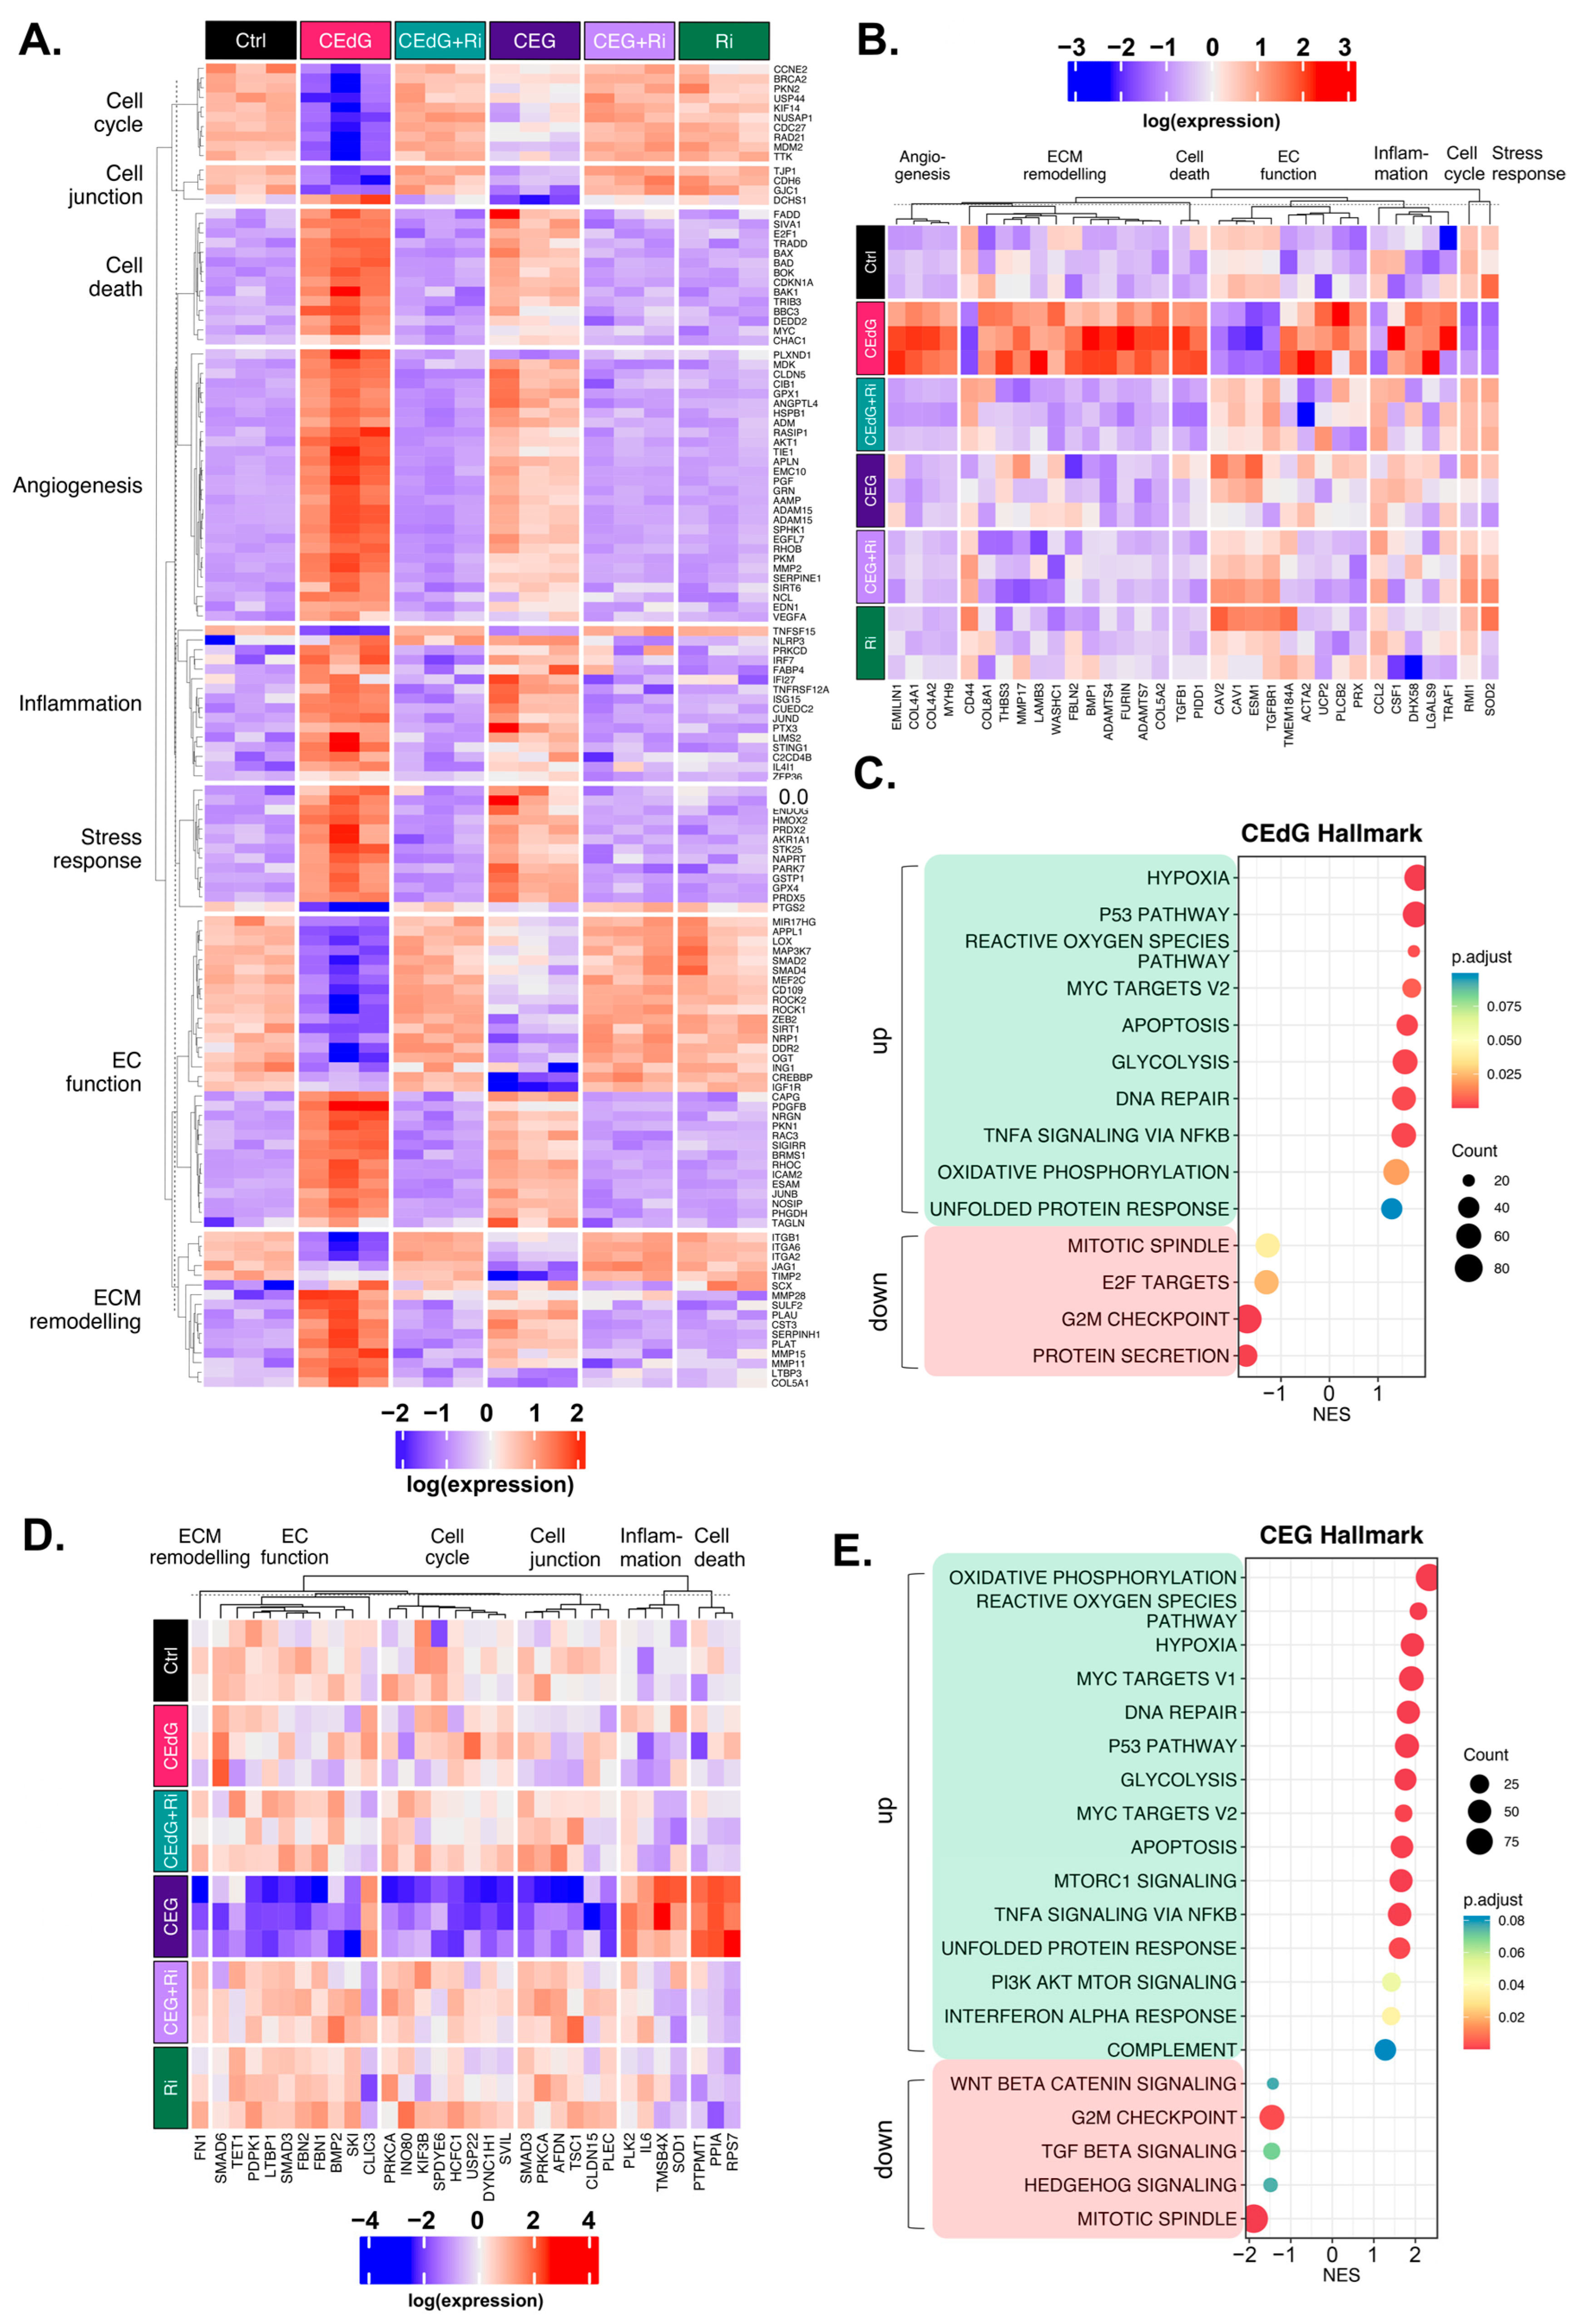
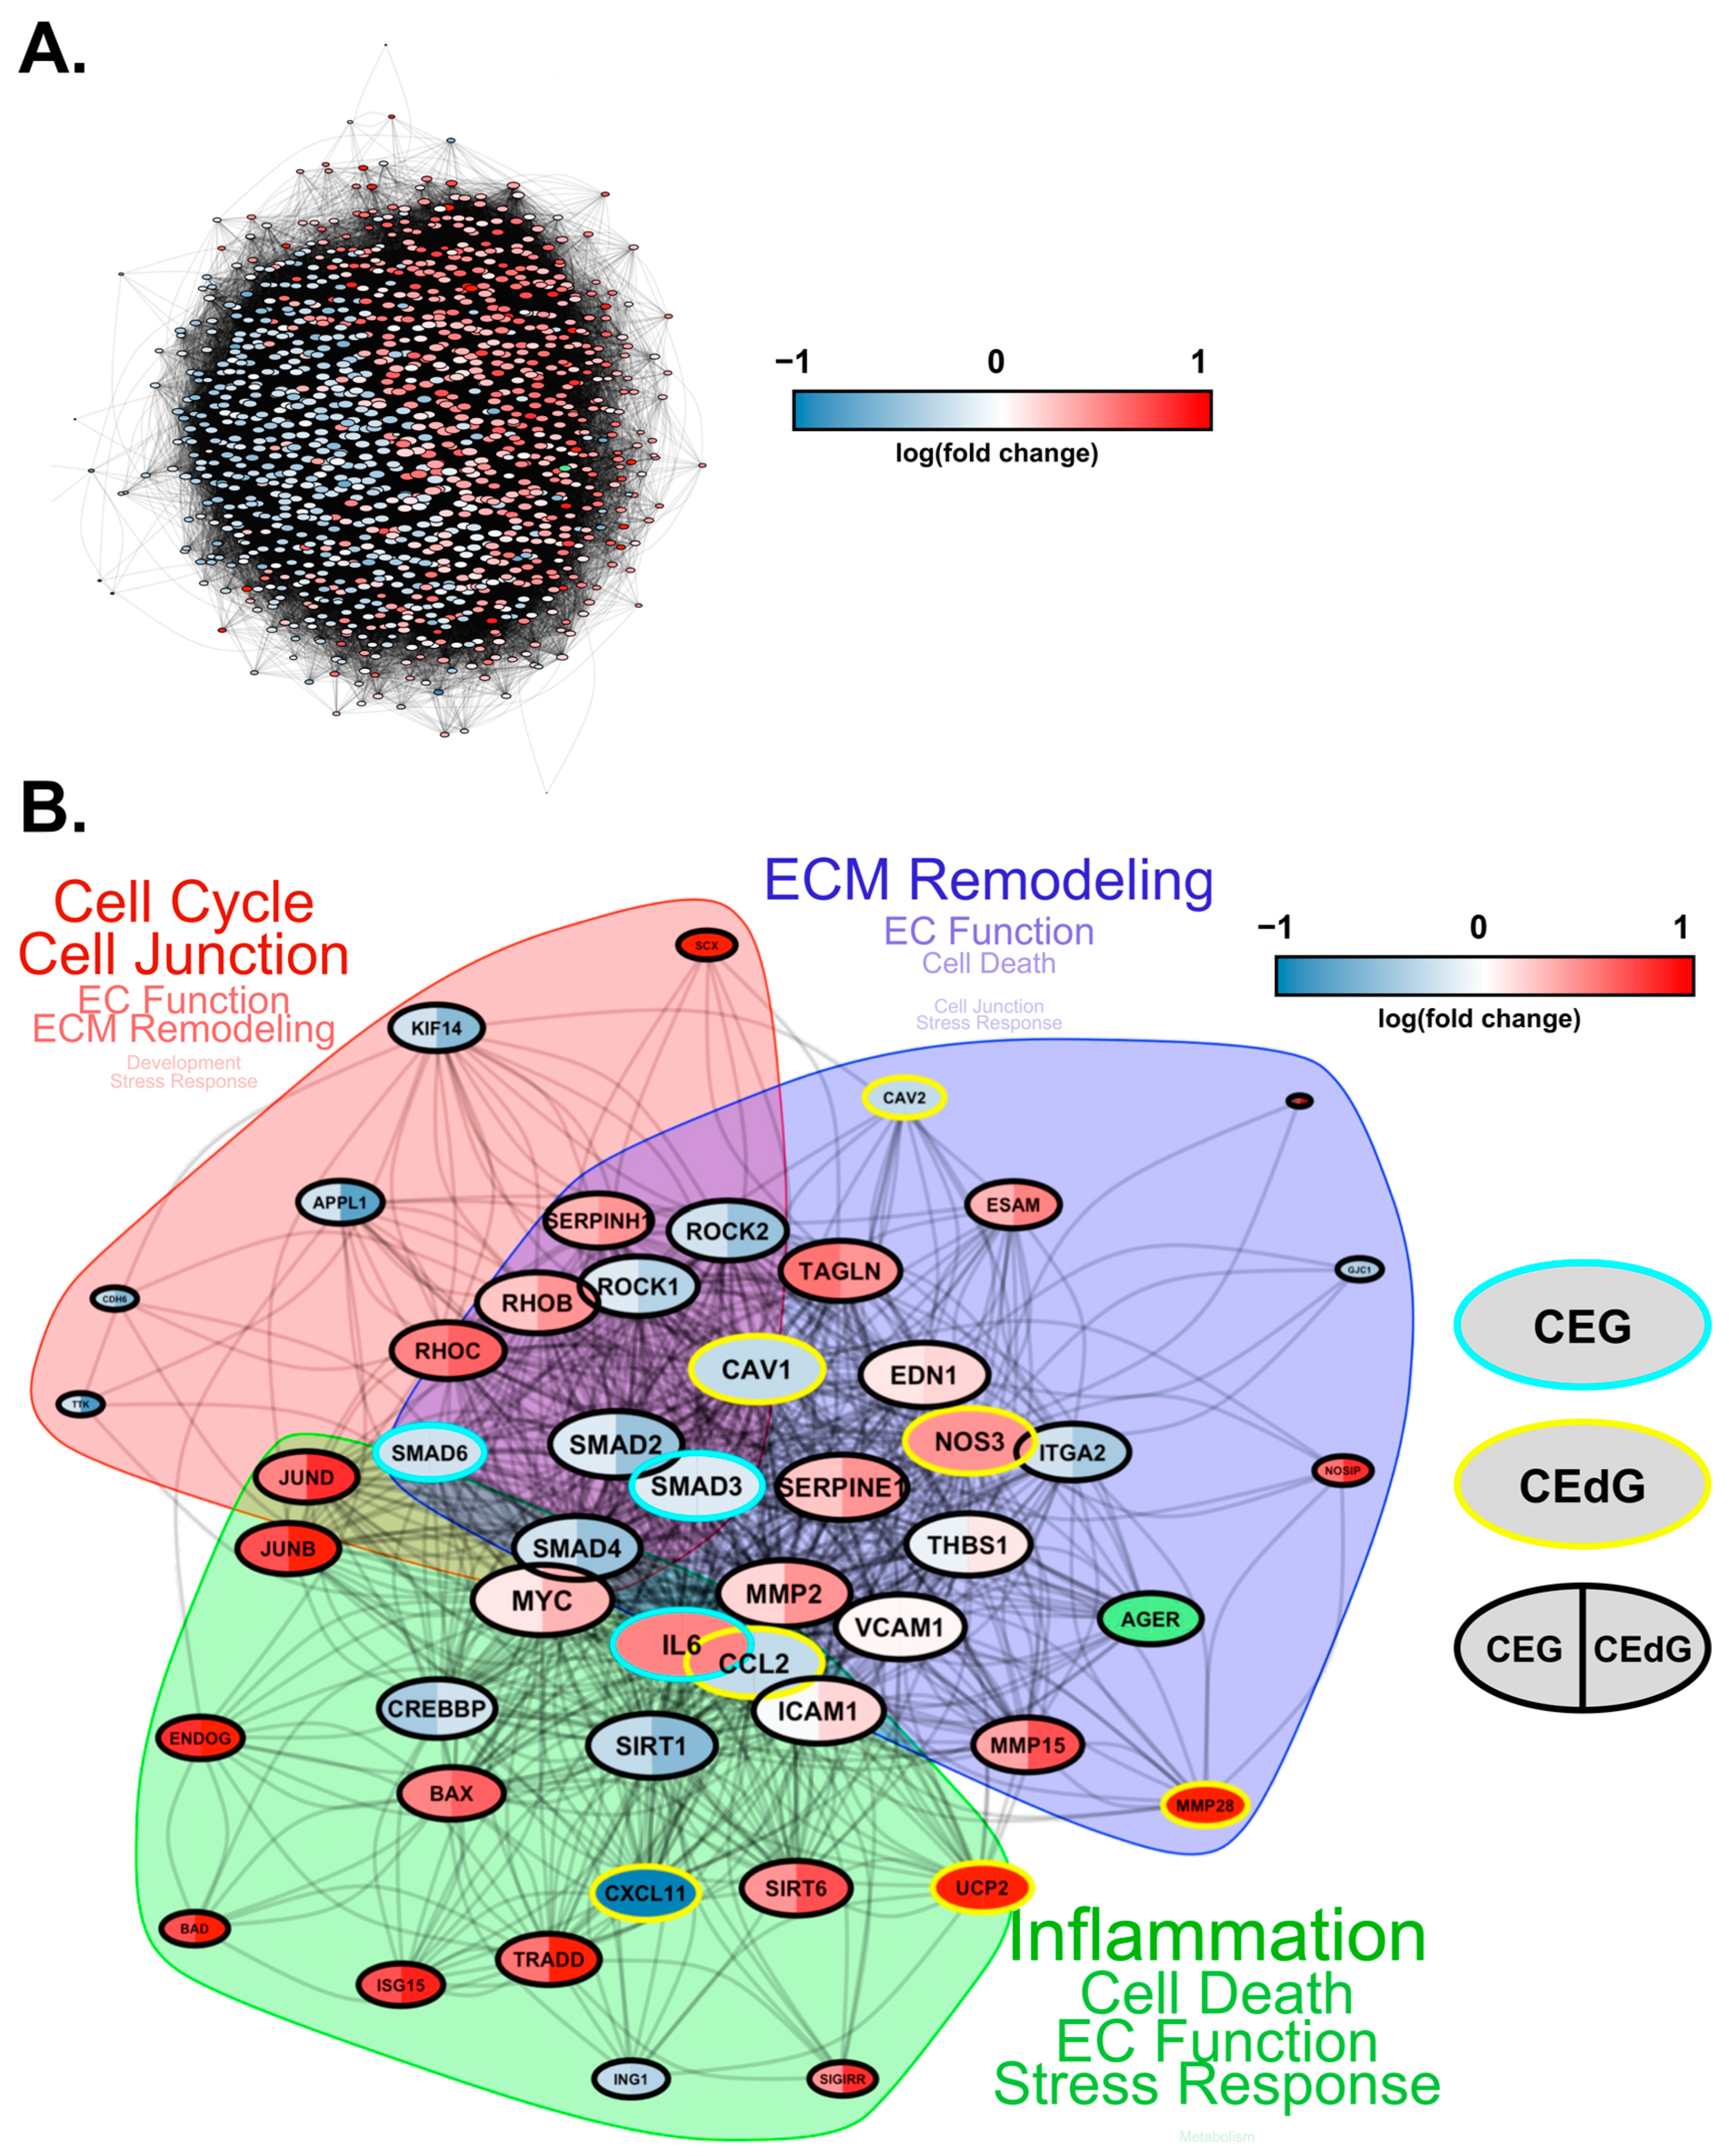
3.10. MG Adducts Induce Transcriptional Changes in HUVECs
3.11. Time-Dependent Effects of MG Adducts on Endothelial Cells
4. Discussion
5. Conclusions
Supplementary Materials
Author Contributions
Funding
Institutional Review Board Statement
Informed Consent Statement
Data Availability Statement
Acknowledgments
Conflicts of Interest
References
- Ong, K.L.; Stafford, L.K.; McLaughlin, S.A.; Boyko, E.J.; Vollset, S.E.; Smith, A.E.; Dalton, B.E.; Duprey, J.; Cruz, J.A.; Hagins, H.; et al. Global, Regional, and National Burden of Diabetes from 1990 to 2021, with Projections of Prevalence to 2050: A Systematic Analysis for the Global Burden of Disease Study 2021. Lancet 2023, 402, 203–234. [Google Scholar] [CrossRef] [PubMed]
- Rask-Madsen, C.; King, G.L. Vascular Complications of Diabetes: Mechanisms of Injury and Protective Factors. Cell Metab. 2013, 17, 20–33. [Google Scholar] [CrossRef] [PubMed]
- Endemann, D.H.; Schiffrin, E.L. Endothelial Dysfunction. J. Am. Soc. Nephrol. JASN 2004, 15, 1983–1992. [Google Scholar] [CrossRef] [PubMed]
- Babaei-Jadidi, R.; Karachalias, N.; Ahmed, N.; Battah, S.; Thornalley, P.J. Prevention of Incipient Diabetic Nephropathy by High-Dose Thiamine and Benfotiamine. Diabetes 2003, 52, 2110–2120. [Google Scholar] [CrossRef] [PubMed]
- Moens, A.L.; Champion, H.C.; Claeys, M.J.; Tavazzi, B.; Kaminski, P.M.; Wolin, M.S.; Borgonjon, D.J.; Van Nassauw, L.; Haile, A.; Zviman, M.; et al. High-Dose Folic Acid Pretreatment Blunts Cardiac Dysfunction during Ischemia Coupled to Maintenance of High-Energy Phosphates and Reduces Postreperfusion Injury. Circulation 2008, 117, 1810–1819. [Google Scholar] [CrossRef] [PubMed]
- Walton, D.M.; Minton, S.D.; Cook, A.D. The Potential of Transdermal Nitric Oxide Treatment for Diabetic Peripheral Neuropathy and Diabetic Foot Ulcers. Diabetes Metab. Syndr. 2019, 13, 3053–3056. [Google Scholar] [CrossRef] [PubMed]
- Nakayama, T.; Sato, W.; Kosugi, T.; Zhang, L.; Campbell-Thompson, M.; Yoshimura, A.; Croker, B.P.; Johnson, R.J.; Nakagawa, T. Endothelial Injury Due to eNOS Deficiency Accelerates the Progression of Chronic Renal Disease in the Mouse. Am. J. Physiol. Renal Physiol. 2009, 296, F317–F327. [Google Scholar] [CrossRef] [PubMed]
- Lai, S.W.T.; Lopez Gonzalez, E.D.J.; Zoukari, T.; Ki, P.; Shuck, S.C. Methylglyoxal and Its Adducts: Induction, Repair, and Association with Disease. Chem. Res. Toxicol. 2022, 35, 1720–1746. [Google Scholar] [CrossRef]
- Lai, S.W.T.; Hernandez-Castillo, C.; De Jesus Lopez Gonzalez, E.; Zoukari, T.; Talley, M.; Paquin, N.; Chen, Z.; Roep, B.O.; Kaddis, J.S.; Natarajan, R.; et al. Methylglyoxal Adducts Are Prognostic Biomarkers for Diabetic Kidney Disease in Patients with Type 1 Diabetes. Diabetes 2023, db230277. [Google Scholar] [CrossRef]
- Indurthi, V.S.K.; Jensen, J.L.; Leclerc, E.; Sinha, S.; Colbert, C.L.; Vetter, S.W. The Trp Triad within the V-Domain of the Receptor for Advanced Glycation End Products Modulates Folding, Stability and Ligand Binding. Biosci. Rep. 2020, 40, BSR20193360. [Google Scholar] [CrossRef]
- Leclerc, E.; Fritz, G.; Weibel, M.; Heizmann, C.W.; Galichet, A. S100B and S100A6 Differentially Modulate Cell Survival by Interacting with Distinct RAGE (Receptor for Advanced Glycation End Products) Immunoglobulin Domains. J. Biol. Chem. 2007, 282, 31317–31331. [Google Scholar] [CrossRef] [PubMed]
- Manigrasso, M.B.; Pan, J.; Rai, V.; Zhang, J.; Reverdatto, S.; Quadri, N.; DeVita, R.J.; Ramasamy, R.; Shekhtman, A.; Schmidt, A.M. Small Molecule Inhibition of Ligand-Stimulated RAGE-DIAPH1 Signal Transduction. Sci. Rep. 2016, 6, 22450. [Google Scholar] [CrossRef]
- Curran, C.S.; Kopp, J.B. RAGE Pathway Activation and Function in Chronic Kidney Disease and COVID-19. Front. Med. 2022, 9, 970423. [Google Scholar] [CrossRef] [PubMed]
- Omori, K.; Ohira, T.; Uchida, Y.; Ayilavarapu, S.; Batista, E.L.J.; Yagi, M.; Iwata, T.; Liu, H.; Hasturk, H.; Kantarci, A.; et al. Priming of Neutrophil Oxidative Burst in Diabetes Requires Preassembly of the NADPH Oxidase. J. Leukoc. Biol. 2008, 84, 292–301. [Google Scholar] [CrossRef] [PubMed]
- Xie, J.; Burz, D.S.; He, W.; Bronstein, I.B.; Lednev, I.; Shekhtman, A. Hexameric Calgranulin C (S100A12) Binds to the Receptor for Advanced Glycated End Products (RAGE) Using Symmetric Hydrophobic Target-Binding Patches. J. Biol. Chem. 2007, 282, 4218–4231. [Google Scholar] [CrossRef] [PubMed]
- Donato, R. RAGE: A Single Receptor for Several Ligands and Different Cellular Responses: The Case of Certain S100 Proteins. Curr. Mol. Med. 2007, 7, 711–724. [Google Scholar] [CrossRef] [PubMed]
- Fatchiyah, F.; Hardiyanti, F.; Widodo, N. Selective Inhibition on RAGE-Binding AGEs Required by Bioactive Peptide Alpha-S2 Case in Protein from Goat Ethawah Breed Milk: Study of Biological Modeling. Acta Inform. Medica 2015, 23, 90–96. [Google Scholar] [CrossRef]
- Xie, J.; Reverdatto, S.; Frolov, A.; Hoffmann, R.; Burz, D.S.; Shekhtman, A. Structural Basis for Pattern Recognition by the Receptor for Advanced Glycation End Products (RAGE). J. Biol. Chem. 2008, 283, 27255–27269. [Google Scholar] [CrossRef]
- Basta, G.; Lazzerini, G.; Massaro, M.; Simoncini, T.; Tanganelli, P.; Fu, C.; Kislinger, T.; Stern, D.M.; Schmidt, A.M.; De Caterina, R. Advanced Glycation End Products Activate Endothelium through Signal-Transduction Receptor RAGE: A Mechanism for Amplification of Inflammatory Responses. Circulation 2002, 105, 816–822. [Google Scholar] [CrossRef]
- Gao, X.; Zhang, H.; Schmidt, A.M.; Zhang, C. AGE/RAGE Produces Endothelial Dysfunction in Coronary Arterioles in Type 2 Diabetic Mice. Am. J. Physiol. Heart Circ. Physiol. 2008, 295, H491–H498. [Google Scholar] [CrossRef]
- Wang, L.; Wu, J.; Guo, X.; Huang, X.; Huang, Q. RAGE Plays a Role in LPS-Induced NF-κB Activation and Endothelial Hyperpermeability. Sensors 2017, 17, 722. [Google Scholar] [CrossRef] [PubMed]
- Hwang, J.; Balakrishnan, R.; Oh, E.; Veluthakal, R.; Thurmond, D.C. A Novel Role for DOC2B in Ameliorating Palmitate-Induced Glucose Uptake Dysfunction in Skeletal Muscle Cells via a Mechanism Involving β-AR Agonism and Cofilin. Int. J. Mol. Sci. 2024, 25, 137. [Google Scholar] [CrossRef]
- Shuck, S.C.; Achenbach, P.; Roep, B.O.; Termini, J.S.; Hernandez-Castillo, C.; Winkler, C.; Weiss, A.; Ziegler, A.-G. Methylglyoxal Products in Pre-Symptomatic Type 1 Diabetes. Front. Endocrinol. 2023, 14, 1108910. [Google Scholar] [CrossRef] [PubMed]
- Shuck, S.C.; Wuenschell, G.E.; Termini, J.S. Product Studies and Mechanistic Analysis of the Reaction of Methylglyoxal with Deoxyguanosine. Chem. Res. Toxicol. 2018, 31, 105–115. [Google Scholar] [CrossRef] [PubMed]
- Partek® Flow® (Version 10.0) [Computer Software] 2020. Available online: https://www.partek.com/citing-partek-software-in-a-publication/ (accessed on 6 December 2023).
- Langmead, B.; Salzberg, S.L. Fast Gapped-Read Alignment with Bowtie 2. Nat. Methods 2012, 9, 357–359. [Google Scholar] [CrossRef]
- Martin, M. Cutadapt Removes Adapter Sequences From High-Throughput Sequencing Reads. EMBnet J. 2011, 17, 10–12. [Google Scholar] [CrossRef]
- Dobin, A.; Davis, C.A.; Schlesinger, F.; Drenkow, J.; Zaleski, C.; Jha, S.; Batut, P.; Chaisson, M.; Gingeras, T.R. STAR: Ultrafast Universal RNA-Seq Aligner. Bioinformatics 2013, 29, 15–21. [Google Scholar] [CrossRef]
- Xing, Y.; Yu, T.; Wu, Y.N.; Roy, M.; Kim, J.; Lee, C. An Expectation-Maximization Algorithm for Probabilistic Reconstructions of Full-Length Isoforms from Splice Graphs. Nucleic Acids Res. 2006, 34, 3150–3160. [Google Scholar] [CrossRef]
- Law, C.W.; Chen, Y.; Shi, W.; Smyth, G.K. Voom: Precision Weights Unlock Linear Model Analysis Tools for RNA-Seq Read Counts. Genome Biol. 2014, 15, R29. [Google Scholar] [CrossRef]
- Benjamini, Y.; Drai, D.; Elmer, G.; Kafkafi, N.; Golani, I. Controlling the False Discovery Rate in Behavior Genetics Research. Behav. Brain Res. 2001, 125, 279–284. [Google Scholar] [CrossRef]
- Wu, T.; Hu, E.; Xu, S.; Chen, M.; Guo, P.; Dai, Z.; Feng, T.; Zhou, L.; Tang, W.; Zhan, L.; et al. clusterProfiler 4.0: A Universal Enrichment Tool for Interpreting Omics Data. Innov. Camb. Mass 2021, 2, 100141. [Google Scholar] [CrossRef] [PubMed]
- Ashburner, M.; Ball, C.A.; Blake, J.A.; Botstein, D.; Butler, H.; Cherry, J.M.; Davis, A.P.; Dolinski, K.; Dwight, S.S.; Eppig, J.T.; et al. Gene Ontology: Tool for the Unification of Biology. The Gene Ontology Consortium. Nat. Genet. 2000, 25, 25–29. [Google Scholar] [CrossRef]
- Aleksander, S.A.; Balhoff, J.; Carbon, S.; Cherry, J.M.; Drabkin, H.J.; Ebert, D.; Feuermann, M.; Gaudet, P.; Harris, N.L.; Hill, D.P.; et al. The Gene Ontology Knowledgebase in 2023. Genetics 2023, 224, iyad031. [Google Scholar] [CrossRef] [PubMed]
- Kanehisa, M.; Goto, S. KEGG: Kyoto Encyclopedia of Genes and Genomes. Nucleic Acids Res. 2000, 28, 27–30. [Google Scholar] [CrossRef] [PubMed]
- Liberzon, A.; Birger, C.; Thorvaldsdóttir, H.; Ghandi, M.; Mesirov, J.P.; Tamayo, P. The Molecular Signatures Database (MSigDB) Hallmark Gene Set Collection. Cell Syst. 2015, 1, 417–425. [Google Scholar] [CrossRef]
- Szklarczyk, D.; Gable, A.L.; Lyon, D.; Junge, A.; Wyder, S.; Huerta-Cepas, J.; Simonovic, M.; Doncheva, N.T.; Morris, J.H.; Bork, P.; et al. STRING V11: Protein-Protein Association Networks with Increased Coverage, Supporting Functional Discovery in Genome-Wide Experimental Datasets. Nucleic Acids Res. 2019, 47, D607–D613. [Google Scholar] [CrossRef]
- Lewis, M.; Blighe, K.; Rana, S. EnhancedVolcano 2021. Available online: https://github.com/kevinblighe/EnhancedVolcano (accessed on 6 December 2023).
- Gu, Z.; Eils, R.; Schlesner, M. Complex Heatmaps Reveal Patterns and Correlations in Multidimensional Genomic Data. Bioinformatics 2016, 32, 2847–2849. [Google Scholar] [CrossRef] [PubMed]
- Micallef, L.; Rodgers, P. eulerAPE: Drawing Area-Proportional 3-Venn Diagrams Using Ellipses. PLoS ONE 2014, 9, e101717. [Google Scholar] [CrossRef]
- Csárdi, G.; Nepusz, T.; Müller, K.; Horvát, S.; Traag, V.; Zanini, F.; Noom, D. Igraph for R: R Interface of the Igraph Library for Graph Theory and Network Analysis 2023. Available online: https://zenodo.org/record/8046777 (accessed on 6 December 2023).
- Team, R. R: A Language and Environment for Statistical Computing; R Foundation for Statistical Computing: Vienna, Austria, 2022. [Google Scholar]
- Jaramillo, R.; Shuck, S.C.; Chan, Y.S.; Liu, X.; Bates, S.E.; Lim, P.P.; Tamae, D.; Lacoste, S.; O’Connor, T.R.; Termini, J. DNA Advanced Glycation End Products (DNA-AGEs) Are Elevated in Urine and Tissue in an Animal Model of Type 2 Diabetes. Chem. Res. Toxicol. 2017, 30, 689–698. [Google Scholar] [CrossRef]
- Liao, J.K. Linking Endothelial Dysfunction with Endothelial Cell Activation. J. Clin. Investig. 2013, 123, 540–541. [Google Scholar] [CrossRef]
- Calandrelli, R.; Xu, L.; Luo, Y.; Wu, W.; Fan, X.; Nguyen, T.; Chen, C.-J.; Sriram, K.; Tang, X.; Burns, A.B.; et al. Stress-Induced RNA-Chromatin Interactions Promote Endothelial Dysfunction. Nat. Commun. 2020, 11, 5211. [Google Scholar] [CrossRef]
- Yang, S.-J.; Chen, C.-Y.; Chang, G.-D.; Wen, H.-C.; Chen, C.-Y.; Chang, S.-C.; Liao, J.-F.; Chang, C.-H. Activation of Akt by Advanced Glycation End Products (AGEs): Involvement of IGF-1 Receptor and Caveolin-1. PLoS ONE 2013, 8, e58100. [Google Scholar] [CrossRef] [PubMed]
- Bao, J.-M.; He, M.-Y.; Liu, Y.-W.; Lu, Y.-J.; Hong, Y.-Q.; Luo, H.-H.; Ren, Z.-L.; Zhao, S.-C.; Jiang, Y. AGE/RAGE/Akt Pathway Contributes to Prostate Cancer Cell Proliferation by Promoting Rb Phosphorylation and Degradation. Am. J. Cancer Res. 2015, 5, 1741–1750. [Google Scholar] [CrossRef] [PubMed]
- Yue, Q.; Song, Y.; Liu, Z.; Zhang, L.; Yang, L.; Li, J. Receptor for Advanced Glycation End Products (RAGE): A Pivotal Hub in Immune Diseases. Molecules 2022, 27, 4922. [Google Scholar] [CrossRef] [PubMed]
- Rai, V.; Maldonado, A.Y.; Burz, D.S.; Reverdatto, S.; Yan, S.F.; Schmidt, A.M.; Shekhtman, A. Signal Transduction in Receptor for Advanced Glycation End Products (RAGE): Solution Structure of C-Terminal Rage (ctRAGE) and Its Binding to mDia1. J. Biol. Chem. 2012, 287, 5133–5144. [Google Scholar] [CrossRef] [PubMed]
- Dong, H.; Zhang, Y.; Huang, Y.; Deng, H. Pathophysiology of RAGE in Inflammatory Diseases. Front. Immunol. 2022, 13, 931473. [Google Scholar] [CrossRef] [PubMed]
- Palanissami, G.; Paul, S.F.D. RAGE and Its Ligands: Molecular Interplay Between Glycation, Inflammation, and Hallmarks of Cancer-a Review. Horm. Cancer 2018, 9, 295–325. [Google Scholar] [CrossRef] [PubMed]
- King, D.E.; Mainous, A.G., 3rd; Buchanan, T.A.; Pearson, W.S. C-Reactive Protein and Glycemic Control in Adults with Diabetes. Diabetes Care 2003, 26, 1535–1539. [Google Scholar] [CrossRef]
- Palella, E.; Cimino, R.; Pullano, S.A.; Fiorillo, A.S.; Gulletta, E.; Brunetti, A.; Foti, D.P.; Greco, M. Laboratory Parameters of Hemostasis, Adhesion Molecules, and Inflammation in Type 2 Diabetes Mellitus: Correlation with Glycemic Control. Int. J. Environ. Res. Public Health 2020, 17, 300. [Google Scholar] [CrossRef]
- Cé, G.V.; Rohde, L.E.; da Silva, A.M.V.; Puñales, M.K.; de Castro, A.C.; Bertoluci, M.C. Endothelial Dysfunction Is Related to Poor Glycemic Control in Adolescents with Type 1 Diabetes under 5 Years of Disease: Evidence of Metabolic Memory. J. Clin. Endocrinol. Metab. 2011, 96, 1493–1499. [Google Scholar] [CrossRef]
- Clyne, A.M. Endothelial Response to Glucose: Dysfunction, Metabolism, and Transport. Biochem. Soc. Trans. 2021, 49, 313–325. [Google Scholar] [CrossRef] [PubMed]
- Giardino, I.; Edelstein, D.; Brownlee, M. Nonenzymatic Glycosylation in Vitro and in Bovine Endothelial Cells Alters Basic Fibroblast Growth Factor Activity. A Model for Intracellular Glycosylation in Diabetes. J. Clin. Investig. 1994, 94, 110–117. [Google Scholar] [CrossRef] [PubMed]
- Figueroa, D.S.; Kemeny, S.F.; Clyne, A.M. Glycated Collagen Decreased Endothelial Cell Fibronectin Alignment in Response to Cyclic Stretch via Interruption of Actin Alignment. J. Biomech. Eng. 2014, 136, 101010. [Google Scholar] [CrossRef] [PubMed]
- Irshad, Z.; Xue, M.; Ashour, A.; Larkin, J.R.; Thornalley, P.J.; Rabbani, N. Activation of the Unfolded Protein Response in High Glucose Treated Endothelial Cells Is Mediated by Methylglyoxal. Sci. Rep. 2019, 9, 7889. [Google Scholar] [CrossRef]
- Kovesdy, C.P. Epidemiology of Chronic Kidney Disease: An Update 2022. Kidney Int. Suppl. 2022, 12, 7–11. [Google Scholar] [CrossRef] [PubMed]
- Taguchi, K.; Fukami, K. RAGE Signaling Regulates the Progression of Diabetic Complications. Front. Pharmacol. 2023, 14, 1128872. [Google Scholar] [CrossRef]
- Holik, A.-K.; Rohm, B.; Somoza, M.M.; Somoza, V. N(ε)-Carboxymethyllysine (CML), a Maillard Reaction Product, Stimulates Serotonin Release and Activates the Receptor for Advanced Glycation End Products (RAGE) in SH-SY5Y Cells. Food Funct. 2013, 4, 1111–1120. [Google Scholar] [CrossRef]
- Xue, J.; Ray, R.; Singer, D.; Böhme, D.; Burz, D.S.; Rai, V.; Hoffmann, R.; Shekhtman, A. The Receptor for Advanced Glycation End Products (RAGE) Specifically Recognizes Methylglyoxal-Derived AGEs. Biochemistry 2014, 53, 3327–3335. [Google Scholar] [CrossRef]
- Zong, H.; Madden, A.; Ward, M.; Mooney, M.H.; Elliott, C.T.; Stitt, A.W. Homodimerization Is Essential for the Receptor for Advanced Glycation End Products (RAGE)-Mediated Signal Transduction. J. Biol. Chem. 2010, 285, 23137–23146. [Google Scholar] [CrossRef]
- Shiojima, I.; Walsh, K. Role of Akt Signaling in Vascular Homeostasis and Angiogenesis. Circ. Res. 2002, 90, 1243–1250. [Google Scholar] [CrossRef]
- Gündüz, D.; Troidl, C.; Tanislav, C.; Rohrbach, S.; Hamm, C.; Aslam, M. Role of PI3K/Akt and MEK/ERK Signalling in cAMP/Epac-Mediated Endothelial Barrier Stabilisation. Front. Physiol. 2019, 10, 1387. [Google Scholar] [CrossRef] [PubMed]
- Zhang, Y.; Wang, S.-J.; Han, Z.-H.; Li, Y.-Q.; Xue, J.-H.; Gao, D.-F.; Wu, X.-S.; Wang, C.-X. PI3K/AKT Signaling Pathway Plays a Role in Enhancement of eNOS Activity by Recombinant Human Angiotensin Converting Enzyme 2 in Human Umbilical Vein Endothelial Cells. Int. J. Clin. Exp. Pathol. 2014, 7, 8112–8117. [Google Scholar] [PubMed]
- Liu, J.; Xu, P.; Liu, D.; Wang, R.; Cui, S.; Zhang, Q.; Li, Y.; Yang, W.; Zhang, D. TCM Regulates PI3K/Akt Signal Pathway to Intervene Atherosclerotic Cardiovascular Disease. Evid.-Based Complement. Altern. Med. ECAM 2021, 2021, 4854755. [Google Scholar] [CrossRef] [PubMed]
- Shafiq, M.; Lone, Z.R.; Bharati, P.; Singh, H.; Jagavelu, K.; Verma, N.K.; Ghosh, J.K.; Gaestel, M.; Hanif, K. Involvement of Mitogen-Activated Protein Kinase (MAPK)-Activated Protein Kinase 2 (MK2) in Endothelial Dysfunction Associated with Pulmonary Hypertension. Life Sci. 2021, 286, 120075. [Google Scholar] [CrossRef] [PubMed]
- Molinar-Inglis, O.; Wozniak, J.M.; Grimsey, N.J.; Orduña-Castillo, L.B.; Cheng, N.; Lin, Y.; Gonzalez Ramirez, M.L.; Birch, C.A.; Lapek, J.D.; Gonzalez, D.J.; et al. Phosphoproteomic Analysis of Thrombin- and P38 MAPK-Regulated Signaling Networks in Endothelial Cells. J. Biol. Chem. 2022, 298, 101801. [Google Scholar] [CrossRef] [PubMed]
- Wu, J.; Wang, Z.; Cai, M.; Wang, X.; Lo, B.; Li, Q.; He, J.C.; Lee, K.; Fu, J. GPR56 Promotes Diabetic Kidney Disease Through eNOS Regulation in Glomerular Endothelial Cells. Diabetes 2023, 72, 1652–1663. [Google Scholar] [CrossRef]
- Kierdorf, K.; Fritz, G. RAGE Regulation and Signaling in Inflammation and Beyond. J. Leukoc. Biol. 2013, 94, 55–68. [Google Scholar] [CrossRef]
- Afkarian, M.; Sachs, M.C.; Kestenbaum, B.; Hirsch, I.B.; Tuttle, K.R.; Himmelfarb, J.; de Boer, I.H. Kidney Disease and Increased Mortality Risk in Type 2 Diabetes. J. Am. Soc. Nephrol. JASN 2013, 24, 302–308. [Google Scholar] [CrossRef]
- Groop, P.-H.; Thomas, M.C.; Moran, J.L.; Wadèn, J.; Thorn, L.M.; Mäkinen, V.-P.; Rosengård-Bärlund, M.; Saraheimo, M.; Hietala, K.; Heikkilä, O.; et al. The Presence and Severity of Chronic Kidney Disease Predicts All-Cause Mortality in Type 1 Diabetes. Diabetes 2009, 58, 1651–1658. [Google Scholar] [CrossRef]
- Livingstone, S.J.; Levin, D.; Looker, H.C.; Lindsay, R.S.; Wild, S.H.; Joss, N.; Leese, G.; Leslie, P.; McCrimmon, R.J.; Metcalfe, W.; et al. Estimated Life Expectancy in a Scottish Cohort with Type 1 Diabetes, 2008–2010. JAMA 2015, 313, 37–44. [Google Scholar] [CrossRef]
- Livingstone, S.J.; Looker, H.C.; Hothersall, E.J.; Wild, S.H.; Lindsay, R.S.; Chalmers, J.; Cleland, S.; Leese, G.P.; McKnight, J.; Morris, A.D.; et al. Risk of Cardiovascular Disease and Total Mortality in Adults with Type 1 Diabetes: Scottish Registry Linkage Study. PLoS Med. 2012, 9, e1001321. [Google Scholar] [CrossRef] [PubMed]
- Orchard, T.J.; Costacou, T.; Kretowski, A.; Nesto, R.W. Type 1 Diabetes and Coronary Artery Disease. Diabetes Care 2006, 29, 2528–2538. [Google Scholar] [CrossRef] [PubMed]
- Orchard, T.J.; Secrest, A.M.; Miller, R.G.; Costacou, T. In the Absence of Renal Disease, 20 Year Mortality Risk in Type 1 Diabetes Is Comparable to That of the General Population: A Report from the Pittsburgh Epidemiology of Diabetes Complications Study. Diabetologia 2010, 53, 2312–2319. [Google Scholar] [CrossRef] [PubMed]
- Piscitelli, P.; Viazzi, F.; Fioretto, P.; Giorda, C.; Ceriello, A.; Genovese, S.; Russo, G.; Guida, P.; Pontremoli, R.; De Cosmo, S. Predictors of Chronic Kidney Disease in Type 1 Diabetes: A Longitudinal Study from the AMD Annals Initiative. Sci. Rep. 2017, 7, 3313. [Google Scholar] [CrossRef] [PubMed]
- Soedamah-Muthu, S.S.; Fuller, J.H.; Mulnier, H.E.; Raleigh, V.S.; Lawrenson, R.A.; Colhoun, H.M. All-Cause Mortality Rates in Patients with Type 1 Diabetes Mellitus Compared with a Non-Diabetic Population from the UK General Practice Research Database, 1992–1999. Diabetologia 2006, 49, 660–666. [Google Scholar] [CrossRef]
- Spanos, C.; Maldonado, E.M.; Fisher, C.P.; Leenutaphong, P.; Oviedo-Orta, E.; Windridge, D.; Salguero, F.J.; Bermúdez-Fajardo, A.; Weeks, M.E.; Evans, C.; et al. Proteomic Identification and Characterization of Hepatic Glyoxalase 1 Dysregulation in Non-Alcoholic Fatty Liver Disease. Proteome Sci. 2018, 16, 4. [Google Scholar] [CrossRef]
- Xue, J.; Rai, V.; Singer, D.; Chabierski, S.; Xie, J.; Reverdatto, S.; Burz, D.S.; Schmidt, A.M.; Hoffmann, R.; Shekhtman, A. Advanced Glycation End Product Recognition by the Receptor for AGEs. Structure 2011, 19, 722–732. [Google Scholar] [CrossRef]


Disclaimer/Publisher’s Note: The statements, opinions and data contained in all publications are solely those of the individual author(s) and contributor(s) and not of MDPI and/or the editor(s). MDPI and/or the editor(s) disclaim responsibility for any injury to people or property resulting from any ideas, methods, instructions or products referred to in the content. |
© 2024 by the authors. Licensee MDPI, Basel, Switzerland. This article is an open access article distributed under the terms and conditions of the Creative Commons Attribution (CC BY) license (https://creativecommons.org/licenses/by/4.0/).
Share and Cite
Lai, S.W.T.; Bhattacharya, S.; Lopez Gonzalez, E.D.J.; Shuck, S.C. Methylglyoxal-Derived Nucleoside Adducts Drive Vascular Dysfunction in a RAGE-Dependent Manner. Antioxidants 2024, 13, 85. https://doi.org/10.3390/antiox13010085
Lai SWT, Bhattacharya S, Lopez Gonzalez EDJ, Shuck SC. Methylglyoxal-Derived Nucleoside Adducts Drive Vascular Dysfunction in a RAGE-Dependent Manner. Antioxidants. 2024; 13(1):85. https://doi.org/10.3390/antiox13010085
Chicago/Turabian StyleLai, Seigmund Wai Tsuen, Supriyo Bhattacharya, Edwin De Jesus Lopez Gonzalez, and Sarah C. Shuck. 2024. "Methylglyoxal-Derived Nucleoside Adducts Drive Vascular Dysfunction in a RAGE-Dependent Manner" Antioxidants 13, no. 1: 85. https://doi.org/10.3390/antiox13010085
APA StyleLai, S. W. T., Bhattacharya, S., Lopez Gonzalez, E. D. J., & Shuck, S. C. (2024). Methylglyoxal-Derived Nucleoside Adducts Drive Vascular Dysfunction in a RAGE-Dependent Manner. Antioxidants, 13(1), 85. https://doi.org/10.3390/antiox13010085