Abstract
Almonds are a rich source of beneficial compounds for human health. In this work, we assessed the influence of almond cultivars and harvest time on their morphological (length, width and thickness) and nutritional (ash, moisture, proteins) profiles. We also evaluated the impact of an in vitro digestion and fermentation process on almonds’ antioxidant and phenolic content, as well as their support of gut microbiota community and functionality, including the production of short-chain fatty acids (SCFAs), lactic and succinic acids. The length, width, and thickness of almonds varied significantly among cultivars, with the latter two parameters also exhibiting significant changes over time. Moisture content decreased with maturity, while protein and ash increased significantly. Total antioxidant capacity released by almonds after digestion and fermentation had different trends depending on the antioxidant capacity method used. The fermentation step contributed more to the antioxidant capacity than the digestion step. Both cultivar and harvest time exerted a significant influence on the concentration of certain phenolic compounds, although the total content remained unaffected. Similarly, fecal microbiota modulation depended on the cultivar and maturity stage, with the Guara cultivar and late maturity showing the largest effects. Cultivar type also exerted a significant impact on the concentration of SCFAs, with the Guara cultivar displaying the highest total SCFAs concentration. Thus, we conclude that cultivar and harvest time are key factors in shaping the morphological and nutritional composition of almonds. In addition, taking into account all the results obtained, the Guara variety has the best nutritional profile.
1. Introduction
Almonds (Prunus dulcis (Mill.) D.A. Webb) are one of the most consumed nuts worldwide. These nuts are part of the Mediterranean diet and are eaten raw, blanched, roasted, fried, and caramelized; processed to flour; used in non-dairy beverages; or used as an ingredient for use in foods. In addition to their high gastronomic value, almonds stand out for their high nutritional profile. They represent an important source of lipids, mainly monounsaturated and polyunsaturated fatty acids, proteins, dietary fiber, and micronutrients such as vitamin E, potassium, phosphorus, calcium, and magnesium [1]. Almonds are also known to be a major source of phenolic compounds. These are responsible for the flavor and aroma of the almonds, as well as for their antioxidant, antiviral, and antibacterial properties [2,3].
The amount and type of nutrients present in almonds are influenced by different factors, including the cultivar, time of harvest, and the specific agroclimatic conditions in which they are grown [4]. Cultivar and harvest time are two of the main factors determining the morphological and nutritional profile of almonds. Numerous studies have confirmed the influence of these factors on morphological measurements (width, length, and thickness of the almond), as well as on the moisture, carbohydrate, lipid, protein, ash, antioxidant, mineral, phenolic, and tocopherol contents of almonds [5,6,7,8,9,10]. However, the results of these studies are partially contradictory, especially regarding the effect of harvest time, since there is no consistent trend on how the chemical profile of the almond evolves with time. These discrepancies could be related to the differences in those cultivars and harvest times considered, as well as due to other, yet unstudied, factors.
An additional key element in understanding how almond compounds impact human health is their bioaccessibility, which can be defined as the amount of a nutrient that is released from the food matrix in the gastrointestinal tract, and which becomes accessible for absorption. The bioaccessibility of nutrients is determined by multiple factors, including human digestion and fermentation by the gut microbiota [11]. In this context, dietary fiber and phenolic compounds are interesting to study because they are poorly digested in the upper gastrointestinal tract and enter the large intestine, where they are transformed by the gut microbiota into simpler metabolites with enhanced absorption and bioactivity [12]. The most common metabolites of dietary fiber, short-chain fatty acids (SCFAs), such as acetic, propionic and butyric acids, along with the metabolites of phenolic compounds have demonstrated multiple benefits in human health [13,14]. In addition to SCFAs, the gut microbiota produces other metabolites in the course of fermentation: lactic and succinic acids. These compounds have a significant impact on human health, as they are shared metabolites in human and microbial metabolic pathways and participate in microbiota–host cross-talk [15]. Other relevant actions of the gut microbiota include the release of antioxidant molecules from the food matrix and the production of antioxidant metabolites, leading to an increase in the antioxidant capacity of foods [16].
There is, however, insufficient information available on how human digestion and fermentation by the gut microbiota influence the antioxidant capacity of almonds and the bioaccessibility of their nutrients. A few studies have attempted to understand the effects of in vivo human digestion and fermentation by the gut microbiota on almonds, with a focus on analyzing gut microbiota-derived metabolites generated after the ingestion of almonds, such as the metabolites of phenolic compounds in urine and plasma [17,18,19] and the SCFAs in feces [20,21]. On the other hand, a group of studies focused on understanding the effects of in vitro digestion and fermentation and quantified SCFAs [22,23,24], phenolic compounds, and antioxidant capacity [24] generated after the process. Nevertheless, none of these studies took into account factors such as cultivar and harvest time, which could introduce potential variability in the results.
Thus, the aim of this work is to study the influence of harvest time and cultivar on morphological measurements (width, length and thickness of the almond) as well as the nutritional composition of almonds (ash, moisture and protein content) and evaluate the impact of an in vitro digestion and fermentation process in the antioxidant, phenolic, SCFAs, lactic and succinic acids profiles of almonds.
2. Materials and Methods
2.1. Chemicals
Firstly, (±)-6-Hydroxy-2,5,7,8-tetramethylchromane-2-carboxylic acid (Trolox), 2,2′-Azino-bis(3-ethylbenzothiazoline-6-sulfonic acid) diammonium salt (ABTS), 2,4,6-Tri(2-pyridyl)-s-triazine (TPTZ), 2,2 Diphenyl-1-1-picrythydrazul hydrate 95% (DPPH), potassium persulphate, 3,5-dicaffeoylquinic acid, caffeic acid, dimethyl caffeic, chlorogenic acid, ferulic acid, p-coumaric acid, gallic acid, tyrosol, m-hydroxyphenylacetic acid, Folin–Ciocalteu reagent, sodium hydroxide, methanol, hydrogen peroxide, hydrochloric acid, sulfuric acid, formic acid, succinic acid, propionic acid, acetic acid, isobutyric acid, lactic acid, (+)-catechin, 3-(3-hydroxyphenyl)propionic acid, 3,4-dihydroxyphenylacetic acid, 3-(3,4-dihydroxyphenyl)propionic acid, (-)-epicatechin, kaempferol, phenol, quercetin, p-coumaric acid, naringenin, phloroglucinol, ferulic acid, urolithin A, urolithin B, iron (III) chloride hexahydrate, sodium acetate, potassium chloride, potassium di-hydrogen phosphate, sodium mono-hydrogen carbonate, sodium chloride, magnesium chloride hexahydrate, ammonium carbonate, calcium chloride dihydrate, sodium di-hydrogen phosphate, tryptone, cysteine, sodium sulfide, resazurin, salivary α-amylase, pepsin, bile acids (porcine bile extract), ethanol and Milli-Q® water were from Sigma-Aldrich. Pancreatin from porcine pancreas were purchased from Alpha Aesar. Diethyl ether and acetonitrile were from Honeywell. N-butyric acid was from Acros Organics, and 5-(3′, 4′-dihydroxyphenyl)-γ-valerolactone was purchased from TRC Canada. Moreover, (-)-Epigallocatechin and naringin were from Extrasynthese. Rutin was from PhytoLab. KjTabsTM VCM tablets, KjTabsTM VS Antifoam tablets, and boric acid solution (4% solution + indicator) were from Thermo Fisher Scientific (Waltham, MA, USA).
2.2. Samples
Almonds were cultivated in a private plot in Dúrcal (Granada, Spain, 36.962126, −3.560991). They belonged to the Spanish cultivars Guara (G), Vairo (V), Marta (MT), Marinada (MD), and Marcona (MC) and were harvested at three different times: time 1 (T1), time 2 (T2) and time 3 (T3). T1 and T2 for the five cultivars corresponded to 2/8/2023 and 24/8/2023, respectively, while T3 for Guara, Vairo and Marta cultivars corresponded to 26/9/2023 and T3 for Marinada and Marcona cultivars corresponded to 2/10/2023. After harvesting, the hulls and shells were removed, and almond kernels were stored at −80 °C until analysis.
2.3. Morphological Measurements
For each cultivar and harvest time, 10 almonds were randomly selected to measure kernel length, width and thickness by a caliper. Results were expressed in centimeters.
2.4. Determination of Ash, Moisture and Protein Content
Ash, moisture and protein content were determined in duplicate for each cultivar and harvest time by AOAC 923.03, 925.09 and 950.48 methods, respectively. Almond samples were grounded and homogenized, and 5 g of the mixture was used for each ash and moisture determination, while 0.5 g was employed for determining protein content. The results were expressed in percentages of ash, moisture, and protein content.
2.5. In Vitro Digestion and Fermentation
The samples were prepared by grinding each almond cultivar collected at each harvest time. Then, 100 mg of the resulting mixture was weighed. The samples were subjected to a previously described in vitro digestion and fermentation process [25] in order to simulate the human digestion–fermentation process without performing a nutritional intervention.
Briefly, the in vitro digestion consisted of an oral phase (2 min at 37 °C with 75 U/mL α-amylase), a gastric phase (2 h at 37 °C with 2000 U/mL pepsin at pH 3), and an intestinal phase (2 h at 37 °C with 13.37 mg/mL pancreatin and 10 mM bile acids at pH 7). The enzymatic reactions were stopped by immersing the tubes in ice. Once the three phases were finished, the samples were centrifuged at 6000 rpm for 10 min at 4 °C. The supernatant obtained represented the soluble and potentially absorbable fraction in the small intestine. Then, 10% of the supernatant was added to the solid residue, after which both mixed fractions were lyophilized and frozen at −80 °C. The remaining supernatant was also stored at −80 °C.
In vitro fermentation was performed with fresh feces from three healthy donors (people who had not taken antibiotics three months before the stool collection and with a body mass index within the 20–25 range). Stools were pooled to reduce inter-individual variability [26]. The sample submitted to fermentation was the combination of the solid residue obtained after in vitro digestion (100 mg) plus 10% of the digestion supernatant. Two control fermentations were run containing only fecal inoculum and buffer but no digested almonds (designated BL). In vitro fermentation took place at 37 °C for 24 h in an oxygen-depleted atmosphere. Upon completion, the samples were immersed in ice to stop microbial activity and centrifuged at 6000 rpm for 10 min. The supernatant, which represented the potentially absorbable fraction in the large intestine, as well as the pellet, were stored at −80 °C.
2.6. Antioxidant Assays
The antioxidant capacity was evaluated in the two fractions obtained after the in vitro digestion and fermentation of almonds: the supernatants obtained after digestion and fermentation. The assays were performed in duplicate for each sample. The sum of the two fractions accounts for the total antioxidant capacity that almonds can exert within the human body.
2.6.1. Trolox Equivalent Antioxidant Capacity against ABTS Radicals (TEACABTS) Assay
TEACABTS was tested following a previously described method [27]. Briefly, ABTS was prepared by mixing ABTS stock solution (7 mM) with 2.45 mM potassium persulphate and storing the mixture in the dark for 12 h, after which it was diluted with a 50:50 ethanol:water solution. Then, 280 µL of diluted ABTS and 20 µL of sample or Trolox standard were added to a transparent 96-well polystyrene microplate (Biogen Científica, Madrid, Spain) and absorbance readings at 730 nm were monitored for 20 min on a Cytation 5 microplate reader (Agilent Technologies, Santa Clara, CA, USA) at 37 °C. Calibration was performed with a Trolox stock solution ranging from 0.01 to 1.00 mg/mL. Results were expressed as mmol Trolox equivalents per kg of sample.
2.6.2. Trolox Equivalent Antioxidant Capacity Referred to Reducing Capacity (TEACFRAP) Assay
TEACFRAP was conducted following a previously described procedure [28]. The FRAP reagent was composed of 2.5 mL of 10 mM TPTZ solution, 2.5 mL of 20 mM FeCl3·6H2O and 25 mL of 0.3 M acetate buffer at pH 3.6. Moreover, 280 μL of FRAP reagent and 20 μL sample or Trolox standard were mixed in a 96-well microplate (Biogen Científica) and absorbance readings at 595 nm were monitored for 30 min with a Cytation 5 microplate reader (Agilent Technologies) at 37 °C. Calibration was performed with a Trolox stock solution ranging from 0.01 to 1.00 mg/mL. Results were expressed as mmol Trolox equivalents per kg of sample.
2.6.3. Trolox Equivalent Antioxidant Capacity against DPPH Radicals (TEACDPPH) Assay
TEACDPPH was performed as in [29]. Then, 20 μL of the sample was mixed with 280 μL DPPH reagent (74 mg DPPH/L methanol) in a transparent 96-well polystyrene microplate (Biogen Científica) plate. Absorbance readings at 517 nm were monitored for 60 min using a Cytation 5 microplate reader (Agilent Technologies) at 37 °C. Calibration was performed with a Trolox stock solution ranging from 0.01 to 1.00 mg/mL. Results were expressed as mmol Trolox equivalents per kg of sample.
2.6.4. Folin–Ciocalteu Assay
For performing the Folin–Ciocalteu assay, the procedure described by [30] was adapted to a microplate reader. Furthermore, 30 μL of the sample was mixed in a well with 15 μL of Folin–Ciocalteu reagent and 255 μL of 2.35% sodium carbonate. Absorbance readings were monitored at 725 nm for 60 min at 37 °C in a Cytation 5 microplate reader (Agilent Technologies). Calibration was performed with a gallic acid stock solution ranging from 0.01 to 1.00 mg/mL. Results were expressed as mg of gallic acid equivalents/kg sample.
2.7. Ultra-High Performance Liquid Chromatography (UHPLC) Analysis
Chromatographic analyses were performed using a UHPLC Agilent Infinity II LC System equipped with a Diode Array Detector and a Refractive Index Detector.
2.7.1. Analysis of Phenolic Compounds
Phenolic compounds were extracted from the fermentation supernatant with diethyl ether [31]. The extraction procedure was carried out in duplicate for each sample. The fermentation supernatant samples were centrifuged at 13,000 rpm for 2 min, after which 800 µL of the supernatant was taken. Subsequently, 1 mL of diethyl ether was added to the 800 μL of supernatant and stored at 4 °C in the dark for 24 h. After that time, the organic phase corresponding to the diethyl ether with the extracted phenolic compounds was collected in a new tube, and two new extractions were carried out with 1 mL of diethyl ether at room temperature. Subsequently, a rotary evaporator at 30 °C was used to evaporate the diethyl ether, and the dry residue was redissolved in 1 mL of Milli-Q water/methanol 1:1 (v/v). Finally, the extracts were filtered with a 0.22 µm filter and collected in vials.
For the UHPLC analysis, the column used was an Agilent Poroshell 120 SB-Aq (4.6 × 100 mm, 2.7 µm). The mobile phase consisted of Solvent A (Milli-Q water/formic acid, 99.9:0.1) and Solvent B (acetonitrile/formic acid, 99.9:0.1). The method used was a gradient elution: 0–28 min (20% Solvent A, 80% Solvent B), 28–32 min (60% Solvent A, 40% Solvent B), 32–33 min (95% Solvent A, 5% Solvent B), 33–35 min (20% Solvent A, 80% Solvent B), 35–38 min (95% Solvent A, 5% Solvent B). The flow rate was maintained at 0.2 mL/min. The injection volume was 5 µL. The column temperature was set at 30 °C. The wavelength selected to measure the absorbance of the samples was 255 nm. The chromatographic analysis was performed in duplicate for each sample.
Quantification was carried out using calibration with the following external standards: (+)-catechin, (-)-epicatechin, (-)-epigallocatechin, rutin, 3,4-dihydroxyphenylacetic acid, 3-(3,4-dihydroxyphenyl)propionic acid, 3-(3-hydroxyphenyl)propionic acid, 5-(3′,4′-dihydroxyphenyl)-γ-valerolactone, phenol, phloroglucinol, ferulic acid, p-coumaric acid, naringenin, naringin, urolithin A, urolithin B, quercetin and kaempferol. Results were expressed in mg phenolic compound/kg of digestion residue.
2.7.2. Analysis of SCFAs, Lactic and Succinic Acids
The preparation of the sample for the chromatographic analysis was performed by centrifuging the fermentation supernatant samples at 13,300 rpm for 5 min, filtering them through a 0.22 μm filter and performing a 1:10 dilution with 1 M hydrochloric acid [32]. The column used was an Agilent Poroshell 120 SB-Aq (3 × 150 mm, 2.7 μm). The mobile phase was 5 mM sulfuric acid with isocratic elution at a flow rate of 0.5 mL/min. The injection volume was 5 µL. The column and RID temperature were set at 35 °C. The chromatographic analysis was performed in duplicate for each sample.
Quantification was carried out using calibration with the following external standards: lactic, acetic, succinic, propionic, N-butyric and isobutyric acids. N-butyric and isobutyric acids were quantified together. Total SCFAs were calculated as the sum of acetic, propionic and butyric acid. Results were expressed in mmol of each acid per L of the fermentation supernatant.
2.8. Microbial Genomic DNA Isolation and High Throughput Sequencing
Prokaryotic genomic DNA was isolated from the pellet obtained after sample fermentation using a ZR bacterial/fungal DNA kit (Zymo Research, Irvine, CA, USA) following the manufacturer’s instructions. The V4 hypervariable region of the 16S rRNA gene was amplified using primers complementary to the flanking conserved sequences (forward primer complementary sequence GCCAGCMGCCGCGG and reverse primer complementary sequence GGACTACHVGGGTWTCTAAT). The forward primer incorporated a 6–7 nucleotide barcode to allow for sample multiplexing on the sequencer. In PCR amplifications, 25 ng of the starting gDNA material was first subjected to four cycles of linear elongation with the forward primer only in order to reduce sample-to-sample PCR bias [33], followed by twenty-five cycles of traditional exponential PCR. Amplicon sequencing was carried out on the Ion Torrent Personal Genome Machine (Thermo Fisher, USA) using a 318 Chip v2. After quality filtering, we obtained 32,485 reads per sample on average. All sequence reads were processed in QIIME [34] following our standard pipeline [35] to obtain the 16S rRNA gene-copy, number-adjusted, rarefied taxon counts. This final dataset was used for all further analyses.
2.9. Statistical Analyses
The statistical significance of the data was tested by the non-parametric Kruskal–Wallis analysis of variance test, followed by the pair-wise Games–Howell post-hoc tests to compare the samples that showed significant variation (p < 0.05). The harvest time and cultivar of the almonds were used as factors in the Kruskal–Wallis tests. All statistical analyses were performed using SPSS.
Multivariate statistical analyses were performed on the genus-level microbial abundance dataset generally following the approaches we described previously [36]. These included unconstrained principal coordinates analysis (PCoA) utilizing phylogenetic weighted UniFrac distance as a measure of sample dissimilarity and constrained canonical correspondence analysis (CCA). Logistic regression (LR) with Lasso regularization (threshold C = 0.2) was chosen to generate sample classification models, as was the case previously [37]. Lasso regularization allowed us to limit the number of discriminatory variables defining each sample type. Model performance was assessed by a 20-fold cross-validation algorithm. Statistical tests (one-way analysis of variance (ANOVA) unless otherwise stated) were carried out in SPSS.
3. Results and Discussion
3.1. Influence of Cultivar and Harvest Time on Ash, Moisture, Protein, and Morphology of Almonds
The harvest time of almonds had a significant impact on their width and thickness, while their length remained unaffected (Supplementary Materials, Table S1). Almond thickness tended to decrease significantly over time, while almond width initially increased and then returned to its original level. This general decrease can be attributed to a loss of moisture over time. However, the evolution of morphological measurements over time did not follow the same trend for all cultivars (Table 1). In fact, when comparing the morphological measurements between the five cultivars, significant differences were observed in all three morphological measurements (Supplementary Materials, Table S2). These results reinforce the idea that cultivar plays a major role in almond morphology.

Table 1.
Morphological measurements, ash, moisture and protein profile of five almond cultivars collected at three harvest times and submitted to in vitro digestion-fermentation.
A study conducted on 24 traditional almond cultivars in the central–western Iberian Peninsula revealed differences in the width, thickness, and length of these cultivars [38]. Another study involving 10 cultivars of diverse origins reported variations in the morphological measurements among them and highlighted distinct trends in almond length and width over time for each one [10]. In the same study, over the course of the two harvest times considered, almond length increased in five cultivars while decreasing in the other five. However, almond width increased in seven cultivars while decreasing in three. Additionally, the thickness decreased over time for the 10 cultivars under examination [10]. Thus, genotype has a strong influence on almond morphological characteristics.
In terms of the chemical composition, studied cultivars did not elicit a significant impact on the moisture, protein or ash content (Supplementary Materials, Table S3). Nevertheless, the cultivars with the highest levels of protein and ash were Vairo and Guara, respectively, while the lowest moisture was found in the Vairo cultivar.
For all cultivars, moisture content decreased significantly over time (Table 1), consistent with the previous reports [10,39,40,41,42,43]. A higher moisture level shortens the final product shelf life. We observed a significant increase in protein and ash content over time (Supplementary Materials, Table S4). There were significant differences between the first and the third harvest times: the ash content tripled, and the protein content doubled probably due to the decrease in water content. Regarding ash content, all five cultivars followed a consistent trend of increasing their content at each harvest time. However, in terms of protein content, all cultivars increased from T1 to T3, with Vairo and Marta cultivars experiencing a slight decrease from T1 to T2. These trends suggest that almonds accumulate protein and minerals over time, resulting in an increase in their nutritional value. The increase in the protein [10,43,44] and ash [10] content has been reported in the literature. However, although ash content serves as an indicator of mineral content, the trend in mineral levels can vary depending on the specific mineral being analyzed [6] and the almond cultivar [7,8,45].
In summary, these results indicate that the optimal time to harvest almonds is during the third period, as it leads to increased nutritional value and reduced moisture content (Supplementary Materials, Table S4), which in turn extends shelf life.
3.2. Antioxidant Capacity of the Samples Obtained after In Vitro Digestion and Fermentation
3.2.1. Evolution of the Total Antioxidant Capacity over Harvest Time
Total antioxidant capacity was calculated by adding antioxidant capacity released during in vitro digestion and in vitro fermentation. The evolution of total antioxidant capacity over harvest time differed among the assays (Figure 1).
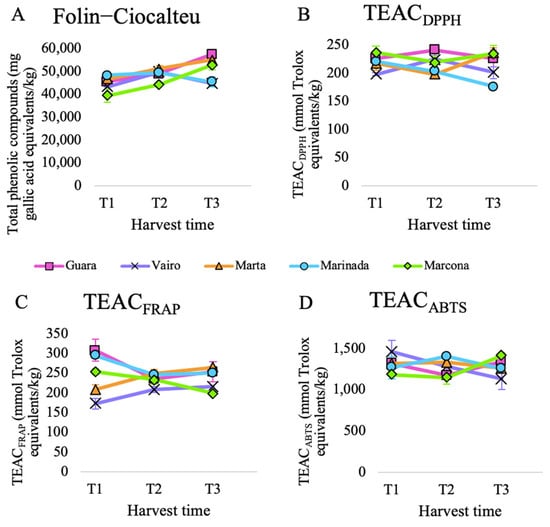
Figure 1.
Total antioxidant capacity of five almond cultivars collected at three harvest times and submitted to in vitro digestion-fermentation measured by (A) Folin–Ciocalteu, (B) TEACDPPH, (C) TEACFRAP and (D) TEACABTS assays.
The total phenolic content, measured via the Folin–Ciocalteu assay, exhibited significant differences over time, increasing at each time point, except for the Marinada cultivar (Supplementary Materials, Table S5) (Figure 1A). This general increase can be attributed to the accumulation of phenolic compounds during almond development. A study that analyzed the total phenolic content of almonds harvested at two different times also reported an increase for six out of the ten evaluated cultivars [10].
When analyzing the evolution of TEACABTS, TEACFRAP, and TEACDPPH over time, no significant differences were observed (see Supplementary Materials, Table S5). The general trend for TEACDPPH was a decrease over time, observed in all cultivars from T1 to T3 except for Marta (Figure 1B). This contrasts with a study that reported an increase in TEACDPPH over time for 9 out of the 10 cultivars [10].
On the other hand, the general tendency for TEACFRAP and TEACABTS was an initial decrease followed by a slight increase (Supplementary Materials, Table S5). This phenomenon could be attributed to the fact that TEACFRAP and TEACABTS tend to yield comparable results because the same compounds are reactive in the FRAP and ABTS assays. However, there was no common pattern in the evolution of TEACFRAP and TEACABTS when considering different cultivars. While cultivars Marta and Vairo tended to increase their TEACFRAP from T1 to T3, Guara, Marinada, and Marcona did the opposite (Figure 1C). Regarding TEACABTS, Marinada, Marta and Vairo tended to suffer a decrease in antioxidant capacity from T1 to T3, while Guara and Marcona showed an increase (Figure 1D).
When we compared cultivars against each other, we observed significant differences among cultivars for TEACFRAP and TEACDPPH (see Supplementary Materials, Table S6). For FRAP and DPPH assays, Guara was the cultivar that exhibited the highest total antioxidant capacity. For ABTS, it was Marinada, and for Folin–Ciocalteu, it was Marta. Different studies from different regions in the world have analyzed the influence of the cultivar on the antioxidant capacity of almonds [46,47,48]. However, not many studies have focused on Spanish cultivars. In one study [10], which included the Spanish cultivar Marcona, featured in this experiment, DPPH and Folin–Ciocalteu assays showed a wide variability among the 10 almond cultivars studied, highlighting the substantial influence of almond genotype on the antioxidant capacity of almonds. In this study, Marcona was one of the cultivars that exhibited lower values in both assays, as was the case in our study for Folin–Ciocalteu but not for TEACDPPH. In another study that analyzed almond skin extracts [49], Guara reported a higher TEACFRAP and total phenolic content than Marcona, while Marcona had higher TEACDPPH values than Guara [50]. Nevertheless, Marcona almond oil was reported to have higher TEACDPPH than Guara almond oil.
Altogether, these results highlight the notorious impact of the cultivar as well as the antioxidant assay used to measure the evolution of the total antioxidant capacity over time.
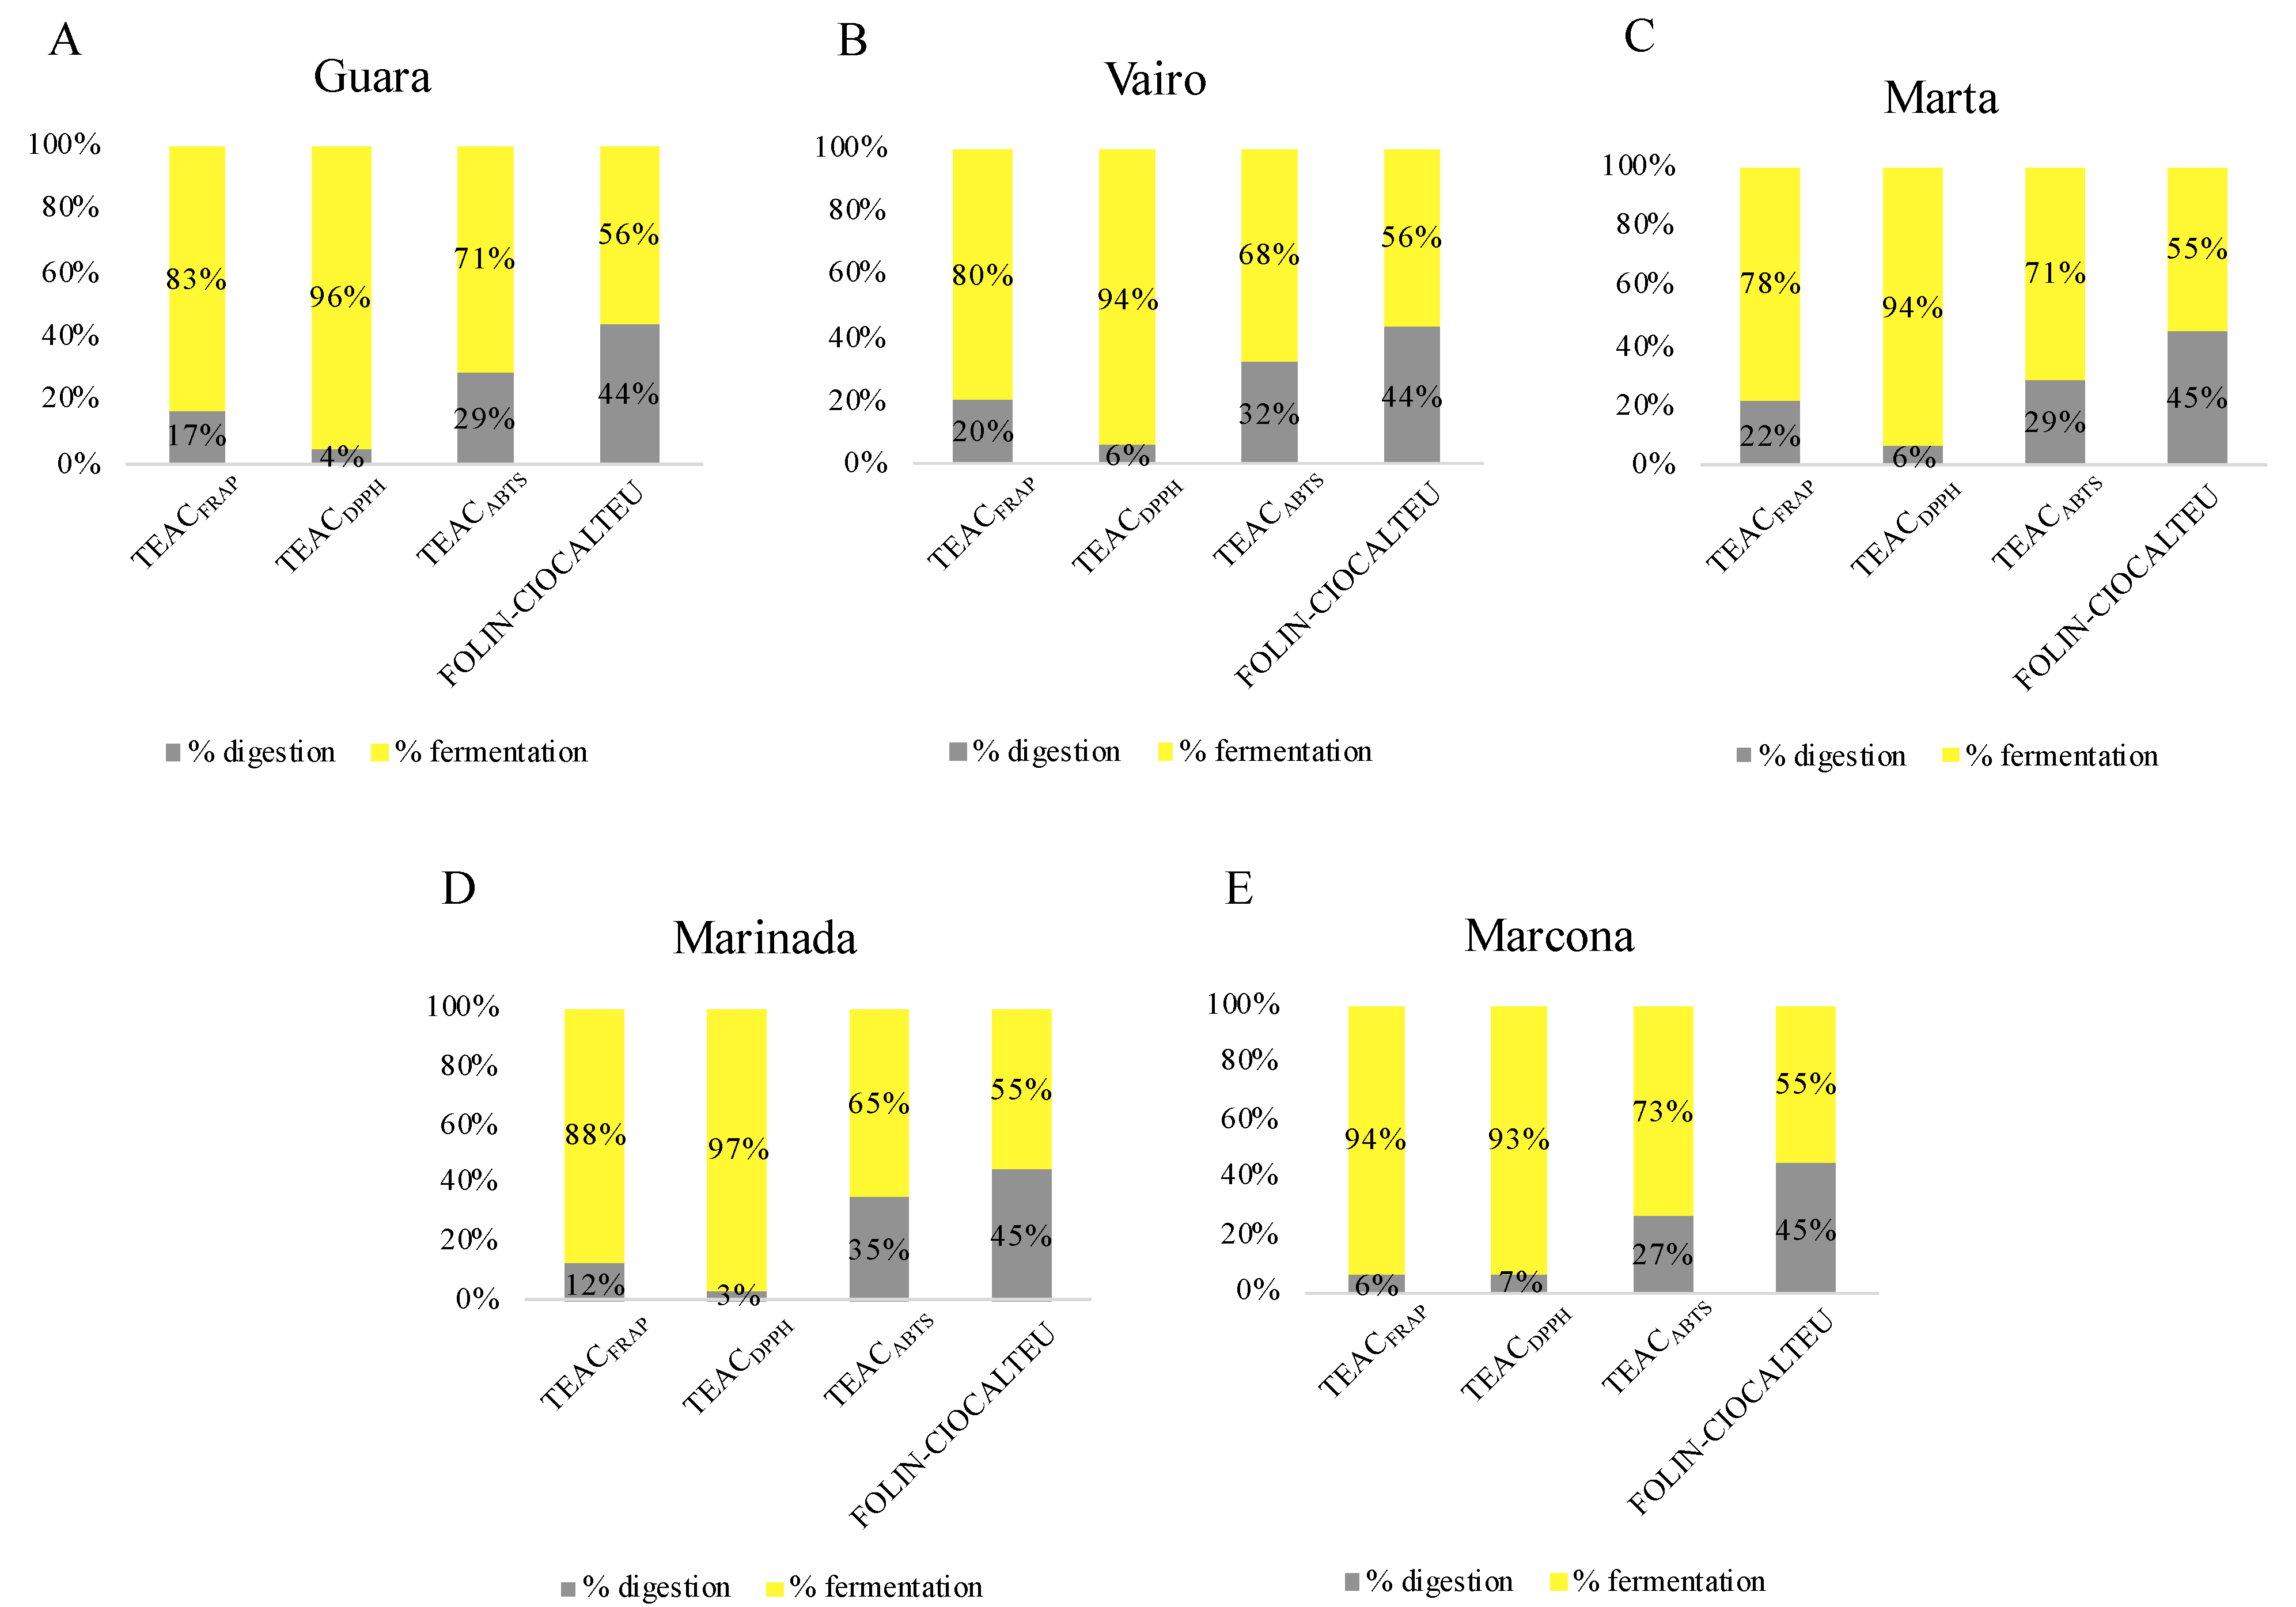
3.2.2. Contribution of In Vitro Digestion-Fermentation Fractions to Total Antioxidant Capacity
The contribution of each fraction to the total antioxidant capacity is shown as a percentage in Figure 2. Data from almonds harvested at T3 were used for this purpose since it is considered the ideal maturity for consumption, as stated above. Fermentation released higher antioxidant capacity than in vitro digestion in all four assays used (Figure 2). This contribution was most notable in the DPPH assay, followed by the FRAP, ABTS and Folin–Ciocalteu assays. This pattern has also been seen in other studies. According to Li et al. [24], the fermentation fraction exhibited higher TEACDPPH, TEACFRAP and total phenolic content measured by Folin–Ciocalteu than oral, gastric, and intestinal digestion fractions. That study also found that, in general, colonic fermentation provided the highest bioaccessibility for most phenolic compounds, thereby contributing to the antioxidant capacity. In another investigation of almond bagasse [51], fermentation contributed more to TEACDPPH and total phenolic content measured by Folin–Ciocalteu than gastric and intestinal digestions. In another study on nuts, the fermented fraction contributed more to TEACDPPH, TEACFRAP and total phenolic content measured by the Folin–Ciocalteu assay in comparison with the digested fraction. This may be attributed to the gut microbiota releasing antioxidant compounds from the food matrix or generating antioxidant metabolites from compounds that have undergone incomplete digestion and absorption in the upper gastrointestinal tract. Almonds are a rich source of dietary fiber [23], which decreases the bioaccessibility of some nutrients during digestion and allows them to reach the large intestine [52]. There, the gut microbiota increases the bioaccessibility of these compounds as well as releases metabolites that contribute to the antioxidant capacity of the almond.
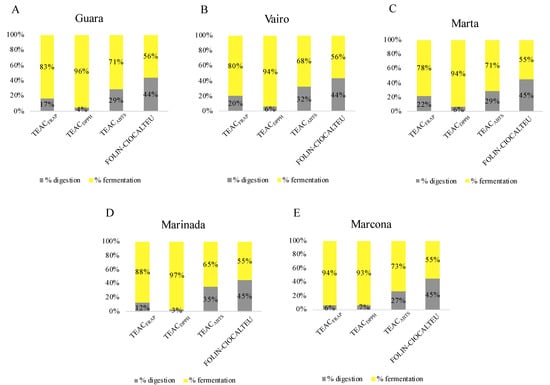
Figure 2.
Contribution of the in vitro digestion and fermentation fractions to the total antioxidant capacity of (A) Guara (B) Vairo (C) Marta (D) Marinada (E) Marcona almonds harvested at T3.
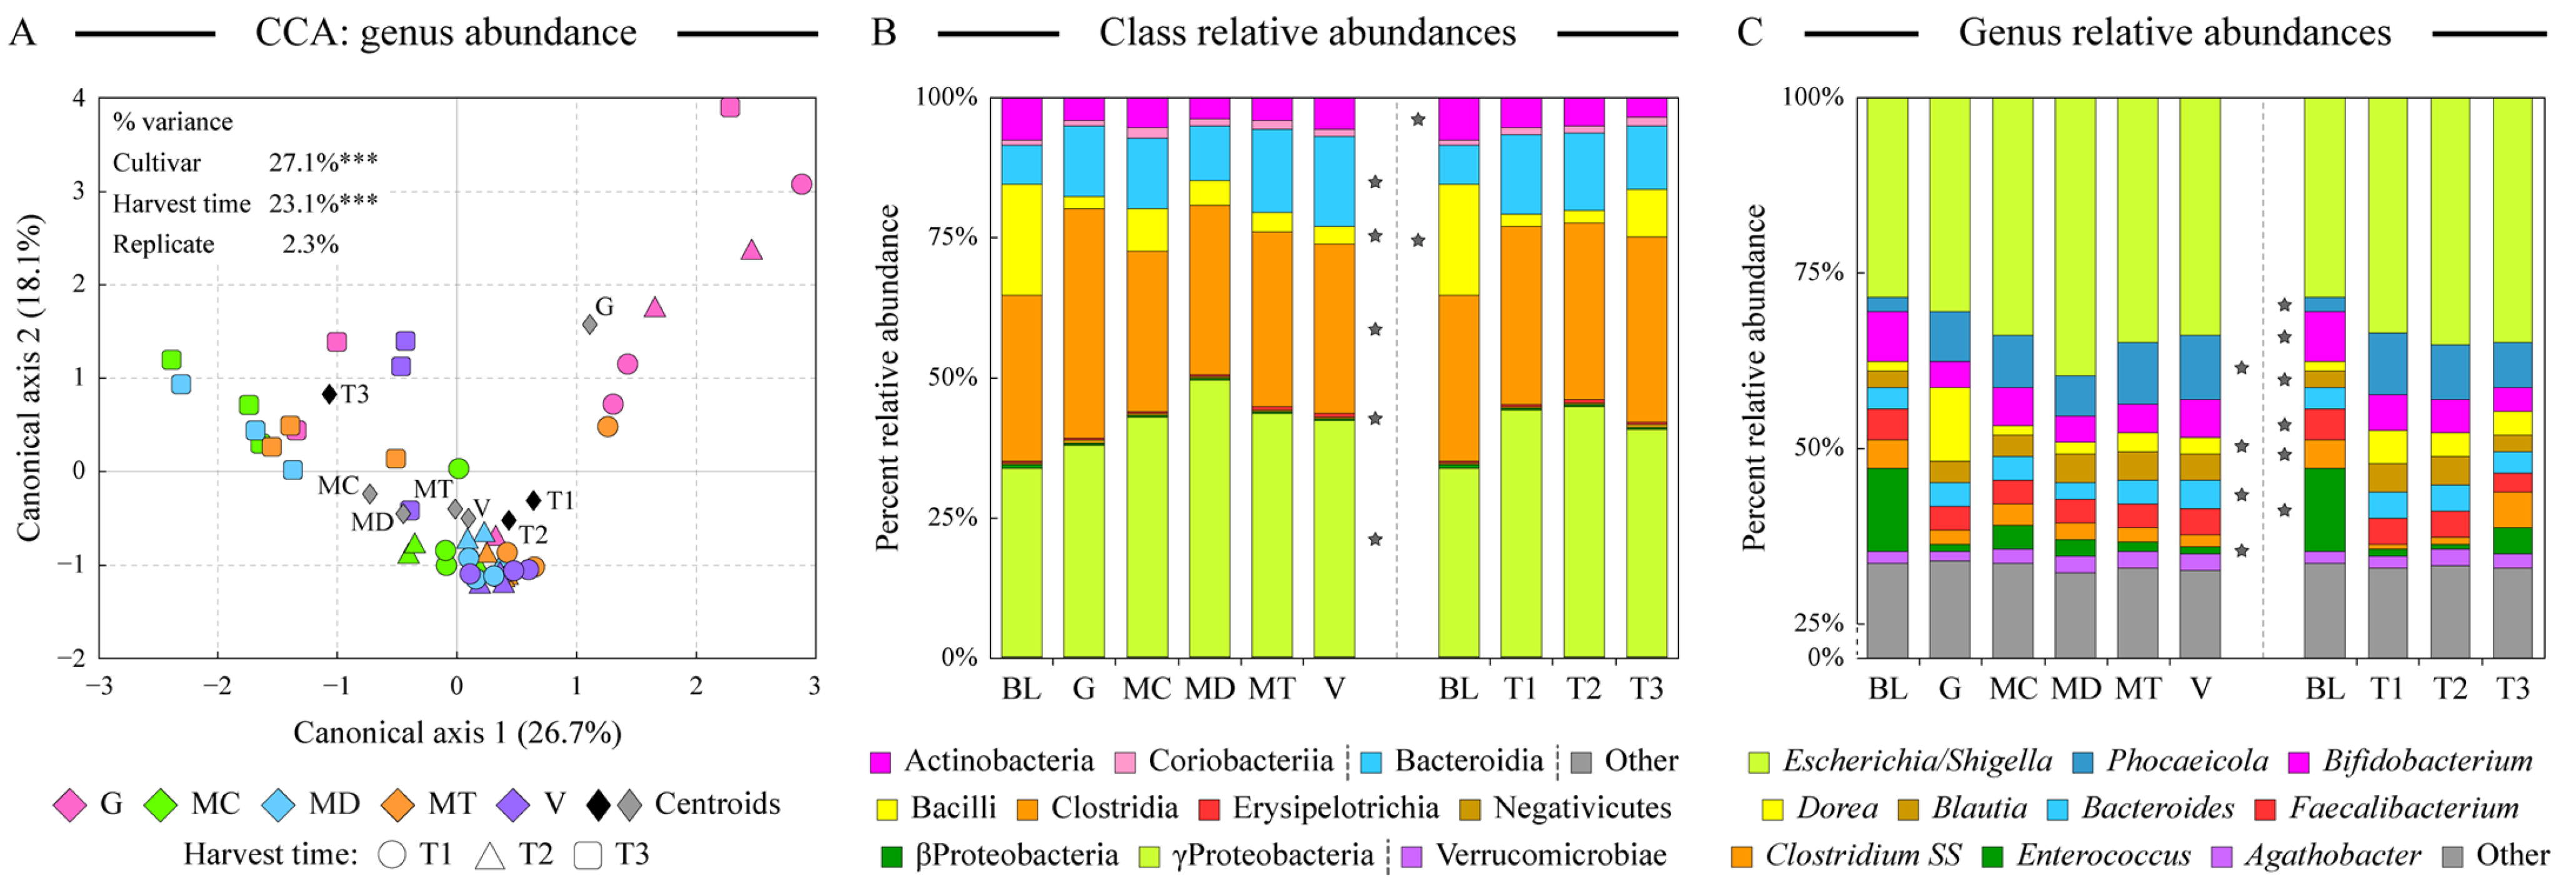
3.3. Microbiota Community Structure Supported by Fermentation of Digested Almond Samples
We used the 16S rRNA gene amplicon sequencing to obtain profiles of human fecal microbial communities maintained on the digested almond samples. Ordination analyses indicated that the microbiota community structure overlapped among different cultivars and harvest time samples with few notable exceptions (Figure 3A). The microbiota community supported by the fermentation of the Guara almond cultivar was the most distinct among cultivars; many of the late-harvesting-time (T3) samples also clustered together. Both the cultivar and the harvest time had statistically significant contributions to the overall microbiota abundance dataset variance, as revealed by the constrained CCA analysis (Figure 3A). All communities were dominated by the genus Escherichia/Shigella in class Gammaproteobacteria, likely indicating the presence of residual oxygen in the fermentation vessels. An abundance of the genus Phocaeicola (formerly members of the Bacteroides genus, class Bacteroidia) was supported by all almond samples in comparison with blanks. Blank samples, on the other hand, maintained the genus Enteroccus. Examining the distribution of microbial classes and abundant genera among sample types, Guara almond fermentation expanded the abundance of the genus Dorea (see Figure 3B,C), known for its ability to degrade dietary fiber [53]. Considering differences among various harvesting times, T3 samples were significantly more abundant in the microbial phylotypes assigned to Clostridium sensus stricto (SS). Earlier harvesting time promoted a higher abundance of Blautia members (Figure 3C). Despite the presence of large amounts of unsaturated fatty acids in almond seeds, we have not detected appreciable amounts of previously noted “lipophilic” microbial genera such as Bilophila and Alistipes [54] in the fermented almond samples. The abundance of Gammaproteobacteria, another “lipophilic” taxon, did increase in the presence of digested almonds (Figure 3B).
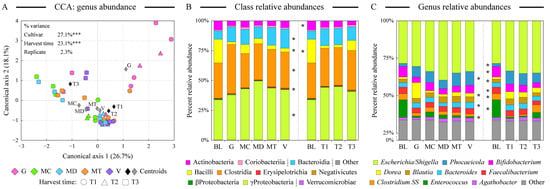
Figure 3.
Comparison of microbiota composition among fermented samples. Similarity of microbial communities at the genus taxonomic level among all almond-fermented samples was assessed by the constrained canonical correspondence analysis (CCA, panel (A)). The percentage of total dataset variance explained by each axis is shown in parentheses. The relative contribution of explanatory variables to the overall variance of the dataset is shown with *** denoting p < 0.001. Panels (B,C) display the relative microbial abundances among sample types at the class (panel (B)) and genus (panel (C)) levels. Classes are ordered based on their phylum assignment; genera are ordered by the average abundance among all samples. Note the compression of the Y axis between 0% and 25% relative abundance values in panel (C). Star denotes the statistically significant difference (at α = 0.01 level) in the taxon abundance among sample groups as calculated by the analysis of variance algorithm. Abbreviations are as follows: G (Guara), MC (Marcona), MD (Marinada), MT (Marta), V (Vairo), BL (fermentation blank).
We used a logistic regression algorithm to determine whether microbial communities can be classified into distinct classes based on either almond cultivar or harvest time. The classification procedure generated models predicting the classification of each sample based on its microbial composition, and the outcome of this analysis is shown in Figure 4A. Consistent with ordination analysis described above, the Guara cultivar together with Marinada was predicted the best among cultivars. Among harvest time classes, the late-harvested samples (T3) were the only class with great classification (93.3% correct prediction’ area under the curve score of 0.950). Due to the applied Lasso regularization, only a handful of microbial genera designated each class, as displayed in the lists in Figure 4A. The abundance of Dorea, which defined the microbiota of the fermented Guara cultivar, is highlighted on the weighted UniFrac-based PCoA plot shown in Figure 4B. Similarly, Clostridium SS abundance, defining the T3 sample type, is overlaid onto the same PCoA plot in Figure 4C. The abundance of the genus Erwinia (class Gammaproteobacteria) was found to differ among all three harvest types—it had an average relative abundance of 0.61% in T1 samples; 0.48% abundance in T2 samples, and 0.14% in T3 samples.
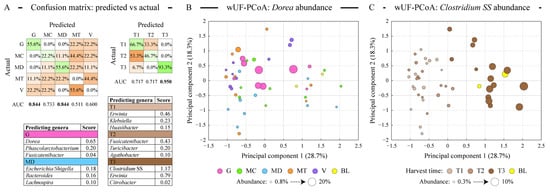
Figure 4.
Modeling the differences in the microbiota profiles among sample types. Panel (A) displays the results of logistic regression (LR) based discriminant analysis of sample types. Separate models were generated for the microbiota distribution among the almond variety sample types and among the almond maturity sample types as shown. Confusion matrices reveal the concordance of the predicted vs actual class labels of all profiled samples, displayed as proportions of actual class labels assigned by the LR classifier to different classes. Green background highlights the correct prediction and orange background—misclassified cases. Area under the curve (AUC) values (range 0–1) illustrate the performance of each LR classifier. The top three genera predicting sample classes with high AUC values are shown in the tables; higher score represents higher contribution of the relative abundance of that genus to the classification model. Panels (B,C) depict the distribution of all samples in the weighted UniFrac distance-based principal coordinates analysis (PCoA). The percentage of total dataset variance explained by each axis is shown in parentheses. The size of each circle is proportionate to either Dorea (panel (B)) or Clostridium sensus stricto (SS, panel (C)) relative abundance in the corresponding sample as shown in the panel legend. Abbreviations are as follows: G (Guara), MC (Marcona), MD (Marinada), MT (Marta), V (Vairo), BL (fermentation blank).
3.4. Phenolic Compounds, SCFAs and Lactic and Succinic Acids Measured after In Vitro Digestion and Fermentation
3.4.1. Phenolic Compounds
In the analysis of the influence of the cultivar on the concentrations of individual phenolic compounds (Table 2), we observed significant differences among the cultivars for the concentration of (-)-epicatechin, (-)-epigallocatechin, ferulic acid, p-coumaric acid, rutin, 3-(3,4-dihydroxyphenyl)propionic acid, 3-(3-hydroxyphenyl)propionic acid, 5-(3′,4′-dihydroxyphenyl)-γ-valerolactone, phloroglucinol and urolithin B. The total concentration of individual phenolic compounds did not vary significantly among cultivars, similar to our results for the total phenolic content measured by the Folin–Ciocalteu assay. However, it is worth noting that the cultivar with the highest phenolic compound concentration was Guara. Other studies have reported variations in the individual profile of phenolic compounds among cultivars, with the extent of variation depending on the almond’s origin [47]. In Spanish cultivars, Marcona and Guara almond skin extracts reported differences regarding individual phenolic concentrations. Guara had higher concentrations of (+)-catechin, (-)-epicatechin and naringin compared to Marcona, while Marcona had higher concentrations of naringenin than Guara [50].
Table 2.
Phenolic compound concentrations (mg/kg) of five almond cultivars submitted to in vitro digestion-fermentation.
From the 18 phenolic compounds quantified in our study, 10 were phenolic compounds naturally found in almonds. Their order of abundance was, from highest to lowest: (+)-catechin, rutin, (-)-epicatechin, quercetin, (-)-epigallocatechin, kaempferol, naringenin, p-coumaric acid, ferulic acid, and naringin. The order of abundance of these phenolic compounds in almonds is similar to that reported in a review that brings together data from 61 studies [2]. Our results are generally within the ranges reported in that review, although we found some of the compounds at higher concentrations. This could be attributed to the increase in the bioaccessibility of phenolic compounds during in vitro fermentation, since a large proportion of these phenolic compounds are associated with dietary fiber, which remains intact after digestion and becomes a substrate for the gut microbiota that releases the bound phenolic compounds.
Harvest time did not have a significant impact on the concentration of 13 out of the 18 phenolic compounds analyzed (Table 3). Nevertheless, the concentrations of (-)-epigallocatechin, quercetin, and phenol exhibited a significant decrease over time, while the concentration of naringenin significantly increased. The total concentration of individual phenolic compounds showed no significant variation among harvest times but displayed a tendency to decrease. From T1 to T3, 13 phenolic compounds decreased their content, while 3 of them increased and 2 remained stable. The decrease in phenolic compound concentrations over time does not align with the significant increase observed in the total phenolic content determined by the Folin–Ciocalteu assay. This discrepancy may arise from factors such as not measuring the concentrations of all almond phenolic compounds or the reactivity of the Folin–Ciocalteu reagent with non-phenolic reducing compounds [55].
Table 3.
Phenolic compound concentrations (mg/kg) of almonds collected at three harvest times and submitted to an in vitro digestion-fermentation.
To the best of our knowledge, there are no studies evaluating the evolution of the individual phenolic profile of almonds during maturation. For other fruits, such as figs, the concentration of individual phenolic compounds decreased from T1 to T3 for 6 out of the 10 compounds determined [56]. In another study [57], the total concentration of individual phenolics decreased in various apple cultivars during ripening, although the trends were not consistent across all cultivars. Furthermore, it has been demonstrated that some in vitro functional properties of vegetables vary with harvest time, with hops showing higher phenolic content and functional properties in the early harvests due to modifications in the profile of phenolic compounds [58].
We also identified eight microbial phenolic metabolites, listed in order from highest to lowest concentrations: 5-(3′,4′)-dihydroxyphenyl-γ-valerolactone, phloroglucinol, 3-(3,4-dihydroxyphenyl)propionic acid, 3,4-dihydroxyphenylacetic acid, 3-(3-hydroxyphenyl)propionic acid, phenol, urolithin A, and urolithin B. This follows the trend of abundance reported by a clinical study [19] that measured phenolic microbial metabolites in urine after the ingestion of an almond skin extract. The most abundant metabolite, 5-(3′,4′-dihydroxyphenyl)-γ-valerolactone, could be a marker of the transformation of almond flavan-3-ols and proanthocyanidins. Moreover, 3-(3,4-Dihydroxyphenyl)propionic acid, 3-(3-hydroxyphenyl)propionic acid, and 3,4-dihydroxyphenylacetic acid are also metabolites of flavan-3-ols, as well as of flavonols, flavones, flavanones, and hydroxycinnamic acids. Phloroglucinol is a metabolite arising from the metabolization by the gut microbiota of a diverse group of phenolic compounds, among which we find flavonols, flavones, flavanones, flavan-3-ols, isoflavones, and anthocyanins. Phenol is one of the simplest metabolites that can be derived from the degradation of the parent phenolic compounds by the intestinal microbiota. Urolithins A and B are produced by the transformation of ellagic acid, a compound present in ellagitannins [59,60].
3.4.2. SCFAs, Lactic and Succinic Acids
We observed significant differences in propionic, butyric, and succinic acid content among maturation stages, with their levels increasing from T1 to T3 (Table 4). The amount of acetic and lactic acids also increased from T1 to T3, but the differences were not statistically significant. Furthermore, the total SCFA content did not vary significantly among harvest times, although there was a slight increase as nuts matured. This suggests that T3 is the optimal time to harvest almonds, as it produces the highest SCFA concentrations upon gut microbiota fermentation. This could be attributed to T3 being the time when almonds have accumulated the highest fiber content (probably due to moisture loss), serving as a substrate for SCFA production. It has been demonstrated that almonds are a rich source of total dietary fiber and soluble dietary fiber [23], and that levels of almond neutral detergent fiber increase with fruit development [43]. These results could explain the increase in total SCFAs over time seen in our study.
Table 4.
SCFAs, lactic and succinic acids concentrations (mM) of five almond cultivars collected at three harvest times and submitted to in vitro digestion-fermentation.
We also detected significant differences when comparing SCFA production among cultivars (Table 4). Vairo and Marcona cultivars had the highest content of lactic and succinic acids, respectively. In contrast, Guara exhibited the highest total SCFAs and acetic, propionic, and butyric acid levels. This could be attributed to Guara having the highest fiber content, matching the results of supported microbiota community analysis described above. In a study comparing three apple cultivars [61], the cultivar with the highest total and soluble dietary fiber content reported the highest total SCFAs compared to the rest. These findings suggest that Guara might be the best cultivar choice due to its higher proportion of beneficial SCFAs and lower lactic and succinic acid levels, which are intermediates in metabolic pathways and whose effects on health are not yet fully understood.
To the best of our knowledge, no studies have evaluated the production of SCFAs and lactic and succinic acids following the in vitro digestion and fermentation of almonds for the purpose of comparing different cultivars and harvest times. The studies available in the literature primarily focus on whether almond consumption in vitro or in vivo could be beneficial in terms of SCFA production. Previous studies on the in vitro digestion and fermentation of almonds have assessed SCFA production using different approaches. Some studies have compared the SCFA production of various nuts and have consistently ranked almonds as a significant source, placing them second out of five [62], first out of five [63], first out of six [24] and third out of five [23] among the nuts studied. Another study observed a substantial production of butyrate following an in vitro digestion and fermentation of finely ground almonds, which could be attributed to the disruption of cell wall fibers and increased bioaccessibility [22]. On the other hand, in vivo studies have not found substantial differences after the consumption of almonds in terms of SCFA production [20,21]. However, there is a need for more clinical studies to further explore the benefits of almond consumption [64].
4. Conclusions
This work confirms the influence of the cultivar and harvest time on some morphological and nutritional characteristics of almonds. Cultivar type had a significant impact on length, width and thickness, but not on moisture, protein and ash content. Width, thickness and moisture content significantly decreased over time, while the protein and ash increased. The total antioxidant capacity released by almonds after an in vitro digestion and fermentation process had different trends: total phenolic content measured by the Folin–Ciocalteu assay significantly increased over time, while TEACABTS, TEACFRAP and TEACDPPH remained unaffected. Nevertheless, we reported significant differences for TEACFRAP and TEACDPPH among cultivars. The fermentation step contributed more to the total antioxidant capacity of almonds than the digestion step. The concentration of individual phenolic compounds was influenced more significantly by cultivar type than by harvest time. The same behavior was observed with total SCFAs. Nevertheless, neither cultivar nor harvest time had a significant impact on the total concentration of individual phenolic compounds.
The Guara cultivar showed the best nutritional profile, primarily due to its high levels of ash, protein, total SCFAs, TEACFRAP, TEACDPPH, total phenolic content measured by the Folin–Ciocalteu assay, and total concentration of individual phenolic compounds. In addition, the best harvest time was T3, characterized by a higher total phenolic content measured by the Folin–Ciocalteu assay along with increased ash, protein, total SCFAs, and reduced moisture. Consistent with these findings, the Guara cultivar and T3 harvest time supported human-derived gut microbial communities distinct from the rest of the almond samples.
Supplementary Materials
The following supporting information can be downloaded at: https://www.mdpi.com/article/10.3390/antiox13010084/s1, Table S1: Morphological measurements of almonds collected at three harvest times and subjected to in vitro digestion-fermentation; Table S2: Morphological measurements of five almond cultivars subjected to in vitro digestion-fermentation; Table S3: Ash, moisture and protein content of five almond cultivars subjected to in vitro digestion-fermentation; Table S4: Ash, moisture and protein content of almonds collected at three harvest times and subjected to in vitro digestion-fermentation; Table S5: Total antioxidant capacity of almonds collected at three harvest times and subjected to in vitro digestion-fermentation; Table S6: Total antioxidant capacity of five almond cultivars subjected to in vitro digestion-fermentation.
Author Contributions
Conceptualization, S.P.-B. and J.Á.R.-H.; methodology, A.D.-O., D.H.-N. and Á.T.-M.; formal analysis, A.D.-O., B.N.-P., Á.T.-M., S.P.-B. and O.P.; investigation, D.H.-N., S.P.d.l.C., O.P. and J.Á.R.-H.; resources, O.P. and J.Á.R.-H.; data curation, S.P.-B. and B.N.-P.; writing—original draft preparation, A.D.-O.; writing—review and editing, S.P.-B., S.P.d.l.C., O.P. and J.Á.R.-H.; supervision, J.Á.R.-H.; funding acquisition, J.Á.R.-H. and O.P. All authors have read and agreed to the published version of the manuscript.
Funding
This work was supported by the Plan propio de Investigación y Transferencia of the University of Granada under the program “Intensificación de la Investigación, modalidad B” and by the National Science Foundation award DBI-1335772.
Institutional Review Board Statement
The study was conducted according to the guidelines of the Declaration of Helsinki. It was approved by the Ethics Committee of the University of Granada (protocol code 1080/CEIH/2020).
Informed Consent Statement
Informed consent was obtained from all fecal donors involved in the study.
Data Availability Statement
Data are available to other researchers upon request to the corresponding authors (J.Á.R.-H.).
Acknowledgments
The authors thank the support of the Unit of Excellence ‘UNETE’ from the University of Granada (reference UCE-PP2017-05). This work is part of Adriana Delgado-Osorio’s doctoral thesis, carried out as part of the “Nutrition and Food Sciences Programme” at the University of Granada. We also thank Gary Kash for his assistance with DNA amplification experiments.
Conflicts of Interest
The authors declare no conflicts of interest.
References
- Barreca, D.; Nabavi, S.M.; Sureda, A.; Rasekhian, M.; Raciti, R.; Silva, A.S.; Annunziata, G.; Arnone, A.; Tenore, G.C.; Süntar, İ.; et al. Almonds (Prunus dulcis Mill. D. A. Webb): A Source of Nutrients and Health-Promoting Compounds. Nutrients 2020, 12, 672. [Google Scholar] [CrossRef]
- Bolling, B.W. Almond Polyphenols: Methods of Analysis, Contribution to Food Quality, and Health Promotion. Compr. Rev. Food Sci. Food Saf. 2017, 16, 346–368. [Google Scholar] [CrossRef]
- Musarra-Pizzo, M.; Ginestra, G.; Smeriglio, A.; Pennisi, R.; Sciortino, M.T.; Mandalari, G. The Antimicrobial and Antiviral Activity of Polyphenols from Almond (Prunus dulcis L.) Skin. Nutrients 2019, 11, 2355. [Google Scholar] [CrossRef]
- Özcan, M.M. A Review on Some Properties of Almond: Impact of Processing, Fatty Acids, Polyphenols, Nutrients, Bioactive Properties, and Health Aspects. J. Food Sci. Technol. 2023, 60, 1493–1504. [Google Scholar] [CrossRef]
- Matthäus, B.; Özcan, M.M.; Juhaimi, F.A.; Adiamo, O.Q.; Alsawmahi, O.N.; Ghafoor, K.; Babiker, E.E. Effect of the Harvest Time on Oil Yield, Fatty Acid, Tocopherol and Sterol Contents of Developing Almond and Walnut Kernels. J. Oleo Sci. 2018, 67, 39–45. [Google Scholar] [CrossRef]
- Özcan, M.M.; Lemiasheuski, V. The Effect of Harvest Times on Mineral Contents of Almond and Walnut Kernels. Erwerbs-Obstbau 2020, 62, 455–458. [Google Scholar] [CrossRef]
- Özcan, M.M.; Uslu, N. Effect of Variety on Bioactive Properties, Phytochemicals and Nutrients of Almond Kernels. Erwerbs-Obstbau 2023, 65, 981–988. [Google Scholar] [CrossRef]
- Piscopo, A.; Romeo, F.V.; Petrovicova, B.; Poiana, M. Effect of the Harvest Time on Kernel Quality of Several Almond Varieties (Prunus dulcis (Mill.) D.A. Webb). Sci. Hortic. 2010, 125, 41–46. [Google Scholar] [CrossRef]
- Beltrán Sanahuja, A.; Maestre Pérez, S.E.; Grané Teruel, N.; Valdés García, A.; Prats Moya, M.S. Variability of Chemical Profile in Almonds (Prunus dulcis) of Different Cultivars and Origins. Foods 2021, 10, 153. [Google Scholar] [CrossRef] [PubMed]
- Summo, C.; Palasciano, M.; De Angelis, D.; Paradiso, V.M.; Caponio, F.; Pasqualone, A. Evaluation of the Chemical and Nutritional Characteristics of Almonds (Prunus dulcis (Mill). D.A. Webb) as Influenced by Harvest Time and Cultivar. J. Sci. Food Agric. 2018, 98, 5647–5655. [Google Scholar] [CrossRef] [PubMed]
- Santos, D.I.; Saraiva, J.M.A.; Vicente, A.A.; Moldão-Martins, M. 2–Methods for Determining Bioavailability and Bioaccessibility of Bioactive Compounds and Nutrients. In Innovative Thermal and Non-Thermal Processing, Bioaccessibility and Bioavailability of Nutrients and Bioactive Compounds; Barba, F.J., Saraiva, J.M.A., Cravotto, G., Lorenzo, J.M., Eds.; Woodhead Publishing Series in Food Science, Technology and Nutrition; Woodhead Publishing: Sawston, UK, 2019; pp. 23–54. ISBN 978-0-12-814174-8. [Google Scholar]
- Thomson, C.; Garcia, A.L.; Edwards, C.A. Interactions between Dietary Fibre and the Gut Microbiota. Proc. Nutr. Soc. 2021, 80, 398–408. [Google Scholar] [CrossRef]
- Campos-Perez, W.; Martinez-Lopez, E. Effects of Short Chain Fatty Acids on Metabolic and Inflammatory Processes in Human Health. Biochim. Biophys. Acta (BBA)—Mol. Cell Biol. Lipids 2021, 1866, 158900. [Google Scholar] [CrossRef]
- Cortés-Martín, A.; Selma, M.V.; Tomás-Barberán, F.A.; González-Sarrías, A.; Espín, J.C. Where to Look into the Puzzle of Polyphenols and Health? The Postbiotics and Gut Microbiota Associated with Human Metabotypes. Mol. Nutr. Food Res. 2020, 64, 1900952. [Google Scholar] [CrossRef]
- Fernández-Veledo, S.; Vendrell, J. Gut Microbiota-Derived Succinate: Friend or Foe in Human Metabolic Diseases? Rev. Endocr. Metab. Disord. 2019, 20, 439–447. [Google Scholar] [CrossRef]
- Navajas-Porras, B.; Pérez-Burillo, S.; Valverde-Moya, Á.J.; Hinojosa-Nogueira, D.; Pastoriza, S.; Rufián-Henares, J.Á. Effect of Cooking Methods on the Antioxidant Capacity of Plant Foods Submitted to In Vitro Digestion–Fermentation. Antioxidants 2020, 9, 1312. [Google Scholar] [CrossRef]
- Garrido, I.; Urpi-Sarda, M.; Monagas, M.; Gómez-Cordovés, C.; Martín-álvarez, P.J.; Llorach, R.; Bartolomé, B.; Andrés-Lacueva, C. Targeted Analysis of Conjugated and Microbial-Derived Phenolic Metabolites in Human Urine After Consumption of an Almond Skin Phenolic Extract. J. Nutr. 2010, 140, 1799–1807. [Google Scholar] [CrossRef]
- Llorach, R.; Garrido, I.; Monagas, M.; Urpi-Sarda, M.; Tulipani, S.; Bartolome, B.; Andres-Lacueva, C. Metabolomics Study of Human Urinary Metabolome Modifications After Intake of Almond (Prunus dulcis (Mill.) D.A. Webb) Skin Polyphenols. J. Proteome Res. 2010, 9, 5859–5867. [Google Scholar] [CrossRef]
- Urpi-Sarda, M.; Garrido, I.; Monagas, M.; Gómez-Cordovés, C.; Medina-Remón, A.; Andres-Lacueva, C.; Bartolomé, B. Profile of Plasma and Urine Metabolites after the Intake of Almond [Prunus dulcis (Mill.) D.A. Webb] Polyphenols in Humans. J. Agric. Food Chem. 2009, 57, 10134–10142. [Google Scholar] [CrossRef]
- Choo, J.M.; Tran, C.D.; Luscombe-Marsh, N.D.; Stonehouse, W.; Bowen, J.; Johnson, N.; Thompson, C.H.; Watson, E.-J.; Brinkworth, G.D.; Rogers, G.B. Almond Consumption Affects Fecal Microbiota Composition, Stool pH, and Stool Moisture in Overweight and Obese Adults with Elevated Fasting Blood Glucose: A Randomized Controlled Trial. Nutr. Res. 2021, 85, 47–59. [Google Scholar] [CrossRef] [PubMed]
- Creedon, A.C.; Dimidi, E.; Hung, E.S.; Rossi, M.; Probert, C.; Grassby, T.; Miguens-Blanco, J.; Marchesi, J.R.; Scott, S.M.; Berry, S.E.; et al. The Impact of Almonds and Almond Processing on Gastrointestinal Physiology, Luminal Microbiology, and Gastrointestinal Symptoms: A Randomized Controlled Trial and Mastication Study. Am. J. Clin. Nutr. 2022, 116, 1790–1804. [Google Scholar] [CrossRef] [PubMed]
- Mandalari, G.; Nueno-Palop, C.; Bisignano, G.; Wickham, M.S.J.; Narbad, A. Potential Prebiotic Properties of Almond (Amygdalus communis L.) Seeds. Appl. Environ. Microbiol. 2008, 74, 4264–4270. [Google Scholar] [CrossRef]
- Şahin, M.; Arioglu-Tuncil, S.; Ünver, A.; Deemer, D.; Lindemann, S.R.; Tunçil, Y.E. Dietary Fibers of Tree Nuts Differ in Composition and Distinctly Impact the Fecal Microbiota and Metabolic Outcomes In Vitro. J. Agric. Food Chem. 2023, 71, 9762–9771. [Google Scholar] [CrossRef]
- Li, M.; Lu, P.; Wu, H.; de Souza, T.S.P.; Suleria, H.A.R. In Vitro Digestion and Colonic Fermentation of Phenolic Compounds and Their Bioaccessibility from Raw and Roasted Nut Kernels. Food Funct. 2023, 14, 2727–2739. [Google Scholar] [CrossRef] [PubMed]
- Pérez-Burillo, S.; Rufián-Henares, J.A.; Pastoriza, S. Towards an Improved Global Antioxidant Response Method (GAR+): Physiological-Resembling in Vitro Digestion-Fermentation Method. Food Chem. 2018, 239, 1253–1262. [Google Scholar] [CrossRef] [PubMed]
- Pérez-Burillo, S.; Molino, S.; Navajas-Porras, B.; Valverde-Moya, Á.J.; Hinojosa-Nogueira, D.; López-Maldonado, A.; Pastoriza, S.; Rufián-Henares, J.Á. An in Vitro Batch Fermentation Protocol for Studying the Contribution of Food to Gut Microbiota Composition and Functionality. Nat. Protoc. 2021, 16, 3186–3209. [Google Scholar] [CrossRef]
- Re, R.; Pellegrini, N.; Proteggente, A.; Pannala, A.; Yang, M.; Rice-Evans, C. Antioxidant Activity Applying an Improved ABTS Radical Cation Decolorization Assay. Free Radic. Biol. Med. 1999, 26, 1231–1237. [Google Scholar] [CrossRef]
- Benzie, I.F.F.; Strain, J.J. The Ferric Reducing Ability of Plasma (FRAP) as a Measure of “Antioxidant Power”: The FRAP Assay. Anal. Biochem. 1996, 239, 70–76. [Google Scholar] [CrossRef]
- Yen, G.-C.; Chen, H.-Y. Antioxidant Activity of Various Tea Extracts in Relation to Their Antimutagenicity. J. Agric. Food Chem. 1995, 43, 27–32. [Google Scholar] [CrossRef]
- Singleton, V.L.; Rossi, J.A. Colorimetry of Total Phenolics with Phosphomolybdic-Phosphotungstic Acid Reagents. Am. J. Enol. Vitic. 1965, 16, 144–158. [Google Scholar] [CrossRef]
- Muñoz, A.E.; Álvarez, M.B.; Oliveras-López, M.-J.; Martínez, R.G.; Henares, J.Á.R.; Herrera, M.O. Determination of Polyphenolic Compounds by Ultra-Performance Liquid Chromatography Coupled to Tandem Mass Spectrometry and Antioxidant Capacity of Spanish Subtropical Fruits. Agric. Sci. 2018, 9, 180–199. [Google Scholar] [CrossRef]
- Panzella, L.; Pérez-Burillo, S.; Pastoriza, S.; Martín, M.Á.; Cerruti, P.; Goya, L.; Ramos, S.; Rufián-Henares, J.Á.; Napolitano, A.; d’Ischia, M. High Antioxidant Action and Prebiotic Activity of Hydrolyzed Spent Coffee Grounds (HSCG) in a Simulated Digestion–Fermentation Model: Toward the Development of a Novel Food Supplement. J. Agric. Food Chem. 2017, 65, 6452–6459. [Google Scholar] [CrossRef]
- Paliy, O.; Foy, B.D. Mathematical Modeling of 16S Ribosomal DNA Amplification Reveals Optimal Conditions for the Interrogation of Complex Microbial Communities with Phylogenetic Microarrays. Bioinformatics 2011, 27, 2134–2140. [Google Scholar] [CrossRef] [PubMed]
- Caporaso, J.G.; Kuczynski, J.; Stombaugh, J.; Bittinger, K.; Bushman, F.D.; Costello, E.K.; Fierer, N.; Peña, A.G.; Goodrich, J.K.; Gordon, J.I.; et al. QIIME Allows Analysis of High-Throughput Community Sequencing Data. Nat. Methods 2010, 7, 335–336. [Google Scholar] [CrossRef] [PubMed]
- Rajakaruna, S.; Freedman, D.A.; Sehgal, A.R.; Bui, X.; Paliy, O. Diet Quality and Body Mass Indices Show Opposite Associations with Distal Gut Microbiota in a Low-Income Cohort. SDRP-JFST 2019, 4, 846–851. [Google Scholar] [CrossRef]
- Paliy, O.; Shankar, V. Application of Multivariate Statistical Techniques in Microbial Ecology. Mol. Ecol. 2016, 25, 1032–1057. [Google Scholar] [CrossRef]
- Craig, M.P.; Rajakaruna, S.; Paliy, O.; Sajjad, M.; Madhavan, S.; Reddy, N.; Zhang, J.; Bottomley, M.; Agrawal, S.; Kadakia, M.P. Differential MicroRNA Signatures in the Pathogenesis of Barrett’s Esophagus. Clin. Transl. Gastroenterol. 2020, 11, e00125. [Google Scholar] [CrossRef] [PubMed]
- Pérez-Sánchez, R.; Morales-Corts, M.R. Agromorphological Characterization and Nutritional Value of Traditional Almond Cultivars Grown in the Central-Western Iberian Peninsula. Agronomy 2021, 11, 1238. [Google Scholar] [CrossRef]
- Cherif, A.; Sebei, K.; Boukhchina, S.; Kallel, H.; Belkacemi, K.; Arul, J. Kernel Fatty Acid and Triacylglycerol Composition for Three Almond Cultivars during Maturation. J. Am. Oil Chem. Soc. 2004, 81, 901–905. [Google Scholar] [CrossRef]
- Egea, G.; González-Real, M.M.; Baille, A.; Nortes, P.A.; Sánchez-Bel, P.; Domingo, R. The Effects of Contrasted Deficit Irrigation Strategies on the Fruit Growth and Kernel Quality of Mature Almond Trees. Agric. Water Manag. 2009, 96, 1605–1614. [Google Scholar] [CrossRef]
- Kazantzis, I.; Nanos, G.D.; Stavroulakis, G.G. Effect of Harvest Time and Storage Conditions on Almond Kernel Oil and Sugar Composition. J. Sci. Food Agric. 2003, 83, 354–359. [Google Scholar] [CrossRef]
- Nanos, G.D.; Kazantzis, I.; Kefalas, P.; Petrakis, C.; Stavroulakis, G.G. Irrigation and Harvest Time Affect Almond Kernel Quality and Composition. Sci. Hortic. 2002, 96, 249–256. [Google Scholar] [CrossRef]
- Soler, L.; Canellas, J.; Saura-Calixto, F. Changes in Carbohydrate and Protein Content and Composition of Developing Almond Seeds. J. Agric. Food Chem. 1989, 37, 1400–1404. [Google Scholar] [CrossRef]
- Hawker, J.S.; Buttrose, M.S. Development of the Almond Nut (Prunus dulcis (Mill.) D. A. Webb). Anatomy and Chemical Composition of Fruit Parts from Anthesis to Maturity. Ann. Bot. 1980, 46, 313–321. [Google Scholar] [CrossRef]
- Levent, O. A Detailed Comparative Study on Some Physicochemical Properties, Volatile Composition, Fatty Acid, and Mineral Profile of Different Almond (Prunus dulcis L.) Varieties. Horticulturae 2022, 8, 488. [Google Scholar] [CrossRef]
- Barreira, J.C.M.; Ferreira, I.C.F.R.; Oliveira, M.B.P.P.; Pereira, J.A. Antioxidant Activity and Bioactive Compounds of Ten Portuguese Regional and Commercial Almond Cultivars. Food Chem. Toxicol. 2008, 46, 2230–2235. [Google Scholar] [CrossRef] [PubMed]
- Bolling, B.W.; Dolnikowski, G.; Blumberg, J.B.; Chen, C.-Y.O. Polyphenol Content and Antioxidant Activity of California Almonds Depend on Cultivar and Harvest Year. Food Chem. 2010, 122, 819–825. [Google Scholar] [CrossRef] [PubMed]
- Oliveira, I.; Meyer, A.S.; Afonso, S.; Aires, A.; Goufo, P.; Trindade, H.; Gonçalves, B. Phenolic and Fatty Acid Profiles, α-Tocopherol and Sucrose Contents, and Antioxidant Capacities of Understudied Portuguese Almond Cultivars. J. Food Biochem. 2019, 43, e12887. [Google Scholar] [CrossRef] [PubMed]
- Maestri, D.; Martínez, M.; Bodoira, R.; Rossi, Y.; Oviedo, A.; Pierantozzi, P.; Torres, M. Variability in Almond Oil Chemical Traits from Traditional Cultivars and Native Genetic Resources from Argentina. Food Chem. 2015, 170, 55–61. [Google Scholar] [CrossRef]
- Valdés, A.; Vidal, L.; Beltrán, A.; Canals, A.; Garrigós, M.C. Microwave-Assisted Extraction of Phenolic Compounds from Almond Skin Byproducts (Prunus amygdalus): A Multivariate Analysis Approach. J. Agric. Food Chem. 2015, 63, 5395–5402. [Google Scholar] [CrossRef]
- Duarte, S.; Puchades, A.; Jiménez-Hernández, N.; Betoret, E.; Gosalbes, M.J.; Betoret, N. Almond (Prunus dulcis) Bagasse as a Source of Bioactive Compounds with Antioxidant Properties: An In Vitro Assessment. Antioxidants 2023, 12, 1229. [Google Scholar] [CrossRef]
- Wojtunik-Kulesza, K.; Oniszczuk, A.; Oniszczuk, T.; Combrzyński, M.; Nowakowska, D.; Matwijczuk, A. Influence of In Vitro Digestion on Composition, Bioaccessibility and Antioxidant Activity of Food Polyphenols—A Non-Systematic Review. Nutrients 2020, 12, 1401. [Google Scholar] [CrossRef] [PubMed]
- D’hoe, K.; Conterno, L.; Fava, F.; Falony, G.; Vieira-Silva, S.; Vermeiren, J.; Tuohy, K.; Raes, J. Prebiotic Wheat Bran Fractions Induce Specific Microbiota Changes. Front. Microbiol. 2018, 9, 31. [Google Scholar] [CrossRef] [PubMed]
- Agans, R.; Gordon, A.; Kramer, D.L.; Perez-Burillo, S.; Rufián-Henares, J.A.; Paliy, O. Dietary Fatty Acids Sustain the Growth of the Human Gut Microbiota. Appl. Environ. Microbiol. 2018, 84, e01525-18. [Google Scholar] [CrossRef] [PubMed]
- Sánchez-Rangel, J.C.; Benavides, J.; Heredia, J.B.; Cisneros-Zevallos, L.; Jacobo-Velázquez, D.A. The Folin–Ciocalteu Assay Revisited: Improvement of Its Specificity for Total Phenolic Content Determination. Anal. Methods 2013, 5, 5990–5999. [Google Scholar] [CrossRef]
- Ates, U. Harvest Time Influences Quality Attributes and Phenolic Composition of Fig Fruit: Insights from Physicochemical Analysis and Antioxidant Activity Assessment. Erwerbs-Obstbau 2023, 65, 1627–1632. [Google Scholar] [CrossRef]
- Wojdyło, A.; Oszmiański, J. Antioxidant Activity Modulated by Polyphenol Contents in Apple and Leaves during Fruit Development and Ripening. Antioxidants 2020, 9, 567. [Google Scholar] [CrossRef]
- Inui, T.; Okumura, K.; Matsui, H.; Hosoya, T.; Kumazawa, S. Effect of Harvest Time on Some in Vitro Functional Properties of Hop Polyphenols. Food Chem. 2017, 225, 69–76. [Google Scholar] [CrossRef]
- Rowland, I.; Gibson, G.; Heinken, A.; Scott, K.; Swann, J.; Thiele, I.; Tuohy, K. Gut Microbiota Functions: Metabolism of Nutrients and Other Food Components. Eur. J. Nutr. 2018, 57, 1–24. [Google Scholar] [CrossRef]
- Selma, M.V.; Espín, J.C.; Tomás-Barberán, F.A. Interaction between Phenolics and Gut Microbiota: Role in Human Health. J. Agric. Food Chem. 2009, 57, 6485–6501. [Google Scholar] [CrossRef]
- Koutsos, A.; Lima, M.; Conterno, L.; Gasperotti, M.; Bianchi, M.; Fava, F.; Vrhovsek, U.; Lovegrove, J.A.; Tuohy, K.M. Effects of Commercial Apple Varieties on Human Gut Microbiota Composition and Metabolic Output Using an In Vitro Colonic Model. Nutrients 2017, 9, 533. [Google Scholar] [CrossRef]
- Schlörmann, W.; Birringer, M.; Lochner, A.; Lorkowski, S.; Richter, I.; Rohrer, C.; Glei, M. In Vitro Fermentation of Nuts Results in the Formation of Butyrate and C9,T11 Conjugated Linoleic Acid as Chemopreventive Metabolites. Eur. J. Nutr. 2016, 55, 2063–2073. [Google Scholar] [CrossRef] [PubMed]
- Lux, S.; Scharlau, D.; Schlörmann, W.; Birringer, M.; Glei, M. In Vitro Fermented Nuts Exhibit Chemopreventive Effects in HT29 Colon Cancer Cells. Br. J. Nutr. 2012, 108, 1177–1186. [Google Scholar] [CrossRef] [PubMed]
- Zuelch, M.L.; Radtke, M.D.; Holt, R.R.; Basu, A.; Burton-Freeman, B.; Ferruzzi, M.G.; Li, Z.; Shay, N.F.; Shukitt-Hale, B.; Keen, C.L.; et al. Perspective: Challenges and Future Directions in Clinical Research with Nuts and Berries. Adv. Nutr. 2023, 14, 1005–1028. [Google Scholar] [CrossRef] [PubMed]


Disclaimer/Publisher’s Note: The statements, opinions and data contained in all publications are solely those of the individual author(s) and contributor(s) and not of MDPI and/or the editor(s). MDPI and/or the editor(s) disclaim responsibility for any injury to people or property resulting from any ideas, methods, instructions or products referred to in the content. |
© 2024 by the authors. Licensee MDPI, Basel, Switzerland. This article is an open access article distributed under the terms and conditions of the Creative Commons Attribution (CC BY) license (https://creativecommons.org/licenses/by/4.0/).